Kent Academic Repository - University of Kent · 2018-08-07 · The version in the Kent Academic...
32
Kent Academic Repository Full text document (pdf) Copyright & reuse Content in the Kent Academic Repository is made available for research purposes. Unless otherwise stated all content is protected by copyright and in the absence of an open licence (eg Creative Commons), permissions for further reuse of content should be sought from the publisher, author or other copyright holder. Versions of research The version in the Kent Academic Repository may differ from the final published version. Users are advised to check http://kar.kent.ac.uk for the status of the paper. Users should always cite the published version of record. Enquiries For any further enquiries regarding the licence status of this document, please contact: [email protected] If you believe this document infringes copyright then please contact the KAR admin team with the take-down information provided at http://kar.kent.ac.uk/contact.html Citation for published version Netten, Ann and Darton, Robin and Bebbington, Andrew and Brown, Pamela (2001) Residential or nursing home care? The appropriateness of placement decisions. Ageing and Society, 21 (1). pp. 3-23. ISSN 0144-686X. DOI https://doi.org/10.1017/S0144686X0100808X Link to record in KAR http://kar.kent.ac.uk/802/ Document Version Pre-print
Transcript of Kent Academic Repository - University of Kent · 2018-08-07 · The version in the Kent Academic...
Kent Academic RepositoryFull text document (pdf)
Copyright & reuse
Content in the Kent Academic Repository is made available for research purposes. Unless otherwise stated all
content is protected by copyright and in the absence of an open licence (eg Creative Commons), permissions
for further reuse of content should be sought from the publisher, author or other copyright holder.
Versions of research
The version in the Kent Academic Repository may differ from the final published version.
Users are advised to check http://kar.kent.ac.uk for the status of the paper. Users should always cite the
published version of record.
Enquiries
For any further enquiries regarding the licence status of this document, please contact:
If you believe this document infringes copyright then please contact the KAR admin team with the take-down
information provided at http://kar.kent.ac.uk/contact.html
Citation for published version
Netten, Ann and Darton, Robin and Bebbington, Andrew and Brown, Pamela (2001) Residentialor nursing home care? The appropriateness of placement decisions. Ageing and Society, 21 (1). pp. 3-23. ISSN 0144-686X.
DOI
https://doi.org/10.1017/S0144686X0100808X
Link to record in KAR
http://kar.kent.ac.uk/802/
Document Version
Pre-print

Residential or Nursing Home Care? The
Appropriateness of Placement Decisions
Ann Netten, Robin Darton, Andrew Bebbington
and Pamela Brown
Discussion Paper 1480/2
November 2000 (Corrected December 2000)


Residential or Nursing Home Care? The
Appropriateness of Placement Decisions
Ann Netten, Robin Darton, Andrew Bebbington
and Pamela Brown
Discussion Paper 1480/2 November 2000 (Corrected December 2000)
Address for correspondence:
Ann Netten, Personal Social Services Research Unit, University of Kent at
Canterbury, Canterbury, Kent CT2 7NF
e-mail: [email protected]

To be published in Ageing and Society

Abstract
Routinely-collected statistics show considerable variation between local authorities in Great
Britain, in the proportions of supported residents placed in nursing and residential care. This
raises the question of whether this is due to variations in demand (the type of resident
approaching authorities), supply (the level and type of provision available for local authorities
to purchase), or policy (in terms of eligibility criteria or interpretations of need at field level).
Data were used from a national longitudinal survey of individuals admitted to publicly-funded
residential and nursing home care. Information was collected from 18 local authorities on a
cohort of 2,544 local authority supported residents who had been admitted to residential and
nursing home care. The paper examines the pattern of admissions, the characteristics of people
admitted and the relationship between these characteristics and admissions to residential or
nursing home care. Characteristics of the individual explained the placement of over 80 per
cent of admissions. Supply factors were statistically significant but did not improve the
explanatory power of the model. Survival among those admitted to a type of care that was not
predicted by the model, suggested that some unmeasured aspects of prognosis may account for
some of the residual variation in placements. Overall, the results indicate a reasonably high
level of consistency between authorities in nursing home placement decisions. This suggests
that either there is considerable variation in the types of individual approaching local authorities
or, more likely, that some authorities are more successful in maintaining people for longer at
home than others. In addition to maintaining people at home to a higher level of dependency,
prevention of admission to residential care is likely to be associated with interventions that
address carer support, safety issues among people who are deaf, and motivation.
Key words: old age, residential care, nursing home care, predictors of placement.
Acknowledgements
This survey was funded by the Department of Health. The data collection for the survey was
undertaken by Research Services Limited (now IPSOS-RSL Ltd). We are most grateful to the
staff in the local authorities and to the staff of the residential and nursing homes for providing
the information for the survey. Responsibility for this paper is the authors’ alone, and the views
expressed do not necessarily reflect those of the Department of Health.


1
1. Introduction
Over two-thirds of all residents in care homes for older people are publicly funded (Netten et
al., 1998). Since April 1993, local authorities in Great Britain have been responsible for the
assessment, placement and financing of all adults in publicly-funded residential-based care.
With this responsibility came the requirement to decide, in collaboration with health care staff,
whether individuals would be more appropriately placed in residential or in nursing home care.
The arrangements introduced in April 1993 formed part of the community care reforms
implemented following the 1989 White Paper Caring for People (Cm 849, 1989) and the
National Health Service and Community Care Act 1990. Prior to the implementation of this
Act, there were two principal sources of public financial support for individuals receiving
residential or nursing home care: funding from local authorities and funding from the social
security system. Local authority funded residents were primarily accommodated in homes
managed by local authorities, although some individuals were accommodated in homes run by
voluntary organisations and, to a lesser extent, homes run by private organisations. However,
local authorities were not permitted to make placements in nursing homes. Individuals in
private and voluntary residential homes who were not supported by a local authority and
individuals in nursing homes could apply for support through the social security system.
Although there had been a long-standing policy objective to support people in the community
with home-based care, the availability of social security funds without any assessment of need
was identified as a perverse incentive towards institutional care by the Audit Commission
(1986). Sir Roy Griffiths’ report recommended a more co-ordinated approach to the funding
and management of care, placing the responsibility for the allocation of funds, the assessment
of need and the co-ordination of care with the local authority social services department
(Griffiths, 1988). The majority of the recommendations were accepted by the Government in
the 1989 White Paper (Cm 849, 1989) and were introduced by the 1990 Act.
Under the new arrangements, social security benefits no longer differentiated between
residential and nursing homes, and the cost to local authorities of a nursing home placement
was substantially greater than the cost of a residential placement. Laing and Buisson (1993)
calculated that, in April 1993, the typical net costs to a local authority of a residential and a
nursing home placement for an elderly person living alone were £88 and £183 per week
respectively. Thus the incentives were put in place to encourage authorities to identify the
lowest cost option for caring for people.
2
Local authorities manage their own residential care homes under the National Assistance Act
1948 and, in England and Wales, independent residential care and nursing homes are regulated
under the Registered Homes Act 1984, although this will be superseded by the Care Standards
Act 2000. Local authorities are currently responsible for registering and inspecting
independent residential homes, while health authorities are responsible for registering and
inspecting independent nursing homes. Residential care homes are distinguished from nursing
homes in the 1984 Act as providing board and personal care only, whereas nursing homes are
intended to accommodate patients requiring constant or frequent daily nursing care.
Difficulties in distinguishing between nursing care and personal care and attention were
recognised before the 1984 Act (DHSS, 1982). In order to enable homes to provide both
personal and nursing care, the 1984 Act included a provision for the dual registration of homes.
However, the requirement for registration with both the local authority and the health authority
was seen as bureaucratic, time wasting and costly (Burgner, 1996) and, initially, the growth in
dual registration was slow, although the rate of growth has increased in recent years
(Department of Health, 1999a).
The previous Government suggested combining the separate regulatory responsibilities of local
authorities and health authorities into new local statutory bodies, along the lines suggested by
Burgner, and that residential and nursing homes should be brought together in a single category
(Cm 3588, 1997). Under the Care Standards Act, introduced by the current Government, a
National Care Standards Commission will be established to apply a common set of standards
to care homes, covering both residential and nursing homes. However, the types of services
offered by homes will be at the discretion of the owners (Cm 4169, 1998). The same
regulations and standards will be applied to local authority homes (Department of Health,
1999b).
A major part of the rationale for moving to a single category of home is the overlap between
people entering residential and nursing home care (Burgner, 1996; Cm 3588, 1997). In earlier
studies, overlaps in disability levels for individuals were found in the different types of home
(Wade et al., 1983; Power, 1989; Darton and Wright, 1992). Some individuals in residential
care homes had levels of disability which would have been more suitably catered for in nursing
homes (Cooper, 1985), while some individuals in nursing homes were sufficiently fit to have
been catered for in residential care homes (Primrose and Capewell, 1986; Challis and Bartlett,
1987). However, average levels of disability in nursing homes were higher than in residential
care homes (Ernst and Whinney, 1986; Humphreys and Kassab, 1986; Darton and Wright,
1992). Recently, Crawford et al. (1999) have suggested that the introduction of assessments in
1993 has led to better targeting for residential and nursing home care. However, the differential
cost to a local authority of placing an individual in a nursing home may provide a strong

3
incentive to use residential care where possible, and Burgner noted that local authorities
appeared to be placing people with higher levels of dependency in residential homes (Burgner,
1996).
Residents of residential care homes can receive nursing care from community nursing services,
and the Royal Commission on Long Term Care (Cm 4192-I, 1999) recommended that charges
for nursing care in nursing homes and dual registered homes should be abolished. This
recommendation has been accepted by the Government (Cm 4818-I, 2000). However, the
Government has not accepted the recommendation that personal care costs should be exempt
from means testing, on the grounds that providing personal care free for everyone would be
very expensive and would not necessarily improve services.
Routinely-collected statistics show considerable variation between authorities in the
proportions of people placed in each type of care. Overall, as at 31 March 1999, 33 per cent of
people aged 65 and over who were supported by local authorities, were in nursing homes.
However, this proportion ranged from 11 per cent in Essex to 57 per cent in Liverpool
(Department of Health, 2000). This raises the question whether this is due to variations in
demand (the type of resident approaching authorities), supply (the level and type of provision
available for local authorities to purchase), or policy (in terms of eligibility criteria or
interpretations of need at field level).
These questions have long-term implications for both the welfare of individuals and costs to
the public purse. Once admitted, it is unusual for publicly-funded residents to move homes
(Bebbington et al., 1999) – doing so can be very disruptive for the individual – so it is important
that placements are appropriate. The cost commitment is, by definition, long-term and
substantial: the difference between the costs of nursing and residential home care is comparable
to the difference between packages of community care and residential care.
It is seen as increasingly important that the social care you are offered should not be ‘a lottery’
based on where you live. However, the wide variation in proportions of supported residents
living in nursing homes suggests that where you live may affect the type of care home you are
admitted to. This paper uses data obtained in a national longitudinal survey of individuals
admitted to publicly-funded residential and nursing home care. We examine the pattern of
admissions, the characteristics of people admitted and the relationship between these
characteristics and admissions to residential or nursing home care, in order to identify factors
associated with placement in a residential or a nursing home. This allows us to consider
whether the incentives that have been put in place are working and whether local authorities,
in assessing the need for nursing home care, are using consistent criteria in practice. It will

4
also provide a baseline for considering the potential changes introduced by the Care Standards
Act 2000 and the NHS Plan (Cm 4818-I, 2000).
2. Method
The survey was commissioned by the Department of Health, specifically to help to improve
the Standard Spending Assessment (SSA) formulae for allocating funds to local authorities
(Bebbington et al., 1996). However, it was commissioned as part of a broader study with a
wide range of objectives. Together with a cross-sectional survey of homes and their residents
(Netten et al., 1998), the survey was designed to:
provide a baseline description of the use of residential and nursing home care by both
publicly-funded and privately-funded residents;
examine changes over time, including mortality, changes in location, and changes in
dependency; and
examine the relationship between dependency and the costs of care following the changes
in community care arrangements in 1993.
The survey was designed to obtain information about people aged 65 or over who were
admitted as long-stay, local authority supported, residents of residential and nursing homes. It
was conducted in a stratified sample of 18 local authorities in England. Initially, 20 local
authorities were selected according to type of authority, size, population density, migration rate
and socio-economic status. Fourteen of the selected authorities and four replacement
authorities agreed to participate, including five London boroughs, eight metropolitan districts
and five counties (Netten et al., 1998).
The initial phase of the survey was conducted during a period of three months in the autumn
of 1995. Information was collected on a cohort of 2,544 local authority supported residents
admitted to residential and nursing home care. The surviving members of the cohort have been
followed up at six, 18, 30 and 42 months after admission. For each person admitted,
information was collected from social workers or care managers about their previous living
arrangements, the circumstances of their admission, their health and dependency
characteristics, the type of home to which they were admitted and the contractual arrangements
made with the home. The follow-ups concerned the survival, location, health (dependency)
and funding of the original sample. The results presented in this paper are based on the initial
survey of people admitted to care homes, and on information on survival up to the 30 month
follow-up.
5
The survey collected information relating to physical dependency and mental state which could
be used to estimate the Barthel Index of Activities of Daily Living (Royal College of Physicians
and British Geriatrics Society, 1992) and the MDS Cognitive Performance Scale (Morris et al.,
1994).1
Among the 2,544 individuals admitted, 106 were recorded as having assets exceeding the
capital limit for public funding (£8,000 at the time of the survey), and the information presented
in this paper is based on the remaining 2,438 individuals. Although the sample contained a
disproportionate number of metropolitan authorities, weighting the sample to reflect the
relative numbers of local authority supported residents has very little effect on the distributions
of the variables reported in this paper, and so the unweighted information is shown.2
3. Results
Less than 9 per cent of the sample were placed in local authority run homes (Table 1). Indeed,
in two of the authorities there were no local authority managed homes at all. Just under half
(46 per cent) of all those admitted were assessed as requiring nursing home rather than
residential care. Although dual registration is an increasing form of provision, such homes
represented a very small proportion of placements in the survey (7 per cent). In consequence,
the terms ‘home’ and ‘place’ are used interchangeably in reporting results in this paper. The
proportion of people placed in residential places varied between 33 per cent and 71 per cent in
the participating local authorities.
Age and gender
Overall, 71 per cent of the people admitted were women, with a slightly higher proportion of
men being admitted to nursing homes (32 per cent) compared with independent residential
homes (26 per cent). Men were also more likely to be admitted from hospital than women (32
per cent of people admitted from hospital were male, compared with 26 per cent from
elsewhere). People admitted from hospital and to nursing homes also tended to be younger
than those admitted from elsewhere and to residential homes.
Table 1 shows the distribution of age-groups on admission by type of place. Those admitted
to nursing homes had an average age of 82.5 years, compared with 83.5 among those admitted
to residential care. Age was also associated with source of admission: the average age of those
admitted from hospital was 82.4 years, compared with 83.7 for those from elsewhere.
Although the differences in average age of admission from hospital and to nursing homes were
small, they were statistically significant (p < 0.001).

6
Source of admission
Information was collected about where people were at the point of admission and where they
had been normally resident eight weeks before admission. Table 1 shows that just over half of
all people admitted to a home were in hospital at the time of assessment. The majority of these
were acute stays in geriatric or general medical wards. Ten per cent of the sample had been in
hospital for more than eight weeks. People in hospital at the time of assessment were more
likely to be admitted to nursing homes than those assessed at home. Fifty-six per cent of people
discharged from hospital entered nursing homes, compared with 35 per cent of those admitted
from the community.
Of those admitted from private households, 15 per cent were in some form of sheltered housing.
The majority of these were rented from housing associations or local authorities (89 per cent).
Very few people were admitted straight from sheltered housing to nursing homes, suggesting
that this type of accommodation does not act as a substitute for residential care in any moves
along the continuum of care.3
Eight weeks before assessment, over half of the people in the survey had been living alone. In
a study carried out in conjunction with the 1998 General Household Survey, the proportion of
people aged 80 and over living alone in the community was 56 per cent (Bridgwood, 2000).
Among those living in the community eight weeks before admission, those admitted to
residential homes were more likely to have been living alone (70 per cent) and those admitted
to nursing homes were less likely to have been living alone (52 per cent).
Reasons for admission
Social workers were asked to identify all relevant reasons for admission from a list of 13
categories (including an ‘other’ category, for which they were asked to specify such ‘other’
reasons). These have been grouped into seven categories for the purpose of this paper (see
Table 2). The results show that mental health needs were more frequently identified with
residential than with nursing home admissions, and that the reverse was true for physical or
functional needs. Carer-related factors, which were slightly more likely to be associated with
residential admissions, were identified in 40 per cent of cases overall. Lack of motivation was
associated more with residential than nursing home care.
Disorders and diseases
The disorders and diseases specified were those that care managers were aware of when
assessing the individual. As cognitive impairment was being separately assessed, they were
asked to identify whether they knew that there was an official diagnosis of dementia. As Table
3 shows, dementia was the most frequently cited disorder, although not all of those having

7
cognitive impairment according to the MDS CPS, had been diagnosed: 72 per cent of people
identified as severely impaired and 30 per cent of those who were categorised as mildly
impaired had been officially diagnosed. Arthritis was reported in a third of cases, and stroke
and cardiovascular disease in a fifth. Stroke and malignancy were more frequently reported
among people admitted to nursing home places than to residential places.
Of those admitted to residential or nursing home care, 34 per cent were recorded as having one
of the 12 disorders and diseases, and 59 per cent were recorded as having two or more of the
conditions. The majority had two of the conditions: 34 per cent of those admitted had two, 17
per cent had three, 6 per cent had four and 2 per cent had more than four. Of those diagnosed
as having dementia, 32 per cent were not recorded as having any of the other conditions, and
the corresponding figure for those with a stroke or malignancy was 26 per cent. The remaining
conditions were less likely to have been recorded as the only one of the 12 disorders and
diseases listed.
Dependency
Table 4 compares the physical dependency of those assessed by the type of home to which they
were admitted. As would be expected, more dependent people were admitted to nursing homes.
The average Barthel score of people admitted to nursing homes was 6.7, compared with 12.5
for people admitted to residential care (p < 0.001). People admitted from hospital were, at the
point of admission, more dependent, having an average Barthel score of 8.9, compared with
10.9 for those admitted from elsewhere (p < 0.001).
All types of nursing care requirements were associated with admission to nursing homes. The
most frequently identified type of nursing care was that of daily dressings. These were needed
for over 40 per cent of people admitted to nursing homes, but were also identified for
approaching 20 per cent of people admitted to residential homes. Over a quarter of people
admitted to nursing homes required assistance with bedfast procedures.
There was evidence of widespread cognitive impairment among people admitted to care homes.
Table 5 shows the distribution of the MDS CPS groups and the level of behavioural problems
reported. Only one-third of people admitted were classified as ‘intact’ or ‘borderline intact’.
Over a third were severely impaired (groups 4 to 6). Levels of cognitive impairment were
higher among those admitted to nursing homes (p < 0.001), but the relationship was less marked
than with physical dependency characteristics: a substantial proportion of severely impaired
people were admitted to residential care. Evidence of behavioural problems, such as
wandering, physical or verbal abuse and antisocial acts, was not disproportionately associated
with nursing home admissions.

8
Although people admitted to nursing homes were more dependent, on average, comparing
physical and cognitive impairment separately suggests a considerable level of overlap in terms
of levels of dependency. Nearly a third of people admitted to nursing homes had Barthel scores
of nine or over, more typical of people admitted to residential care. But of those people who
had Barthel scores over 12 (relatively low dependency), a significantly higher proportion
admitted to nursing homes had severe cognitive impairment (37 per cent compared with 20 per
cent entering residential homes, p < 0.001). Nevertheless, about a fifth of people in the
relatively low functional dependency group who were admitted to nursing homes had no
evidence of cognitive impairment.
Factors associated with admission to residential and nursing home care
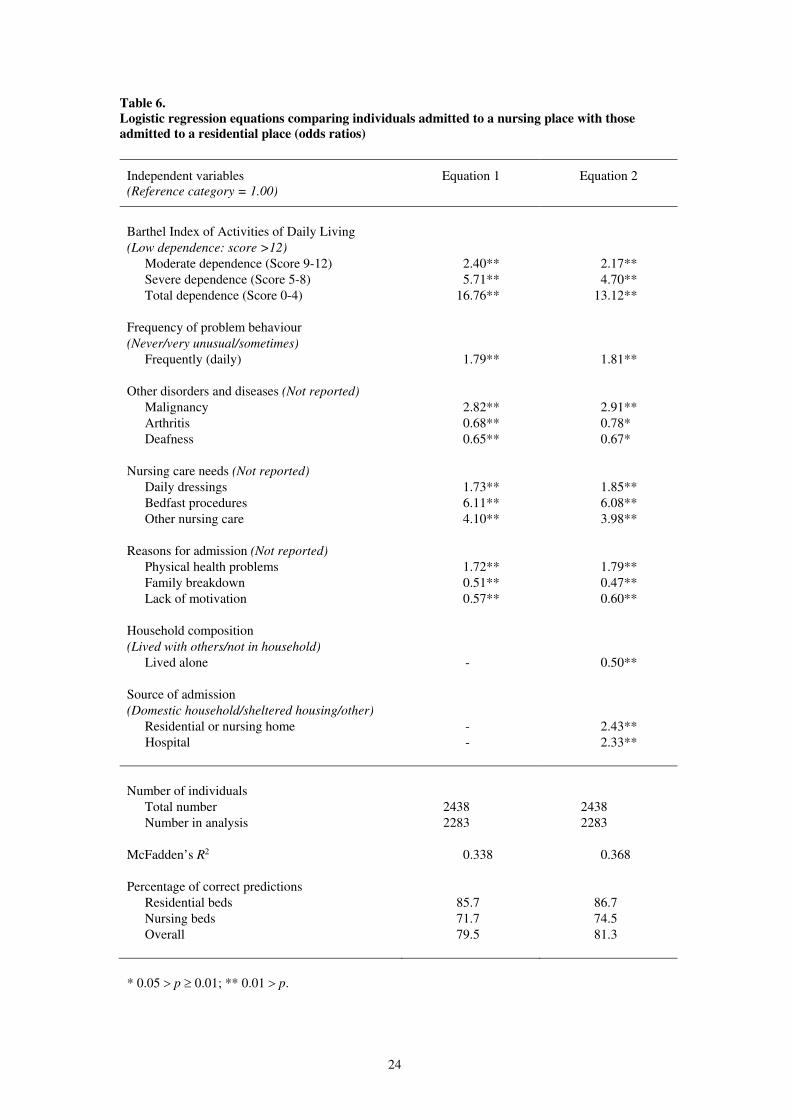
Table 6 shows the results of a series of logistic regression analyses in which the predictive
power of the variables shown in Tables 1 to 5 were examined. The logistic regression analyses
compared the characteristics of individuals who were admitted to a nursing home place with
the characteristics of those who were admitted to a residential place. Table 6 presents estimated
odds ratios, comparing the odds for each category of each independent variable with the
reference category for that variable (i.e. the odds ratio is 1.0 for the reference category).4 The
goodness of fit of the equations is indicated by the proportion of correct predictions and by
McFadden’s R2 (McFadden, 1974).5 Since 54 per cent of the sample had been admitted to a
residential place and 46 per cent had been admitted to a nursing home place, the minimum
proportion of correct predictions, 54 per cent, could be achieved by allocating all cases to
residential places.6
Equation 1 in Table 6 shows the results of the best-fitting model in which variables relating to
personal characteristics (age group, sex, Barthel score, confusion, problem behaviour, need for
nursing care, disorders and diseases, and reasons for admission) were included. Using the
Barthel score alone achieved nearly 75 per cent correct predictions. Including age group, sex,
confusion and problem behaviour with the Barthel score did not improve the overall proportion
of correct predictions, although sex (being female) and mild cognitive impairment were
significantly associated with admission to a residential place (p < 0.01). Inclusion of need for
nursing care, disorders and diseases, and reasons for admission improved the overall proportion
of correct predictions to nearly 80 per cent.7 Equation 1 was obtained by re-estimating the
equation using only the variables which achieved statistical significance at the 5 per cent level.
Following the development of the model using individual characteristics, the additional effects
of household composition and source of admission were tested. This resulted in equation 2 in
Table 6. This shows that those who had been living alone were almost twice as likely to be
admitted to a residential place, while those who were living in another home or hospital were
9
over twice as likely to be admitted to a nursing home place. The inclusion of these variables
slightly altered the importance of the other variables in the equation (for example arthritis and
deafness), but all of the variables were still statistically significant at the 5 per cent level, and
the overall proportion of correct predictions was increased to over 81 per cent. A further
development, not shown in the table, examined the effect of the overall supply of residential
and nursing home places, obtained from Department of Health statistics, and the relative supply
of residential and nursing home places. These variables were statistically significant but, again,
the inclusion of these variables slightly altered the importance of the other variables in the
equation, reducing the importance of the arthritis variable to just below the 5 per cent level of
statistical significance. As a result, the proportion of correct predictions was reduced slightly,
to just under 81 per cent.
Overall, it is clear from Table 6 that the model was slightly better at predicting admission to a
residential place than to a nursing home place. The cut-off probability for the percentage of
correct predictions in Table 6 was 0.5. Eleven per cent of people admitted were predicted to
have been admitted to a residential place but were in fact admitted to a nursing home place,
compared with 7 per cent who were predicted to have been admitted to a nursing home place
but were actually admitted to a residential place.
Authorities varied in the degree to which they placed people in the opposite type of place to
that predicted by the model. Using a probability of under 0.33 to denote a low predicted
probability of placement, eight local authorities made more than 10 per cent of placements in
the opposite type of place to that predicted. The maximum proportion of such placements in
any local authority was 20 per cent. Among these eight authorities, five made the majority of
such placements in nursing places, one made the majority of such placements in residential
places, and two made similar proportions of such placements in residential and nursing home
places.
Outcomes at 30 months
It was not possible to obtain information on prognosis at admission. However, the information
collected in the follow-ups included the location of the individuals and, for those who had died,
their date of death. Information on the location of the elderly people at the 30 month follow-
up was obtained for 90 per cent of the individuals included in the admissions survey. Table 7
shows the proportion of individuals who died by 30 months, and their mean length of survival
following admission, according to the type of place that they were admitted to and the type of
place predicted by the logistic regression equation shown as equation 2 in Table 6.

10
Individuals who were predicted to have been admitted to a residential place were less likely to
have died by 30 months than those predicted to have been admitted to a nursing place, whether
they had been admitted to a residential place or to a nursing place. Among individuals who
had been admitted to a residential place, 57 per cent of those predicted to have been admitted
to a residential place were recorded as having died by 30 months, compared with 69 per cent
who were predicted to have been admitted to a nursing home place. Among individuals who
had been admitted to a nursing home place, 82 per cent of those predicted to have been admitted
to a nursing place were recorded as having died by 30 months, compared with 68 per cent who
were predicted to have been admitted to a residential home place.
The mean length of survival of those who had died was slightly longer for those who were
predicted to have been admitted to a residential place than for those who were predicted to have
been admitted to a nursing place, whether they had been admitted to a residential place or to a
nursing place, but the differences were not statistically significant. For individuals admitted to
a residential place, and who were recorded as having died by 30 months, the mean length of
survival was 12.3 months for those predicted to have been admitted to a residential place and
11.3 months for those predicted to have been admitted to a nursing place. For individuals
admitted to a nursing place, and who were recorded as having died by 30 months, the mean
length of survival was 7.7 months for those predicted to have been admitted to a nursing place
and 8.6 months for those predicted to have been admitted to a residential place. Among those
who were predicted to enter the opposite type of place to the one that they had been admitted
to, the difference between the mean length of survival of those who had died was statistically
significant (p < 0.05).
4. Discussion
The analysis provides a coherent and interpretable picture of the effect of assessment decisions
on placements in residential and nursing homes. Inevitably, there are problems in using data
that have been collected for one purpose for investigating another issue, no matter how closely
related the issues are. The data collected in this survey were principally designed to be
comparable with nationally available data in order to identify those characteristics associated
with demand for care home places. Large-scale data collections of this nature do not easily
allow detailed investigations of reasons for admission or the knowledge base from which social
workers were making their assessments. It is not possible, for example, in this type of study to
allow for such factors as unrecognised depression which has been found to be associated with
a need for care services (Banerjee and Macdonald, 1996). We are reliant on care managers’
interpretations of events.

11
Considerable variation between local authorities is observed in the proportions of older people
supported in care homes who are living in nursing homes. On the basis of our analysis we were
able to predict correctly the placement of over 80 per cent of people at the point of admission,
based on the characteristics and circumstances of the individuals themselves. Mortality rates,
as would be expected if appropriate decisions were being made, were much higher among
people admitted to nursing homes than among those admitted to residential homes. Moreover,
mortality rates and length of stay amongst those who died within the group of those apparently
placed inappropriately suggest that some unmeasured aspect of expected prognosis would
account for some of the unexplained variation. This suggests that in taking on the responsibility
for placing people in nursing home care, local authorities appear to be placing people on a
consistent and appropriate basis. However, this means that the observed variation between
local authorities is due primarily to factors other than local authority nursing home placement
policies and practice.
Turrell et al. (1998) suggest that variations in the relative supply of residential and nursing
homes are likely to result in some misplacement. Construction of supply indicators is
hampered by the lack of geographical correspondence between local and health authorities and
the use of homes beyond the local authority boundaries, particularly in London (Bebbington
and Darton, 1995). The supply indicators that were used were found to be statistically
significant but did not improve the predicted proportion of correct placements. With the
caveats about measurement of supply, this suggests that there is little evidence that authorities
are being constrained in placement by factors beyond their control.
We identified above that, nationally, there is a wide variation in the proportion of local
authority supported residents who are placed in nursing, as opposed to residential, homes. It
is possible that the variation is due to the types of people who approach local authorities as a
result of differing policies on continuing care. However, information about the low number of
people discharged from homes to hospital suggests that this is unlikely (Bebbington et al.,
1999). Socio-economic factors are more likely to be associated with the numbers of people
approaching authorities than wide variations in need-related characteristics. It is more likely
that the variations in the proportions placed in residential care are associated with policies and
practice in maintaining people in private households. While we cannot observe the
characteristics of those people who were maintained in private households, we can turn to the
model for some indications of what is influencing placement decisions.
The dependency characteristics of individuals accounted for the vast majority of variations in
placements. The grouped Barthel score alone achieved nearly 75 per cent of correct
predictions. This suggests that those authorities with a high proportion of nursing home

12
placements are admitting more dependent people. If we accept the argument above, this
suggests that the authorities that place the highest proportion of people in nursing homes are
maintaining people in private households at higher levels of dependency.
While undoubtedly the dominant factor, level of dependency is not the whole story. It is of
interest to explore those factors that were associated with admission to residential care, where
potentially there may be scope for diversion from admission to a care home. The analysis
revealed five factors that were associated with increased probabilities of placement in
residential care: arthritis, deafness, family breakdown, living alone and lack of motivation.
Once all other factors have been taken into account, a diagnosis of arthritis probably reflects
high levels of impairment, without an associated need for nursing care. We might hypothesise
that deafness is associated with problems of communication and fears for safety, which might
be susceptible to innovative intervention.
Lack of carer support is associated with living alone and family breakdown, related, well-
established factors in admission to care homes (Warburton, 1994). Again, we might
hypothesise that some authorities are more successful and prepared to spend more on packages
of care to support highly dependent people living alone. Within the context of the model, this
would be associated with high levels of functional impairment, but not with a need for nursing
care, suggesting that support that might otherwise be associated with community nursing
interventions is less likely.
Perhaps of most interest, given the current policy emphasis on intermediate care and
rehabilitation, is the effect of lack of motivation. High levels of functional impairment may be
partly the result of lack of motivation, suggesting that this may be an appropriate target group
for rehabilitation services rather than admission to long-term care.
It is of interest that, once functional impairment, diagnoses of disorders and conditions, and
these other factors were allowed for, dementia was not a factor in predicting admission to
nursing homes or residential care. Other work suggests that the same may not be true among
privately-funded residents. At the same level of functional impairment, privately-funded
residents with severe cognitive impairment are more likely than publicly-funded residents to
be found in residential homes (Netten et al., forthcoming).
Overall, it would appear that the current system of incentives, largely the higher cost associated
with nursing home placements, works well in terms of a consistent approach to placing people
in nursing homes. However, the variations in proportions of people placed suggest that it is

13
much more of a lottery whether you are admitted to residential care or maintained at home. It
remains to be seen whether new incentives in terms of performance assessment and policy
emphasis and spending on rehabilitative and intermediate care have the desired impact in
reducing admissions to long-term care. An issue for the future will also be whether the new
arrangements for NHS funding of nursing care continue to promote appropriate placements in
nursing homes or access to nursing care in general care homes.
Notes
1. The scores on the Barthel Index were grouped into four categories, following Granger et
al. (1979): 0-4, 5-8, 9-12, 13-20. The seven categories of the MDS CPS were grouped into
three categories: intact, code 0; mild impairment, codes 1, 2, 3; and severe impairment,
codes 4, 5, 6.
2. For example, a goodness-of-fit test between the unweighted and weighted distributions of
the grouped Barthel Index gave X2 = 0.344 (3 d.f., p > 0.95).
3. It is interesting to note that people admitted from sheltered housing were no more
dependent than people who lived in unsupported accommodation (average Barthel score of
12.0 compared with 11.3 in other types of private households). Of course, sheltered
housing is a very inclusive term and conceals a wide range of support which was not
reflected in the data collected.
4. The odds ratio represents the relative probability of admission to a nursing home place
rather than to a residential home place for individuals with the given level of the
independent variable, compared with individuals with the reference category level. For
example, from equation 2, individuals with a Barthel score of four or less were estimated
to be 13 times as likely to have been admitted to a nursing place than to a residential place,
compared with individuals with a Barthel score of more than 12.
5. McFadden’s R2 is a measure of goodness of fit which is analogous to the R2 statistic used
in linear regression analysis.
6. Note that some individuals could not be included in this analysis. Almost all of these were
in one metropolitan authority which was unable to supply information on problem
behaviour. The logistic regression analyses were based on 2,283 individuals in 17 of the
18 local authorities, of whom 55 per cent had been admitted to a residential place.
7. In the case of need for nursing care and reasons for admission, a number of items were
recorded for only a few members of the sample. The various categories of need for nursing
care and reasons for admission listed in Tables 2 and 4 were entered separately. In the case
of reasons for admission, this produced a slightly lower proportion of correct predictions
than using the original variables and excluding the categories with very few cases.

14
However, using these three categories of need for nursing care produced similar proportions
of correct predictions as using each type of nursing care separately.
15
References
Audit Commission (1986) Making a Reality of Community Care. HMSO, London.
Banerjee, S. and Macdonald, A.J.D. (1996) Mental disorder in an elderly home care population:
associations with health and social service use. British Journal of Psychiatry, 168, 750-756.
Bebbington, A.C. and Darton, R.A. (1995) Alternatives to Long-Term Hospital Care for
Elderly People in London. PSSRU Discussion Paper No. 1139. Personal Social Services
Research Unit, University of Kent at Canterbury.
Bebbington, A., Brown, P., Darton, R. and Netten, A. (1996) Survey of Admissions to
Residential Care: SSA Analysis Report. PSSRU Discussion Paper No. 1217/3. Personal Social
Services Research Unit, University of Kent at Canterbury.
Bebbington, A., Brown, P., Darton, R., Miles, K. and Netten, A. (1999) Survey of Admissions
to Residential and Nursing Home Care: 30 Month Follow-Up. PSSRU Discussion Paper No.
1537. Personal Social Services Research Unit, University of Kent at Canterbury.
Bridgwood, A. (2000) People Aged 65 and Over. Results of an Independent Study carried out
on behalf of the Department of Health as part of the 1998 General Household Survey. Office
for National Statistics, London.
Burgner, T. (1996) The Regulation and Inspection of Social Services. Department of Health
and Welsh Office, Department of Health, London.
Care Standards Act 2000 (2000 c. 14) The Stationery Office, London.
Challis, L. and Bartlett, H. (1987) Old and Ill. Private Nursing Homes for Elderly People. Age
Concern Institute of Gerontology Research Paper No. 1. Age Concern England, Mitcham.
Cm 849 (1989) Caring for People: Community Care in the Next Decade and Beyond. HMSO,
London.
Cm 3588 (1997) Social Services: Achievement and Challenge. The Stationery Office, London.
Cm 4169 (1998) Modernising Social Services. Promoting Independence, Improving
Protection, Raising Standards. The Stationery Office, London.
Cm 4192-I (1999) With Respect to Old Age: Long Term Care – Rights and Responsibilities. A
Report by the Royal Commission on Long Term Care (Chairman: Professor Sir Stewart
Sutherland). The Stationery Office, London.
16
Cm 4818-I (2000) The NHS Plan. A Plan for Investment. A Plan for Reform. The Stationery
Office, London.
Cooper, M. (1985) The Growth of Private Residential Care in North East Essex – Its Impact
on Plans for Local Authority Provision. Social Services Department, Essex County Council.
Crawford, V.L.S., Beringer, T.R.O. and Stout, R.W. (1999) Comparison of residential and nursing
home care before and after the 1993 community care policy. British Medical Journal, 318, 366.
Darton, R. and Wright, K. (1992) Residential and nursing homes for elderly people: one sector
or two? In F. Laczko and C.R. Victor (eds) Social Policy and Elderly People. The Role of
Community Care. Avebury, Aldershot, 216-244.
Department of Health (1999a) Community Care Statistics. Residential Personal Social
Services for Adults. Detailed Statistics on Residential and Nursing Care Homes and Local
Authority Supported Residents, England 1998. RA/98. Department of Health, London.
Department of Health (1999b) Fit for the Future? National Required Standards for Residential
and Nursing Homes for Older People. Consultation Document. Department of Health, London.
Department of Health (2000) Community Care Statistics 1999. Residential Personal Social
Services for Adults, England. Statistical Bulletin 2000/2, March 2000. Department of Health,
London.
Department of Health and Social Security (1982) A Good Home. A Consultative Document on
the Registration System for Accommodation Registered under the Residential Homes Act 1980.
Department of Health and Social Security, London.
Ernst and Whinney (1986) Survey of Private and Voluntary Residential and Nursing Homes for
the Department of Health and Social Security. Ernst and Whinney, London.
Granger, C.V., Dewis, L.S., Peters, N.C., Sherwood, C.C. and Barrett, J.E. (1979) Stroke
rehabilitation: analysis of repeated Barthel Index measures. Archives of Physical Medicine and
Rehabilitation, 60, 14-17.
Griffiths, R. (1988) Community Care: Agenda for Action. A Report to the Secretary of State
for Social Services. HMSO, London.
Humphreys, H.I. and Kassab, J.Y. (1986) An investigation into private sector nursing and
residential home care for the elderly in North Wales. Journal of the Royal College of General
Practitioners, 36, No. 292, 500-503.
17
Laing and Buisson (1993) Care of Elderly People: Market Survey 1992/93 (6th edition). Laing
and Buisson, London.
McFadden, D. (1974) Conditional logit analysis of qualitative choice behavior. In P. Zarembka
(ed), Frontiers in Econometrics. Academic Press, New York, 105-142.
Morris, J.N., Fries, B.E., Mehr, D.R., Hawes, C., Phillips, C., Mor, V. and Lipsitz, L.A. (1994)
MDS Cognitive Performance Scale. Journal of Gerontology: Medical Sciences, 49, No. 4,
M174-M182.
National Assistance Act 1948 (11 & 12 Geo. VI c. 29) HMSO, London.
National Health Service and Community Care Act 1990 (1990 c. 19) HMSO, London.
Netten, A., Bebbington, A., Darton, R., Forder, J. and Miles, K. (1998) 1996 Survey of Care
Homes for Elderly People. Final Report. PSSRU Discussion Paper No. 1423/2. Personal Social
Services Research Unit, University of Kent at Canterbury.
Netten, A., Darton, R., Bebbington, A., Forder, J., Brown, P. and Mummery, K. (forthcoming)
Residential and nursing home care of elderly people with cognitive impairment: prevalence,
mortality and costs. Aging and Mental Health.
Power, W.E. (1989) Residential care for elderly people: characteristics of patients admitted to
residential and nursing home care from hospital. British Journal of Social Work, 19, No. 1, 39-
51.
Primrose, W.R. and Capewell, A.E. (1986) A survey of registered nursing homes in Edinburgh.
Journal of the Royal College of General Practitioners, 36, No. 284, 125-128.
Registered Homes Act 1984 (1984 c. 23) HMSO, London.
Royal College of Physicians and British Geriatrics Society (1992) Standardised Assessment
Scales for Elderly People. Royal College of Physicians of London, London.
Turrell, A.R., Castleden, C.M. and Freestone, B. (1998) Long stay care and the NHS:
discontinuities between policy and practice. British Medical Journal, 317, 942-944.
Wade, B., Sawyer, L. and Bell, J. (1983) Dependency with Dignity: Different Care Provision for
the Elderly. Occasional Papers on Social Administration No. 68. Bedford Square Press, London.
Warburton, R.W. (1994) Implementing Caring for People. Home and Away. A Review of Recent
Research Evidence to Explain Why Some Elderly People Enter Residential Care Homes While
Others Stay at Home. Department of Health, London.

18

19
Table 1.
Demographic characteristics of admissions by type of place to which admitted (percentages)
Demographic characteristics Residential place Nursing place All places
Local
authority
Voluntary Private
Number of individuals
Age group
65 to 69
70 to 74
75 to 79
80 to 84
85 and over
Sex
Male
Female
Source of admission
Domestic household
Sheltered housing
Residential care
Nursing home
Hospital
Other
Household composition
(8 weeks before admission)
Lived alone
Lived with others
In hospital
In resid./nursing home
Elsewhere
Household tenure
(8 weeks before admission)
Owner occupied/mortgaged
Rented from LA/NT/HA
Privately rented
Other
Not living in household
206
2
8
15
31
45
31
69
44
8
7
<1
39
0
67
29
3
1
0
24
60
8
3
4
243
3
9
12
24
52
28
72
40
10
8
2
39
2
62
31
4
2
1
26
56
7
3
8
865
3
8
15
26
48
25
75
35
8
10
2
44
2
62
24
7
6
<1
23
50
10
3
14
1124
4
10
19
26
41
32
68
18
2
12
4
63
2
38
35
16
11
<1
22
44
5
2
27
2438
3
9
17
26
45
29
71
28
5
10
3
52
1
51
30
10
7
<1
23
49
7
3
19
LA/NT/HA – local authority, new town or housing association.

20
Table 2.
Reasons for admission by type of place to which admitted (percentages)
Reasons for admission Residential place Nursing place All places
Local
authority
Voluntary Private
Number of individuals
Physical or functional needs
Mental health needs
Carer related factors
Lack of motivation
Housing problem
Social contact
Other
206
74
51
44
22
14
4
7
243
78
49
49
29
13
2
8
865
75
47
40
25
16
3
7
1124
83
39
38
16
15
1
3
2438
79
44
40
21
15
2
5
People may be admitted for more than one reason so percentages do not add to 100.

21
Table 3.
Disorders and diseases of admissions by type of place to which admitted (percentages)
Disorders and diseases Residential place Nursing place All places
Local
authority
Voluntary Private
Number of individuals
Dementia (diagnosed)
Arthritis
Stroke
Cardiovascular disease
Respiratory/chest disease
Deafness
Depression (diagnosed)
Fracture
Blindness
Malignancy
Other psychiatric disorder
Gastrointestinal disease
206
40
39
18
21
15
19
12
9
9
4
5
4
243
40
36
17
15
15
15
11
9
9
3
7
4
865
37
33
17
19
14
15
16
10
10
5
6
4
1124
39
28
26
20
15
11
12
11
10
13
5
6
2438
38
32
21
19
14
14
13
10
10
8
6
5
People may have more than one disorder or disease so percentages do not add to 100.

22
Table 4.
Dependency of admissions by type of place to which admitted (percentages)
Dependency characteristics Residential place Nursing place All places
Local
authority
Voluntary Private
Number of individuals
Mobility
Walk outdoors
Walk indoors and stairs
Indoors on level/with aids
Walk indoors with help
Mobile in wheelchair
Chair or bedfast
Self-care (need assistance)
Wash face and hands
Bath or wash all over
Dress
Feed self
Use WC
Transfer (bed/chair)
Continence
Continent
Occasional accidents
Incontinent
Barthel Index (grouped)
Low dependence (Score >12)
Moderate dep. (Score 9-12)
Severe dep. (Score 5-8)
Total dependence (Score 0-4)
Require nursing care
Daily dressings
Bedfast procedures
Other tasks
Any tasks
206
19
20
35
11
11
4
25
89
51
7
20
22
55
33
12
59
29
10
2
16
<1
9
21
243
15
14
32
15
19
5
36
88
60
12
30
34
44
35
21
46
30
18
7
21
<1
7
27
865
16
15
31
21
13
4
35
85
58
12
29
34
55
31
14
52
28
16
4
17
2
9
23
1124
4
5
11
23
28
29
67
95
88
38
73
76
24
30
46
12
19
32
37
39
24
37
66
2438
11
11
23
20
20
15
49
90
72
23
49
52
40
31
29
34
24
23
19
28
12
22
43

23
Table 5.
Cognitive impairment and behavioural problems of admissions by type of place to which
admitted (percentages)
Dependency characteristics Residential place Nursing place All places
Local
authority
Voluntary Private
Number of individuals
MDS CPS categories
Intact (0)
Borderline intact (1)
Mild impairment (2)
Moderate impairment (3)
Mod. severe impairment (4)
Severe impairment (5)
Very severe impairment (6)
Frequency of problem behaviour
Never/very unusual
Sometimes (>weekly)
Frequently (daily)
206
24
14
11
24
6
21
0
67
23
10
243
19
16
12
20
9
23
<1
60
23
17
865
22
15
13
26
7
16
<1
69
19
12
1124
18
10
9
17
10
32
4
65
20
16
2438
20
13
11
21
8
24
2
66
20
14
MDS CPS – Minimum Data Set Cognitive Performance Scale (Morris et al., 1994).
24
Table 6.
Logistic regression equations comparing individuals admitted to a nursing place with those
admitted to a residential place (odds ratios)
Independent variables
(Reference category = 1.00)
Equation 1 Equation 2
Barthel Index of Activities of Daily Living
(Low dependence: score >12)
Moderate dependence (Score 9-12)
Severe dependence (Score 5-8)
Total dependence (Score 0-4)
Frequency of problem behaviour
(Never/very unusual/sometimes)
Frequently (daily)
Other disorders and diseases (Not reported)
Malignancy
Arthritis
Deafness
Nursing care needs (Not reported)
Daily dressings
Bedfast procedures
Other nursing care
Reasons for admission (Not reported)
Physical health problems
Family breakdown
Lack of motivation
Household composition
(Lived with others/not in household)
Lived alone
Source of admission
(Domestic household/sheltered housing/other)
Residential or nursing home
Hospital
2.40**
5.71**
16.76**
1.79**
2.82**
0.68**
0.65**
1.73**
6.11**
4.10**
1.72**
0.51**
0.57**
-
-
-
2.17**
4.70**
13.12**
1.81**
2.91**
0.78*
0.67*
1.85**
6.08**
3.98**
1.79**
0.47**
0.60**
0.50**
2.43**
2.33**
Number of individuals
Total number
Number in analysis
McFadden’s R2
Percentage of correct predictions
Residential beds
Nursing beds
Overall
2438
2283
0.338
85.7
71.7
79.5
2438
2283
0.368
86.7
74.5
81.3
* 0.05 p 0.01; ** 0.01 p.

25
Table 7.
Survival of individuals 30 months after admission by type of place to which admitted and type of
place predicted
Place to which
admitted
Place predicted Number of
individuals
Died within
30 months
(%)
Mean survival of
those who died
(months)
Residential
Residential
Nursing
Nursing
All places
Residential
Nursing
Residential
Nursing
All places
1095
168
260
760
2283
57
69
68
82
67
12.3
11.3
8.6
7.7
9.9
Type of place was predicted using equation 2 (Table 6) for the 2283 individuals with complete
information.


![Kent Academic Repository - University of Kent and Memorial... · Cherkasova, 2003; Barton, Press, Kennan, & O’Connor, 2002; Damazio, Tranel, ... Downloaded by [University of Kent]](https://static.fdocuments.net/doc/165x107/5b77a3007f8b9a3b7e8e0a77/kent-academic-repository-university-of-kent-and-memorial-cherkasova-2003.jpg)