KEEP CALM AND TAPER ON Geof Marshall, Portfolio Manager: High Yield Ryan Fitzgerald, Portfolio...
27
KEEP CALM AND TAPER ON Geof Marshall, Portfolio Manager: High Yield Ryan Fitzgerald, Portfolio Manager: Income Equity and Property Kevin McSweeney, Porfolio Manager
-
Upload
jadyn-seanor -
Category
Documents
-
view
215 -
download
0
Transcript of KEEP CALM AND TAPER ON Geof Marshall, Portfolio Manager: High Yield Ryan Fitzgerald, Portfolio...
KEEP CALM AND TAPER ON
Geof Marshall, Portfolio Manager: High YieldRyan Fitzgerald, Portfolio Manager: Income Equity and Property
Kevin McSweeney, Porfolio Manager

HIGH-YIELD OPPORTUNITY - REVIEW
Value re-set in yield land:
Rally is tired, but relative value is OK, fundamentals OK and expectations are appropriate.
A return to credit selection.
Source: BAML, issuance and flows is YTD July 31, 2013, return is YTD August 31, 2013
2009 2010 2011 2012 8-May 31-AugYield 9.1% 7.5% 8.2% 6.1% 5.0% 6.6%Spread 650 560 728 526 428 486Price $95.5 $101.9 $98.1 $104.4 $107.2 $101.5Issuance $179B $304B $257B $366B n/a $247B Flows +$21B +$14B +$15B +32B n/a -$12B Return 57.5% 15.2% 4.4% 15.6% 5.8% 2.8%
ytd 2013 year ending

HIGH YIELD – FUNDAMENTALS SUPPORTIVE
Source: Federal Reserve, BAML
Lending conditions continue to improve:
Federal Reserve Senior Loan Officer Survey:
• Consistent reporting of:• loosening standards for
extending credit,• lowering spreads (pricing),• and stronger demand

HIGH YIELD – FUNDAMENTALS SUPPORTIVE
… but de-leveraging momentum post-2008 slowing: cash flow growing slower than debt.
2006 2007 2008 2009 2010 2011 2012 2013-40
-30
-20
-10
0
10
20
30
40
HY EBITDAs, YOY Pct C...2006 2007 2008 2009 2010 2011 2012 2013
-5
0
5
10
15
20
HY Debt, YOY Pct C...Debt Growth YoY
Source: BAML
EBITDA Growth YoY

HIGH YIELD – FUNDAMENTALS SUPPORTIVE
…and leverage beginning to creep higher.
Source: BAML

HIGH-YIELD OPPORTUNITY – DEFENSIVE VALUE
Historically defensive in a rising yield environment– Correlation to: U.S. 3-month T-Bill -0.121,U.S. 10-year T-Bond -0.09
Source, Citi, BAML and Bloomberg, all periods are month beginnings.1. Correlations from 1993 to July 2013, monthly data from BAML
US 10Y
Treasury US High Grade US High Yield
To FromYield
ChangeSpread Change
Annualized Total Return
Spread Change
Annualized Total Return
Aug-89 May-90 +1.22% - 20 bp +0.6% +132 bp -6.6%Oct-93 Dec-94 +2.52% -39 bp -3.9% -66 bp +1.2%Feb-96 Sep-96 +1.36% -13 bp -4.8% -94 bp +5.4%Oct-98 Feb-00 +2.25% -20 bp -0.8% -103 bp +3.7%Nov-01 Apr-02 +1.16% -31 bp -4.2% -230 bp +11.2%Jun-03 Jun-04 +1.28% -32 bp -0.1% -246 bp +11.6%Jul-05 Jul-06 +1.22% -7 bp -2.0% -52 bp +4.7%Jan-09 Jan-10 +1.63% -380 bp +18.4% -1136 bp +57.5%Sep-10 Apr-11 +1.00% -39 bp -0.7% -195 bp +18.3%
Average ex. 2009 rally +1.50% -25 bp -2.0% -107 bp 6.2%
May 1 to August 31 +1.16% +7 bp -5.2% +34 bp -2.2%

HIGH-YIELD OPPORTUNITY – FINANCIALS
De-leveraging benefits lenders. De-leveraging largely finished in corporates, but banks are still reducing debt.
– Value in subordinated bank and insurance company callable ‘fixed-floater’ hybrid securities
– New regulations change the capital treatment encouraging early redemption, boosting returns
– Examples:– Lloyds 6.071% perpetual T1 fixed-floater rated Ba3/BB
6.071% until June 2014, thereafter LIBOR+190 bp. @ 96 = 5.3%1 YTW– Lincoln National 7% 2066 holdco fixed-floater rated Baa3/BBB
7% until May 2016, then LIBOR+235.75 bp. @ 101 = 6.6% YTW– Also, Bank of America, JP Morgan, RBS, Liberty Mutual
Pricing as of September 4, 2013

HIGH-YIELD OPPORTUNITY - LOANS
Defensive floating-rate exposure in a rising yield environment
High-yield bondsLoans
Fixed coupon Floating, reset quarterlySenior obligation SecuredCall protection Little call protectionUn-levered investors Leveraged investor base$1.2 trillion asset class $600 billion in size
Example:– Intrawest term loan B (‘TLB’) 3-month LIBOR +575 bp with 125 bp floor
due December 2017 rated B+– Currently callable at 102, stepping down to 101 December 2013– If 3-month LIBOR = 26 bp, coupon is 1.25% + 5.75% = 7%

LEVERAGE LOAN EXAMPLE – Q9 NETWORKS
Canada’s leading provider of co-located outsourced data centre services.
Second lien TLB C$ LIBOR +925 bp with 125 bp floor due December 2017, not publicly rated or syndicated.–If 3-month LIBOR = 26 bp, coupon is 1.25% + 9.25% = 10.5%
Strong secular growth, high margins and recurring revenue.

HIGH-YIELD OPPORTUNITY - ETFS
Convenient exposure via higher beta bonds, but with more volatility and tracking error. More volatility destroys efficiency (Sharpe ratio).
Performance comparison: Fees YTD to Aug 31 Benchmark Delta
VolatilityETF ‘A’ 0.50% 1.46% 1.40%1 +0.06%0.44%ETF ‘B’ 0.40% 0.99% 1.68%2 -0.69%0.41%‘Market’3 2.77%
0.22%
2012 Benchmark Delta ‘Market’ETF ‘A’ 11.7% 14.2% -2.5% 15.6% (-3.9%)ETF ‘B’ 13.5% 15.4% -1.9% 15.6% (-2.1%)
1. Benchmark for ETF ‘A’ is iBoxx US$ Liquid High Yield Index, in USD2. Benchmark for ETF ‘B’ is Barclays High Yield Very Liquid Bond Index in USD3. ‘Market’ in the Bank of America Merrill Lynch U.S. High Yield Master II Index, in USD
HIGH-YIELDING EQUITIES

A ROUGH QUARTER PUTS 2014 REIT VALUATIONS IN LINE WITH 10-YEAR AVERAGE
Source: Scotia GBM estimates

REITS NOW TRADE AT DISCOUNT TO PRIVATE VALUATIONS
Source: BMO Capital Markets

YIELD SECTORS WITH GROWTH HAVE HELD UP FAIRLY WELL
Source: Bloomberg, Signature
Canadian High Yield Infrastructure Performance

COMPANIES WRESTLING WITH SPECIFIC ISSUES HAVE GOTTEN HIT VERY HARD
Source: Bloomberg, Signature
Northland Power Share Price Performance

STRATEGY
Base Case• Interest rates stay low for a long period of time• The recent back-up in rates does not alter the “real money”
thirst for yield• View the “great rotation” into equities with skepticism• Structurally high valuations in high yielding equities will persist
Strategy• Selectively buying securities in core sectors (e.g. REITs &
infrastructure)• Gradual rotation out of general dividend equities• Despite base case, still looking for special situations that are
out of step with broad yield markets
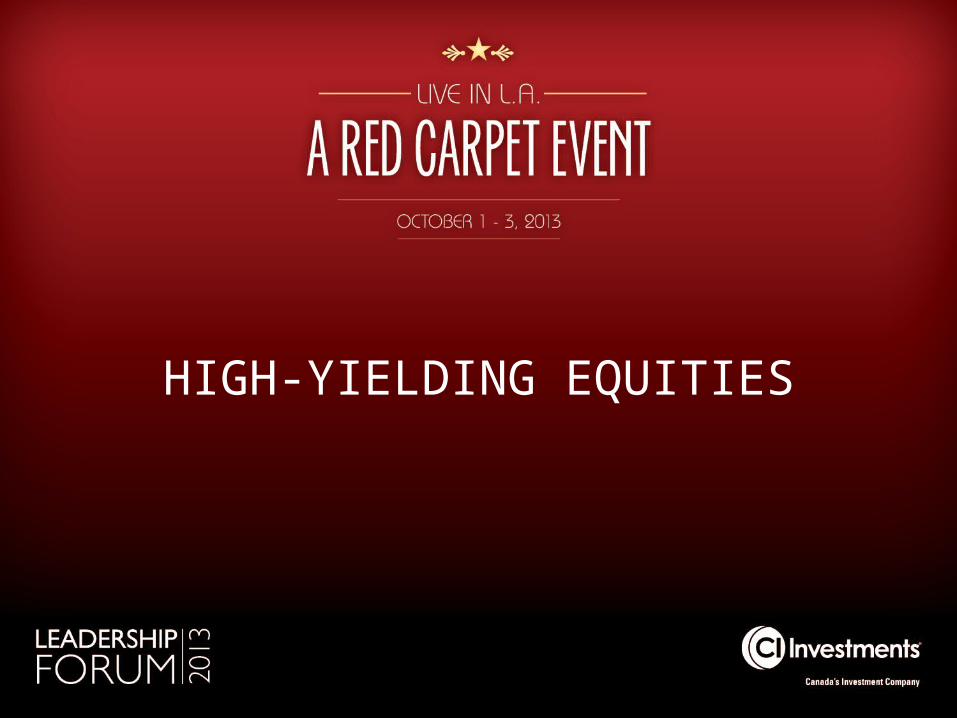
A DEEP DIVE INTO ONE SUCH SPECIAL SITUATION

FOREST CITY – THE FORGOTTEN $10B REAL ESTATE GIANT
Source: Bloomberg, Signature
Forest City Share Price• Storied family controlled company
expanded too rapidly during last cycle
• Took on way too much development with the use of cheap debt
• Forced to do dilutive share issue at the bottom of market
• Since that time stock has been abandoned by the market. Very little analyst coverage and does not neatly fit in a coverage universe since company is not a REIT
• Result: massive improvements in the company are going un-noticed

MANDATE RATIONALE
• Forest City fits in all equity mandates across the Signature Group due to its favourable risk / reward profile.
• Despite lack of dividend, Forest City is held in the Signature Diversified Yield Fund due to the high probability of future REIT conversion and the fact that assets are core to the Signature Diversified Yield strategy.
• While holding is dilutive to distribution for a period of time, we take into consideration “future” yield and total return.
• Position provides potential for capital gains and satisfies desperate need for diversification.

POSITIONING AHEAD OF REIT CONVERSIONS HAS PROVEN VERY PROFITABLE
American Tower REIT conversion

WHAT DO SDY UNIT HOLDERS OWN WHEN THEY OWN FOREST CITY?
8 Spruce Street, Manhattan – the tallest apartment building in North America
Portfolio: 121 apartment communities, 34,110 units
Characteristics: broken down into core and non-core markets. Core market portfolio would rank 3rd of all REIT portfolios in terms of average rent per unit.
Apartments Regional malls
South Bay Galleria, Redondo Beach, California
Portfolio: 17 class A enclosed and open air malls
Characteristics: $470 sales per square foot places portfolio in top tier of US Mall REITS. Forest City sold JV interests in 8 malls to QIC for over $2B – an approximate 5.75% yield.

WHAT DO SDY UNITHOLDERS OWN WHEN THEY OWN FOREST CITY?
Atlantic Terminal, Brooklyn, NY
Portfolio: 29 street level retail centers with a heavy focus on the New York boroughs
Characteristics: an extremely unique urban portfolio that would take years to amass. NY properties have an unmatched 1m residents within their immediate catchment area. Many properties contain future redevelopment potential.
New York Times Building, Manhattan, NY
Portfolio: 47 properties with concentrations in NY and Boston
Characteristics: the portfolio has undergone a significant makeover. Gem of the office portfolio life are the life science buildings adjacent to M.I.T.
Street level retail Office

FUTURE DEVELOPMENT POTENTIAL NOT REFLECTED IN SHARE PRICE
The Foundry Lofts, Washington DC – one of the initialprojects of the Navy Yards redevelopment
Project details: 42 acre mixed-use project in the Capitol Riverfront District of Washington, D.C. Expected to include up to 2,700 residential units, 1.8m square feet of office space, and 300,000 square feet of retail and dining space.
The Barclays Center, Brooklyn, N.Y. Home of the Brooklyn Nets and future home of the New York Islanders. Center anchors the Atlantic yards redevelopment
Project details: 22 acre mixed-use project in Prospect Heights, adjacent to downtown Brooklyn. Expected to include 6,400 residential units, 2,250 affordable units, and two office towers.

MASSIVE IMPROVEMENTS TO THE COMPANY’S STRATEGY ARE WELL UNDERWAY
• Post-crisis leverage has gone down from over 13x EBITDA to 10x EBITDA. A potential large asset sale could bring leverage down to the 9x range, in line with higher leveraged REITs.
• Refocusing on the core. Sold majority of land business in 2012, selling out of non-core markets including hometown of Cleveland. Only 15% of NOI is now considered non-core.
• Development pipeline has been right-sized. Going forward, company plans on partnering with passive capital in order to de-risk projects.
• Governance has been cleaned up. Company has adopted many of the best practices of US REITs.

VALUATION AND RISKS
• Value company based on a sum-of-the-parts NAV. In-depth due diligence done at individual property level. Use conservative estimates of cash flow growth and property yields. Value development pipeline at book value.
• Signature NAV approximately $30 = 67% upside to current share price (as of September 4th).
• Main risk is the continued high leverage.
• Secondary risk is that REIT conversion does not happen and stock remains under-owned and under-followed.

FUND POSITIONING, AS AT AUGUST 31, 2013
Signature Diversified Yield II
Source: Signature Global Asset Management

All charts and illustrations in this guide are for illustrative purposes only. They are not intended to predict or project investment results. Commissions, trailing commissions, management fees and expenses all may be associated with mutual fund investments. Please read the prospectus before investing. Mutual funds are not guaranteed, their values change frequently and past performance may not be repeated.
®CI Investments, CI Investments design, Signature Global Asset Management are trademarks of CI Investments Inc.
Thank You
FOR ADVISOR USE ONLY