
KCA UNIVERSITY SCHOOL OF BUSINESS AND PUBLIC …
71
KCA UNIVERSITY SCHOOL OF BUSINESS AND PUBLIC MANAGEMENT EFFECT OF MARKETING STRATEGIES ON PERFORMANCE OF SMALL AND MEDIUM ENTERPRISES IN KITENGELA TOWNSHIP, KAJIADO COUNTY BY JAMES T. SAPURO REG. No. 14/00859 A DISSERTATION SUBMITTED IN PARTIAL FULFILLMENT OF THE AWARD OF A MASTER OF BUSINESS ADMINISTRATION (CORPORATE MANAGEMENT) JUNE 2016
Transcript of KCA UNIVERSITY SCHOOL OF BUSINESS AND PUBLIC …

KCA UNIVERSITY
SCHOOL OF BUSINESS AND PUBLIC MANAGEMENT
EFFECT OF MARKETING STRATEGIES ON PERFORMANCE OF SMALL AND
MEDIUM ENTERPRISES IN KITENGELA TOWNSHIP, KAJIADO COUNTY
BY
JAMES T. SAPURO
REG. No. 14/00859
A DISSERTATION SUBMITTED IN PARTIAL FULFILLMENT OF THE AWARD OF
A MASTER OF BUSINESS ADMINISTRATION (CORPORATE MANAGEMENT)
JUNE 2016

i
DECLARATION
I declare that this dissertation is my original work and has not been previously published or
submitted elsewhere for award of a degree. I also declare that this contains no material written or
published by other people except where due reference is made and author duly acknowledged.
Sign: … ……………………………………… Reg. No. ……………………..
Date……………………………………………
I do hereby confirm that I have examined the master’s dissertation of
James T. Sapuro
And have certified that all revisions that the dissertation panel and examiners recommended have
been adequately addressed.
Sign: __________________ Date: _________________
Dr. Brigitte Okonga
Dissertation Supervisor
ii
ABSTRACT
Small and Medium Enterprises like other large enterprises have increasingly used various
marketing strategies in their operation. This study sought to find out the effects of marketing
strategies on the business performance of SMEs in Kitengela Township, Kenya. Companies are
continually faced with the need to meet the challenges that arises from the ever changing markets
and continuous competition that they face nationally, regionally and globally. As a result
companies have to develop clearly defined strategies and plans for survival and growth. This
research adopted a descriptive research design, with target population of 62 SMEs in Kitengela.
Census sampling method was used to select the SMEs, with the sampling size of the study being
186 respondents. Data was collected using questionnaire and analysed by aid of Statistical
Package of Social Scientists (SPSS). The findings were summarized using statistical measures of
dispersion while data is presented using tables, graphs and frequencies. The study found out that
place marketing strategy, promotion marketing strategies, and product marketing strategies have
a positive and significant relationship with business performance. It further found out price
marketing strategy to have a positive but insignificant relationship with business performance of
SMEs. The study thus recommends that SMEs need to pay attention to the 4Ps marketing mix in
general and on the place marketing strategy in particular (since it had the largest coefficient) to
improve business performance.
Keywords: Marketing Mix, Performance, SMEs, Growth, Kajiado County, Kitengela Township

iii
ACKNOWLEDGEMENT
I thank the almighty God for the far He has brought me.
Special thanks go to my research supervisor at KCA, Dr. Brigitte Okonga for her constructive
criticism, guidance; knowledge and understanding that equipped me with motivation to complete
this dissertation.

iv
DEDICATION
I dedicate this dissertation to my family and many friends. Special gratitude to my parents, my
wife Sarah, and children Saruni and Reson.

v
TABLE OF CONTENTS
DECLARATION........................................................................................................................... i
ABSTRACT .................................................................................................................................. ii
ACKNOWLEDGEMENT .......................................................................................................... iii
DEDICATION............................................................................................................................. iv
TABLE OF CONTENTS ............................................................................................................ v
LIST OF TABLES ..................................................................................................................... vii
LIST OF FIGURES .................................................................................................................. viii
TERMS AND DEFINITIONS ................................................................................................... ix
ABBREVIATIONS AND ACRONYMS .................................................................................... x
CHAPTER ONE………………………………………………………………………………....1
INTRODUCTION........................................................................................................................ 1
1.1 Background of the Study ......................................................................................................... 1
1.2 Statement of the Problem ......................................................................................................... 5
1.3 Objectives of the Study ............................................................................................................ 6
1.4 Research Questions .................................................................................................................. 7
1.5 Significance of the Study ......................................................................................................... 7
1.6 Scope of the Study ................................................................................................................... 8
CHAPTER TWO ......................................................................................................................... 9
LITERATURE REVIEW ........................................................................................................... 9
2.1 Introduction .............................................................................................................................. 9
2.2 Theoretical Framework ............................................................................................................ 9
2.3 Empirical Review................................................................................................................... 13
2.4 Business Performance ............................................................................................................ 24
2.5 Conceptual Framework .......................................................................................................... 28
2.6 Operationalization of Variables……………………………………………………………...29
2.7 Research Hypothesis .............................................................................................................. 30
CHAPTER THREE ................................................................................................................... 31
METHODOLOGY .................................................................................................................... 31
3.1 Introduction ............................................................................................................................ 31

vi
3.2 Research Design..................................................................................................................... 31
3.3 Population of the Study .......................................................................................................... 31
3.4 Sampling Design .................................................................................................................... 32
3.5 Data Collection ...................................................................................................................... 33
3.6 Reliability and Validity .......................................................................................................... 34
3.7 Data Analysis and Presentation ............................................................................................. 34
CHAPTER FOUR ...................................................................................................................... 36
FINDINGS AND DISCUSSION ............................................................................................... 36
4.1 Introduction ............................................................................................................................ 36
4.2 Response Rate ........................................................................................................................ 36
4.3 Demographic characteristics of the respondents.................................................................... 36
4.4 Independent Variables ........................................................................................................... 40
4.5 Dependent Variables .............................................................................................................. 40
4.6 Validity and Reliability Analysis ........................................................................................... 40
4.7 Regression Analysis and Related Procedures ........................................................................ 40
CHAPTER FIVE ....................................................................................................................... 49
SUMMARY OF FINDINGS, CONCLUSIONS AND RECOMMENDATIONS ................ 49
5.1 Introduction ............................................................................................................................ 49
5.2 Summary of Findings ............................................................................................................. 49
5.3 Conclusion ............................................................................................................................. 51
5.4 Recommendation ................................................................................................................... 52
5.5 Areas for further Research ..................................................................................................... 53
REFERENCES ........................................................................................................................... 54
APPENDIX I- INTRODUCTION LETTER ........................................................................... 57
APPENDIX II- QUESTIONNAIRE ........................................................................................ 58

vii
LIST OF TABLES
Table 2. 1: Operationalization of Variables .................................................................................. 29
Table 3.1: Target Population......................................................................................................... 32
Table 3.2: Study Sample ............................................................................................................... 33
Table 4.1 Response Rate ............................................................................................................... 36
Table 4.2: Gender of the respondents ........................................................................................... 37
Table 4.3: Age of the respondents ................................................................................................ 37
Table 4.4: Highest level of education attained............................................................................. 38
Table 4.5: Form of ownership ....................................................................................................... 40
Table 4.6: Promotional marketing strategies ................................................................................ 41
Table 4.7: Price marketing strategies ............................................................................................ 42
Table 4.8: Product marketing strategies ........................................................................................ 42
Table 4.9: Place marketing strategies ........................................................................................... 43
Table 4.10: SMEs’ Business Performance.................................................................................... 44
Table 4.11: Reliability Analysis ................................................................................................... 45
Table 4.12: Regression Analysis................................................................................................... 45
Table 4.13: R Square..................................................................................................................... 47
Table 4.14: Analysis of Variance.................................................................................................. 47

viii
LIST OF FIGURES
Figure 2.1: Conceptual Framework .............................................................................................. 28
Figure 4.1: Position in the Business .............................................................................................. 38
Figure 4.2: Type of business ......................................................................................................... 39
Figure 4.3: Number of years the SMEs has been in operation ..................................................... 40

ix
TERMS AND DEFINITIONS
Strategy: is the means by which an enterprise sets out to achieve its desired objectives (Kotler
and Armstrong, 2006).
Marketing strategies: Defined as in a given market area, the proper allocation of resources to
support enterprises to win competitively (Goi, 2005).
Performance: Refers to “how well the organization is managed” and “the value the organization
delivers for customers and other stakeholders (Moullin, 2003).
Promotion Strategy: This refers to the deliberate effort to encourage customers to tell others
about their services (Kotler and Armstrong, 2006).
Place Strategy: This is the strategy that relates to the ways in which customers can get product
or services (Kotler and Armstrong, 2006).
Product Strategy: This is the strategy that deals with the physical appearance of the product,
packaging, and labeling information, with an aim to influence whether consumers notice a
product in-store, examine it, and purchase it (Kotler, 2007).
Price Strategy: This is a strategy that relates to costing of products with an aim to either attract
or retain consumers (Duncan, 2005).
Small and Medium Enterprises: An enterprise is considered to be micro, small and medium
enterprise (MSME) based on value of assets or number of full time employees. Sessional Paper
No. 2 of 1992 and national baseline survey (1999), cluster enterprises in the following order;
micro enterprises 1 – 9 employees, small enterprises 10 – 49 employees; medium enterprises 50–
99 employees, large enterprises – 100 and above (RoK, 2012).

x
ABBREVIATIONS AND ACRONYMS
SME: Small and medium sized Enterprise.
GDP: Gross Domestic Product
ROI: Return on Investment
ROA: Return on Assets
ROS: Return on Sales
RBV: Resource Based View.

1
CHAPTER ONE
INTRODUCTION
1.1 Background of the Study
In the contemporary business environment, marketing is seen as a matrix of business activities
planned to organize, manufacture, price, promote and distribute services, goods, and ideas for the
contentment of pertinent clients and customers. Companies are continually faced with the need to
meet the challenges that arises from the ever changing markets and continuous competition that
companies face nationally, regionally and globally. As a result of competition that companies
face in the market the need for companies to develop clearly defined strategies and plans have
become important and necessary for any organization that intends to survive or grow. One of the
important strategic directions that any company faces has to do with its market orientation and to
an extension its marketing strategy.
A marketing strategy is a process that enables a company to use its limited resource to achieve
maximum opportunities through increased sales and thereby giving an organization a
competitive edge over other organizations. One of the main goals of any marketing strategy is to
focus on customer satisfaction on one side and to channel organization energies and resources to
increase sales and dominance in their market niche on another side. A good strategy for
marketing merges development of products, promotion, pricing, distribution, relationship
management and other elements. These marketing strategies of an organization are aligned to the
process of defining how a firm will increase its market share, establish its presence, introduce
new products and increase sales. The employment of marketing strategies is not only a preserve
of large companies but SMEs too have increasingly adopted various marketing strategies.

2
The function of SMEs in development of economies cannot be underrated. Subrahmanya et.al.,
(2010) argues that economists, policy makers, and business experts acknowledge that SMEs are
on the steering of economic advancement as they have contributed to over half of the GDP and
provided an employment rate of over 60% in the so-called developed, high income countries.
SMEs face stiff competition from larger corporations due to emerging innovations, technologies,
and relaxing trade obstacles. As a result of this situation, SMEs find it difficult to survive or
maintain their business status both locally and globally (UNCTAD, 2004). While it can be
argued that SMEs performance is adversely affected in the international market, most of the
ventures in this area in Africa and specifically in Kenya have, in their own petite way, adopted
some strategies for marketing which have enabled them endure the stiff competition over the
years.
As with larger companies, SMEs are faced with the need to survive and thus are required to
generate sales and also have market for their sales. SMEs growth arises from their involvement
in marketing activity that addresses: market share, market development, product promotion,
product pricing, product differentiation and distribution. The small and medium-sized enterprises
(SMEs) play a key role in economy of any country and thus the performance of SMEs is of
significance to all the stakeholders. However, SMEs operate in a different environment unlike
other companies. This raises the question about the marketing strategies that SMEs employ to
compete with the large companies which have huge resources that they can employ in their
marketing strategies. SMEs are faced with limited resources, expertise and marketing impact
(Bennet, 2005). The Kenyan SME sector comprises of self-employment business and various

3
enterprises that are involved in different activities, with majority of the SMEs concentrated in
urban areas.
SMEs in Kenya, like SMEs in other parts of the world are faced with the desire to grow and
survive thus bring to question what marketing strategies have SMEs used to improve their
performance given their financial constraints. According to Rugut (2012) majority of SMEs are
increasingly adopting different marketing strategies to attract and retain their customers. Samli &
Kaynak (1994) suggests that even though strategic marketing places a crucial role in the SMEs,
many research activities in the sector of marketing practices in developing countries have laid
their emphasis on macro issues and the management structure of an organization as the measure
of performance in terms of market share, growth, efficiency and well-being of consumers and
clients. According to Akinyele (2011), the static and macro analysis of marketing practices in
developing economies, minimizes the impact of marketing environment on the achievement of
performance measures and thus their recommendation for more studies to establish the impact of
marketing strategies on SMEs performances in developing countries. In this context this study
will be carried out to determine the impact of marketing strategies on performances of SMEs in
Kenya.
1.1.2 Small and Medium Enterprises (SMEs)
Small and medium enterprises are widely recognized the world over for their role in the social,
political and economic development. The importance of the sector is particularly apparent in its
ability to provide reasonably priced goods, services, income and employment to a number of
people (Kauffman, 2006). It is for this reason that there has been a growing interest and concern

4
by the government and development agencies for the improved performance and growth of the
small and medium enterprises. Recent empirical studies show that SMEs contribute to over 55%
of GDP and over 65% of total employment in high-income countries. SMEs and informal
enterprises account for over 60% of GDP and over 70% of total employment in low-income
countries, while they contribute over 95% of total employment and about 70% of GDP in
middle-income countries (Schneider, 2006). The relative importance of SMEs and the informal
sector (shadow economy) are inversely associated with economic development. In low-income
countries, especially in the least developed economies, the contribution of SMEs to employment
and GDP is less than that of the informal sector, where the great majority of the poorest of the
poor make a subsistence level of living. An important policy priority in developing countries is
to reform the policies that divide the informal and formal sectors, so as to enable the poor to
participate in markets and to engage in higher value added business activities (Meyer-Stamer,
2004).
1.1.3 Firm Performance
Measuring business performance in today’s economic environment is a critical issue for
practicing manager. Business Performance is defined as the operational ability for companies to
satisfy the desires of owners and shareholders. Performance measurement is the process to
gauge performance in order to improve the quality and quantity of operations of organizations.
Performance improvement cannot be realized without performance measurement which to
different people mean differently. To some it means the use of financial index such as ROI
(Return on Investment), ROA (Return on Assets (Equity), ROS (Return on Sales) while to others
it can be measured through market share, customer retention or acquisition and also from

5
innovation of a firm (Atkinson, 2006). Measuring performance can also entail the use of
parameters of effectiveness and efficiency with effectiveness referring to the meeting of
stakeholder’s expectations while efficiency refers to how well an organization is able to use its
resources to meet stakeholder’s expectations. According to Andrea and Campedelli (2011)
performance measures include indicators such as profit growth, revenue growth and return on
capital employed.
1.2 Statement of the Problem
Marketing strategy is a means by which firms respond to competitive market conditions.
Traditionally, it has been decomposed into the four elements of the marketing mix, i.e. product,
pricing, place and promotion. Any effective marketing strategy is expected to improve a
company’s output and hence it’s competitive advantage. Different firms which include SMEs
employ different sets of strategies that may determine their performance. However it is not clear
what the effect of the different sets of strategy employed by SMEs in Kitengela have on their
performance.
Marketing enables SMEs to improve the quality of their goods and services. Hence, the strong
skills of marketing become inevitable for SME sector. The marketing function in SMEs is
hindered by constraints such as limited access to resources, and a lack of marketing expertise on
the part of the owner/manager, it is expected that SME marketing differs from marketing in
larger organizations (Hill, 2001). Marketing strategy has been acknowledged to be important for
SMEs. However the idea that business strategies have an impact on SMEs performance remains
inconclusive. Whereas some researchers have reported a positive relationship between SMEs
marketing strategies and its performance, others have concluded that it is the opposite. Studies by

6
Dzisi (2014) and Oyewale (2013) have reported the direct positive impact of market strategies on
a SME performance. On the contrary Alberto & Gianluigi, (2013) indicate a negative impact of
marketing strategies on the business performance of SMEs. The aforementioned studies indicate
lack of clear relationship on marketing strategy and business performance of SMEs hence
necessitating the need for further studies in different contexts in developing countries, Kenya in
particular. Regionally a number of studies have been carried out on the relationship between
marketing strategies and business performance of SMEs. These include Yang (2005) who carried
out a study in China, with a focus on differentiation marketing strategy and product marketing
strategy thereby excluding other marketing strategies. Dzisi (2014) also carried out a study in
Ghana, with a focus on effect of traditional and nontraditional marketing strategies on growth of
SMEs. This study was limited to traditional and nontraditional marketing strategies.
In Kenya, a number of studies have been carried out on impact of marketing strategy on business
performance of SMEs. Muthee & Ngugi (2014) carried out a study in Kiambu town, with a focus
on relationship marketing strategies. Waithaka et al (2014) also carried out a study with a focus
on traditional and nontraditional marketing strategies. From the mentioned studies, it remains to
be seen that there is a research gap on studies that have focused on the role of 4P’s marketing
strategy on business performance. Therefore the current study aimed to establish the impact of
marketing strategies on the business performance of SMEs in Kenya.
1.3 Objectives of the Study
The main objective of this study was to establish the impact of marketing strategies on the
business performance of SMEs in Kitengela Township.

7
The specific objectives of the study were:
i) To determine the impact of promotion marketing strategy on the business performance of
SMEs in Kitengela.
ii) To determine the impact of price marketing strategy on the business performance of
SMEs in Kitengela
iii) To determine the impact of product marketing strategy on the business performance of
SMEs in Kitengela.
iv) To determine the impact of place marketing strategy on business performance of SMEs in
Kitengela.
1.4 Research Questions
This study was guided by the quest to provide cogent answers to the following research
questions, which were derived from the objectives of the study:
i) How does promotion marketing strategy affect the business performance of SMEs in
Kitengela?
ii) How does price marketing strategy affect business performance of SMEs in Kitengela?
iii) How does product marketing Strategy affect business performance of SMEs in
Kitengela?
iv) How does place marketing strategy affect business performance of SMEs in Kitengela?
1.5 Significance of the Study
The study sought to contribute to the knowledge base of SMEs’ performance – an area that is not
adequately handled in the literature. Specifically, the study has relevance to several parties.

8
Amongst them are the proprietors of SMEs who will find the findings of this study helpful and
assist them to evaluate the effect of each of the studied marketing strategies on their businesses’
performance.
Policymakers who guide small and micro enterprises would take the study as a guide in crafting
policy which has the best implications on SMEs.
Marketing Professionals will practically utilize the actual strategies that are evaluated in this
study. This study’s findings would therefore guide them in creating winning marketing
campaigns for their respective organizations.
Scholars and researchers would find this study a meaningful component of the available body of
knowledge on the performance of SMEs. The findings of the study would also contribute to the
literature review efforts of future researchers.
1.6 Scope of the Study
The geographical scope of the study was Kitengela Township, within Kajiado County. The study
considered the relationship between marketing strategies and performance of SMEs with a focus
on the following marketing strategies: place marketing strategy, product marketing strategy,
price marketing strategy, and promotional marketing strategy. The study focused on formally
registered SMEs that had been operational for at least one year. It was conducted over a duration
of 3 months.

9
CHAPTER TWO
LITERATURE REVIEW
2.1 Introduction
This chapter focused on the literature of the study and is divided into several parts. These
include: theoretical framework, empirical review, conceptual framework, and operationalization
of variables.
2.2 Theoretical Framework
A company’s success is dependent to a greater level to the degree of an organization awareness
of customers, competitors and moderation factors in the market. The needs of customers,
competitor’s strategies and moderating factors are always changing thus necessitating that an
organization keeps up to date with such changes. These changes may include change of
prevailing market conditions, technological changes among others. Recognizing and developing
new strategies by companies, including marketing strategy is key to countering such changes.
The development of marketing strategies can be aided by marketing theory that gives attention to
customer needs and competitors strategies. According to Blankson and Cheng (2005), the
marketing concept determines the success of an organization and the degree to which an
organization pursue its marketing concept more effectively and efficiently holds sway in a firm
profitability and performance.
The study was based on the market orientation theory which underlies modern thought in
marketing and proposes that sucessful firms should be able to know customers needs and wants
with an aim of satisfying them effectively than its competitors. Market orientation theory is

10
conceptualized along three dimension which are customer orientation, competitor orientation,
and inter functional coordination.
2.2.1 Resource Based View Theory (RBV)
The resource-based view (RBV) of the firm argues that competitive advantage and hence
performance depend on resource endowments (Hooley & Greenley, 2005). Newbert (2007), in
his review of empirical research on the resource-based view of the firm, emphasizes capabilities
rather than resources, in terms of relevance and potential impact on performance. Resources per
se cannot do anything. What is important is the capacity to utilize resources effectively, that is, a
capability. Recent work (Liao, et al 2009) also emphasizes the greater relevance and importance
of capabilities compared to resources.
According to Julian (2006) marketing capabilities can be found both in large and small business,
with capabilities including market sensing and customer relationship capabilities. Thus
marketing capabilities has been used to explain the relationship between marketing strategies and
performance of SMEs. This is attributed to the fact that marketing capabilities may include both
tangible and intangible assets which SMEs may have. RBV identifies that some possessions may
lead to attainment of organizational goals, while others do not. Therefore, the fundamental
challenge is for the organizations to identify those resources that will lead to goal realization of
the overall performance (Wade & Hulland, 2004).
Hence, RBV tries to build on internal competence of organizational resources for such an
organization to achieve competitive advantage. Julian, (2006) posited that firm’s sustainable

11
performance advantage by securing rare resources of economic value and the ones that
competitor and other rivals cannot easily copy, imitate or substitute. These resources include the
following: resources that are valuable; resources that are rare; resources that are imitable; and
resources that are non-substitutable.
Market strategy includes strategies that entail the creation of superior products and services to
improve performance of SMEs. Thus the emphasis is on attracting and retaining customers
through quality and superior products than what its competitor’s offers. Therefore, a good
marketing strategy should be able to give SMEs competitive advantage over other SMEs through
the use of its capabilities which are unique to itself, environment, industry, size and resources.
To understand the contribution of marketing strategies to the business performance of SMEs it is
important to understand the capabilities of SMEs, and this include their marketing capabilities
despite meager resources. This role is better understood through RBV theory that focuses on the
importance of resources and capabilities to SMEs, and thus this theory will be central to the
study.
2.2.2 Marketing Orientation Theory
The study will also be based on the market orientation theory which underlies modern thought in
marketing and proposes that sucessful firms should be able to know customers needs and wants
with an aim of satisfying them effectively than its competitors. Market orientation theory is
conceptualized along three dimension which are customer orientation, competitor orientation,
and inter-functional cordination. Customer orientation is concerned with the understanding of
buyers with an aim of continuously creating value. It involves a set of behavior that involves

12
acquiring, disseminating, and processing customer information and with effectively reacting,
responding, and supporting customer feedback (Kohli et al, 2003). Thus market orientation
theory is more concerned with understanding the buyer’s entire value of chain and using of such
information by a company to achieve market advantage. Firms that have good market orientation
are able to achieve higher market performance which result in stronger business performance.
Organizations with stronger customer orientation positively foster more value related to market
tracking and offer greater value to their customers. Accordingly, customer-oriented organizations
tend to obtain information about current and latent customers' needs, understand the expressed
desires, needs, and demands of the customers in their served markets and develop products and
services that satisfy those desires. A seller generates value for buyer only through two methods:
by increasing buyers' interests with regard to costs and by decreasing buyers' costs with regard to
interests (Narver and Slater, 2010). Competitor orientation refers to a company’s knowledge on
strength, weakness, strategies and capabilities of its competitors. Competitor orientation is
focused with the knowledge of other firm’s weakness and strength all with an aim of
understanding their shortfall. It encourages innovation through product marketing which is a key
component of any marketing strategy, and indirectly it leads to better market performance of a
firm (Asgar, 2013).
The last component of market orientation theory is inter-functional coordination. It focuses on
improving the coordination on various systems of a firm to enable it to communicate, think, and
work together to achieve its objectives, effectiveness, competitive advantage, and performance.
It entails the coordinated effort of an organization to create superior value for the target and

13
potential customers thus satisfying the needs, wants and demands of customers. This component
of market orientation theory plays an important role in the adaptability and flexibility of a firm in
improving its market performance and by extension its business performance amidst all
competition (Powpaka, 2006).
2.3 Empirical Review
There exists a number of studies that have focused on the relationship between marketing
strategies and performance of small and medium enterprises. A review of literature on such
studies is provided in the section below:
2.3.1 Promotion Strategy and Firm Performance
Promotion is a variety of techniques used for creating positive images of the commodity being
sold in the minds of prospective buyers. Advertising, public relations, personal selling, and
discounts are the major components of promotion. Advertising which is considered the most
powerful element of promotion strategy is a sponsored public notice whose aim is to inform,
convince, and otherwise modify the attitudes of consumers towards a particular product, with the
aim of educing an eventual purchase (Robbins and Coulter, 1999). The major promotional tools
include trade promotion, consumer promotion, and sales-force promotion. Consumer promotion
refers to coupons, prices off, cash refund, samples as well as free trials. Trade promotion refers
to free goods and advertising. Sales-force promotion refers to contest for sales reps, specialty
advertising and trade shows.

14
Zeithaml et al. (1995) describes promotion as part of specific effort to encourage customers to
tell others about their services. Promotion is a key practice that facilitates the process of market
exchange between stakeholders and the public at any given time. As a result every firm must
position itself as either a promoter or communicator with an aim of creating an optimal mix of
marketing communication tools that will enable product be a brand in the market. Promotion
holds a central role in the product marketing mix that any company may use to pursue its
marketing objectives and advertising, (Kotler, 2007). Study by Francis and Collins-Dodd, (2004)
has shown that there is a relationship between promotion and the performance of business. Van
Scheers and Radipere (2008) mentions that advertising can be used by SMEs, and like other
large firms this can result in giving SMEs competitive edge.
Ramsey (2012) carried out a study among SMEs marketing strategies on the impact of internet-
based technologies (IBTs) on the customer relationship management (CRM) activities (i.e. e-
CRM) of SMEs in Ireland. The methodology involved mixed methods approach incorporating an
online questionnaire, qualitative in-depth interviews and projective techniques were adopted.
Factor analysis was carried out on 286 respondents, which led to communication with customers
and the management of customer information being distilled as key areas within e-CRM in
SMEs. Findings showed that to a varying extent, SMEs were adopting relatively simple IBTs to
improve customer communication and information management capabilities and to create
competitive advantage through e-CRM. SMEs find the communication aspect of e-CRM easier,
but struggle to integrate customer information into their decision making. One of the major
marketing mix that many researchers assessed is Promotion. The aim of their assessment was to

15
confirm if there is any connection between promotion and market share and to determine how
proper promotion would raise profit and sales.
According to Thirkell & Dau, (1998) Promotion is relatively effectual to the campaigns of
competitors. According to Leonidouet al. (2002) the most widely researched component of
promotion was advertising. The studies majorly scrutinized the procedures of advertising through
which the company can enlighten, launch, remind or encourage clients and therefore make more
sales and enhance profit. The magnitude of advertising on performance of exports was
observable in firms that implemented sound advertising and therefore recorded an increase in
sales. According to Lee & Griffith (2004), the firms which are more committed to their target
market employed more advanced level of advertising in contrast to less committed firms that
used advertising of a lower degree.
Eusebio et al., (2007) carried out a research on the perception of management and strategies of
marketing in performance of exports via relative analysis in Spanish and Italian textile industry.
The results indicated that the commercial branch is one significant component in promotion
strategy. Leonidou et al., (2002) researched on marketing strategy: a meta-analysis regarding
prior studies. In the re-examination of studies, promotion-related variables were divided into sale
promotion, individual selling, advertising, individual visits, trade fairs and promotion adaption.
Sales promotion, including samples, premiums, coupons and other tools of promotion is handy in
economies of low income or markets with advertising limitations and high competition. In
markets that have advertising restrictions and the cost of managing a working force is low,
personal selling is very beneficial. Personal visits can raise the market shares due to its ability to

16
personalize relationships, increases communication, enhance experiences about opportunities or
problems and provides a timely response. Nassimbeni, (2001) conducted a research on exporters
in Italy which showed that instead of non-exporter, exporter companies have a tendency to use
commercial intermediaries such as commercial agency and firms in an export market.
Finally, Fizebakhsh, (2002) in his study investigating effective factors on a marketing mix
revealed attendance in fair, send catalogue, online advertising, journals and TV channels,
marketing directly, giving an agency to foreign companies, having an international seal manager
would raise the performance of exports. On another hand, Eusebio et al., (2007) argued that more
investment in promotional activity did not show any noteworthy effect on market share.
2.3.2 Pricing Strategy and Firm Performance
According to Kotler (2007), price is the cost of producing, delivering and promoting the product
which is charged by the company. Penetration pricing strategy is one of the most effective
marketing strategies available to SMEs. Pricing strategy entails setting a low entry price for a
new product or brand in order to gain a breakthrough in a highly competitive market. The
strategy can also be used when introducing a completely new product in the market or when
tapping a new market segment for an existing product, (Vikas, 2011). A company employs
penetration pricing with the expectation that eventually the price will be raised once the initial
marketing objectives are fulfilled. Its aim is to attract the customers to try the company’s
product. By keeping the price intentionally lower than established competitors, the business aims
to compromise existing brand loyalties of the customers.

17
The final aim of penetration strategy is not maximization of profits, but allowing new products or
brands to gain a foothold in the market place (Vikas, 2011). Gottfried and Hans, (2008) suggests
that this strategy enables the firm to initially implement low prices so as to speed up adoption or
establish a de facto standard. Based on Tellis (2006), the penetration strategy is always
successful at companies that experience cost advantage due to scale. The supporting situation to
undertake penetration pricing involves minor product revision, low product differentiation,
elastic demand and low factor capacity utilization (Noble and Gruca, 2009). The strategy is
commonly associated with increase in sales volume. Price control is both a key component in
competitive and marketing strategy as well as a key determinant of performance. According to
Shipley and Jobber (2001) price is the gauge used by commercial and industrial customers to
judge the worth of an offering, and it strongly has impacts on selection of brands among
competing alternatives. Apart from world-class product development, pricing is key to success.
Pricing is fundamental in capturing and attracting demand. It is also crucial in optimizing the true
value of your products in the real market place (Yeoman and McMahon, 2004).
Furthermore, pricing is the firm’s only revenue generating marketing mix element as well as the
most flexible component of this mix in the sense that pricing decisions such as price changes can
be implemented relatively quickly and be adapted easily to the conditions surrounding a
company's internal or external environment (Lewengart and Mizrahi, 2000). The company’s
objective functions are multifaceted in that the company’s viability rests on a combination of
different pricing objectives (Diamantopoulos, 1991). According to Shipley and Jobber (2001),
the objectives are flexible and change over time due to organisational and environmental
conditions. Pricing goals can be supportive or conflictual, therefore there are goals that are

18
compatible with each other e.g. increase of sales and market share and opposing objectives such
as maximization of sales versus maximization of profits (Myers, et al., 2002).
A number of studies have been conducted on pricing strategies, with each research giving it a
different approach, applying a different methodology and hence resulting to varied findings.
Paul and Ivo (2013) used the survey method and hypothesis testing on 95 respondents to
demonstrate the relationship between price strategies and price setting practices. The survey
demonstrated that there is a connection between price strategies and price setting because price
setting practices are used to implement price strategies. Howard and James (2013) based their
study of the effect of decision context on perceived risk in pricing strategies on attribution theory
where more than 100 business managers were used and findings suggest that when
uncontrollable environmental factors dominate pricing, managers tend to select pricing strategies
with external orientations to deflect risk away from themselves personally. Hulya (2011) carried
out a study in Turkey to identify major dimensions of entrepreneurial marketing concept in
boutique hotels and determine to what extent current marketing approaches in boutique hotels
seem to be consistent with the entrepreneurial marketing approaches. The major motivation of
this research was stemmed from the fact that the empirical examination of the notion of
entrepreneurial marketing from the viewpoint of boutique hotels has received scant attention in
the relevant literature. The research was conducted with semi-structured interview method in
nine boutique hotels located in the province of Izmir in Turkey. Based on seven dimensions of
entrepreneurial marketing concept, a unique semi structured interview form was designed.
Results pointed out that entrepreneurial marketing concept which carries great importance for
small and medium hotels has been well adopted and put into effective use by boutique hotels.

19
A study was conducted by Kostis and George (2011) on new pricing strategies on industrial
service and their background. Data collection was conducted through a mail survey from 48
information technology and 129 transportation firms. The initial phase of the survey involved 20
in-depth personal interviews which concluded that penetration pricing and skimming pricing
relate to the company's marketing and corporate strategy and the service characteristics, whereas
conditions of the market influence the adoption of pricing akin to competitive prices.
Different studies have established that price has a significant relationship on business
performance (Colpan, 2006; Owomoyela et al, 2013). Makgoe (2008) argues that location of
SME can have a significant effect on costs. This is because the location of an SME determines
transport and distribution costs that will be incurred in the process of delivering products to
consumers. The implications of distribution cost are that the price of SMEs would be priced
above what consumers can be able to afford and this would have a negative impact on SMEs
(Laljit, 2006). A study by Jones (2010) on entrepreneurial marketing in small businesses in UK
proposed further development of the concept of entrepreneurial marketing towards the concept of
entrepreneurial marketing orientation. Drawing on the earlier research and scales in the
entrepreneurial orientation, market orientation, innovation orientation and customer orientation
literatures, the study proposed a conceptual model for entrepreneurial marketing that identifies
the components of such a model, together with specific indications of the overlap between scales
in the different areas. The study implicitly suggested that marketing in SMEs is intertwined with
other activities and behaviours in the small business enterprise, and argued that in order to
understand marketing in SMEs it is essential to understand its context, specifically in relation to
customer engagement, innovation and entrepreneurial approaches to marketing (Jones, 2010).

20
2.3.3 Product Strategy and Firm Performance
According to Kotler and Armstrong (2006), a product is anything that can be availed to a market
for acquisition, attention, use or consumption that might fulfill a want or a need. Product
strategy is normally conceptualized on the basis of two fundamental decisions. First, product
market scope, which deals with the scope that a firm intends to target broad groups of clients or
to focus more narrowly on a smaller number of segments (Vorhies et al.2009). Second, the value
proposition to be delivered, which concerns the benefit bundle by which business seeks to attract
and retain target clients and attain its strategic objectives (Slater and Olson 2001). Value
propositions contain two core components of product market strategy: the relative superiority of
the business' s product and service offerings, regarding the degree to which a business focuses on
creating superior products and service quality, brand and the performance benefits for target
clients relative to those offered by competitors; and the cost of delivering its products and
services to target customers, concerning the scope to which the business center on actions and
resource deployments that lower the cost of delivering its products and services. Waithata et al
(2014) in a study aimed at determining effects of marketing strategies on the growth of small
businesses in Kenya with reference to Businesses at Kariakor Market in Nairobi. The study
found out that use of various marketing strategies affect the growth of small businesses. The
study recommended that it is not only important that businesses advertise but also be able to
choose the right media to reach as many people as possible. The study acknowledges that word
of mouth could only be effective if the quality of goods is good and that the customers are highly
satisfied.

21
The study established that SMEs establish the right contacts to help the business in its growth
and also create a good and a strong customer base. The business also identifies the best social
media strategy that is easy to use and one that can easily be accessed at very minimal cost.
Clients purchase commodities often, with careful planning and by comparing varieties based on
price, quality and style and thus the physical appearance of product and labeling information can
influence one's decision to buy, (Mohammad et al, 2012). Studies by (Kemppainen & Tinnilä,
2008; Owomoyela et al, 2013) have established that product strategy is associated with business
performance. Product dimensions are an important part of a marketing mix. Leonidou, et al.,
(2002) have studied about marketing strategy: a meta-analysis concerning previous studies. They
synthesized empirical studies about marketing strategy and concluded that product design, brand
mix (name, sign, symbol, design, warranty, and customer service and product advantages) are
variables of product marketing strategy. Tantong, et al., (2010) found that product design
adaptation strategy was positively related to firm performance. Cavusgil and Zou (2004) Lee and
Griffith (2004) observed that better performance of firms can be realised by adapting the product
to meet requirements of export customers. Lages et al. (2004) study showed that product and
service quality were the main determinants and design, brand image, innovation and product
differentiation were found as other determinants. This outcome is the same as previous findings
obtained by Morgan et al., (2004) who revealed that quality of products was major determinant
of a share market.
A study by Miller (2009) found out that new product development strategy influences the growth
of SMEs in many African countries. The study noted that innovativeness contributed to new
product development in many African countries such as South Africa, Nigeria and Kenya. Baker

22
(2008) conducted a study on enterprise success factors in Small and medium enterprises (SMEs)
in Gauteng, South Africa, it was concluded that there is lack of technical and managerial skills in
SMEs.
Kotler (2010) carried out a study on entrepreneurial marketing in USA which identified that
entrepreneurial marketing is based upon how marketing practices becomes more formalized. The
study noted that three stages of marketing practice are identified as organizations grow.
Entrepreneurial marketing is related to the first development phase where the level of
entrepreneurship is high and the degree of formalization of marketing practices is low. Later and
in a more mature stage (second and third stage), marketing practices become formulated
marketing. Kotler (2010) study noted that when small companies achieve success, they
inevitably move toward more formulated marketing Thirkell and Dau, (1998) found that quality
and service have significant and positive correlation with performance of the firm. Also Lages et
al., (2009) investigated a relationship on quality, capabilities, and innovation via a questionnaire
through two types of respondents from the same Portuguese company. They observed that
product quality and product innovation were acknowledged by managers and academics as top
determinants and product innovation and product quality led to enhancement of firm
performance. Haque et al. (2002) in their research on performance of exports and marketing
opportunities of Malaysian ready-made garment products concluded that diversification of
products is very important. Finally, Fizebakhsh, (2002) analysis on a marketing mix showed that
the existence guaranty for quality of products, popularity of brands, product diversification,
packaging and quantity or volume of product production were effective factors that influenced

23
the market share. Lages et al. (2009) suggested that only product innovation had a positive effect
on economic performance in modern international markets.
2.3.4 Place Strategy
"Place" refers to the channels of the distribution used to deliver commodities to customers.
Distribution will be greatly influenced by the product being distributed. For instance, if you own
a small retail shop or provide services to the immediate local community, then you are at the tail
of the distribution chain, and so your supply will be direct to the consumer. Businesses that
assemble or create a product will have two options: direct sale to the consumers or selling to a
vendor.
Producers must decide if direct supply is appropriate for their products or whether sales through
retail, mail order, e-commerce, door to-door services, on-site, or some other method are more
suitable. Direct sales have the added advantage of face to face contacts with customers. With this
face to face contact it’s easy to identify changes in the market and easily adapt to them. Selling
directly is most appropriate at the initial stages of supply or in case the goods are limited or
seasonal. For instance, selling most home-produced commodities can occur through home-based
sales, stands and markets. However, Bowrsox and Closs, (2006), argues that selling directly
demands that the business should have a successful retail interface with customers, which may
be in person or electronic. The decision of where a firm should sell its products is the question
raised under the P of place of the marketing mix. Place strategies can be classified as exclusive,
selective, and intensive, which are connected to what kind of image a company wants to have.
Exclusive means few places and selling only one brand. Selective is the middle way, where the

24
products are sold at selected places that could be outside the company but with high
collaboration between the two parties. Intensive strategy is just a matter of being visible and
available everywhere and is most used by low-price/high-volume strategies (Parment, 2008).
According to Jones, (2007) place is any way through which a customer can obtain a product or
receive a service. This according to Bowersox and Closs (2006) has been described as the
distribution system of any product. This according to them is the third component that forms up
the marketing mix, and relates to the process of making the products available to consumers.
Kotler and Armstrong (2006), defines place strategy as a strategy that focus on making product
available through establishing effective distribution channels for products. Place strategy has
been established by Owomoyela et al, (2013) to be having significant effect on business
performance. Place has an influence on the marketing strategies of SMEs. This is because SMEs
operate in global, regional and local environments which have an impact on their growth.
According to Diale (2008) SMEs performance is related to its location and it comes with cost
implications on social, technological, economic and political factors.
2.4 Business Performance
The measure of business performance is a critical issue to business practitioners and various
scholars; with the general agreement that business performance refers to the operational ability
of firms to meet the aspirations of investors and owners. Business performance is measured by a
number of indicators such as profit, return on investment (ROI), turnover or number of
customers, design quality and product improvement (Wood, 2006). On a different note Franco
Santos et al. (2007) proposes that business performance can be measured through business

25
performance system with the system categorizing business performance into operational business
performance and strategic business performance. This system consists of performance
measurement of an organization at high or low level and has even been applied to the
measurement of small and medium business. This is because the system makes use of both
quantitative and qualitative research methods (Gruber et al., 2010).
The measurement of performance of SMEs has not been without difficulty since SMEs are
always reluctant to publicly reveal their actual performance and this has raised the question on
performance measures that can be used in SMEs. Measurement of SME performance is usually
challenging and fraught with difficulties. This is for reason that the performance measurement
tools were designed for use in large firms and not small firms. Due to challenges associated with
objective performance there has been a shift to both objective and subjective measures of SMEs
performance. There are a number of studies that have shown bias towards the use of subjective
measures for assessing business performance. This has been attributed to lack of financial data or
even in cases where data is available the data may not fully reflect the true position of the SMEs.
As a result subjective measures have been found to be an effective way to analyze business
performance since they allow comparison of firms within their context. This allows practitioners
and managers to compare their firms with other firms in their industries (Song et al., 2005).
Due to incompatibility of available data with analysis required, many researchers have opted to
turn to subjective measures to enable the understanding of firm’s condition (Kim, 2006). Another
difficulty in the use of objective performance measurement of SMEs emanates from the fact that
performance measurement may be misleading if only objective measures are used. This is

26
because firms may be measured to be performing poorly and this may not be the cause due to
their commitments such as research and development.
2.4.1 Performance Measurement in SMEs
Based on Garengo et al. (2005), there are eight previous PMS models that have been widely
used. These models include: Performance measurement matrix; Performance pyramid system;
Performance measurement system for service industries; Balanced Scorecard; Integrated
performance measurement system; Performance Prism (Neely, et al., 2002); Organizational
Performance measurement (Chennell et al., 2000) and Integrated Performance measurement for
small firms. The last two performance measurement models are commonly used in SMEs.
Organizational Performance measurement was developed specifically for SMEs and is based on
three principles: Alignment, i.e. the selected performance measures support the alignment
between people’s actions and company strategy; Process thinking, i.e. the measurement system
makes reference to the process of monitoring, control and improvement systems; and
practicability, i.e. at any level in the company there is a consistent process for identifying
measures that should be considered and for ensuring the quality and suitability of data(Song et
al., 2005).
Integrated Performance Measurement for Small Firms is specifically designed for SMEs. It is
based on seven main dimensions of measures, classified as two external dimensions (financial
performance and competitiveness) and five internal dimensions (costs, production factors,
activities, products and revenues) that are connected by a causal chain. The internal dimensions

27
are used to monitor the whole production process, and the external dimensions are used to
monitor the company’s position in its competitive context (Neely, et al., 2002).
Analyses of these models show that performance measurement must be aligned with strategy
(Balance Score Card, Results and Determinants, Performance measurement Matrix, Performance
Prism, Performance pyramid) and have multi-dimensional measures (BSC, Results and
Determinants). The multi-dimensional measures are particularly important and help to overcome
the limitations of traditional performance measurement systems that only focus on the financial
dimension. In this study performance will be measured through growth in terms of size of the
firm, branches the firm establishes, market share/customer base (Miller, 2009).
2.4.2 Marketing Strategy and Business Performance
In the formulation of an effective marketing strategy, there are several forces that affect the
performance of business. However, previous studies have indicated that the use of marketing stra
tegy delivers a significant effect on the performance of firms. The effect of marketing strategy on
performance of business differs depending on the nature, size and environment of the business.
Thus marketing strategy benefits to business performance have been felt on sale volume,
profitability, and market share that it created. Through measurement on the three areas business
can create a marketing strategy that increased impact on sales, profitability or market share.
Significantly, business engage in marketing strategy in order to avoid the effects of the
recessions since the aim of any business is to survive in face of existing competition. Firms that
value the importance of marketing in their system are proactive and develop marketing strategy
28
which takes the form of marketing segmentation, positioning and branding, and marketing
communications (Jones, 2010).
The effects of the marketing strategy, according to the previous studies, can be reflected on the
firm’s performance. The appropriate marketing strategy relevantly creates impact in making
process towards the competence and develops a relationship in the organizational culture (Sung-
Joon and Sung-Ho, 2005). The benefits of the marketing activities in the business reflect in the
strength of the industry to eliminate or at least minimize the effects of various challenges. The
influence of marketing activities can be part of the culture of the organization and can be the
basis for actions that the leaders will create in the future (Krohmer, Homburg, and Workman,
2002).
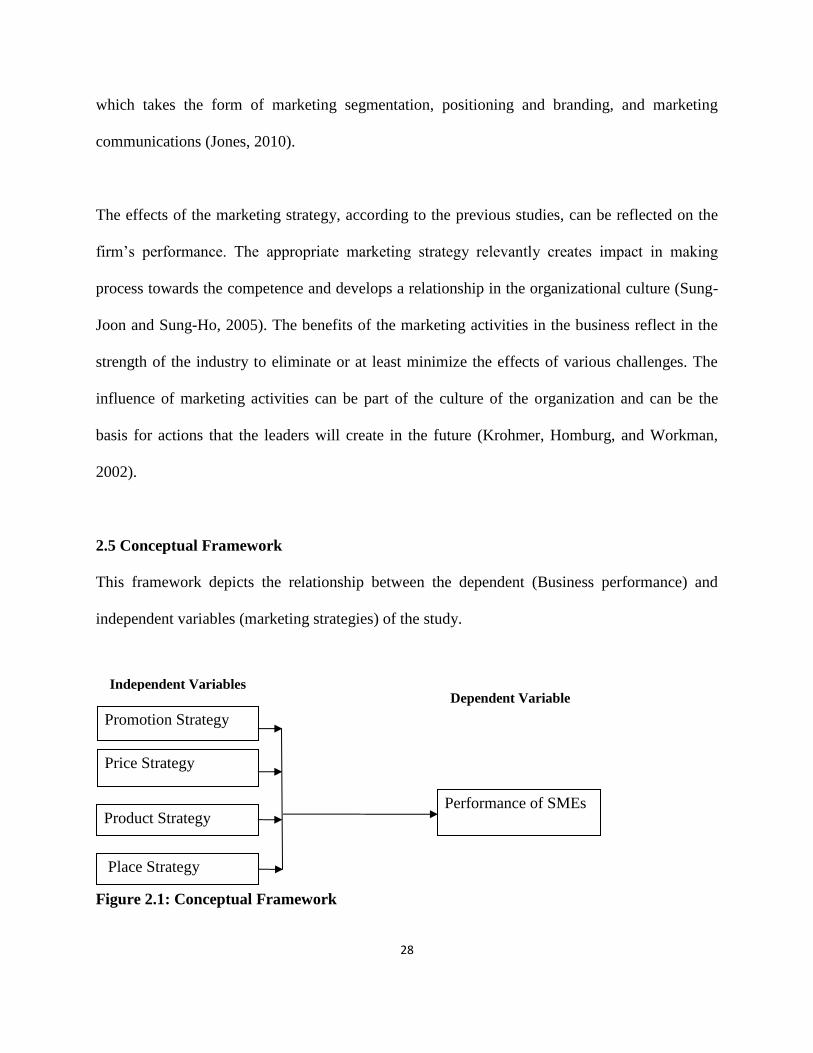
2.5 Conceptual Framework
This framework depicts the relationship between the dependent (Business performance) and
independent variables (marketing strategies) of the study.
Figure 2.1: Conceptual Framework
Promotion Strategy
Performance of SMEs
Independent Variables
Product Strategy
Price Strategy
Dependent Variable
Place Strategy

29
2.6 Operationalization of Variables
The variables of this study were operationalized as per table 2.1 below:
Table 2.1: Operationalization of Variables
Variable Measurement
Promotion
Marketing Strategy
Effect of special offers of the products on performance of SMEs.
Impact of billboards and other promotional materials on SME
performance.
Effect of product branding on business performance of SMEs
Effect of social media marketing on SMEs performance.
Price Marketing
Strategy
Impact of setting the same prices as competitors on the
performance of the business.
Whether lowering of the prices can lead to better long term SME
performance.
Whether allowing customers to negotiate prices is good for the
performance of businesses.
Effect of discounting prices of different products occasionally on
business performance enhancement efforts.
Product Marketing
Strategy
Whether introduction of new products periodically is good to the
business.
Whether stocking of diversified products can increase the revenue
of a business.
Perceived effect of concentration on only one main product.
Perceived effect of packaging to the appeal of the product, and
hence its demand.
Place Marketing
Strategy
Whether use of innovative distribution channels has a positive
impact on business performance.
Perceived implications of business location on its success.
Whether direct sales have a noticeable impact on business
performance in SMEs.
Whether use of a variety of distributors affects SMEs
performance.
Business
Performance
Profitability.
Operations efficiency.
Business development.
Customer growth.

30
2.7 Research Hypothesis
The research tested the following four null hypotheses in a bid to provide a solution to the
research questions:
H01: Promotion marketing strategy does not affect business performance of SMEs in Kitengela.
H02: Price marketing strategy does not affect business performance of SMEs in Kitengela.
H03: Product marketing strategy does not affect business performance of SMEs in Kitengela.
H04: Place marketing strategy does not affect business performance of SMEs in Kitengela.

31
CHAPTER THREE
METHODOLOGY
3.1 Introduction
This chapter describes the methodology that was used and the areas focused on in the study. It
includes: research design, target population, sampling size and techniques, data collection,
reliability and validity analysis, and data analysis.
3.2 Research Design
The research used a descriptive research design because it provides an accurate estimation of the
association between market strategies and the performance of SMEs in Kitengela (Creswell,
2003). This design also allows the researcher to collect both quantitative and qualitative
information that captures information on the demographic characteristics of the population
studied within a short time and at minimal cost.
3.3 Population of the Study
According to the National Chamber of Commerce (2015), there are 62 SMEs operating within
Kitengela Town’s Central Business Dustrict. These SMEs formed the target population of the
study. The unit of study were the owners, managers, or senior staff of these SMEs. These three
categories of staff were targeted because they could provide insightful information required to
meet the research objectives. The SMEs selected for this study were drawn from the following
categories: hardware shops, motor vehicle repairs, hotels, general retail shops, baby care shops,
wholesale shops, supermarkets, small scale manufacturers, and others (e.g. bars, restaurants etc).

32
Table 3.1: Target Population
Business Type Frequency
General Retail Shops 7
Hardware Shops 15
Wholesale Traders 4
Baby Care Firms 2
Supermarkets 5
Hotels 11
Motor vehicle Repair Shops 10
Manufacturing Firms 3
Others 5
Total 62
Source: Kajiado County, Chamber of Commerce
3.4 Sampling Design
A Census approach was used to assess the target population of this study, i.e. data was collected
from all the targeted (62) SMEs in Kitengela Township since they were not very many Three
respondents were selected from each SME using a purposive approach to bring the total sample
size to 186 respondents. Participating respondents from each SME were selected purposively
because it allowed the researcher to select respondents who were able to provide information that
could meet the objectives of the study. In addition, this sampling procedure was used to
minimize costs and time wastage in data collection.

33
Table 3.2: Study Sample
Business Type Frequency Sampled Respondents
General Retail Shops 7 21
Hardware Shops 15 45
Wholesale Traders 4 12
Baby Care Firms 2 6
Supermarkets 5 15
Hotels 11 33
Motor vehicle Repair Shops 10 30
Manufacturing Firms 3 9
Others 5 15
Total 62 186
3.5 Data Collection
The study used primary data obtained from the owners and staff of SMEs. The data was
collected using a semi-structured questionnaire through a face to face interview. The
questionnaire was divided into sections based on the objectives of the study. The questionnaire
method was adopted because it allows data to be collected from many respondents within the
shortest time possible thus minimizing costs and time. Primary data on the impact of the
marketing strategies on business performance of SMEs was obtained from management staff and
owners using a structured questionnaire. Management/Owners were purposively selected to
provide data because they deal with policy formulation.
Questionnaire was developed from the review of literature related to the study variables and
comprised six sections: Section A contained questions to capture general information of the
respondents and SMEs while Section B comprised of questions on promotion Marketing Strategy
and Business Performances. Section C comprised of questions on price Marketing Strategy and
business performance. Section D focused on product market strategy and business performance

34
while Section E focused on place marketing strategy and business performance and Section F on
Business Performance of SMEs.
3.6 Reliability and Validity
Reliability is the degree of consistency and precision in which the measuring of the instrument
demonstrates under same circumstances, same research respondents using the same instrument
and should generate the same results under identical conditions (Amin, 2005). In determining
reliability of the instrument, the researcher carried out a pilot study among 20 SMEs in the
neighbouring Isinya town. This was to help in finetuning the research instrument and improving
its utility in collecting data for the actual study. Validity is an indication of how sound the
research will be. The validity of the instrument was measured using the content validity, which
refers to the ability of the instrument to cover all possible aspects of the research topic. To ensure
content validity of the research instrument the researcher incorporated the opinion of research
experts and his supervisor in designing the questionairre.
3.7 Data Analysis and Presentation
Data collected was cleaned to check for completeness and consistency before final analysis was
conducted. Complete data were then coded and entered into Statistical Package for Social
Sciences and analyzed. The data collected was analyzed using descriptive statistics and presented
through charts, tables, frequency distribution and percentages. The study used a multivariate
regression model to determine the relationship between the dependent and the independent
variables. The dependent variable in the study was the performance of SMEs while independent
variables were the marketing strategies which comprise the marketing mix.

35
The multivariate regression model for this study was:
Y= α + β1X1 + β2X2 + β3X3+ β4X4 + e ………………………………………………………….(i)
Where:
Y= the dependent Variable (performance of SMEs)
α = Constant term for the independent variable
B1 = Coefficient of X1
X1 = Promotion Market Strategy
B2 = Coefficient of X2
X2 = Price market strategy
B3 = Coefficient of X3
X3= Product market strategy
B4 = Coefficient of X4
X4= Place market strategy
e = The error term

36
CHAPTER FOUR
FINDINGS AND DISCUSSION
4.1 Introduction
This chapter focuses on the analysis of the data collected from the field as well as the discussions
of the findings. The results of the study are based on the general objective of the study which
was to assess the impact of marketing strategies on the performance of the SMEs. The results of
the study are presented in both tabular and graphical formats.
4.2 Response Rate
Out of the 162 sampled respondents, 149 respondents returned duly filled questionnaires. This
means that the response rate of the study was 91.97%. According to Mugenda and Mugenda
(2003) a 50% response rate is adequate, 60% good and above 70% rated very well. Kothari
(2004) also asserts that a response rate of 50% is adequate, while a response rate greater than
70% is very good. As such, the response rate of this study was deemed satisfactory.
Table 4.1 Response Rate
Response Rate N %
Returned 149 91.97%
Not Returned 13 8.03%
Total 162 100%
4.3 Demographic Characteristics of the Respondents
This section describes the general demographic information of the respondents as derived from
the analysis of the study’s data.

37
4.3.1 Gender of the Respondents
As shown in Table 4.2 below, of the 149 respondents, 52 were female and 97 were male. This
accounts for 35% and 65% of the total respondents respectively. This finding is in line with the
general societal trend that most senior staff in SMEs are men.
Table 4.2: Gender of the Respondents
Gender of Respondents N %
Male 97 65%
Female 52 35%
Total 149 100%
4.3.2 Age of the Respondents
The respondents were distributed across various age brackets as evident in table 4.3 below.
Majority (42%) of the respondents were aged between 36 and 50 years. People aged below 35
years made 38% of all the respondents and 16% were between 51 and 65 years. Only 5% were
above 65 years
Table 4.3: Age of the Respondents
Age N %
Below 35 Years 56 38%
36-50 Years 62 42%
51-65 Years 24 16%
Above 65 Years 7 5%
Total 149 100%
4.3.3 Highest Level of Education Attained
Table 4.4 below shows the distribution of respondents based on the highest level of education
attained. It can be seen from the results that majority of the respondents (44%) had upto high
school education, 34% had upto diploma education, and 20% had upto degree level of education.

38
Very few respondents (2%) had only primary education and only 1% had postgraduate
education.
Table 4.4: Highest Level of Education Attained
Highest level of education N %
Primary 3 2%
Secondary 65 44%
Diploma 51 34%
Degree 29 20%
Postgraduate 1 1%
Total 149 100%
4.3.4 Position in the Business
Among the respondents, 41.61% were owners of the businesses, 36.91% were managers, and .
21.48% of the respondents were employees.
Figure 4.1: Position in the Business

39
4.3.5 Types of Businesses
Various businesses were represented. Majority (31%) of the sampled SMEs were hardware
shops, 20% were supermarkets, 16% were motor vehicle repairs, 15% were hotels, 8% were
general retail shops, 2% were manufacturing firms; both baby care and wholesale firms
accounted for 1% of total firms while 6% were others (e.g. bars, restaurants, clinics etc).
Figure 4.2: Types of Businesses
4.3.6 Form of Business Ownership
The study queried the form of ownership of the sampled SMEs in Kitengela. Most businesses
(68%) were under the sole proprietorship form, 15% were family businesses, 13% were jointly
owned (partnerships) businesses, and 3% were Limited Liability Company (Table 4.5). This
indicates that sole proprietorship is still the common form of ownership among SMEs.
31%
20%16%
15%
8% 6%
2% 1% 1%
0%
5%
10%
15%
20%
25%
30%
35%

40
Table 4.5: Form of Ownership
Form of ownership N %
Sole proprietorship 101 68%
Family business 23 15%
Partnership 20 13%
A limited liability company 5 3%
Total 149 100%
4.3.7 Number of Years the SMEs has been in Operation
The study further established that 97% of the SMEs had been in operation for between more than
three years. Among them, 36% had been in existence for between 6 and 7 years, 34% had been
operational for between 3 and 5 years, while 27% had existed for more than seven years. Only
3% had been operating for two or less years (Figure 4.3).
Figure 4.3: Number of Years the SMEs has been in Operation
36%
34%
27%
3%
Six to seven years
Three to five years
Above seven years
One to two years

41
4.4 Independent Variables
This part discusses the results which were obtained after collecting information on each of the
four independent variables using a 5 point likert scale.
4.4.1 Promotion Marketing Strategy and SMEs Performance
Promotional marketing involves provision of special offers for products, advertisements through
billboards, flyers and posters, product branding and use of social media to promote business
products. Table 4.6 below gives the results of promotional marketing. The respondents strongly
agreed that giving special offers and using billboards & other similar media has a positive impact
on business performance. The respondents were also of the idea that product branding and use of
social media is beneficial to performance improvement efforts.
Table 4.6: Promotional Marketing Strategies
Statement Mean SD
Special offer of the products tend to improve the performance of
SMEs.
1.74 .933
Billboards and other promotional materials have a considerable
effect on SME performance.
1.74 .775
Product branding can lead to increased business performance in
SMEs
1.86 1.000
Social media marketing enhances SME performance. 1.87 .949
4.4.2 Price Marketing Strategy and SMEs Performance
Pricing is another marketing strategy that influences SME performance. Individual pricing
strategies such as setting same product prices as competitors, lowering product prices,
negotiating prices, discounting prices, and setting different prices for different products were
considered. According to table 4.7 below, the respondents’ perceptions were that setting same
prices for products as competitors increases sales. They also agreed that lowering prices had

42
increased business market share and allowing customers to negotiate prices had also increased
sales. They also agreed that provision of discounted prices for products had increased sales.
Table 4.7: Price Marketing Strategies
Mean SD
Setting the same prices as competitors can impact the
performance of the business positively.
2.17 1.229
Lowering of the prices can lead to better long term SME
performance.
2.40 1.179
Allow customers to negotiate prices is good for the performance
of our business.
2.53 1.160
Discounting prices of different products occasionally is helpful
to our business performance enhancement efforts.
2.46 1.194
4.4.3 Product Marketing Strategy and SMEs Performance
The study further sought to find out respondents views on the effects of product marketing
strategies such as introduction of new products, diverse products, having a main product and
improvement on the product appearance on the performance of the SMEs. The respondents
agreed that the introduction of new products would lead to increased sales. They also agreed that
diversified products have allowed the business to increase its revenue, concentration on one main
product would not be beneficial to the firm, and that the product packaging is key to the appeal
of the product, and hence its demand.
Table 4.8: Product Marketing Strategies
Mean SD
Introduction of new products periodically is good to the business 2.84 .994
Diversified products have allowed the business to increase its
revenue
2.58 1.146
Concentration on one main product would not be beneficial to
the firm
2.46 1.087
The product packaging is key to the appeal of the product, and
hence its demand.
2.45 1.093

43
4.4.4. Place Marketing Strategy and SMEs Performance
The study established the influence of place marketing strategies on the performance of the
SMEs. Respondents were required to show their level of agreement on a 5 point likert scale
(where 1 represented “strongly agree” and 5 represented “strongly disagree”) with the following
place marketing strategies: use of innovative distribution channels has a positive impact on
performance, the business location has implications on its success, direct sales have a noticeable
impact on business performance in SMEs; and use of a variety of retailers affects SMEs
performance.
The results, as shown in table 4.9 below, showed that largely, the respondents either agreed or
were weakly in agreement with the propositions that use of innovative distribution channels,
location of business, direct sales and use of variety of retailers as place marketing strategies had
led to improved business performance.
Table 4.9: Place Marketing Strategies
Mean SD
Use of innovative distribution channels has a positive impact on
performance
2.70 .912
The business location has implications on its success 2.81 1.184
Direct sales have a noticeable impact on business performance in
SMEs.
2.86 1.180
Use of variety of retailers affects SMEs performance 2.71 1.129
4.5 Dependent Variable: SMEs’ Business Performance
The business performance of the SMEs was the dependent variable of this study. The responses
received with respect to the likert statements which were in respect to this variable are

44
summarized in table 4.10 below. It is quite plain that the respondents were in agreement on the
essence of implementing marketing strategies as a ploy of increasing the performance of their
businesses.
Table 4.10: SMEs’ Business Performance
Mean SD
The business has performed well in the recent past 1.74 .933
I have practically witnessed the impact of a marketing strategy
in my business
2.84 .994
I intend to roll out more marketing campaigns in the future 2.46 1.194
There are some marketing strategies which are more suited for
my type of business than others
2.71 1.129
4.6 Validity and Reliability Analysis
Since the study was designed carefully using the descriptive research design approach, we can
infer that the findings can be generalized throughout SMEs and hence they have external
validity. Construct validity can be inferred from the fact that most of the regressors were
significant and the overall regression model, as indicated in the ANOVA table, was also
significant.
To measure the reliability of the data collection instruments an internal consistency technique,
the Cronbach's alpha, was computed using SPSS. Table 4.11 below indicates that the research
instrument was reliable since data obtained from all independent variables had a Cronbach’s
alpha of greater than 0.7. This means that the research data had relatively high internal
consistency and could be generalized to reflect opinions of all possible respondents in the target
population on the impact of marketing strategies of SMEs business performance in Kitengela.

45
Table 4.11: Reliability Analysis
Variable Cronbach’s Alpha Comments
Promotion Strategy 0.851 Acceptable
Price Strategy 0.874 Acceptable
Product Strategy 0.886 Acceptable
Place Strategy 0.832 Acceptable
4.7 Regression Analysis and Related Procedures.
This part discusses regression analysis and procedures related to it which were carried out on the
data. These procedures include OLS regression and use of line of good fit.
4.7.1 OLS Regression Analysis
In order to quantify the relationship between the independent variables and the dependent
variable, the researcher undertook an ordinary least squares regression analysis. Table 4.12
below shows the results of the regression analysis.
Table 4.12: Regression Analysis
Model
Unstandardized
Coefficients
Standardized
Coefficients
t Sig. B Std. Error Beta
1 (Constant) .075 .040 1.875 .063
Promotion Strategy .211 .047 .185 4.497 .000
Price Strategy .125 .094 .132 1.330 .185
Product Strategy .173 .059 .205 2.939 .004
Place Strategy .449 .064 .493 6.986 .000
a. Dependent Variable: Business Performance of SMEs
Source: Author (2015)

46
The regression analysis table shows that all the regressors had a positive impact on business
performance of SMEs. Additionally, all independent variables, except the price strategy, were
significant. Equation i can therefore be restructured as:
Y = 0.075 + 0.211X1 + 0.173X3+ 0.449X4………………………………………...(ii)
Where:
Y = Business Performance
0.075 = Constant Y-Intercept. This represents the level of Business Performance of the
Study SMEs taking other factors of the study at zero.
X1 = Promotion Strategy
0.211 = Coefficient of X1 (change in Business Performance due to a unit change in
Promotion Strategy)
X3= Product Strategy
0.173 = Coefficient of X3 (change in Business Performance due to a unit change in
Product Strategy)
X4= Place Strategy
0.449 = Coefficient of X4 (change in the Business Performance due to a unit change in
Place Strategy)
Independent variable X2 was omitted from the final model since its impact on the dependent
variable (Y) is not significant. This is because its p value is more than 0.05.
4.7.2 Model Goodness of Fit
Table 4.13 below shows the R2 of the model as 0.684. This is an indication of a strong goodness
of fit of the study data to regression analysis as the empirical model. The value of the R2 means

47
that 68.4% of the variability in the dependent variable (SMEs’ business performance) can be
explained by variability in the firm’s price strategy, product strategy, place strategy, and
promotion strategy. The remaining 31.6% of variability can be attributed to other factors that are
not included in the model.
Table 4.13: R Square
Model R R Square Adjusted R Square Std. Error of the Estimate
1 .692a .684 .683 .11311
a. Predictors: (Constant), Place Strategy, Promotion Strategy, Product Strategy, Price Strategy
4.7.3 Analysis of Variance (ANOVA)
The ANOVA Table is used to indicate whether the overall regression model is significant or not.
Since the p – value of this study’s Analysis of Variance was less than 5% (See table 4.14 below),
we can deduce that the regression model was significant.
Table 4.14: Analysis of Variance
Model Sum of Squares df Mean Square F Sig.
1 Regression 110.177 4 27.544 2152.861 .000a
Residual 1.842 144 .013
Total 112.019 148
a. Predictors: (Constant), Place Strategy, Promotion Strategy, Product Strategy, Price Strategy
b. Dependent Variable: Performance of SMEs
4.7.4 Hypothesis Testing
Going by the results outlined in the regression table, we can see that except price strategy, all
other independent variables were significant.

48
H01: Place marketing strategy does not affect business performance of SMEs in
Kitengela.
H02: promotion marketing strategy does not affect business performance of SMEs
in Kitengela.
H03: price marketing strategy does not affect business performance of SMEs in
Kitengela.
H04: product marketing strategy does not affect business performance of SMEs in
Kitengela.
Therefore the conclusion is to reject hypothesis one, two, and four and do not reject hypothesis
three.

49
CHAPTER FIVE
SUMMARY OF FINDINGS, CONCLUSIONS AND RECOMMENDATIONS
5.1 Introduction
This chapter presents a summary of research findings, conclusions and recommendations on the
impact of marketing strategies on business performance of SMEs in Kitengela Township.
5.2 Summary of Findings
The study sought to investigate the impact of marketing strategy on firm performance of small
and medium enterprises in Kitengela Township, Kajiado County, Kenya. Specifically, the study
addresses the following objectives: To determine the impact of promotion strategy on the
business performance of SMEs in Kitengela, to determine the impact of pricing strategy on the
business performance of SMEs in Kitengela, to determine the impact of product strategy on the
business performance of SMEs in Kitengela, and to determine the impact of place strategy on
business performance of SMEs in Kitengela. The study established findings concerning the
objectives as follows:
Concerning the objective on promotion marketing strategies, the study generally established that
most respondents strongly agreed that promotional strategies affect business performance while a
small number of the respondents voiced dissenting opinions. The study results also revealed that
there was a significant relationship between promotional marketing strategies and SME
performance. The strength of this significance was established to be strong as indicated by the p-
value of 0.00. This result affirms to the use of various promotional avenues as tools to enhance
the business publicity of SMEs. On the objective of pricing marketing strategy, the study sought

50
to find out the effect of pricing strategies such as setting same product prices as competitors,
lowering product prices, allowing customers to negotiate prices, and offering discounted prices
on SME performance. The study findings indicated that the respondents agreed, albeit weakly,
that price marketing strategies would influence business performance positively. However, the
study findings, as evidenced by the p – value of 0.185, indicated that the relationship between
price marketing strategies and business performance of SMEs is not significant. Nevertheless,
these findings corroborate with the proposition that any SME in its inception or in introduction
of new products must consider their price penetration strategy as suggested by Ogunmokun
(2004). The insignificant relationship between price marketing and business performance of
SMEs provides an indication to the reason that, SMEs may be having loyal consumers such that
reduction in price doesn’t necessarily implies customer growth or increased business
performance. These findings are similar to the results of Chiliya and Roberts (2009). They also
bear some semblance with Muthee and Ngugi (2014) who established that price marketing
strategy positively impacts on the growth of SMEs.
On product marketing strategies the respondents weakly agreed that the introduction of new
products increased sales. The respondents also agreed that diversified products had allowed the
business to increase its revenue. Further, they agreed that concentration on one main product
would not be beneficial to their organizations. The study results indicated that most of the
respondents agreed that product marketing strategies influences business performance. The study
results also revealed that there was a positive and significant relationship between product
marketing strategies and SME performance. This was indicated by a p-value of 0.004. The strong
importance that respondents attached to the product marketing strategy alludes to the fact that all

51
marketing revolves around the product. This finding also validates the belief that the product
consideration is quite impactful on business performance in terms of profitability and market
share with this being attributed to the reason that customers do really look at product attributes
such as quality, features, design and style. These findings align themselves with the findings of
Muhammad, et al, (2011) and Adewale (2013) who established a positive relationship between
product marketing and business performance. Finally, on the objective on the effect of place
marketing strategies on business performance, the results of the study showed that majority of
the respondents agreed that place marketing strategies influences SME business performance. A
minor number of respondents were undecided, strongly agreed, disagreed or strongly disagreed.
The study results concluded a positive and significant relationship between place marketing
strategies and SME performance. Place considerations, i.e. the location, accessibility and
channels of distribution employed by the business were also highlighted as major concerns for
owners of businesses as far as strategic positioning is concerned. These results corroborate the
findings of Mahmoud (2011) who found out that place marketing strategy is the second most
important strategy that affect business performance of SMEs after product marketing strategy.
5.3 Conclusion
This study validates previous scholars’ assertions about the relationship between market
strategies and SME performance with a focus on the SMEs sector in Kenya. Despite the lack of
agreement on the most effective marketing strategy that SMEs can use, the study demonstrates
that, place marketing strategy, product marketing strategy, price marketing strategy and
promotion marketing strategy when applied will positively influence the growth of SMEs.
Marketing will function effectively only when there is commitment from the management. The

52
SMEs can easily bring in the innovative marketing practices as they don’t have layers between
the decision makers and the people who implement these decisions. The SMEs need to formulate
their goals clearly and then evaluate the various marketing strategies alternatives on the basis of
their capabilities and resources.
It can be concluded that SMES need to give importance to the location of their business as place
marketing strategy influences the distribution of product from the sellers to the consumers and
even suppliers. It can also be deduced that SMEs need give heed to penetration pricing strategy a
key component of price marketing strategy. This is because most of the SMEs were of the view
that lowering prices can have desired effects on business performance. Conclusively, it can be
argued that place marketing strategies have the biggest impact on the business performance of
SMEs, since this regressor had the largest coefficient. Thus SMEs are advised to seek strategic
locations and make smart choices with respect to their distribution channels and other aspects of
the place strategy.
5.4 Recommendation
There is need for SMEs to increasingly innovate and adopt marketing strategies that have the
highest impact on their business and can achieve such impact with the lowest cost possible.
There is need for SMEs to pay more attention to business locations and other aspects of the place
strategy, their promotion strategies, and product development strategies as the key areas of focus.
Nevertheless, SMEs should pay attention to the 4P’s marketing mix since the combined effect of
the components of the marketing mix provides higher business performance. They should
continually innovate on their 4Ps marketing strategies. SMEs should increasingly use social

53
media in their marketing attempts since it harmonizes relationships and networking market
strategies. Other types of marketing strategies such as promotion market strategy have the
potential to offer SMEs great benefits.
5.5 Areas for Further Research
There is need for more studies that will focus on the impact of marketing strategies on business
performance of SMEs in various sectors. There is also need for more studies at national level to
fully understand the impact of marketing strategies on business performance of SMEs thus
providing conclusive evidence.

54
REFERENCES
Asgar A, Hossein A, Mohammad H. (2013). Market Orientation and Business Performance
among SMEs Based In Ardabil Industrial City-Iran: Journal of Business and
Management Review, 2(7)
Bala, S. M. H. (2009). Nuture and Strategy of Product Innovations SMEs: a Case Study-Based
Comparative Perspective of Japan and India. Journal of Innovation, Management, policy
& practice, 11 (1): 104.
Blankson, C. and Cheng, J.M.S. (2005). “Have Small Businesses Adopted the Market
Orientation Concept? The Case of Small Businesses in Michigan”, Journal of Business
and Industrial Marketing, 20, 6, 317-30.
Colpan, A. M. (2006). Dynamic Effects of Product Diversity, International Scope and Keiretsu
Membership on the Performance of Japan’s textile firms in the 1990s: Asian Business
and Management, 5(3), 419-445.
Darroch, J. M., Morgan, P., Jardine, A. & Cooke, E. F. (2004), “The 2004 AMA Definition of
Marketing and its Relationship to a Market Orientation
Diale, A. J. 2008. Government support for small, micro and medium enterprises (SMME’s) as a
venture for business and economic development in South Africa, Research Paper.
Franco-Santos, M., Kennerley, M., Micheli, P., Martinez, V., Mason, S., Marr, B., Gray, D. &
Neely, A. (2007). Towards a Definition of a Business Performance Measurement
System. International Journal of Operations & Production Management, 27(8): 784-
801.
Gbolagade Adewale, Adesola A, Oyewale .O. (2013). Impact of Marketing Strategy on Business
Performance: A Study of Selected Small and Medium Enterprises (SMEs) Journal of
Business and Management (IOSR-JBM). Volume 11(4)
Goi, C. L. (2005). Marketing Mix: A Review of 3Ps: Journal of Internet Banking and
Commence, Vol. 10 No 1
Gruber, M, Heinemann, F., Brettel, M. & Hungeling, S. (2010). Configurations of Resources and
Capabilities and their Performance Implications: An Exploratory Study on Technology
Ventures. Strategic Management Journal, 31(12): 1337-1356.
Jaworski, B. J., & Kohli, A. K. (1996), “Market Orientation: Review, Refinement and
Roadmap”, Journal of Market Focused Management, 1(12).
Jones .S (2007), Exploring corporate strategy: Text & Cases 8th Edition.

55
Kemppainen, K., Vepsäläinen, A & Tinnilä, M. (2008). Mapping the Structural Properties of
Production Process and Product Mix: International Journal of Production Economics.
111(2), 713-728.
Ken, H, Nguyen, T. M. and Ping, H. 2007. The Effects of Entrepreneurial Orientation and
Marketing Information on the Performance of SMEs, Journal of Business Venturing, 22
(4): 592-611.
Kim, S. W. (2006b). Effects of supply chain management practices, integration and competition
capability on performance. Supply Chain Management: An International Journal, 11(3):
241-248.
Kotler, P. and Armstrong, G. (2006). Principles of Marketing, New Jersey, Pearson Education
Inc., 10th Edition
Kotler P (2007). Marketing: An introduction, New Jersey: Pearson Education Inc.
Laljit, C.R. (2006). The Business Strategy Development among SMMEs in the Kwa Zulu Natal
Clothing Manufacturing Sector. Unpublished MBA Dissertation, Durban University of
Technology.
Long- Yi .L & Ya-Huei.C.(2012). The Impact of New Product Marketing Strategy on New
Product Performance: The Moderating Effects of Competitive Intensity and Product.
Research Paper.
Meerman, D. (2010). “The New Rules of Marketing & PR”,2a Edn, Wiley, Estados Unidos de
América, New Jersey.
Mohammed A. (2011). Market Orientation and Business Performance among SMEs in Ghana,
International Business Research Vol. 4, No. 1; January 2011.
Owomoyela S.K, Oyeniyi K.O & Ola O.S, (2013).Investigating the impact of marketing mix
elements on consumer loyalty: An empirical study on Nigerian Breweries Plc.
Interdisciplinary Journal of Contemporary Research in Business. 4 (11), 485 –496.
Powpaka S. (2006). How Market Orientation Affects Female Service Employees in Thailand.
Journal of Business Research, 59(3)
Ruben J (2012). Managing after Sales Services: Strategies and Inter Firm Relationships. PhD
Thesis of Diph-Kfm Technic., University.
Saccani, N., Johansson, P. & Perona, M. (2007). Configuring the After-Sales Service Supply
Chain: A Multiple Case Study: International Journal of Production Economics, 110(1-
2), 52-69.

56
Sajuyigbe A.S, Ayanleke S.O and Ola O.S. (2013). Impact of Packaging on Organizational Sales
Turnover: A Case Study of Patterzon Zoconist Cussons (pz) Plc, Nigeria:
Interdisciplinary Journal of Contemporary Research in Business. 4 (11), 497 – 508.
Smile D, Ofosu D (2014), Marketing Strategies and the Performance of SMEs in Ghana:
European Journal of Business and Management, Vol.6, No.5, 2014
Smith, R. (2008). Some Reflections on the Dynamic of Village Entrepreneurship: International
Journal of Entrepreneurship and Small Business, 6 (3): 370-389.
Song, M, Droge, C., Hanvanich, S. & Calantone, R. (2005). Marketing and Technology
Resource Complementarity: An analysis of their interaction effect in two environmental
contexts. Strategic Management Journal, 26(3): 259-276.
Sousa, S. D., E. Aspinwall, et al. (2006). "Performance Measures in English Small and Medium
Enterprises: Survey Results." Benchmarking: An international Journal 13(1/2): 120-134.
Stokes, D. and Chen, H. 2009. Small Business and the Environment: Turning over a New Leaf.
Business Strategy Environment, 19 (5): 273-288.
Van Scheers, L. and Radipere, S. 2008. Gathering Perceptions of Soweto Small Business Owners
on Advertising in Black Townships in South Africa: Journal for Global Business
Advancement, 1 (4): 445-458.
Wood, E. H. (2006). The Internal Predictors of Business Performance in Small Firms. Journal of
Small Business and Enterprise Development, 13(3): 441-452.
Zulkiffli, S. & Perera, N. (2011). A Literature Analysis on Business Performance for SMES -
Subjective or Objective Measures? 2011 SIBR Conference on Interdisciplinary Business
and Economics Research. Bangkok, Thailand: Society of Interdisciplinary Business
Research (SIBR).

57
APPENDICES
APPENDIX I
INTRODUCTION LETTER

58
APPENDIX II
QUESTIONNAIRE
1) Name: (Optional) ……………….………………………………………………………….
2) Age………………………………..………….……………………………………………..
PART A: DEMOGRAPHIC INFORMATION
3. What is your gender?
Gender Tick as Appropriate
Male
Female
4. What is your age bracket?
Age Tick as Appropriate
Below 35 Years
36-50 Years
51-65 Years
Above 65 Years
5. What is your highest level of education?
Level of Education Tick as Appropriate
Primary
Secondary
Diploma
Degree
Postgraduate
6. What is your position in the business?
Position in the Business Tick as Appropriate
Owner
Manager
Employee
7. Which type of business are you involved in?
Type of Business Tick as Appropriate
General Retail Shops
Hardware Shops
Wholesale Traders
Baby Care Firms
Supermarkets
Hotels
Motor vehicle Repair Shops
Manufacturing Firms
Others

59
8. What form of ownership do you have in this business?
Form of Ownership Tick as Appropriate
Sole proprietorship
Family business
Partnership
A limited liability company
1) 9. How many years has this business been in operation?
No. of years business has been in operation Tick as Appropriate
1 – 2 years
3-5 years
6-7 years
Above 7 years.
SECTION B: PROMOTION MARKETING STRATEGY AND PERFORMANCE
To what extent do you agree with the following statement on the relationship between place
marketing strategies and performance of SMEs? Please tick where applicable. SA- Strongly
Agree, A-Agree, N - Neutral, D-Disagree, SD- Strongly Disagree
Statement SA A N D SD
Special offer of the products tend to improve the performance of
SMEs.
Billboards and other promotional materials have a considerable effect
on SME performance.
Product branding can lead to increased business performance in SMEs
Social media marketing enhances SME performance.
SECTION C: PRICE MARKETING STRATEGY AND PERFORMANCE
To what extent do you agree with the following statement on the relationship between place
marketing strategies and performance of SMEs? Please tick where applicable. SA- Strongly
Agree, A-Agree, Undecided, D-Disagree, SD- Strongly Disagree
Statement SA A N D SD
Setting the same prices as competitors can impact the performance of
the business positively.
Lowering of the prices can lead to better long term SME performance.
Allow customers to negotiate prices is good for the performance of
our business.
Discounting prices of different products occasionally is helpful to our
business performance enhancement efforts.

60
SECTION D: PRODUCT MARKETING STRATEGY AND PERFORMANCE
To what extent do you agree with the following statement on the relationship between place
marketing strategies and performance of SMEs? Please tick where applicable. SA- Strongly
Agree, A-Agree, Undecided, D-Disagree, SD- Strongly Disagree
Statement SA A N D SD
Introduction of new products periodically is good to the business
Diversified products have allowed the business to increase its revenue
Concentration on one main product would not be beneficial to the
firm
The product packaging is key to the appeal of the product, and hence
its demand.
SECTION E: PLACE MARKETING STRATEGY AND PERFORMANCE
To what extent do you agree with the following statement on the relationship between place
marketing strategies and performance of SMEs? Please tick where applicable. SA- Strongly
Agree, A-Agree, Undecided, D-Disagree, SD- Strongly Disagree
Statement SA A N D SD
Use of innovative distribution channels has a positive impact on
performance
The business location has implications on its success
Direct sales have a noticeable impact on business performance in
SMEs.
Use of variety of retailers affects SMEs performance
SECTION F: BUSINESS PERFORMANCE OF SMES
To what extent do you agree with the following statement on the performance of SMEs? Please
tick where applicable. SA- Strongly Agree, A-Agree, Undecided, D-Disagree, SD- Strongly
Disagree
Statement SA A N D SD
The business has performed well in the recent past
I have practically witnessed the impact of a marketing strategy in my
business
I intend to roll out more marketing campaigns in the future
There are some marketing strategies which are more suited for my
type of business than others
THANK YOU AND GOD BLESS YOU
~ The End ~


