Kansas Partnership for Accessible Technology February 12, 2013 Meeting.
20
Kansas Partnership for Accessible Technology February 12, 2013 Meeting
-
Upload
ahmad-martindell -
Category
Documents
-
view
213 -
download
0
Transcript of Kansas Partnership for Accessible Technology February 12, 2013 Meeting.

Kansas Partnership for Accessible Technology
February 12, 2013 Meeting

ACCESSIBILITY STATUS OF STATE OF KANSAS WEBSITES

AMP Usage
211 Users 45 agencies

AMP Assessment

Assessment Sample
Matches last year’s for direct comparison 63 agency home page domains, as
represented in the Agency Contact Listing page of the Communication Directory on the Department of Administration website (with corrections and a few additions)
Spidered each site up to 250 pages Automated testing

Pages
11,031 pages scanned 11,084 last year
8,041 pages had one or more violations (72.9%) Down from 9,292 pages (83.8%) last year ~11% reduction in pages with violations

Agencies and Violations
Since last year, 70% of agencies have reduced their number of violations.
Overall and average numbers of violations dropped 35%, due to an overall elimination of almost 41,000 violations.

Numbers of Violations
2011 2012 Δ
High Severity Violations 55,210 (48%) 34,470 (46%) ↓ 38%
Medium Severity Violations 11,533 (10%) 9,994 (13%) ↓ 13%
Low Severity Violations 48,248 (42%) 29,758 (40%) ↓ 38%
Total Violations 114,991 74,222 ↓ 35%

Most Frequent Violations(by Pages Affected)
Best PracticeViolation
s
Percentage of Pages with Violation
Severity
Noticeability
Tractability
1. Ensure the language of a document is set (1)
3,726 (5,918)
32%(52%)
1 6 2
2. Provide valid labels for form fields (2)
7,763 (12,301)
28%(42%)
10 6 2
3. Avoid the sole use of device dependent event handlers (7)
16,514 (25,363)
18%(17%)
8 7 2
4. Ensure heading elements are properly ordered (5 (T))
8,374 (38,957)
17%(18%)
3 6 4
5. Provide alternative text for images (5 (T))
6,928 (7,171)
14%(18%)
10 10 2
Last year’s info in parentheses

Most Frequent Violations(by Violation Count)
Best PracticeViolation
s
Percentage of Pages with Violation
Severity
Noticeability
Tractability
1. Avoid the sole use of device dependent event handlers (2)
16,514(25,363)
18%(17%)
8 7 2
2. Avoid unnecessary use of heading elements (–)
15,942(–)
10%(–)
3 3 2
3. Ensure heading elements are properly ordered (1)
8,374(38,957)
17%(18%)
3 6 4
4. Ensure keyboard focus is only assigned to elements that are defined as keyboard focusable without setting a tabindex (4)
8,035(8,347)
7%(8%)
6 5 4
5. Provide valid labels for form fields (3)
7,763(12,301)
28%(42%)
10 6 2
Last year’s info in parentheses
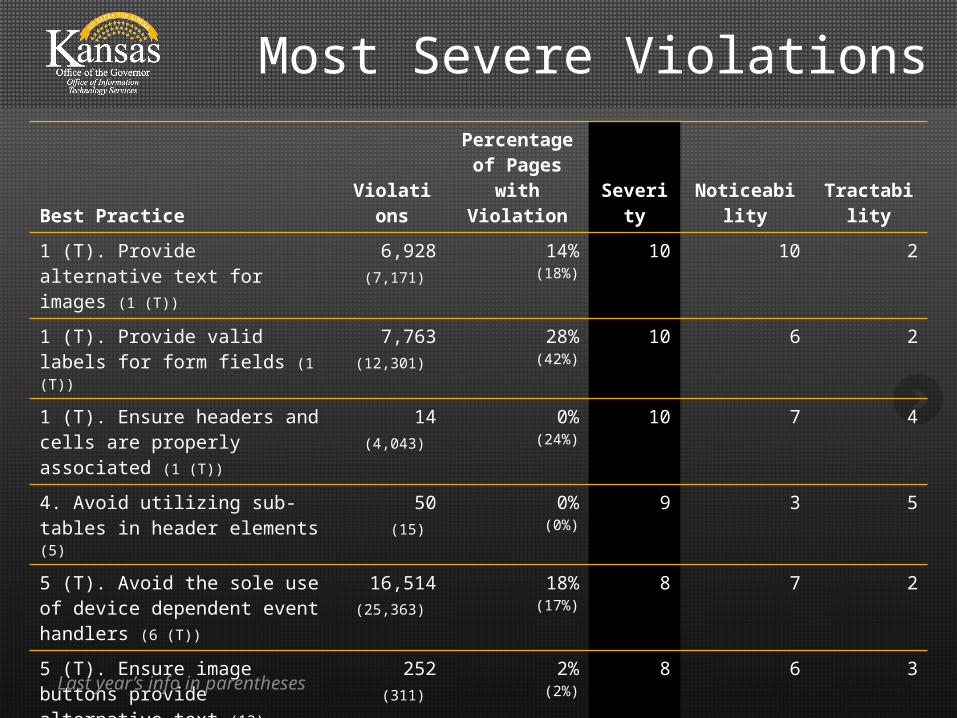
Most Severe Violations
Best PracticeViolation
s
Percentage of Pages with Violation
Severity
Noticeability
Tractability
1 (T). Provide alternative text for images (1 (T))
6,928 (7,171)
14%(18%)
10 10 2
1 (T). Provide valid labels for form fields (1 (T))
7,763 (12,301)
28%(42%)
10 6 2
1 (T). Ensure headers and cells are properly associated (1 (T))
14(4,043)
0%(24%)
10 7 4
4. Avoid utilizing sub-tables in header elements (5)
50(15)
0%(0%)
9 3 5
5 (T). Avoid the sole use of device dependent event handlers (6 (T))
16,514 (25,363)
18%(17%)
8 7 2
5 (T). Ensure image buttons provide alternative text (12)
252(311)
2%(2%)
8 6 3
5 (T). Embed Flash Player content in a manner that exposes accessibility (6 (T))
255(650)
0%(2%)
8 7 4
Last year’s info in parentheses

Most Tractable Violations
Best PracticeViolation
s
Percentage of Pages with Violation
Severity
Noticeability
Tractability
1 (T). Provide alternative text for images (1 (T))
6,928 (7,171)
14%(18%)
10 10 2
1 (T). Provide valid labels for form fields (1 (T))
7,763 (12,301)
28%(42%)
10 6 2
1 (T). Avoid the sole use of device dependent event handlers (1 (T))
16,514 (25,363)
18%(17%)
8 7 2
1 (T). Ensure frame titles are meaningful (1 (T))
991(1,530)
4%(6%)
7 6 2
1 (T). Provide valid, concise, and meaningful alternative text for image buttons (1 (T))
252(311)
2%(2%)
6 8 2
1 (T). Ensure the language of a document is set (1 (T))
3,726 (5,918)
32%(52%)
1 6 2
1 (T). Avoid unnecessary use of heading elements (–)
15,942(–)
10%(–)
3 3 2
1 (T). Ensure hr elements utilize relative sizing (1 (T))
40(630)
0%(0%)
4 2 2
Last year’s info in parentheses

Three Year IT Management and Budget Plans

3 Year IT Plan Responses
Completed an external web site accessibility assessment
48%
3%
34%
12% 2%
2011
Yes In progressNo Did not answerN/A
68%2%
28%
2%
2012
Based on 47 agency responses

3 Year IT Plan Responses
30%
4%
32%
9%
26%
Completed an internal web site accessibility assessment
YesIn progressNoDid not answerN/A

3 Year IT Plan Responses
64%
36%
Responded in table
YesNo

IDEAS FOR ADDRESSING PDF ACCESSIBILITY ON KANSAS STATE WEB SITES
David Herr, NetCentric Technologies

OPEN DISCUSSION

2013 MEETING SCHEDULE

Meeting Schedule
None of the options in the poll rose to the top as I’d hoped. All in the first week of the month
Based on it and other feedback, we gave this, the second Tuesday, a try.
Would this work going forward? Would put our next meeting on
Tuesday, April 9, 2:30–4:30