Kalamazoo United for Shared Prosperity (KUSP): Basic Principles and Proposed Strategy Don Cooney,...
28
Kalamazoo United for Shared Prosperity (KUSP): Basic Principles and Proposed Strategy Don Cooney, Stephanie Moore and Tim Ready* Kalamazoo City Commission Meeting April 14, 2014 * Director of the WMU Lewis Walker Institute for the Study of Race and Ethnic Relations and Associate Professor of Sociology
Transcript of Kalamazoo United for Shared Prosperity (KUSP): Basic Principles and Proposed Strategy Don Cooney,...

Kalamazoo United for Shared Prosperity (KUSP):Basic Principles and Proposed Strategy
Don Cooney, Stephanie Moore and Tim Ready*
Kalamazoo City Commission MeetingApril 14, 2014
* Director of the WMU Lewis Walker Institute for the Study of Race and Ethnic Relations and Associate Professor of Sociology

The ChallengeWhy Kalamazoo Needs a Well-Coordinated
Strategy to Promote Shared Prosperity

Poverty Rate for Individuals: 2000 and 2008-12
city county Out-county Michigan USA0
5
10
15
20
25
30
35
40
24
12
7 810
34
19
13
17 16
2000 2008-12
Percent
City’s Poverty Rates* andPoverty Percentile Ranking Among All US Cities:
Total, and by Race/Ethnicity
Percent of City Residentsin Poverty National Percentile Rank for Poverty
All Persons 37% (30%**) 98th Percentile (83rd**)
White 32% 99th Percentile
Black 52% 97th Percentile
Hispanic 40% 91st Percentile
• American Community Survey, 2009-11** Note that the poverty rate for all persons in the city of Kalamazoo is nearly seven percentage points higher than it would otherwise be because of the presence of college students. If college students were excluded, we estimate that the poverty ranking for Kalamazoo would be at about the 83rd percentile among US cities of at least 65,000 residents. Source: Alemayehu Bishaw, US Census Bureau; SEHSD 2013-17, 4/1/2013).

Hispanic, 2,131, 9%
White, 13,338, 55%
Black, 7,208, 30%
Other, 1,529, 6%
Race/Ethnicity of Persons in Poverty in City of Kalamazoo, 2010-12
Total number of persons in poverty in city of Kalamazoo: 24,206

Child Poverty in Kalamazoo:*Percentile Ranking among All US Cities
with at Least 65,000 People
% Poor National Percentile Rank for Poverty
All Children: 46% 96th Percentile
White Children 33% 95th Percentile
Black Children 64% 93rd Percentile
Hispanic Children 43% 79th Percentile
* American Community Survey, 2009-2011.

Children in Poverty, City of Kalamazoo, 2010-12
Total number of children in poverty: 6,345
Hispanic, 853 14%
White, 1798 28%
Black, 3,302 52%
Other 3926%

The Cost of Doing Nothing…….different

How Child Poverty Places At-Risk Not Only the Future of Affected Children, but the Entire Kalamazoo Community
Source: Greg Duncan, Stanford UniversityPathways, winter, 2011

The Cost of Doing Nothing…Not Making Good on The Promise
• The Kalamazoo Promise is a Unique and Important Asset to Promote Shared Prosperity
• It Has Proven to Make a Difference for Many by Making College Affordable
BUT• Will Our Children Be Prepared to Take Advantage of The
Promise If They and Their Families Are Struggling with the Effects of Poverty?

Child Development and Schooling
• Poverty, Especially in Early Childhood, Profoundly Affects a Child’s Chances for Healthy Growth, Development and Learning
• Studies Consistently Show that Family and Neighborhood Poverty Have a Far Greater Impact on Learning than How Good Teachers and School Administrators Are
• Good Schools Can and Do Make a Difference, and We Must Support Our Schools in Every Way We Can…
• …But It Take a Community To Raise a Child – Schools Can’t Do It Alone

Top to Bottom Ranking of Kalamazoo County Public Schools by Percentage of Economically Disadvantaged Students, 2013
In Percent
Percentile Rankingamong All Michigan Schools
The percentage of economically disadvantaged students in a school accounts for 76 percent of the variation among the county’s 64 public schools in the Michigan Department of Education’s 2013 Top-to-Bottom Ranking of public schools. R2 = .760
* In 21 of 65 County Public Schools, at least two-thirds (66%) of students are economically disadvantaged.
* 17 of these 21 schools are KPS schools; the remaining 4 are in Comstock.
* All 21 schools are below the 30th percentile in the Michigan State Dept. of Education’s Top-to Bottom Ranking; 18 were below the 20th percentile, and; 12 were at or below the 10th percentile.
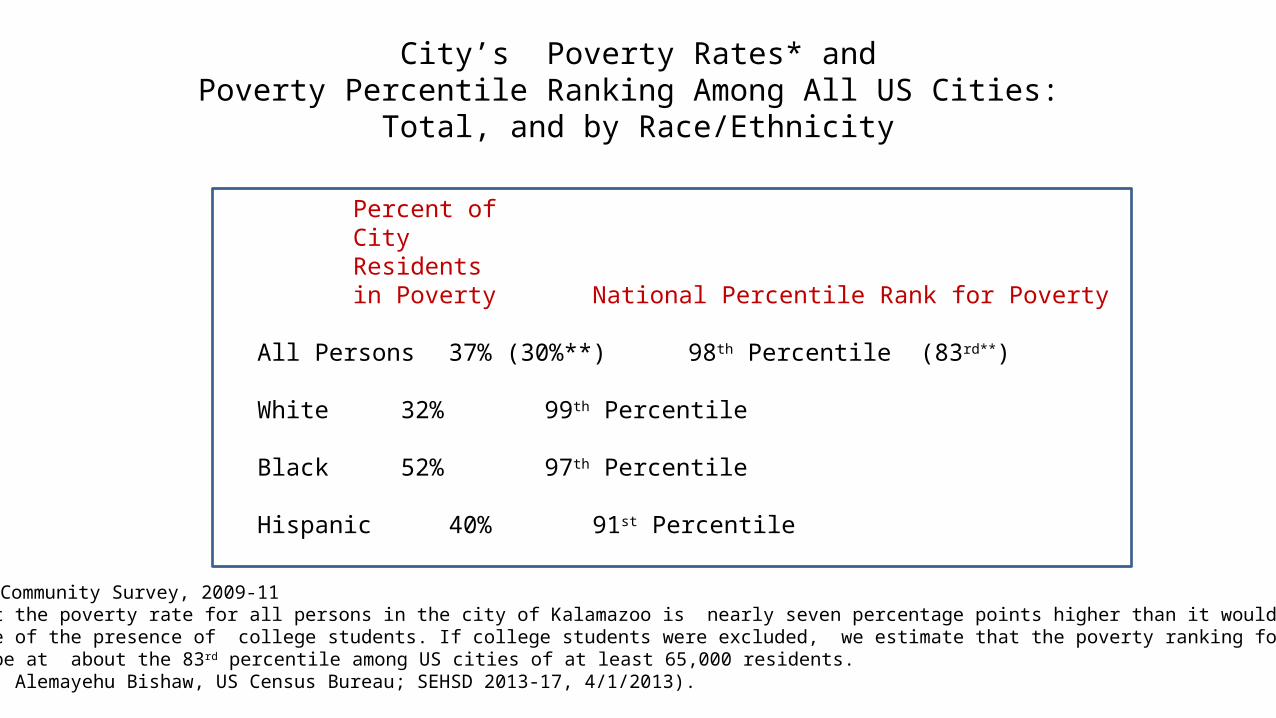
High Poverty Neighborhoods
• Concentrated Poverty (not just individual and family poverty):– Is hazardous to our health– Undermines education outcomes– Increases the risk of crime
• 12 of 25 Kalamazoo Census Tracts Have Concentrated Poverty (At Least 30 Percent of Residents in Poverty)

Twelve of the 25 Census Tracts in the City Have Concentrated Poverty (poverty rate of at least 30 percent)
Percent ofAll Persons in poverty
Tract 1 48% Tract 15.06 40%Tract 2.01 34% Tract 15.07 58%Tract 2.02 46% Tract 16.01 15%Tract 3 45% Tract 16.03 22%Tract 5 37% Tract 16.04 27%Tract 6 50% Tract 17.01 18%Tract 9 58% Tract 17.02 30%Tract 10 47% Tract 18.01 12%Tract 11 26% Tract 18.02 19%Tract 12 3% Tract 55.01 11%Tract 13 17%Tract 15.01 16%Tract 15.02 23%Tract 15.03 14%Tract 15.04 76%
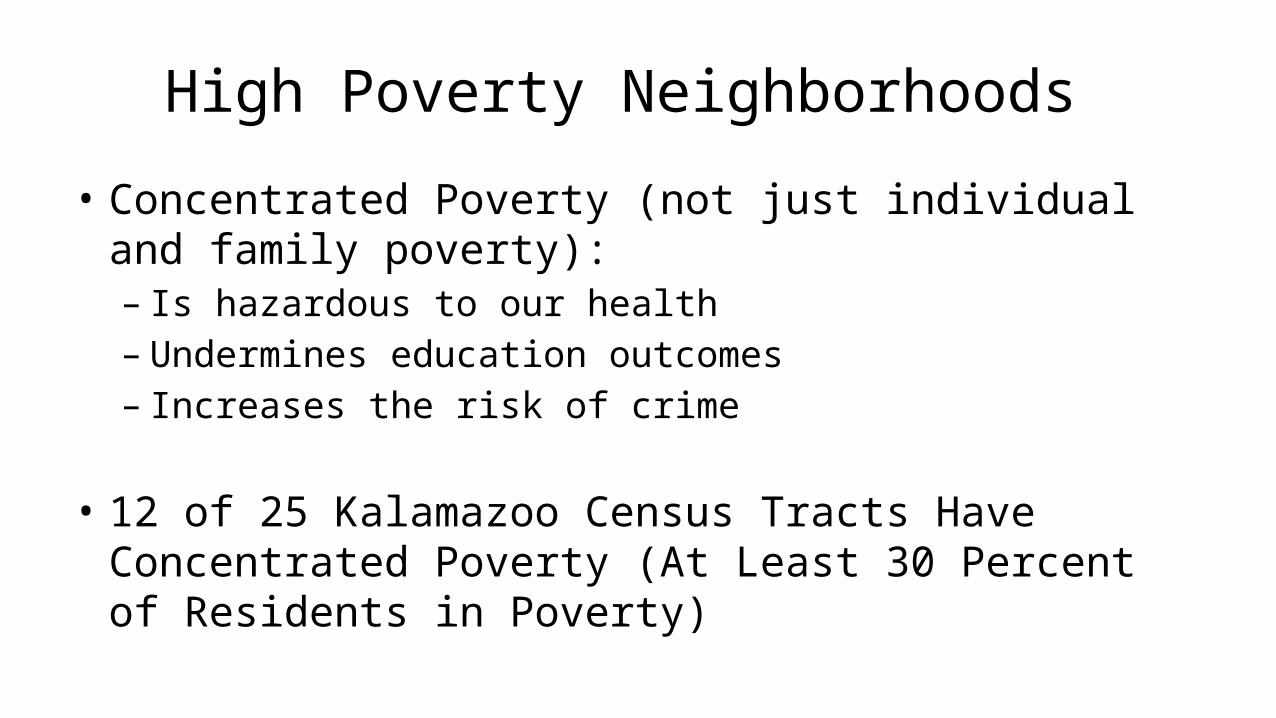
The Increase in Poverty in the City Is Not Confined to Only a Few Neighborhoods…
• Between 2000 and 2008-12, –Poverty Increased in All But One of the City’s 25 Census
Tracts
–The Number of Census Tracts with Concentrated Poverty (greater than 30 percent) increased from 9 to 12

Poverty Rate for Individuals in Kalamazoo Census Tracts, 2000 and 2008-12
12.01
2.02 3 5 6 9 10 11 1255.01
15.0415.06
15.0716.01
16.0316.04
17.0117.02
18.0118.02
0
10
20
30
40
50
60
70
80
30
38
43
35 35
42
36
2224
4
15
57
20
45
12 118 8
1411
9
48
34
46 45
37
50
58
47
26
3
11
76
40
58
15
22
27
18
30
12
19
2000 2008-12
Percent

Percent of Children in Poverty for City Census Tracts,2000 and 2008-12
Tract 1
Tract 2.01
Tract 2.02
Tract 3
Tract 5
Tract 6
Tract 9
Tract 10
Tract 11
Tract 12
Tract 14.01
Tract 15.04
Tract 15.06
Tract 15.07
Tract 16.01
Tract 16.03
Tract 16.04
Tract 17.01
Tract 17.02
Tract 18.01
Tract 18.02
0
10
20
30
40
50
60
70
80
90
30.1
37.743.2
34.8 35.1
41.535.8
21.8 23.9
4
14.6
57.1
20.4
45.3
12 10.57.5 7.8
13.911 9.4
65
36
81
53
36
54
6467
30
2
9
80
9
66
3634 35
18
40
17
24
Percent

More Broadly Shared Prosperity
Our Challenge and Our Opportunity

KUSP Core Objectives
– Involve low income residents as full participants in the planning and evaluation process
– Involve Community-based Organizations to move beyond disjointed delivery of categorical services to better meet people’s needs!
– Engage private sector employers as full partners in job creation and job training, because the goal of more broadly shared prosperity makes sense for business, besides being the right thing to do

Core Objectives (continued)
• Strategically Focus the Considerable Resources of Our Community on the Goal of Shared Prosperity
• Make Sure that Low Income Residents Are at the Table and an Integral Part of the Process
• Plan and Structure Must Be Appropriate to Kalamazoo’s Decentralized Network of Community Assets
• Strategic Action Plan Must Make a Difference in People’s Lives!

KUSP Core Strategies
• Community indicator system to establish baseline information and measure progress toward goals, similar to The Coordinating Council of Calhoun County. Data should be both county-wide and specific to the city of Kalamazoo, where poverty is most concentrated
• Draw on the collective wisdom of the Kalamazoo community, including its elected and appointed public officials, nonprofit leaders and grassroots citizens
• KUSP strategies also should be informed by research on best practices from around the country

Strategic Doing
• Provides the Methodology (doing agenda) for the Proposed Organizational Structure of Kalamazoo United for Shared Prosperity
• Strategic Doing Combines Effective and Visionary Civic Leadership with an Inclusive Civic Engagement Process


Kalamazoo United for Shared Prosperity:Proposed Organizational Structure
• The specific organizational structure we propose is outlined in coming slides.
HOWEVER
• The specifics of the proposed structure are of less importance than achieving core objectives and strategies…

Kalamazoo United for Shared ProsperityExecutive
Committee of Board
Education
Board of Stakeholders
Mental Health and Substance
Abuse RecoveryFood Security
Equitable Economic
Development
OtherOther
Housing
Executive Director
Job Training Employment of ex-offenders
Action Committees
Kalamazoo City Commission
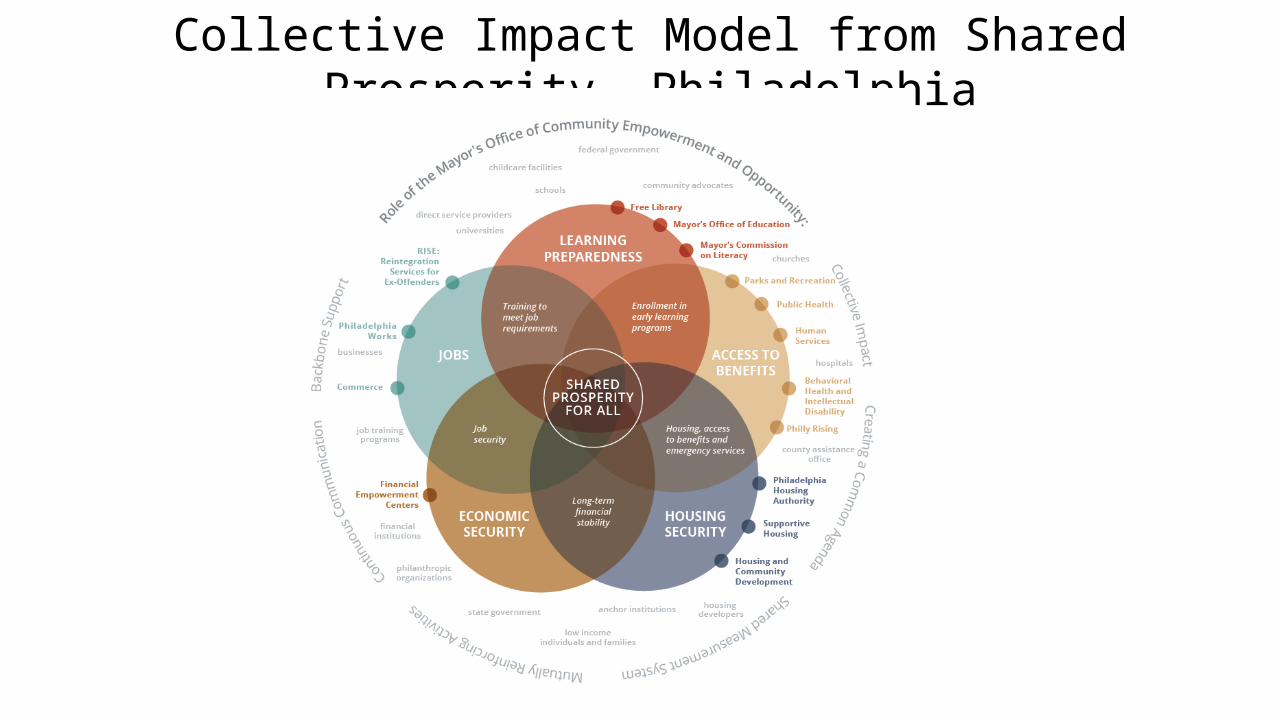
Collective Impact Model from Shared Prosperity, Philadelphia

Next Steps