
June 2020 Investor Presentation - GlobeNewswire
14
© Golar LNG Limited June 2020 Investor Presentation Operations and cash-flow generation remain resilient
Transcript of June 2020 Investor Presentation - GlobeNewswire
© Golar LNG Limited
June 2020
Investor Presentation
Operations and cash-flow generation remain resilient
© Golar LNG Limited
Forward
Looking
Statements
1
This press release contains forward-looking statements (as defined in Section 21E of the Securities Exchange Act of 1934, as amended)which reflects management’s current expectations, estimates and projections about its operations. All statements, other than statements ofhistorical facts, that address activities and events that will, should, could or may occur in the future are forward-looking statements. Wordssuch as “may,” “could,” “should,” “would,” "will," “expect,” “plan,” “anticipate,” “intend,” “forecast,” “believe,” “estimate,” “predict,”“propose,” “potential,” “continue,” or the negative of these terms and similar expressions are intended to identify such forward-lookingstatements. These statements are not guarantees of future performance and are subject to certain risks, uncertainties and other factors,some of which are beyond our control and are difficult to predict. Therefore, actual outcomes and results may differ materially from what isexpressed or forecasted in such forward-looking statements. You should not place undue reliance on these forward-looking statements,which speak only as of the date of this press release. Unless legally required, Golar undertakes no obligation to update publicly any forward-looking statements whether as a result of new information, future events or otherwise.
Among the important factors that could cause actual results to differ materially from those in the forward-looking statements are: ourinability and that of our counterparty to meet our respective obligations under the Lease and Operate Agreement ("LOA") entered into inconnection with the BP Greater Tortue / Ahmeyim Project (“Gimi GTA Project”); continuing uncertainty resulting from current or potentialfuture claims from our counterparties of purported force majeure under contractual arrangements, including but not limited to ourconstruction projects (including the Gimi GTA Project) and other contracts to which we are a party; the length and severity of outbreaks ofpandemics, including the recent worldwide outbreak of the novel coronavirus ("COVID-19") and its impact on demand for liquefied naturalgas ("LNG") and natural gas, the timing of completion of our conversion projects, the operations of our charterers, our global operations andour business in general; changes in our ability to obtain additional financing on acceptable terms or at all; changes in our ability to retrofitvessels as floating storage and regasification units ("FSRUs") or floating liquefaction natural gas vessels ("FLNGs") and in our ability toobtain financing for such conversions on acceptable terms or at all; Golar Power's ability to operate the Sergipe power station project andrelated FSRU contract and to execute its downstream LNG distribution and merchant power sales plans; changes in our relationship withGolar LNG Partners LP ("Golar Partners"), Golar Power Limited ("Golar Power") or Avenir LNG Limited ("Avenir") and the sustainability of anydistributions they pay to us; failure of our contract counterparties, including our joint venture co-owners, to comply with their agreementswith us or other key project stakeholders; changes in LNG carrier, FSRU, or FLNG, or small-scale LNG market trends, including charter rates,vessel values or technological advancements; our vessel values and any future impairment charges we may incur; challenges by authoritiesto the tax benefits we previously obtained under certain of our leasing agreements; our ability to close potential future sales of additionalequity interests in our vessels, including the Hilli Episeyo and FLNG Gimi on a timely basis or at all and our ability to contract the fullutilization of the Hilli Episeyo or other vessels and the benefits that may to accrue to us as the result of any such modifications; changes inthe supply of or demand for LNG carriers, FSRUs, FLNGs or small-scale LNG infrastructure; a material decline or prolonged weakness in ratesfor LNG carriers, FSRUs, FLNGs or small-scale LNG infrastructure; changes in the performance of the pool in which certain of our vesselsoperate and the performance of our joint ventures; changes in trading patterns that affect the opportunities for the profitable operation ofLNG carriers, FSRUs, FLNGs or small-scale LNG infrastructure; changes in the supply of or demand for LNG or LNG carried by sea; continuingvolatility of commodity prices; changes in the supply of or demand for natural gas generally or in particular regions; changes in ourrelationships with our counterparties, including our major chartering parties; a decline or continuing weakness in the global financialmarkets; changes in general domestic and international political conditions, particularly where we operate; changes in the availability ofvessels to purchase and in the time it takes to construct new vessels; failures of shipyards to comply with delivery schedules or performancespecifications on a timely basis or at all; our ability to integrate and realize the benefits of acquisitions; changes in our ability to sell vessels toGolar Partners or Golar Power; changes to rules and regulations applicable to LNG carriers, FSRUs, FLNGs or other parts of the LNG supplychain; our inability to achieve successful utilization of our expanded fleet or inability to expand beyond the carriage of LNG and provision ofFSRUs, FLNGs, and small-scale LNG infrastructure particularly through our innovative FLNG strategy and our joint ventures; actions taken byregulatory authorities that may prohibit the access of LNG carriers, FSRUs, FLNGs or small-scale LNG vessels to various ports; increases incosts, including, among other things, wages, insurance, provisions, repairs and maintenance; and other factors listed from time to time inregistration statements, reports or other materials that we have filed with or furnished to the Securities and Exchange Commission, or theCommission, including our most recent annual report on Form 20-F.
As a result, you are cautioned not to rely on any forward-looking statements. Actual results may differ materially from those expressed orimplied by such forward-looking statements. The Company undertakes no obligation to publicly update or revise any forward-lookingstatements, whether as a result of new information, future events or otherwise unless required by law.

© Golar LNG Limited
$ m $ m $ m $ m $ mQ2 2019 42.9 4.8 59.6 (3.7) 103.5Q3 2019 46.6 18.8 64.2 (4.5) 125.1Q4 2019 37.5 69.7 62.9 (4.3) 165.8Q1 2020 42.0 56.4 45.9 (4.6) 139.7Last twelve months (LTM) 168.9 149.6 232.6 (17.0) 534.1
Less: others share of LTM Golar Partners’ and Golar Power’s adjusted EBITDA (238.8)Less: LTM GLNG Corporate cost (27.1)
Golar LNG's LTM adjusted EBITDA 268.2
2
Production &
Liquefaction
GMLP
FLNG LNG Carriers FSRU
GLNG
Golar GrandGolar Maria
Methane Princess Golar Mazo
Golar Bear Golar Kelvin
Golar Crystal Golar Seal
Golar Frost Golar Snow
Golar Glacier Golar Ice
Golar Viking* Golar Arctic
Golar Spirit NR Regas Satu
Golar Freeze Golar Winter
Golar EskimoGolar Igloo
Golar Tundra
Sergipe power plant(3)
FLNG Hilli Episeyo(1)
Golar Celsius Golar Penguin
Golar Gandria (for conversion)
FLNG Gimi (under construction)
Golar Power(2)
1) GMLP currently has 50% interest in Hilli T1 and T2, which represents the current contracted capacity of the Hilli Episeyo, which has a total of 4 trains
2) Golar Power is a 50/50 JV between Golar LNG Limited and Stonepeak Infrastructure
3) Sergipe is a 50/50 JV between Golar Power and EBRASIL Energia Ltda, one of the largest independent power producers in Brazil
4) Gross Adjusted EBITDA is a Non GAAP measure please see appendix for definition
The Golar Group: Integrated LNG infrastructure
Downstream Gas
Power generation
* Golar Viking currently being converted to a FSRU that will be sold to Croatian project developers after successful
commissioning and then operated by Golar for 10-years
Golar Nanook
Shipping Regasification Downstream
Small scale LNG
Ownership:
Power generation
AS
SE
TS
Gro
ss
Ad
jus
ted
E
BIT
DA
(4)
TOTAL
© Golar LNG Limited
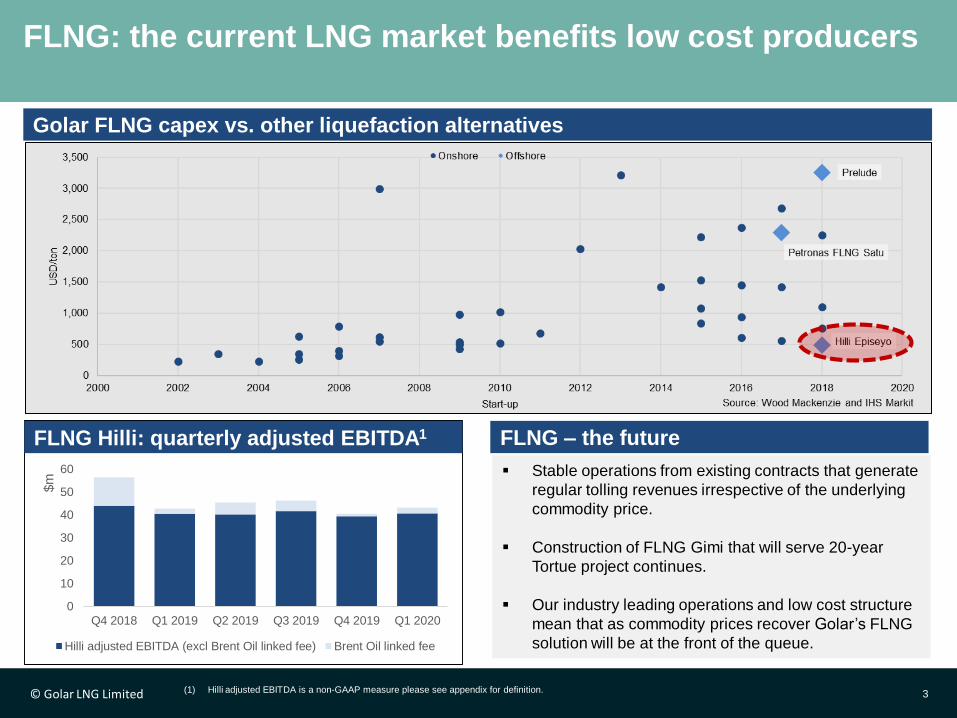
FLNG: the current LNG market benefits low cost producers
3
▪ Stable operations from existing contracts that generate
regular tolling revenues irrespective of the underlying
commodity price.
▪ Construction of FLNG Gimi that will serve 20-year
Tortue project continues.
▪ Our industry leading operations and low cost structure
mean that as commodity prices recover Golar’s FLNG
solution will be at the front of the queue.
Hilli Episeyo’s EBITDA movement Q1’20 v Q4’19
0
10
20
30
40
50
60
Q4 2018 Q1 2019 Q2 2019 Q3 2019 Q4 2019 Q1 2020
$m
Evolution of Hilli Episeyo's EBITDA
Hilli adjusted EBITDA (excl Brent Oil linked fee) Brent Oil linked fee
FLNG Hilli: quarterly adjusted EBITDA1
(1) Hilli adjusted EBITDA is a non-GAAP measure please see appendix for definition.
Golar FLNG capex vs. other liquefaction alternatives
FLNG – the future

© Golar LNG Limited 4
Shipping: improving utilisation and risk profile
▪ Seasonal weakening in Q1 2020 leading to lower TCE1 rates achieved compared to Q4 2019. However utilization for the
quarter has increased to 94% from 90% in Q4.
▪ A change in shipping strategy together with an improving supply/demand balance has contributed to a 52% compound
annual growth rate in Shipping adjusted EBITDA1 over the last 2 years.
-
10
20
30
40
50
60
70
80
90
-
10
20
30
40
50
60
70
80
90
Q1 2018 Q2 2018 Q3 2018 Q4 2018 Q1 2019 Q2 2019 Q3 2019 Q4 2019 Q1 2020
Ship
pin
g T
CE
/day (
$'0
00s)
Ship
pin
g A
dju
ste
d E
BIT
DA
($m
)
Evolution of Shipping EBITDA
Shipping Adjusted EBITDA ($m) Shipping TCE/day ($'000s)
77%
62%
86%
93%
51%
66% 65%
90%
94%
Utilization %
Evolution of Shipping Adjusted EBITDA1
(1) Shipping Adjusted EBITDA and TCE are non-GAAP measures. Please see appendix for definition.
© Golar LNG Limited© Golar LNG Limited 5
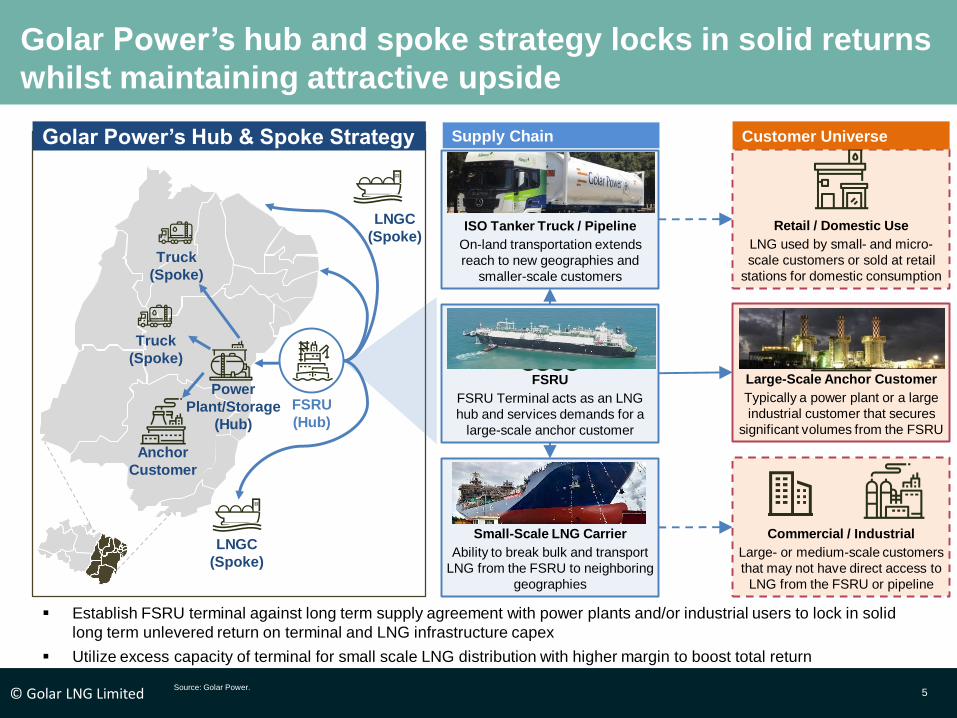
Golar Power’s hub and spoke strategy locks in solid returns
whilst maintaining attractive upside
Source: Golar Power.
Large-Scale Anchor Customer
Typically a power plant or a large
industrial customer that secures
significant volumes from the FSRU
Commercial / Industrial
Large- or medium-scale customers
that may not have direct access to
LNG from the FSRU or pipeline
Retail / Domestic Use
LNG used by small- and micro-
scale customers or sold at retail
stations for domestic consumption
FSRU
FSRU Terminal acts as an LNG
hub and services demands for a
large-scale anchor customer
Small-Scale LNG Carrier
Ability to break bulk and transport
LNG from the FSRU to neighboring
geographies
ISO Tanker Truck / Pipeline
On-land transportation extends
reach to new geographies and
smaller-scale customers
Anchor
Customer
Truck
(Spoke)
Truck
(Spoke)
FSRU
(Hub)
LNGC
(Spoke)
LNGC
(Spoke)
Power
Plant/Storage
(Hub)
Golar Power’s Hub & Spoke Strategy Supply Chain Customer Universe
▪ Establish FSRU terminal against long term supply agreement with power plants and/or industrial users to lock in solid
long term unlevered return on terminal and LNG infrastructure capex
▪ Utilize excess capacity of terminal for small scale LNG distribution with higher margin to boost total return
© Golar LNG Limited 6
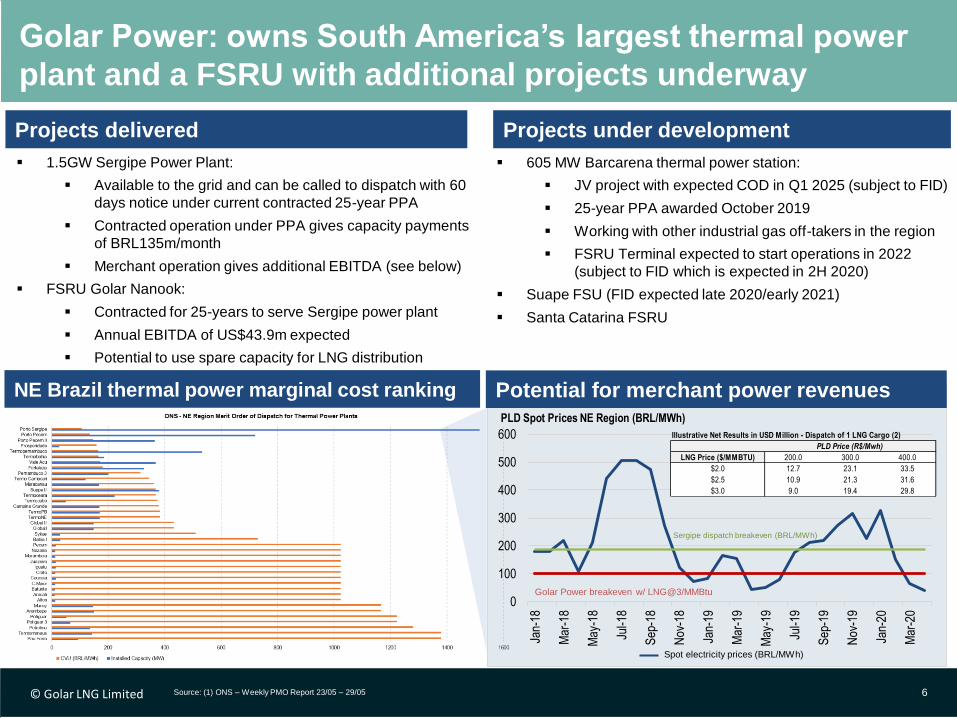
Golar Power: owns South America’s largest thermal power
plant and a FSRU with additional projects underway
Source: (1) ONS – Weekly PMO Report 23/05 – 29/05
NE Brazil thermal power marginal cost ranking
0
100
200
300
400
500
600
Jan-
18
Mar
-18
May
-18
Jul-1
8
Sep
-18
Nov
-18
Jan-
19
Mar
-19
May
-19
Jul-1
9
Sep
-19
Nov
-19
Jan-
20
Mar
-20
PLD Spot Prices NE Region (BRL/MWh)
Golar Power breakeven w/ LNG@3/MMBtu
Spot electricity prices (BRL/MWh)
Sergipe dispatch breakeven (BRL/MWh)
Illustrative Net Results in USD Million - Dispatch of 1 LNG Cargo (2)
LNG Price ($/MMBTU) 200.0 300.0 400.0
$2.0 12.7 23.1 33.5
$2.5 10.9 21.3 31.6
$3.0 9.0 19.4 29.8
PLD Price (R$/Mwh)
Potential for merchant power revenues
Projects under developmentProjects delivered
▪ 1.5GW Sergipe Power Plant:
▪ Available to the grid and can be called to dispatch with 60
days notice under current contracted 25-year PPA
▪ Contracted operation under PPA gives capacity payments
of BRL135m/month
▪ Merchant operation gives additional EBITDA (see below)
▪ FSRU Golar Nanook:
▪ Contracted for 25-years to serve Sergipe power plant
▪ Annual EBITDA of US$43.9m expected
▪ Potential to use spare capacity for LNG distribution
▪ 605 MW Barcarena thermal power station:
▪ JV project with expected COD in Q1 2025 (subject to FID)
▪ 25-year PPA awarded October 2019
▪ Working with other industrial gas off-takers in the region
▪ FSRU Terminal expected to start operations in 2022
(subject to FID which is expected in 2H 2020)
▪ Suape FSU (FID expected late 2020/early 2021)
▪ Santa Catarina FSRU

© Golar LNG Limited
Q1 2020 Summary Results Highlights
Operating Results
FLNG: delivering consistent Adjusted EBITDA1
Shipping: Seasonally weak Q1 however substantial
improvement on Q1/9. Q2/20 TCE of c.$40kpd expected
Q1 2020 results: solid FLNG performance and improved
shipping coverage
7
Net loss:
Predominantly non-cash interest rate swap losses both
within Golar LNG and its affiliates together with a non-
cash day one loss on disposal in Golar Power:
Interest rate and equity derivatives $(54.7m)
Unrealized oil derivative valuation $(27.8m)
Our share of our affiliate’s losses $(37.9m)
Financing:
• Contractual debt1 in line with Q4 primarily due to Gimi
facility drawdown netted off by $70m margin loan
repayment and $24m scheduled debt repayments
• Remaining 1.5 million TRS shares purchased in Q1
• For remainder of 2020, management is working on:
• Refinancing the existing $150m bilateral loan
and the remaining $30m margin loan
• Refinancing the Golar Seal
• Opportunistic vessel re-financings
• Execution of these re-financings along with expected
capital expenditure, debt service2 and operating cash
flow2 are anticipated to be sufficient for group needs
• Golar Power expected to fund its current portfolio of
Brazilian projects without recourse to Golar
• Exploring yard financing options for FLNG newbuild
GA
AP
NO
N G
AA
P
Q1 2020 Q4 2019 Q1 2019
$m $m % ∆ $m % ∆
Shipping and Corporate 68 84 -19% 60 13%
FLNG 55 55 - 54 2%
Total operating revenues 123 139 -12% 114 6%
Net (Loss)/Income (104) 25 -516% (42) -147%
Net Debt 2,254 2,125 +6% 1,823 +24%
Unrestricted cash 131 222 -41% 213 -38%
Golar restricted cash1 104 153 -32% 217 -52%
Total Golar cash1 235 375 -37% 430 -45%
Shipping and Corporate 34 55 -38% 21 62%
FLNG 42 38 10% 42 -
Adjusted EBITDA1 76 93 -18% 63 21%
Contractual Debt1 2,796 2,795 - 2,627 +6%
(1) Golar Cash, Golar Restricted Cash, Adjusted EBITDA, TCE and Contractual Debt are non GAAP measures. Please see the appendix for definitions.
(2) Operating cash flow (OCF) represents underlying cash from Golar activities. Please see appendix for a description for each of the items

© Golar LNG Limited
Remainder of 2020: the key strategic priorities
8
Objective Status Timing
Shipping • Continue to de-risk the division by
placing vessels on longer charters
• Expect 80%
utilization for Q2
• Backlog $126m
Ongoing
FLNG • Conclude Gimi contractor discussions
• Conclude Gimi discussions with BP
• Continue to progress Hilli expansion/
extension with Perenco and SNH
• Advanced
• Underway
• Underway
Q3 2020
Ongoing
Downstream
Golar Power
• Continue build out of small- scale LNG
customers, convert LOIs into contracts
• Barcarena Terminal FID
• 3 contracts
• 200 LOIs
• Underway
Q4 2020
Ongoing
Q4 2020
Finance • Refinance $150m bilateral loan and
$30m margin loan balance
• Refinance Golar Seal and
opportunistically other vessels
• Started
• Underway
Q3 2020
Q3 2020
Corporate • Maintain reductions in admin costs
• Simplify group structure
• Set long-term ESG reporting targets
• Underway
• Under review
• Underway
2020
2020
Q4 2020

© Golar LNG Limited
The Golar Business Model
An integrated model ready for high and low LNG prices
9
LNG oil price parity vs. LNG value chain economics
FLNG:
– The cheapest way to liquify the cheapest gas
Main thesis: Gas is cheaper than oil to produce
Golar Power + FSRUs:
A global opportunity to enable a rapid transition to
cheaper and cleaner energy through use of
Golar’s LNG technology solutions, showcased by
our Brazilian Venture. The USD 418 billion
switch with 20% CO2 reduction.

© Golar LNG Limited
Our prediction : LNG will sell with a significant discount
to oil for the forseeable future
10
What is Golar Power today:
• A global showcase for LNG rollout to power, transportation and small scale end-users
• Share of USD 6 billion underlying contract earnings backlog1 (100% of power station & FSRU) built in 5 years
• A large portfolio of signed LOIs for global developments as well specific Brazilian opportunities
• A significant portfolio of small scale LNG opportunities mainly in Brazil, 200+ LOIs and 3 firm contracts
• A company that helps customers and countries reduce energy costs and improve environmental footprints
An ESG technology company with solid long term contracts and high growth potential
Source: IHS
The oil to LNG fuel switch potentialLNG supply growth 2015-2025
Power
5 million
bblspd
Rail
2 million
bblspd
Marine
4 million
bblspd
Res/Comm
11 million
bblspd
41 million bbl/day
Trucks
19 million
bblspd
Oil to LNG switching potential of 41m barrels per
day = USD 418bn of annual cost saving on
current prices
256
372391
483
0
100
200
300
400
500
600
Million tons L
NG
per
year

© Golar LNG Limited
Trucking – a kinder egg small scale LNG opportunity
11
Diesel truck LNG truck Hydrogen
Cost of fuel(1) ~34,000/yr ~USD 17,500/yr ?
Emissions per
truck
~134 tons CO2/yr
~260kg SOx/yr
~103 tons CO2/yr
~0kg SOx/yrEmission free?
Fuel
infrastructure ✓ ✓ ×Wall street
perception by
market cap.
Volvo: USD 32bn Golar: USD 0.8bn Nikola: USD 23bn
Today Tomorrow In 10-20 years?
1. Cheaper fuel, 2. Cleaner emissions and 3. Infrastructure available for roll-out
1) Assumes diesel at USD 2.4/gal / LNG at USD 9/MMBTU in-tank, 2km/liter diesel / 1.3 km/liter LNG

© Golar LNG Limited
Contact Us
Stuart BuchananHead of Investor Relations
T: +44 20 7063 7911
12

© Golar LNG Limited 13
Non-GAAP Measures
Appendix
Adjusted EBITDA: Total Adjusted EBITDA is calculated by taking net income before interest, tax, unrealized mark-to-market movements on the oil derivative instrument, depreciation and amortization. We also
prepare this metric for FLNG Hilli and our Shipping business. We believe that the exclusion of these items enables investors and other users of our financial information to assess our sequential and year over year
performance and operating trends on a more comparable basis and is consistent with management’s own evaluation of business performance. Adjusted EBITDA is a non-GAAP financial measure and should not be
considered as an alternative to net (loss) income or any other indicator of Golar's performance calculated in accordance with US GAAP. Please see our Q1 earnings release for a reconciliation to net income the most
comparable US GAAP measure: http://www.golarlng.com/investors/results-centre/highlights
Gross Adjusted EBITDA: Gross Adjusted EBITDA represents 100% of adjusted EBITDA for each of the asset groups across Golar LNG and our equity investments Golar Power (50% ownership) and Golar LNG
Partners (32% ownership). Management believe that this 100% asset presentation is useful to investors and other users of our financial information to assess the performance of our integrated asset portfolio without
taking into account ownership interests. This method is also consistent with how management review the business. Under US GAAP we account for our investment in Golar LNG Partners and Golar Power (which has
50% ownership of CELSE) under the equity method of accounting. Our proportionate share of the EBITDA of their assets is reflected in one line in our Income Statement “Equity in Net Earnings (losses) of affiliates”. In
addition as these numbers reflect 100% of asset performance, we have not removed the EBITDA relating to third party equity investors. For Hilli, Keppel and B&V have a 5% and 0.4% respective ownership interest of
the income stream. Their share is reflected as noncontrolling interest in our financial statements prepared in accordance with US GAAP. Gross Adjusted EBITDA is a non GAAP measure and should not be considered
as an alternative to net (loss) income or any other indicator of Golar’s performance in accordance with US GAAP.
TCE: The average daily TCE rate of our fleet is a measure of the average daily revenue performance of a vessel. TCE is calculated only in relation to our vessel operations. For time charters, TCE is calculated by
dividing total operating revenues (including revenue from the Cool Pool, but excluding vessel and other management fees and liquefaction services revenue), less any voyage expenses, by the number of calendar days
minus days for scheduled off-hire. We include average daily TCE, a non-GAAP measure, as we believe it provides additional meaningful information in conjunction with total operating revenues, the most directly
comparable US GAAP measure, because it assists our management in making decisions regarding the deployment and use of its vessels and in evaluating their financial performance. Our calculation of average daily
TCE may not be comparable to that reported by other entities. Please see our Q1 earnings release for a reconciliation to the most comparable US GAAP measure: http://www.golarlng.com/investors/results-
centre/highlights
Underlying Contract Earnings Backlog: Underlying contract earnings backlog represents underlying contracted fee income for executed contracts less forecasted operating expenses by the Sergipe Power Plant
Golar Power (in which we hold a 25% interest) and by FSRU Nanook (in which we hold a 50% interest), assuming an exchange rate of 5.3BRL: 1USD. In calculating forecasted operating expenditure, management has
assumed that where there is an Operating Services Agreement the amount receivable under the services agreement will cover the associated operating costs. For contracts, which do not have a separate Operating
Services Agreement management has made an assumption about operating costs based on the current run rate. In the future when our share of underlying contract earnings backlog actualizes, we will show our share
of their earnings net of interest and tax in one line in the Income Statement “Equity in net earnings/(losses) of affiliates”.
Adjusted Net Debt, Contractual Debt, Golar Cash and Golar Restricted Cash: We consolidate a number of lessor VIEs, which means that on consolidation, Golar’s contractual debt under various sale and
leaseback facilities are eliminated and replaced with the assets and liabilities within the lessor VIE’s Financial Statements.
• Contractual Debt represents Golar’s underlying debt obligations as opposed to the obligations of the Lessor VIEs.
• Golar Cash represents Cash and cash equivalents plus Restricted cash and short-term deposits from our Balance Sheet less the portion of restricted cash that relates to the consolidation of the lessor VIEs.
• Golar Restricted Cash represents Restricted cash and short-term deposits – current and non-current portions from our Balance Sheet less the portion of restricted cash that relates to the consolidation of the lessor
VIEs.
• Adjusted Net Debt is calculated by taking net debt as defined by GAAP line items and reversing out the lessor VIE debt and the VIE restricted cash balances and replacing it with Golar’s contractual debt under the
sale and leaseback facilities.
We believe that these measures are useful to investors and users of our financial information in allowing them to assess our liquidity based on our underlying debt obligations and cash position and aids comparability
with our competitors. This presentation is consistent with management’s view of the business. Adjusted Net Debt, Contractual Debt, Golar Cash and Golar Restricted Cash are non-GAAP financial measures and should
not be considered as an alternative to net debt or any other indicator of Golar's performance calculated in accordance with US GAAP. Please see our Q1 earnings release for a reconciliation to the most comparable US
GAAP measure: http://www.golarlng.com/investors/results-centre/highlights