Jump Start: Getting Started with Aspen Plus V8 -...
22
Jump Start: Getting Started with Aspen Plus ® V8 A Brief Tutorial (and supplement to training and online documentation) Jennifer Dyment, Product Marketing, Aspen Technology, Inc. Vidya Mantrala, Product Management, Aspen Technology, Inc. © 2015 Aspen Technology, Inc. AspenTech ® , aspenONE ® , the Aspen leaf logo, the aspenONE logo, and OPTIMIZE are trademarks of Aspen Technology, Inc. All rights reserved.11-7731-0715
Transcript of Jump Start: Getting Started with Aspen Plus V8 -...

Jump Start: Getting Started with Aspen Plus® V8
A Brief Tutorial (and supplement to training and online documentation)
Jennifer Dyment, Product Marketing, Aspen Technology, Inc. Vidya Mantrala, Product Management, Aspen Technology, Inc.
© 2015 Aspen Technology, Inc. AspenTech®, aspenONE®, the Aspen leaf logo, the aspenONE logo, and OPTIMIZE are trademarks of Aspen Technology, Inc. All rights reserved. 11-7731-0715
© 2015 Aspen Technology, Inc. AspenTech®, aspenONE®, the Aspen leaf logo, the aspenONE logo, and OPTIMIZE are trademarks of Aspen Technology, Inc. All rights reserved. 11-7731-0715
Jump Start: Getting Started with Aspen Plus® V8
Table of ContentsIntroduction. . . . . . . . . . . . . . . . . . . . . . . . . . . . . . . . . . . . . . . . . . . . . . . . . . . . . . . . . . . . . . . . . . . . . . . . . . . . . . . . . . . . . . . . . . . . . . . . . . . . . 1
Scope of this Document. . . . . . . . . . . . . . . . . . . . . . . . . . . . . . . . . . . . . . . . . . . . . . . . . . . . . . . . . . . . . . . . . . . . . . . . . . . . . . . . . . . . . . 1
Overview of the New User Interface. . . . . . . . . . . . . . . . . . . . . . . . . . . . . . . . . . . . . . . . . . . . . . . . . . . . . . . . . . . . . . . . . . . . . . . . . . . . . . .2
Window and Form Controls . . . . . . . . . . . . . . . . . . . . . . . . . . . . . . . . . . . . . . . . . . . . . . . . . . . . . . . . . . . . . . . . . . . . . . . . . . . . . . . . . .2
Overview of the Ribbon . . . . . . . . . . . . . . . . . . . . . . . . . . . . . . . . . . . . . . . . . . . . . . . . . . . . . . . . . . . . . . . . . . . . . . . . . . . . . . . . . . . . . .3
The Navigation Pane. . . . . . . . . . . . . . . . . . . . . . . . . . . . . . . . . . . . . . . . . . . . . . . . . . . . . . . . . . . . . . . . . . . . . . . . . . . . . . . . . . . . . . . . 4
Quick Access Toolbar. . . . . . . . . . . . . . . . . . . . . . . . . . . . . . . . . . . . . . . . . . . . . . . . . . . . . . . . . . . . . . . . . . . . . . . . . . . . . . . . . . . . . . . 4
Setting Preferences . . . . . . . . . . . . . . . . . . . . . . . . . . . . . . . . . . . . . . . . . . . . . . . . . . . . . . . . . . . . . . . . . . . . . . . . . . . . . . . . . . . . . . . . . .5
The Zoom Controls . . . . . . . . . . . . . . . . . . . . . . . . . . . . . . . . . . . . . . . . . . . . . . . . . . . . . . . . . . . . . . . . . . . . . . . . . . . . . . . . . . . . . . . . . .5
Copy and Paste, Drag and Drop. . . . . . . . . . . . . . . . . . . . . . . . . . . . . . . . . . . . . . . . . . . . . . . . . . . . . . . . . . . . . . . . . . . . . . . . . . . . . . .5
Environment Buttons . . . . . . . . . . . . . . . . . . . . . . . . . . . . . . . . . . . . . . . . . . . . . . . . . . . . . . . . . . . . . . . . . . . . . . . . . . . . . . . . . . . . . . . .6
Starting a New Case . . . . . . . . . . . . . . . . . . . . . . . . . . . . . . . . . . . . . . . . . . . . . . . . . . . . . . . . . . . . . . . . . . . . . . . . . . . . . . . . . . . . . . . . . . . . .7
The Properties Environment . . . . . . . . . . . . . . . . . . . . . . . . . . . . . . . . . . . . . . . . . . . . . . . . . . . . . . . . . . . . . . . . . . . . . . . . . . . . . . . . . . . . . .7
Adding Components. . . . . . . . . . . . . . . . . . . . . . . . . . . . . . . . . . . . . . . . . . . . . . . . . . . . . . . . . . . . . . . . . . . . . . . . . . . . . . . . . . . . . . . . .7
Selecting a Property Method . . . . . . . . . . . . . . . . . . . . . . . . . . . . . . . . . . . . . . . . . . . . . . . . . . . . . . . . . . . . . . . . . . . . . . . . . . . . . . . . 8
Properties Controls . . . . . . . . . . . . . . . . . . . . . . . . . . . . . . . . . . . . . . . . . . . . . . . . . . . . . . . . . . . . . . . . . . . . . . . . . . . . . . . . . . . . . . . . . .9
The Simulation Environment: Building the Flowsheet. . . . . . . . . . . . . . . . . . . . . . . . . . . . . . . . . . . . . . . . . . . . . . . . . . . . . . . . . . . . . . . .9
Adding Flowsheet Objects: The Model Palette . . . . . . . . . . . . . . . . . . . . . . . . . . . . . . . . . . . . . . . . . . . . . . . . . . . . . . . . . . . . . . . . .9
Add an Object from the Palette to the Flowsheet . . . . . . . . . . . . . . . . . . . . . . . . . . . . . . . . . . . . . . . . . . . . . . . . . . . . . . . . . .10
Specify Material Streams. . . . . . . . . . . . . . . . . . . . . . . . . . . . . . . . . . . . . . . . . . . . . . . . . . . . . . . . . . . . . . . . . . . . . . . . . . . . . . . . . . . . 11
Specify Unit Operations . . . . . . . . . . . . . . . . . . . . . . . . . . . . . . . . . . . . . . . . . . . . . . . . . . . . . . . . . . . . . . . . . . . . . . . . . . . . . . . . . . . . . 11
Flowsheet Controls . . . . . . . . . . . . . . . . . . . . . . . . . . . . . . . . . . . . . . . . . . . . . . . . . . . . . . . . . . . . . . . . . . . . . . . . . . . . . . . . . . . . . . . . . . . . . 12
The Flowsheet Modify Ribbon . . . . . . . . . . . . . . . . . . . . . . . . . . . . . . . . . . . . . . . . . . . . . . . . . . . . . . . . . . . . . . . . . . . . . . . . . . . . . . . 12
Find Object . . . . . . . . . . . . . . . . . . . . . . . . . . . . . . . . . . . . . . . . . . . . . . . . . . . . . . . . . . . . . . . . . . . . . . . . . . . . . . . . . . . . . . . . . . . . 12
Flowsheet Hierarchy. . . . . . . . . . . . . . . . . . . . . . . . . . . . . . . . . . . . . . . . . . . . . . . . . . . . . . . . . . . . . . . . . . . . . . . . . . . . . . . . . . . . 13
Flowsheet Display Options . . . . . . . . . . . . . . . . . . . . . . . . . . . . . . . . . . . . . . . . . . . . . . . . . . . . . . . . . . . . . . . . . . . . . . . . . . . . . . 13
Flowsheet Formatting Ribbon. . . . . . . . . . . . . . . . . . . . . . . . . . . . . . . . . . . . . . . . . . . . . . . . . . . . . . . . . . . . . . . . . . . . . . . . . . . .14
Run and Analyze the Model . . . . . . . . . . . . . . . . . . . . . . . . . . . . . . . . . . . . . . . . . . . . . . . . . . . . . . . . . . . . . . . . . . . . . . . . . . . . . . . . . . . . .14
Sensitivity Study. . . . . . . . . . . . . . . . . . . . . . . . . . . . . . . . . . . . . . . . . . . . . . . . . . . . . . . . . . . . . . . . . . . . . . . . . . . . . . . . . . . . . . . . . . . .14
Optimization Study . . . . . . . . . . . . . . . . . . . . . . . . . . . . . . . . . . . . . . . . . . . . . . . . . . . . . . . . . . . . . . . . . . . . . . . . . . . . . . . . . . . . . . . . .16
Layered Products and New Integrated Capabilities . . . . . . . . . . . . . . . . . . . . . . . . . . . . . . . . . . . . . . . . . . . . . . . . . . . . . . . . . . . . . . . .16
Activated Analysis . . . . . . . . . . . . . . . . . . . . . . . . . . . . . . . . . . . . . . . . . . . . . . . . . . . . . . . . . . . . . . . . . . . . . . . . . . . . . . . . . . . . . . . . .16
Energy Analysis . . . . . . . . . . . . . . . . . . . . . . . . . . . . . . . . . . . . . . . . . . . . . . . . . . . . . . . . . . . . . . . . . . . . . . . . . . . . . . . . . . . . . . . .16
Economic Analysis . . . . . . . . . . . . . . . . . . . . . . . . . . . . . . . . . . . . . . . . . . . . . . . . . . . . . . . . . . . . . . . . . . . . . . . . . . . . . . . . . . . . .16
Exchanger Design and Rating (EDR). . . . . . . . . . . . . . . . . . . . . . . . . . . . . . . . . . . . . . . . . . . . . . . . . . . . . . . . . . . . . . . . . . . . . .16
Dynamics. . . . . . . . . . . . . . . . . . . . . . . . . . . . . . . . . . . . . . . . . . . . . . . . . . . . . . . . . . . . . . . . . . . . . . . . . . . . . . . . . . . . . . . . . . . . . . . . . . 17
Solids Modeling . . . . . . . . . . . . . . . . . . . . . . . . . . . . . . . . . . . . . . . . . . . . . . . . . . . . . . . . . . . . . . . . . . . . . . . . . . . . . . . . . . . . . . . . . . . . 17
aspenONE® Exchange . . . . . . . . . . . . . . . . . . . . . . . . . . . . . . . . . . . . . . . . . . . . . . . . . . . . . . . . . . . . . . . . . . . . . . . . . . . . . . . . . . . . . . . . . . .18
Additional Resources . . . . . . . . . . . . . . . . . . . . . . . . . . . . . . . . . . . . . . . . . . . . . . . . . . . . . . . . . . . . . . . . . . . . . . . . . . . . . . . . . . . . . . . . . . .19

© 2015 Aspen Technology, Inc. AspenTech®, aspenONE®, the Aspen leaf logo, the aspenONE logo, and OPTIMIZE are trademarks of Aspen Technology, Inc. All rights reserved. 11-7731-0715
Jump Start: Getting Started with Aspen Plus® V8
1
IntroductionAspen Plus® is the market-leading chemical optimization software used by the bulk, fine, specialty, and biochemical
industries, as well as the polymer industry for the design, operation, and optimization of safe, profitable manufacturing
facilities. With an extensive array of unit operations, several specialized work environments, and a robust solver,
modeling in Aspen Plus V8 enables users to:
• Optimize processing capacity and operating conditions
• Ensure model accuracy with best-in-class physical properties
• Monitor safety and operational issues in the plant
• Identify energy savings opportunities and reduce GHG emissions
• Perform economic evaluation to realize savings in the process design
• Improve equipment design and performance
• Work more collaboratively with peers with tighter integration with adjacent products
• Reduce costs and improve product quality and throughput of process involving solids
Aspen Plus V8 builds upon the legacy modeling environment, adding increased value with integrated products and
an improved user experience. The ease of use and flexibility of model calculations have been preserved, while new
capabilities have also been added.
ScopeofthisDocument
This document is intended as a simple “getting started” guide. It will cover the process of creating a new case, setting
up component lists and property methods, and working in the simulation environment to build the model. Integrated
features and specific topics such as energy analysis, economic evaluation, and EDR integration will be discussed at a high
level. For a more in-depth understanding of these topics, we provide links to further documentation and training materials
developed specifically by the AspenTech experts in those areas.
We encourage you to take advantage of our full range of training resources including:
• The AspenTech support website (support.aspentech.com)
• AspenTech online training modules which can be accessed from the Resources ribbon
• AspenTech courses
• AspenTech business consultants
© 2015 Aspen Technology, Inc. AspenTech®, aspenONE®, the Aspen leaf logo, the aspenONE logo, and OPTIMIZE are trademarks of Aspen Technology, Inc. All rights reserved. 11-7731-0715
2
Jump Start: Getting Started with Aspen Plus® V8
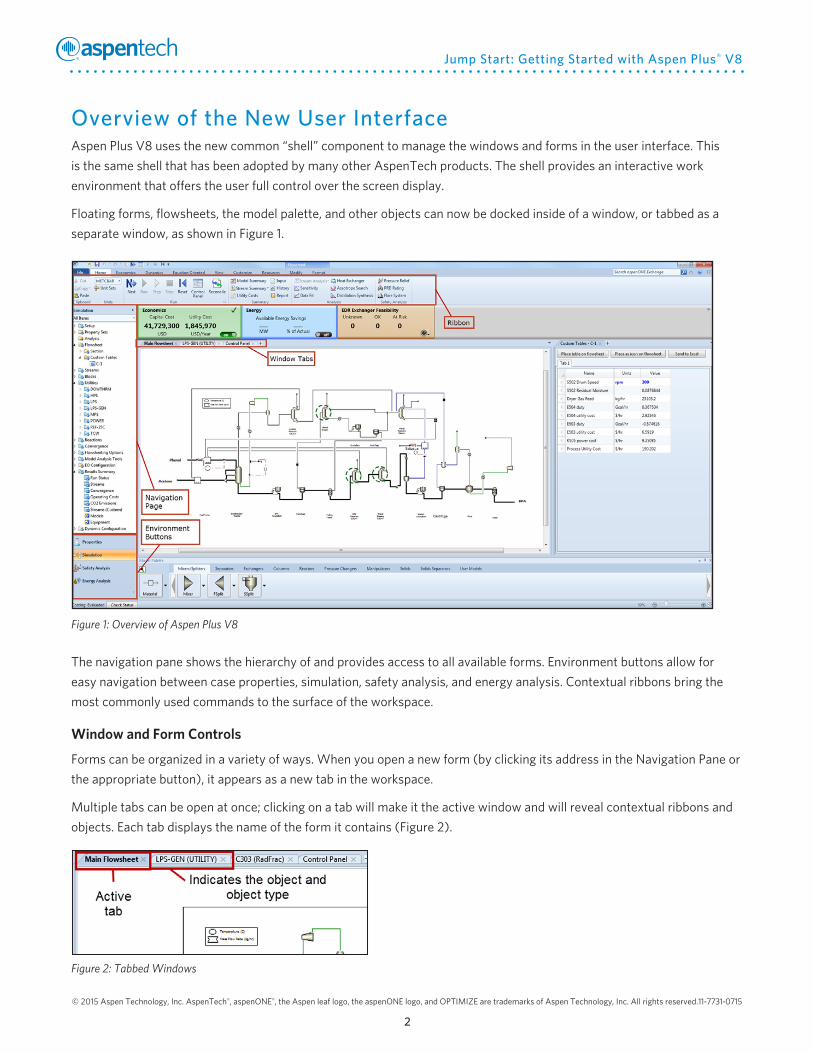
Overview of the New User Interface Aspen Plus V8 uses the new common “shell” component to manage the windows and forms in the user interface. This
is the same shell that has been adopted by many other AspenTech products. The shell provides an interactive work
environment that offers the user full control over the screen display.
Floating forms, flowsheets, the model palette, and other objects can now be docked inside of a window, or tabbed as a
separate window, as shown in Figure 1.
Figure 1: Overview of Aspen Plus V8
The navigation pane shows the hierarchy of and provides access to all available forms. Environment buttons allow for
easy navigation between case properties, simulation, safety analysis, and energy analysis. Contextual ribbons bring the
most commonly used commands to the surface of the workspace.
WindowandFormControls
Forms can be organized in a variety of ways. When you open a new form (by clicking its address in the Navigation Pane or
the appropriate button), it appears as a new tab in the workspace.
Multiple tabs can be open at once; clicking on a tab will make it the active window and will reveal contextual ribbons and
objects. Each tab displays the name of the form it contains (Figure 2).
Figure 2: Tabbed Windows
© 2015 Aspen Technology, Inc. AspenTech®, aspenONE®, the Aspen leaf logo, the aspenONE logo, and OPTIMIZE are trademarks of Aspen Technology, Inc. All rights reserved. 11-7731-0715
Jump Start: Getting Started with Aspen Plus® V8
3
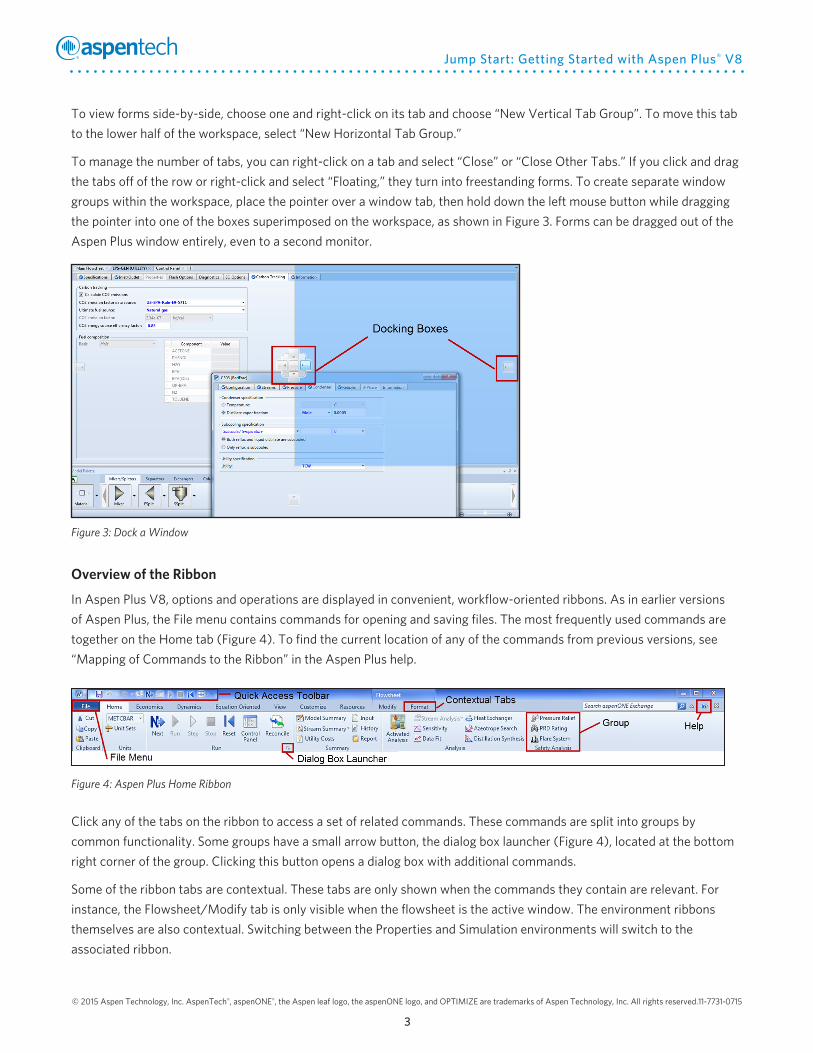
To view forms side-by-side, choose one and right-click on its tab and choose “New Vertical Tab Group”. To move this tab
to the lower half of the workspace, select “New Horizontal Tab Group.”
To manage the number of tabs, you can right-click on a tab and select “Close” or “Close Other Tabs.” If you click and drag
the tabs off of the row or right-click and select “Floating,” they turn into freestanding forms. To create separate window
groups within the workspace, place the pointer over a window tab, then hold down the left mouse button while dragging
the pointer into one of the boxes superimposed on the workspace, as shown in Figure 3. Forms can be dragged out of the
Aspen Plus window entirely, even to a second monitor.
Figure 3: Dock a Window
OverviewoftheRibbon
In Aspen Plus V8, options and operations are displayed in convenient, workflow-oriented ribbons. As in earlier versions
of Aspen Plus, the File menu contains commands for opening and saving files. The most frequently used commands are
together on the Home tab (Figure 4). To find the current location of any of the commands from previous versions, see
“Mapping of Commands to the Ribbon” in the Aspen Plus help.
Figure 4: Aspen Plus Home Ribbon
Click any of the tabs on the ribbon to access a set of related commands. These commands are split into groups by
common functionality. Some groups have a small arrow button, the dialog box launcher (Figure 4), located at the bottom
right corner of the group. Clicking this button opens a dialog box with additional commands.
Some of the ribbon tabs are contextual. These tabs are only shown when the commands they contain are relevant. For
instance, the Flowsheet/Modify tab is only visible when the flowsheet is the active window. The environment ribbons
themselves are also contextual. Switching between the Properties and Simulation environments will switch to the
associated ribbon.

© 2015 Aspen Technology, Inc. AspenTech®, aspenONE®, the Aspen leaf logo, the aspenONE logo, and OPTIMIZE are trademarks of Aspen Technology, Inc. All rights reserved. 11-7731-0715
4
Jump Start: Getting Started with Aspen Plus® V8
Figure 5: Navigation Pane
Figure 6: Sort the Navigation Pane
TheNavigationPane
The navigation pane resides on the left side of the main window (Figure 5). It can be
collapsed using the “<” control on the upper right side of the panel to create more
viewable space in the main window.
You can double-click on a folder in the navigation pane to open its form in the active
window tab. Alternatively, you can right-click an item and select “Open in new tab.”
The navigation pane also shows the status of each form. When input is incomplete,
the circle below the folder is red and half-filled. When input is complete, a blue circle
with a white checkmark is visible. Not all folders have required inputs and some
have neither indicator.
The dropdown menu below the environment heading allows you to sort contents in
the Navigation Pane by Input or Results to easily identify objects, unit operations,
and streams of interest (Figure 6). If you cannot find a form, you are likely in the wrong
environment.
QuickAccessToolbar
The Quick Access Toolbar (QAT) appears on the left side of the title bar (Figure
7). The Undo, Run, Reset, and Next commands are located here, along with other
customizable options. The QAT makes it easy to get to the commands you use
most frequently, because this toolbar remains visible at all times. To add other
commands, right-click on any ribbon icon and select “Add to Quick Access Toolbar.”
For example, adding the “change layout” button to the QAT will make the option to
change layouts readily available without having to navigate to the Home ribbon tab.

© 2015 Aspen Technology, Inc. AspenTech®, aspenONE®, the Aspen leaf logo, the aspenONE logo, and OPTIMIZE are trademarks of Aspen Technology, Inc. All rights reserved. 11-7731-0715
Jump Start: Getting Started with Aspen Plus® V8
5
SettingPreferences
To set preferences, open the File menu and click on “Options” in the bottom right
corner, as shown in Figure 8.
TheZoomControls
There are a set of Zoom controls on the lower right side of the main window.
Moving the slider adjusts the zoom level. Click the “(+)” or “(-)” buttons to zoom
the active window in or out by 10%, click the “zoom fill” button to maximize the
view in the available space, or click the zoom factor to select a preset zoom level.
The zoom bar acts on the process flowsheet, most forms, and on plots (Figure 9).
Figure 9: Zoom Controls
Figure 11: Opening Aspen Plus
Figure 8: Setting Preferences
Figure 7: Quick Access Toolbar
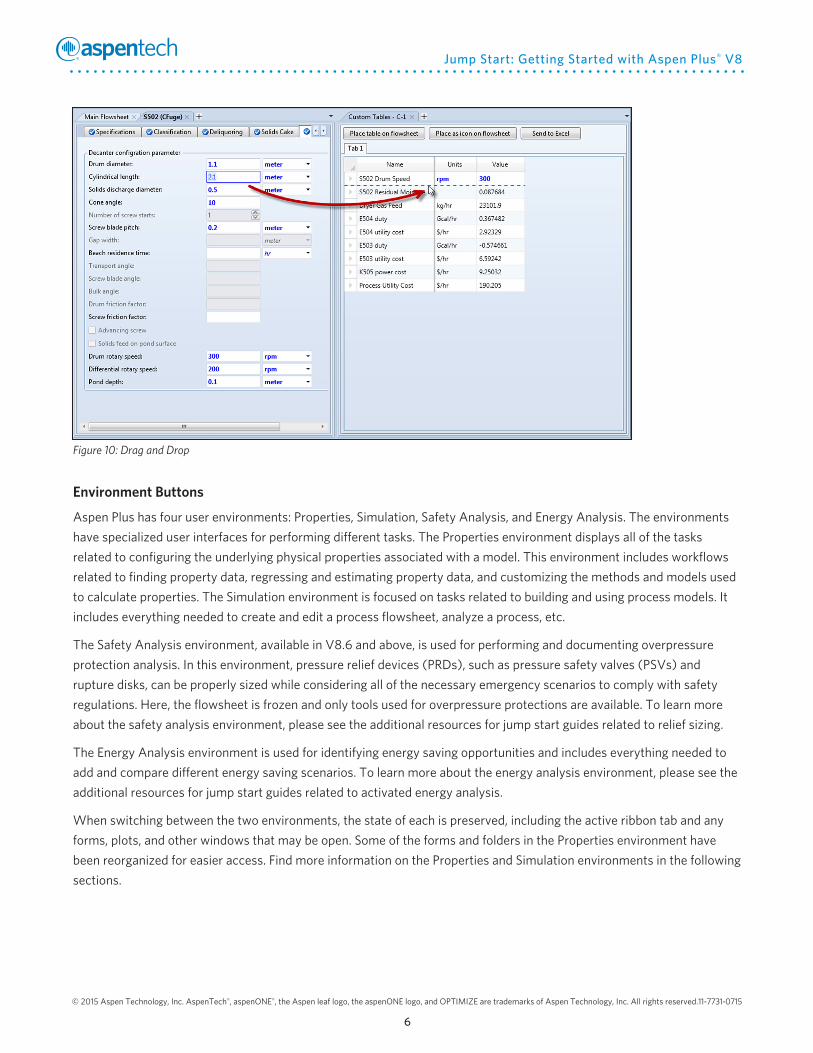
CopyandPaste,DragandDrop
Grid forms in the new Aspen Plus user interface support copy/paste and drag and drop functions for variables from the
workbook and object worksheets, to forms that require input variables such as sensitivity studies, and custom tables.
Copy/paste can be done by right-clicking or using the Ctrl-C and Ctrl-V shortcuts or a “paste” button may be present on
the form you are pasting the variable to. To drag and drop, click and hold the mouse button over the white tile of the
variable you wish to transfer, and drag to the white tile of the location you wish to add it. When dragging and dropping to
an unfilled white box, there will be no change in the mouse, but if a drop into a particular box is not possible, a will
appear. A red dotted line will appear where you can drop a variable into a table (Figure 10). For certain forms, you may
need to click the “Add” button before you can drop a variable.
© 2015 Aspen Technology, Inc. AspenTech®, aspenONE®, the Aspen leaf logo, the aspenONE logo, and OPTIMIZE are trademarks of Aspen Technology, Inc. All rights reserved. 11-7731-0715
6
Jump Start: Getting Started with Aspen Plus® V8
Figure 10: Drag and Drop
EnvironmentButtons
Aspen Plus has four user environments: Properties, Simulation, Safety Analysis, and Energy Analysis. The environments
have specialized user interfaces for performing different tasks. The Properties environment displays all of the tasks
related to configuring the underlying physical properties associated with a model. This environment includes workflows
related to finding property data, regressing and estimating property data, and customizing the methods and models used
to calculate properties. The Simulation environment is focused on tasks related to building and using process models. It
includes everything needed to create and edit a process flowsheet, analyze a process, etc.
The Safety Analysis environment, available in V8.6 and above, is used for performing and documenting overpressure
protection analysis. In this environment, pressure relief devices (PRDs), such as pressure safety valves (PSVs) and
rupture disks, can be properly sized while considering all of the necessary emergency scenarios to comply with safety
regulations. Here, the flowsheet is frozen and only tools used for overpressure protections are available. To learn more
about the safety analysis environment, please see the additional resources for jump start guides related to relief sizing.
The Energy Analysis environment is used for identifying energy saving opportunities and includes everything needed to
add and compare different energy saving scenarios. To learn more about the energy analysis environment, please see the
additional resources for jump start guides related to activated energy analysis.
When switching between the two environments, the state of each is preserved, including the active ribbon tab and any
forms, plots, and other windows that may be open. Some of the forms and folders in the Properties environment have
been reorganized for easier access. Find more information on the Properties and Simulation environments in the following
sections.

© 2015 Aspen Technology, Inc. AspenTech®, aspenONE®, the Aspen leaf logo, the aspenONE logo, and OPTIMIZE are trademarks of Aspen Technology, Inc. All rights reserved. 11-7731-0715
Jump Start: Getting Started with Aspen Plus® V8
7
Starting a New CaseOpen Aspen Plus from the Windows start menu by clicking on the AspenTech folder >
Process Modeling V8 > Aspen Plus, as shown in Figure 11.
When Aspen Plus opens, you will see the Start Page, as well as Recent Cases (Figure
12). To create a new case, click on New in the top left box, or File > New. Choose either
a blank simulation or from a list of installed templates or custom templates. Templates
automatically specify the units, the property methods used, and the flow basis for input
and reports.
Figure 12: New File Templates
Figure 11: Opening Aspen Plus
The Properties EnvironmentAll new cases start in the Properties environment. This is where you will select the components to be used in your model
and set the calculation methods for physical properties. You cannot enter the Simulation environment until at least one
component has been created and a property method has been specified.
AddingComponents
The first step to building a model is to create a list that will contain all of the components that will be used in your
process. Later, when you specify a stream in the simulation environment, you will need to choose a component list for
that stream. Aspen Plus supports components from Aspen Properties, including the NIST database.
To add a component, click the Find button and use the search form to select which type of components to add to the list.
When you type in the box for the name or alias and press Find Now, Aspen Plus will automatically populate matches in
the grid below. Double-clicking on the compound or clicking Add Selected Compounds will add the selected component
to the list (Figure 13).

© 2015 Aspen Technology, Inc. AspenTech®, aspenONE®, the Aspen leaf logo, the aspenONE logo, and OPTIMIZE are trademarks of Aspen Technology, Inc. All rights reserved. 11-7731-0715
8
Jump Start: Getting Started with Aspen Plus® V8
Figure 13: Add Components
SelectingaPropertyMethod
You must choose a Property Method for your simulation. Click on the Methods folder in the navigation pane or on the
Methods icon from the Home ribbon.
Click on Method Filter dropdown to choose a process type. Next, click on the Base Method dropdown to choose a
property method to use and add Henry Components as necessary. Alternatively, choose from the Method Name
dropdown which displays all of the available property methods. If unsure of the property method to use, click on the
Method Assistant for help. Hovering over the property method will give a short description (Figure 14).
Figure 14: Select a Method for the Property Calculations
© 2015 Aspen Technology, Inc. AspenTech®, aspenONE®, the Aspen leaf logo, the aspenONE logo, and OPTIMIZE are trademarks of Aspen Technology, Inc. All rights reserved. 11-7731-0715
Jump Start: Getting Started with Aspen Plus® V8
9
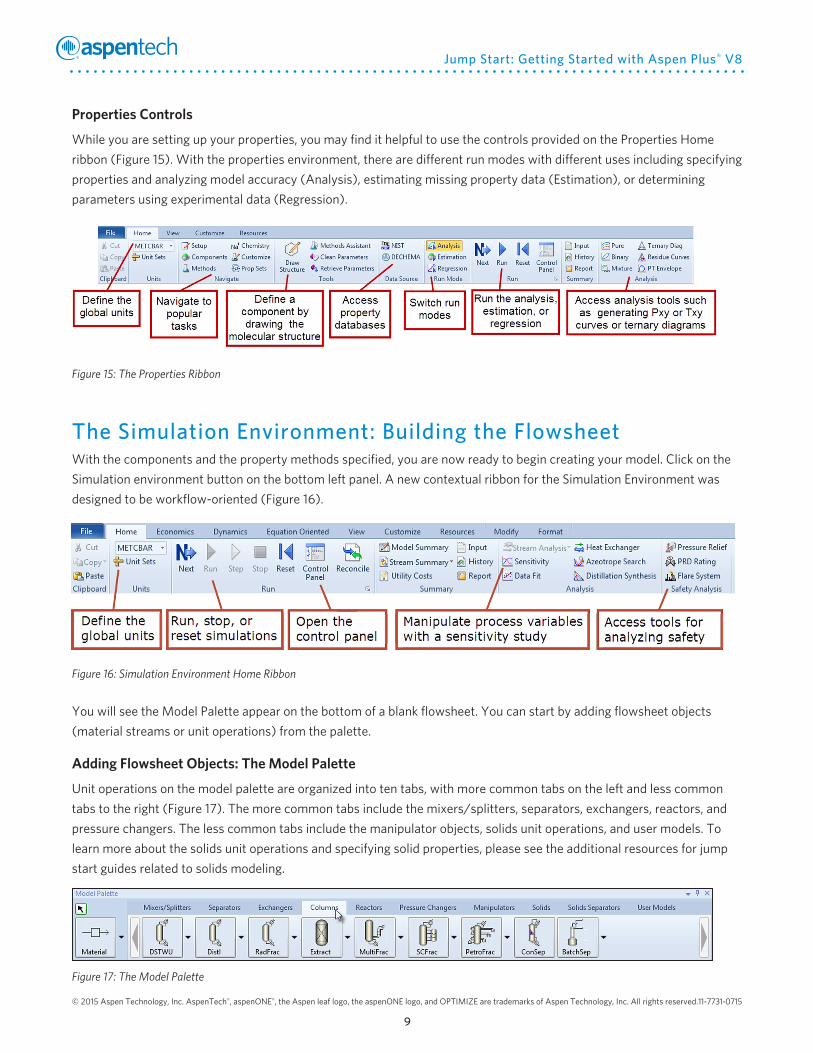
PropertiesControls
While you are setting up your properties, you may find it helpful to use the controls provided on the Properties Home
ribbon (Figure 15). With the properties environment, there are different run modes with different uses including specifying
properties and analyzing model accuracy (Analysis), estimating missing property data (Estimation), or determining
parameters using experimental data (Regression).
Figure 15: The Properties Ribbon
The Simulation Environment: Building the FlowsheetWith the components and the property methods specified, you are now ready to begin creating your model. Click on the
Simulation environment button on the bottom left panel. A new contextual ribbon for the Simulation Environment was
designed to be workflow-oriented (Figure 16).
Figure 16: Simulation Environment Home Ribbon
You will see the Model Palette appear on the bottom of a blank flowsheet. You can start by adding flowsheet objects
(material streams or unit operations) from the palette.
AddingFlowsheetObjects:TheModelPalette
Unit operations on the model palette are organized into ten tabs, with more common tabs on the left and less common
tabs to the right (Figure 17). The more common tabs include the mixers/splitters, separators, exchangers, reactors, and
pressure changers. The less common tabs include the manipulator objects, solids unit operations, and user models. To
learn more about the solids unit operations and specifying solid properties, please see the additional resources for jump
start guides related to solids modeling.
Figure 17: The Model Palette

© 2015 Aspen Technology, Inc. AspenTech®, aspenONE®, the Aspen leaf logo, the aspenONE logo, and OPTIMIZE are trademarks of Aspen Technology, Inc. All rights reserved. 11-7731-0715
10
Jump Start: Getting Started with Aspen Plus® V8
Material streams can be added using the black arrow, and energy and work streams can be added using the dashed
arrows accessed by clicking the dropdown arrow to the right of the material stream. If you close the palette, you can
re-open it from the View ribbon or by using the F10 keyboard shortcut.
Add an Object from the Palette to the Flowsheet
To place an object (unit operation, material stream, or energy stream) on the flowsheet, click the icon in the palette
and move the mouse over the flowsheet to where you would like to place the object. You will see that the mouse has
turned into a plus sign, indicating that when you click the mouse again, the object will be added. If you wish to adjust the
flowsheet without adding more of the selected objects, right-click on any blank spot on the flowsheet or click the cursor
icon on the upper left corner of the model palette to get the normal cursor back.
If you hover a material stream over a unit operation, several arrows will appear; some red and others blue. Red arrows
indicate required inputs and required outputs for the unit operations. Blue arrows are optional and should be specified
after the required inputs or outputs. Hover over any arrow to get a tooltip description of what it represents to the system,
for example, “Side Product” for a Distillation Column (Figure 18). To run the model, one of the requirements is that
all of the red arrows of each unit operation on the spreadsheet are filled and that each steam has either a source or a
destination.
Figure 18: Adding Material Streams to Unit Operations
After a material or energy stream has been created, you can add or change its destination or source by right clicking the
stream and then choosing the new destination/source. If you wish to delete an object, select it and then press the Delete
key on your keyboard.
Note: The block placer does not deactivate after you place a single block on the flowsheet, a single block, so you can
place as many as you want in a row without having to re-click the icon on the model palette. To deactivate the placer,
click on the cursor icon in the upper left corner of the model palette. This is the same for the material streams.
© 2015 Aspen Technology, Inc. AspenTech®, aspenONE®, the Aspen leaf logo, the aspenONE logo, and OPTIMIZE are trademarks of Aspen Technology, Inc. All rights reserved. 11-7731-0715
Jump Start: Getting Started with Aspen Plus® V8
11
The right-mouse click menu allows you to perform all of the standard commands for an object such as cut, copy, and
paste. It also contains a number of extended functions such as icon rotation, renaming the object, opening a form as
a new tab, and changing the unit operation’s icon. Aspen Plus defaults to 3D icons but you can switch to 2D icons by
unchecking the 3D Icons box located in the Unit Operations group in the Flowsheet/Modify ribbon.
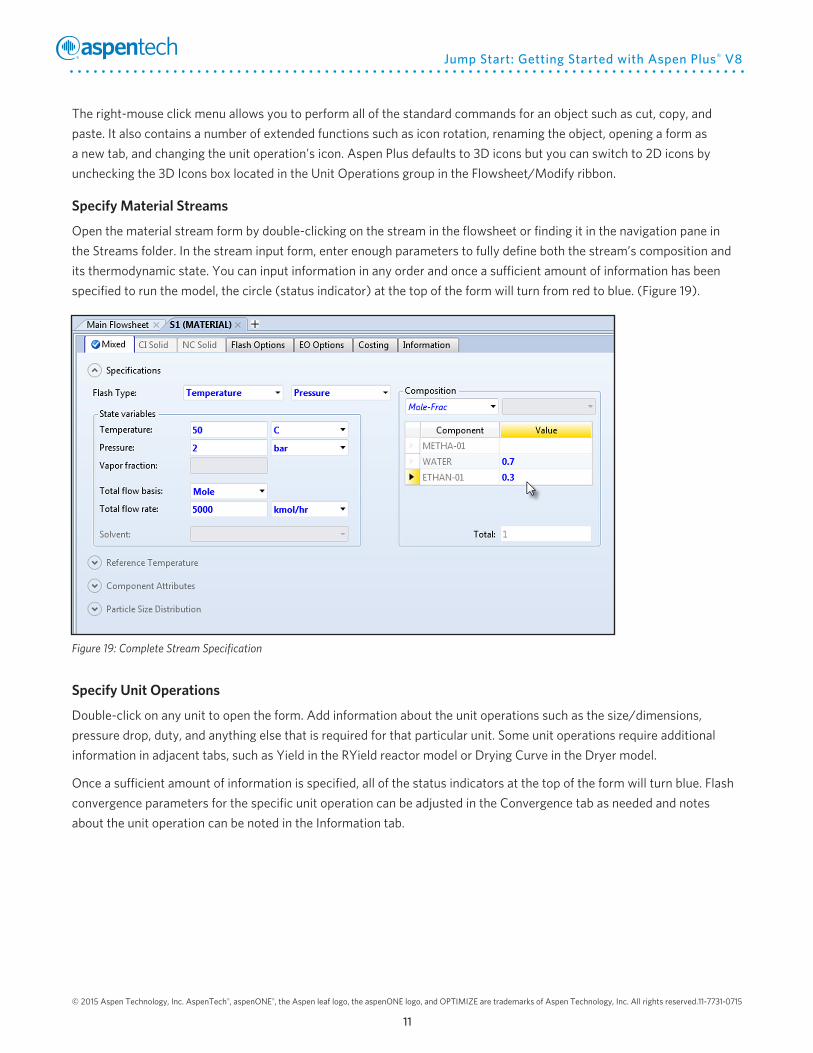
SpecifyMaterialStreams
Open the material stream form by double-clicking on the stream in the flowsheet or finding it in the navigation pane in
the Streams folder. In the stream input form, enter enough parameters to fully define both the stream’s composition and
its thermodynamic state. You can input information in any order and once a sufficient amount of information has been
specified to run the model, the circle (status indicator) at the top of the form will turn from red to blue. (Figure 19).
Figure 19: Complete Stream Specification
SpecifyUnitOperations
Double-click on any unit to open the form. Add information about the unit operations such as the size/dimensions,
pressure drop, duty, and anything else that is required for that particular unit. Some unit operations require additional
information in adjacent tabs, such as Yield in the RYield reactor model or Drying Curve in the Dryer model.
Once a sufficient amount of information is specified, all of the status indicators at the top of the form will turn blue. Flash
convergence parameters for the specific unit operation can be adjusted in the Convergence tab as needed and notes
about the unit operation can be noted in the Information tab.

© 2015 Aspen Technology, Inc. AspenTech®, aspenONE®, the Aspen leaf logo, the aspenONE logo, and OPTIMIZE are trademarks of Aspen Technology, Inc. All rights reserved. 11-7731-0715
12
Jump Start: Getting Started with Aspen Plus® V8
Flowsheet ControlsWhile you are building your flowsheet, you may find it helpful to use the controls provided on the Flowsheet/Modify
ribbon (Figure 20). We will cover some of the most commonly used functions here.
TheFlowsheetModifyRibbon
Figure 20: Flowsheet/Modify ribbon
Find Object
The Find Object button, located on the Flowsheet/Modify tab, can be used both to locate any object on a large flowsheet
and to directly open any object form. Click on the icon from the Flowsheet ribbon to open the Find Object. Scroll through
the blocks or streams and select an object to locate. If you click the Zoom View checkbox, pressure find will zoom into
the selected object (Figure 21). Center View will not zoom in the object, but just adjust the flowsheet so that the object is
at the center. Blocks and steams can also be located in the navigation pane and the opening folder will display all of the
forms associated with that object.
Figure 21: Find Object
© 2015 Aspen Technology, Inc. AspenTech®, aspenONE®, the Aspen leaf logo, the aspenONE logo, and OPTIMIZE are trademarks of Aspen Technology, Inc. All rights reserved. 11-7731-0715
Jump Start: Getting Started with Aspen Plus® V8
13
Flowsheet Hierarchy
In large complex flowsheets, it is often useful to organize processes into smaller stages. In this case, blocks represent a
particular group of operations. If you double-click on any of these blocks, you will be able to immediately enter the sub-
flowsheet environment. You can also right-click on the block and use the “Open Child” selection or click “Open Child” in
the Hierarchy group on the Flowsheet/Modify ribbon. Inside the subflowsheet, you will see only objects related to that
particular part of the process. Use the “View Parent” Ribbon button to navigate back to the main flowsheet. You can
import or export hierarchy blocks using backup files.
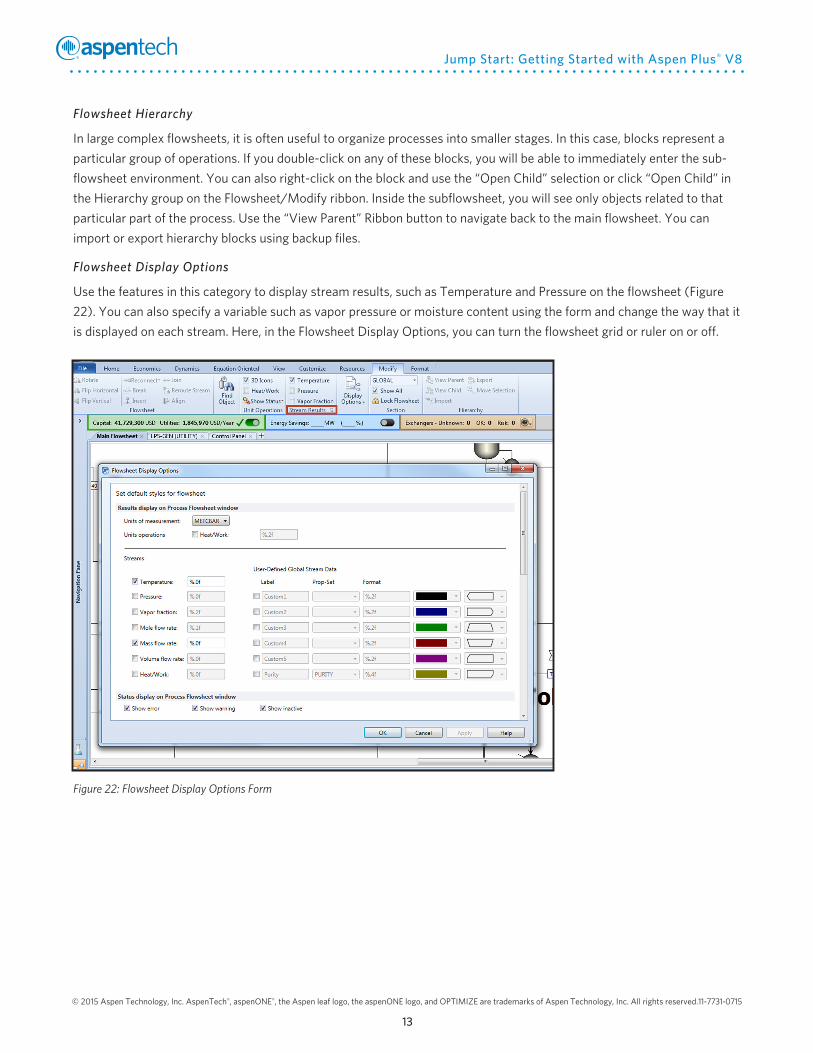
Flowsheet Display Options
Use the features in this category to display stream results, such as Temperature and Pressure on the flowsheet (Figure
22). You can also specify a variable such as vapor pressure or moisture content using the form and change the way that it
is displayed on each stream. Here, in the Flowsheet Display Options, you can turn the flowsheet grid or ruler on or off.
Figure 22: Flowsheet Display Options Form

© 2015 Aspen Technology, Inc. AspenTech®, aspenONE®, the Aspen leaf logo, the aspenONE logo, and OPTIMIZE are trademarks of Aspen Technology, Inc. All rights reserved. 11-7731-0715
14
Jump Start: Getting Started with Aspen Plus® V8
Flowsheet Formatting Ribbon
Only visible when the flowsheet is open and selected, the flowsheet/format ribbon allows you to format the flowsheet
with text, arrows, boxes, and different stream colors, widths, and styles (Figure 23).
Figure 23: Flowsheet Formatting Ribbon
Run and Analyze the ModelAfter all of the inputs are complete, run the model to see the results of the simulation. If your process involves a lot of
recycle loops, it is advised to complete the flowsheet and troubleshoot any issues you may have with your inputs before
adding the recycle loops.
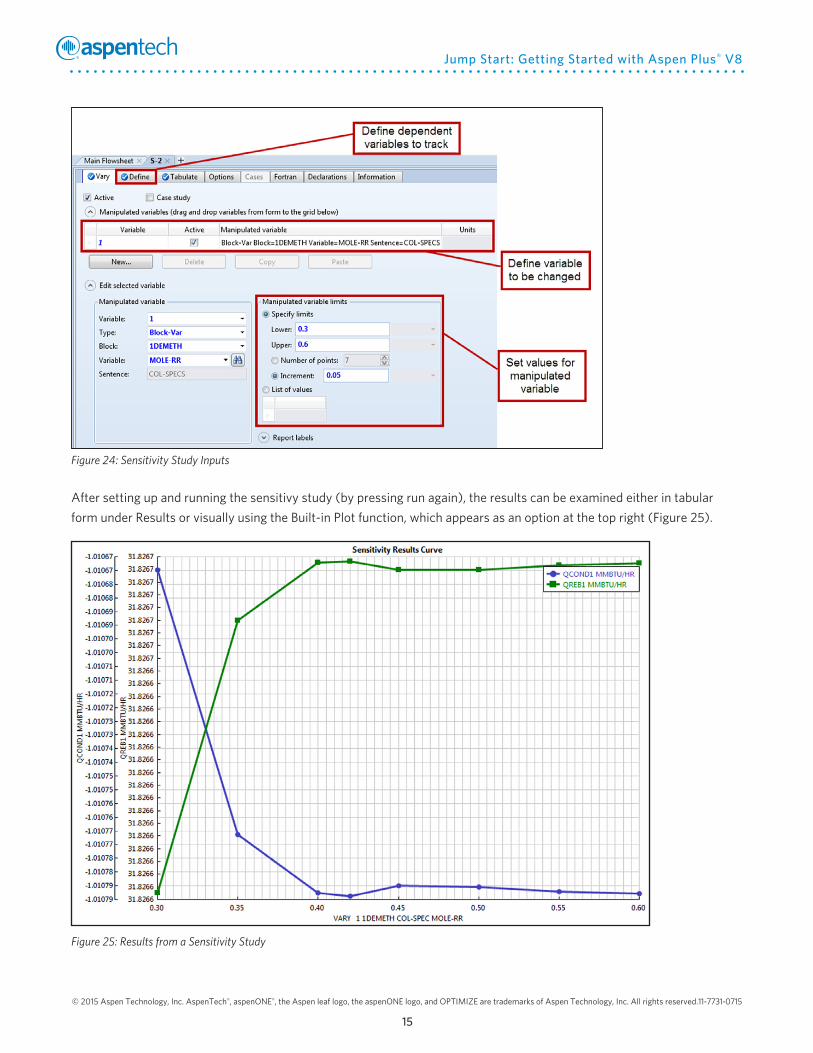
SensitivityStudy
Once a model has calculated results, you can investigate how changing one or more variables changes the rest of the
model. For instance, you can see how varying the rotary speed of a centrifuge would change the duty of a downstream
dryer. Variables can be copied and pasted or dragged and dropped from other forms to ease the input of variables. The
sensitivity study tool can be accessed by clicking the Sensitivity icon in the Home ribbon under the Analysis group or
through the Navigation Pane under Model Analysis Tools. In the Vary tab, define one or more variables to be changed
and a set of values to evaluate for every variable either in a list or using a range and increments. In the Define tab, specify
the variables you would like to track with every change in the manipulated variable and in the Tabulate “fill variables” to
include all of the tracked variables in the results (Figure 24).
© 2015 Aspen Technology, Inc. AspenTech®, aspenONE®, the Aspen leaf logo, the aspenONE logo, and OPTIMIZE are trademarks of Aspen Technology, Inc. All rights reserved. 11-7731-0715
Jump Start: Getting Started with Aspen Plus® V8
15
Figure 24: Sensitivity Study Inputs
After setting up and running the sensitivy study (by pressing run again), the results can be examined either in tabular
form under Results or visually using the Built-in Plot function, which appears as an option at the top right (Figure 25).
Figure 25: Results from a Sensitivity Study

© 2015 Aspen Technology, Inc. AspenTech®, aspenONE®, the Aspen leaf logo, the aspenONE logo, and OPTIMIZE are trademarks of Aspen Technology, Inc. All rights reserved. 11-7731-0715
16
Jump Start: Getting Started with Aspen Plus® V8
OptimizationStudy
To further improve your process model, an optimization study can be set up to find the optimal value of a variable to
minimize or maximize another variable while considering constraint(s) of the former variable. After setting up and
running the optimization study (by pressing run again), the results can be examined.
Layered Products and New Integrated CapabilitiesIn Aspen Plus V8, there is more seamless integration of layered tools. Dynamics and Equation Oriented Modeling have
their own contextual ribbons. Energy Analysis, Economic Evaluation, and Exchanger Design and Rating (EDR) can be
activated within the simulation to automatically calculate the energy cost and savings potential and the equipment cost
for the flowsheet, and to automatically size heat exchanger designs using rigorous EDR models. An overview of some of
the integrated capabilities is provided below. For more information, see the Additional Resources section.
ActivatedAnalysis
Activated Analysis is intended to guide design decisions through automatic energy analysis, economic analysis, and
exchanger design and rating. The Activated Analysis panel displays key performance indicators which are recalculated
each time you change or run the simulation case (Figure 26). In Aspen Plus V8.8 and higher, the Activated Analysis panel
is expandable to reveal more information to be shown (Figure 26). In Aspen Plus V8.0-V8.6, the Activated Analysis panel
is accessible by clicking the “Activated Analysis” button in the home ribbon.
Figure 26: Activated Analysis
Energy Analysis
Activated energy analysis can be used to calculate current energy costs and potential savings; it can also automatically
generate suggestions to improve the heat exchanger network design for the flowsheet. In the Energy Analysis
Environment, you can view details of the current heat exchanger network and create custom scenarios for energy saving
designs.
Economic Analysis
The Activated Economic Analysis pane displays the relative capital cost and utility cost for the process. The reported
values are based on calculations from Aspen Process Economic Analyzer.
© 2015 Aspen Technology, Inc. AspenTech®, aspenONE®, the Aspen leaf logo, the aspenONE logo, and OPTIMIZE are trademarks of Aspen Technology, Inc. All rights reserved. 11-7731-0715
Jump Start: Getting Started with Aspen Plus® V8
17
Exchanger Design and Rating (EDR)
The Activated EDR pane displays the heat exchangers in the flowsheet, and if any operational risks are present, it
enables you to easily track which exchangers have been converted to rigorous models. Using Activated EDR, you can
automatically convert any simple-end-point or steady-state rating Shell&Tube, AirCooled, or Plate heat exchanger model
into a fully rigorous Aspen Exchanger Design & Rating (EDR) model inside Aspen Plus.
Dynamics
Dynamic simulation mode addresses non-steady-state processes, such as plant start-up and shut-down. It can be used
to test control systems, monitor safety considerations, and assess performance problems. In Aspen Plus V8, models can
be prepared and sent to Aspen Plus Dynamics for dynamic analysis using the Dynamics button on the Dynamics ribbon.
Converting your model from steady-state to dynamic requires additional input on the unit operation forms. Refer to
Additional Resources for more information.
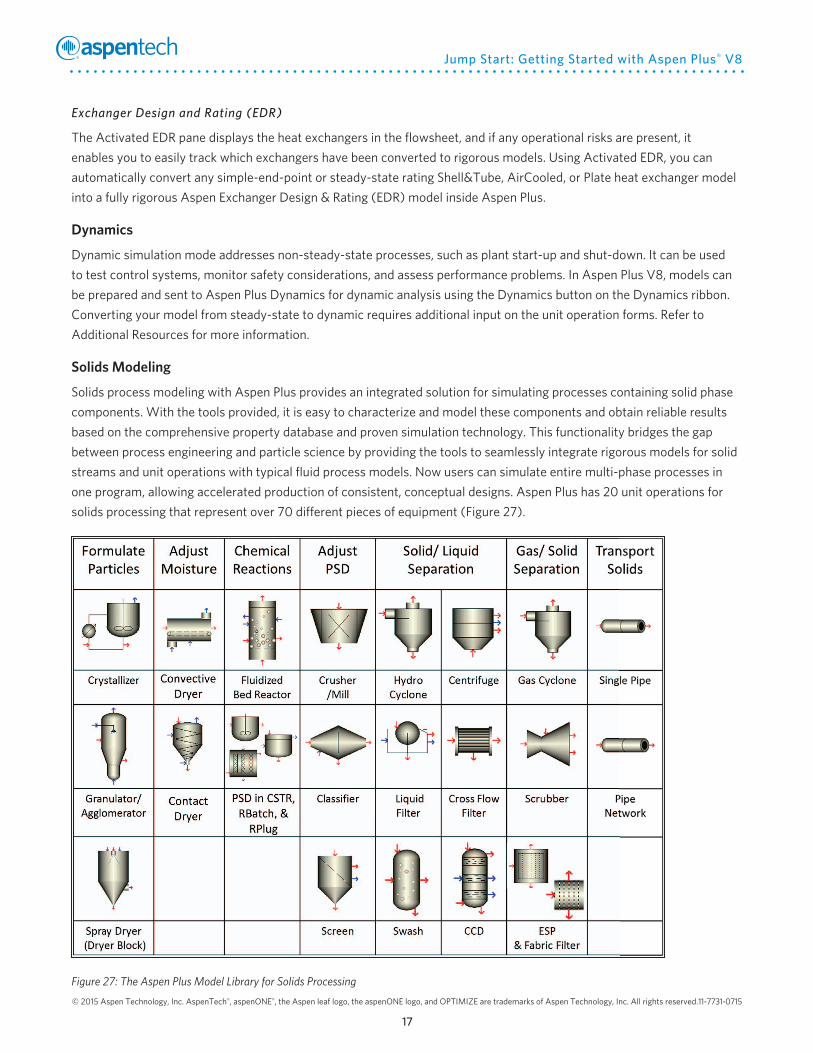
SolidsModeling
Solids process modeling with Aspen Plus provides an integrated solution for simulating processes containing solid phase
components. With the tools provided, it is easy to characterize and model these components and obtain reliable results
based on the comprehensive property database and proven simulation technology. This functionality bridges the gap
between process engineering and particle science by providing the tools to seamlessly integrate rigorous models for solid
streams and unit operations with typical fluid process models. Now users can simulate entire multi-phase processes in
one program, allowing accelerated production of consistent, conceptual designs. Aspen Plus has 20 unit operations for
solids processing that represent over 70 different pieces of equipment (Figure 27).
Figure 27: The Aspen Plus Model Library for Solids Processing
© 2015 Aspen Technology, Inc. AspenTech®, aspenONE®, the Aspen leaf logo, the aspenONE logo, and OPTIMIZE are trademarks of Aspen Technology, Inc. All rights reserved. 11-7731-0715
18
Jump Start: Getting Started with Aspen Plus® V8
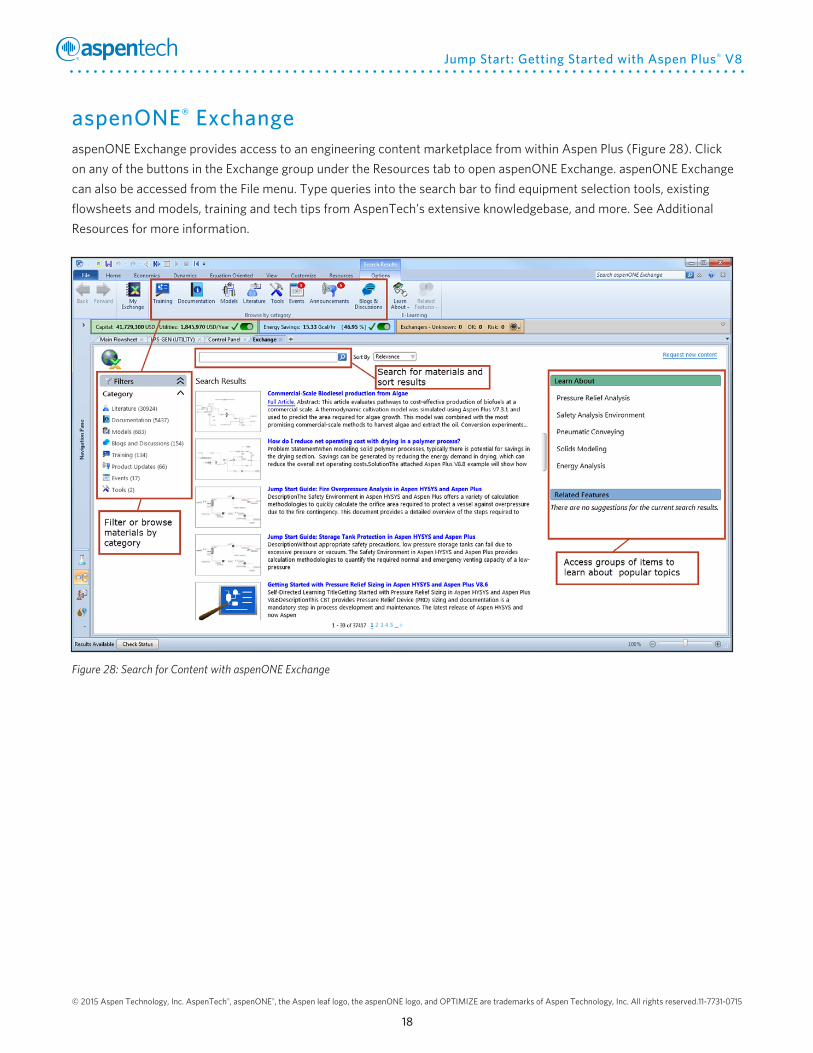
aspenONE® ExchangeaspenONE Exchange provides access to an engineering content marketplace from within Aspen Plus (Figure 28). Click
on any of the buttons in the Exchange group under the Resources tab to open aspenONE Exchange. aspenONE Exchange
can also be accessed from the File menu. Type queries into the search bar to find equipment selection tools, existing
flowsheets and models, training and tech tips from AspenTech’s extensive knowledgebase, and more. See Additional
Resources for more information.
Figure 28: Search for Content with aspenONE Exchange
© 2015 Aspen Technology, Inc. AspenTech®, aspenONE®, the Aspen leaf logo, the aspenONE logo, and OPTIMIZE are trademarks of Aspen Technology, Inc. All rights reserved. 11-7731-0715
Jump Start: Getting Started with Aspen Plus® V8
19
Additional Resources
AspenTech Public Website
http://www.aspentech.com/products/aspen-Plus.aspx
Video Tutorials
ActivatedAnalysisinAspenPlusChemicalProcessOptimizationSoftware
IntroducingActivatedEconomicsinAspenPlusChemicalProcessOptimizationSoftware
IntroducingActivatedExchangerDesign&RatinginAspenPlusChemicalProcessOptimizationSoftware
AspenPlusComputerBasedTrainingforChemicalProcessModeling
ActivatedEnergyinAspenPlusChemicalProcessOptimizationSoftware
IntrotoSolidsModelinginAspenPlusV8
Jump Start Guides
JumpStart:ActivationinAspenPlus
JumpStart:SizingRigorousShell&TubeExchangerswithinAspenPlus
JumpStart:aspenONEExchange
JumpStart:SolidsProcessModelinginAspenPlus
White Papers
WhitePaper:OverviewofSolidsModelingforChemicalProcesses
WhitePaper:PrepareaFlowSheetforEnergyAnalysisinAspenPlusandAspenHYSYS

About AspenTech
AspenTech is a leading supplier of software that optimizes process manufacturing—for energy,
chemicals, engineering and construction, and other industries that manufacture and produce products
from a chemical process. With integrated aspenONE® solutions, process manufacturers can implement
best practices for optimizing their engineering, manufacturing, and supply chain operations. As a result,
AspenTech customers are better able to increase capacity, improve margins, reduce costs, and become
more energy efficient. To see how the world’s leading process manufacturers rely on AspenTech to
achieve their operational excellence goals, visit www.aspentech.com. Worldwide Headquarters
Aspen Technology, Inc. 20 Crosby Drive Bedford, MA 01730 United States
phone: +1–781–221–6400 fax: +1–781–221–6410 [email protected]
Regional Headquarters
Houston, TX | USA phone: +1–281–584–1000
São Paulo | Brazil phone: +55–11–3443–6261
Reading | United Kingdom phone: +44–(0)–1189–226400
Singapore | Republic of Singapore phone: +65–6395–3900
Manama | Bahrain phone: +973–17–50–3000
For a complete list of offices, please visit www.aspentech.com/locations
© 2015 Aspen Technology, Inc. AspenTech®, aspenONE®, the aspenONE® logo, the Aspen leaf logo, and OPTIMIZE are trademarks of Aspen Technology, Inc. All rights reserved. All other trademarks are property of their respective owners. 11-7731-0715