Judicial Nominations and Confirmations in Obama’s First Term · 2016-07-21 · Bush 2 67% 95%...
19
Reuters Judicial Nominations and Confirmations in Obama’s First Term Russell Wheeler December 13, 2012
Transcript of Judicial Nominations and Confirmations in Obama’s First Term · 2016-07-21 · Bush 2 67% 95%...
Reuters
Judicial Nominations and Confirmations in Obama’s First Term
Russell Wheeler
December 13, 2012
Judicial Nominations and Confirmations in Obama’s First Term 1
Russell Wheeler is a visiting fellow in the Brookings Institution’s Governance Studies Program and president of the Governance Institute, a small, non-partisan think tank.
E X E C U T I V E S U M M A R Y
Three things stand out about President Barack Obama’s First Term efforts to appoint federal judges:
● His first term will end with more vacancies than when it started because of, comparatively, fewer nominees, later submission dates, and a weaker district nominee confirmation rate.
● The contentiousness that affected President William Clinton’s and President George W. Bush’s efforts to appoint judges to the courts of appeals did not appear to worsen during Obama’s first term, but battles have heated up over district nominations.
- Circuit judge confirmation rates have been in a downward spiral over the last 40 years. Despite the 71 percent circuit confirmation rate, however, Obama has shifted the composition of some courts and may be able to achieve a larger change by the end of his second term.
THE FULL EIGHT OR FOUR TERM RATES
Courts of Appeal District Courts
Reagan 88% 94% Bush 1 79% 79%* Clinton 77% 86% Bush 2 67% 95% Obama (as of Dec. 12, 2012) 71% 78%
*--The Senate confirmed 48 of President George H.W. Bush’s 52 1989-90 district nominees and 101 his 147 1991-92 nominees, which depressed the four year rate (Source: Congressional Research Service) .Many unconfirmed nominees were for district judgeships created in late 1990.
District judge confirmations have, at least until recently, stayed fairly high.
Obama’s comparatively low 78 percent rate was depressed in part by an unusual spate of late-term nominees; discounting them, his rate is 86 percent.
● The elapsed times for making district court nominations and confirming them have grown to eye-popping levels.
- The 610 average number of days between the dates of district court vacancies and confirmations for Obama appointees far outpaces the 447 average days for Clinton and 420 average days for Bush.
- The average for Obama circuit appointees, however, was 454 days, below Clinton’s 483 average and Bush’s 509.
This paper summarizes Obama’s first term as of December 12, 2012, (and
Judicial Nominations and Confirmations in Obama’s First Term
2
speculates briefly on the second term) with comparisons to his two immediate predecessors, especially Bush. (A few post-December 12 cofirmations are possible, which would alter the rates somewhat but not the temporal data.) It examines nominations for the 673 life-tenured district judgeships and 179 court of appeals (“circuit”) judgeships. 1 It counts an individual renominated after the Senate failed to act on the initial nomination as a single nominee. The averages and percentages are suggestive but not dispositive.
To Summarize
• Clinton and Bush saw decreases in district vacancies of ten percent and 57 percent respectively, while district vacancies under Obama have increased by 40 percent, even though he had about the same number of district vacancies to fill in his first term as did Bush, and fewer than did Clinton.
• Obama submitted fewer district nominees and took longer to submit them, especially for vacancies in states with two Republican senators.
• For circuit nominees, the vacancy-to-nomination data are more jumbled.
• Obama’s district nominees saw longer nomination-to-confirmation times and lower confirmation rates. Even with confirmation rates similar to Clinton or Bush, Obama would not have had as many appointees as they did, because of fewer nominees.
• Obama’s circuit confirmation rates were within the range of his immediate predecessors, and the confirmations came sooner than did Bush’s.
• Obama appointees got Judiciary Committee hearings sooner than did Bush’s but waited much longer for floor action.
• Confirmations by voice vote or unanimous consent have declined, and roll call votes with negative votes have increased.
• There appears to be a relationship, albeit a weak one, between longer hearing-to-confirmation times for Obama district judges and increased negative votes.
1 The data analyzed here come principally from information I have collected and from the Federal Judicial Center’s Biographical Directory of Federal Judges, THOMAS’s Search Presidential Nominations page, the Administrative Office of the U.S. Courts’ JudicialVacancies page, the Senate Judiciary Committee’s Judicial Nominations page, Web searches for some biographical data, and sources cited. I welcome corrections to the figures in this paper.

Judicial Nominations and Confirmations in Obama’s First Term
3
• ABA ratings appear to have a relationship, albeit tenuous, to confirmations.
• The Obama administration and the Senate have continued the demographic and vocational background diversification of the federal district and appellate courts.
• Obama’s circuit nominees are on average older than those of his two predecessors.
• Senators’ use of vetting committees had little apparent impact on district court nominations, appointments, or key demographic or vocational backgrounds.
• Obama has reshaped the courts of appeals as to the proportion of judges appointed by Democratic and Republican presidents and may reshape them significantly in his second term.
Clinton and Bush saw decreases in district vacancies of ten percent and 57 percent respectively, while district vacancies under Obama have increased by 40 percent, even though he had about the same number of district vacancies to fill in his first term as did Bush, and fewer than did Clinton.
By contrast, the circuit vacancy level under Obama has changed little; it increased in Clinton’s first term and decreased by about the same proportion in Bush’s first term.
VACANCIES AT START AND END OF FIRST TERMS
District Courts Courts of Appeals Vacancies on
first Inaug day Vacancies on second Inaug
day
Vacancies on first Inaug
day
Vacancies on second Inaug
day Clinton 90 81 -10% 17 22 +29%
Bush 54 23 -57% 27 18 -33% Obama 43 60 +40% 14 15 +7%
Note: “ “Vacancies on first Inaug[uration] day” is based on the “Judicial Vacancies” page of uscourts.gov, which rarely reports vacancies as of Inauguration day, thus requiring tracing vacancies through previous and subsequent lists and use of the Federal Judicial Center judicial history data base. “Vacancies on second Inaug[uration] day”(or 12/12/12 for Obama) adds to the first number the vacancies that occurred between those two points (based on FJC data) and then subtracts the number of confirmations in the same period. Slight discrepancies between “Vacancies on second Inaug day” as I calculate them and the “Current Vacancies” for Inauguration day as deduced from uscourts.gov may be due to calculation error, but I believe more likely reflect inaccuracies in the early, archived uscourts.gov data, which have other errors (for example, identifying some senior circuit judges as senior district judges).
[T]he circuit vacancy level under Obama has changed little; it increased in Clinton’s first term and decreased by about the same proportion in Bush’s first term.
Judicial Nominations and Confirmations in Obama’s First Term
4
Although district vacancies grew under Obama, over the first term he
confronted about the same number of vacancies (195) as did Bush (192) and fewer than did Clinton (251). Obama inherited fewer district vacancies, and Congress created no new judgeships to fill, unlike during the Clinton and Bush first terms. Obama submitted fewer district nominees and took longer to submit them, especially for vacancies in states with two Republican senators.
As of early December, Obama had submitted 171 district nominees, compared to 177 in Bush’s first term and 196 in Clinton’s. Moreover, Obama submitted 15 of the nominations after the convention recess, with no chance of confirmation in the first term; Clinton and Bush submitted one and three post-recess nominations.
And Obama was slower to submit them as measured by average days to the nomination from the vacancy date (i.e., the date the incumbent publicly announced the future date on which s/he would leave active service; the date s/he left active service if no such announcement; or Inauguration day for vacancies inherited from previous administrations). Obama submitted district nominees, on average, 406 days after the date of the vacancy, versus 276 days for Bush and 370 for Clinton. (The times are slightly lower for nominees whom the Senate confirmed.)
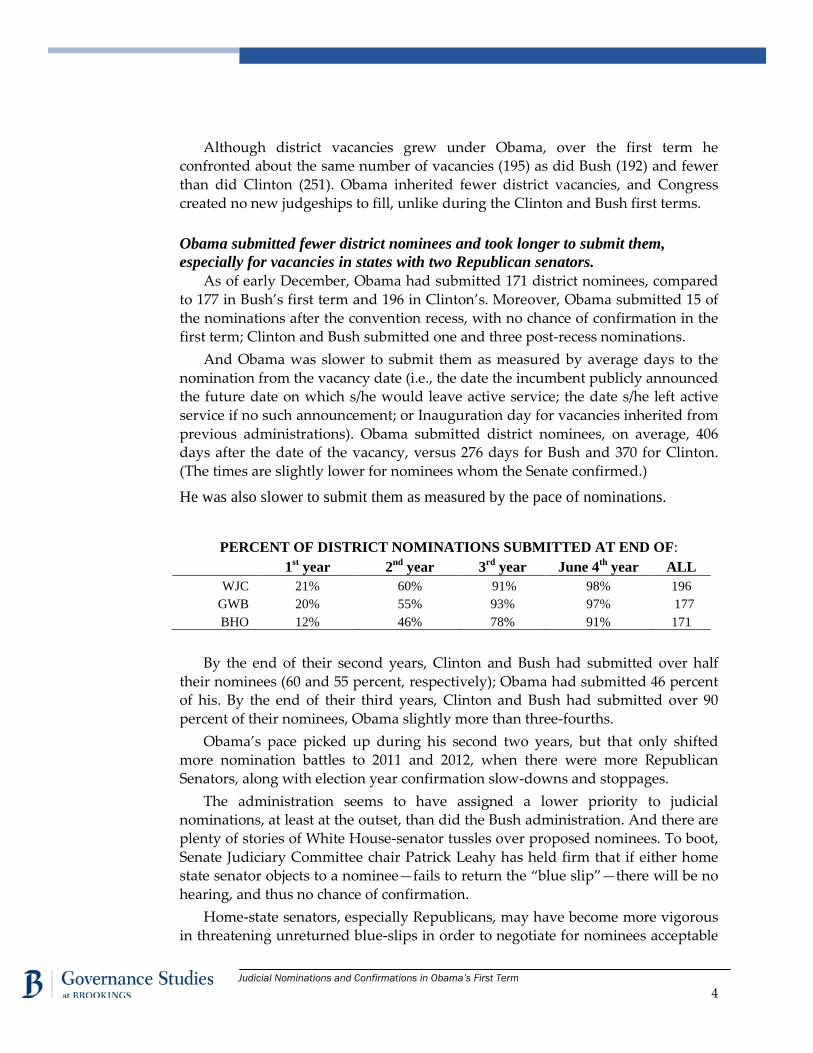
He was also slower to submit them as measured by the pace of nominations.
PERCENT OF DISTRICT NOMINATIONS SUBMITTED AT END OF: 1st year 2nd year 3rd year June 4th year ALL
WJC 21% 60% 91% 98% 196 GWB 20% 55% 93% 97% 177 BHO 12% 46% 78% 91% 171
By the end of their second years, Clinton and Bush had submitted over half
their nominees (60 and 55 percent, respectively); Obama had submitted 46 percent of his. By the end of their third years, Clinton and Bush had submitted over 90 percent of their nominees, Obama slightly more than three-fourths.
Obama’s pace picked up during his second two years, but that only shifted more nomination battles to 2011 and 2012, when there were more Republican Senators, along with election year confirmation slow-downs and stoppages.
The administration seems to have assigned a lower priority to judicial nominations, at least at the outset, than did the Bush administration. And there are plenty of stories of White House-senator tussles over proposed nominees. To boot, Senate Judiciary Committee chair Patrick Leahy has held firm that if either home state senator objects to a nominee—fails to return the “blue slip”—there will be no hearing, and thus no chance of confirmation.
Home-state senators, especially Republicans, may have become more vigorous in threatening unreturned blue-slips in order to negotiate for nominees acceptable

Judicial Nominations and Confirmations in Obama’s First Term
5
to them. That could explain the differences in the table below. Nationally, the 171 district nominees represented 86 percent of the vacancies. States with two Republican senators got nominees for 76 percent of their vacancies, less than those in states with two Democratic senators (89 percent) or split delegations (86 percent). Nominations also took longer in states with two Republican senators: 458 days on average versus 365 days for two-Democratic-senator states and 443 for split-delegation states. The two-Republican-senator states, however, accounted for only 37 of the vacancies, making it difficult to say that they were the main cause of the administration’s slower pace overall in submitting nominees.
OBAMA DISTRICT NOMINEES—FROM VACANCY TO NOMINATION States with* Vacancies** Nominations Elapsed days 2 Dem. Sens (23) 100 89 89% 365 2 Rep. Sens (12) 37 28 76% 458
Split Deleg’ns (16) 56 48 86% 443 Dist. of Col./P.Rico 7 6 84% 395
NAT. TOTALS 200 171 86% 406
*--Number of states does not total 50 because some states saw no district vacancies, and some states are in more than one category as a result of changes in Senate delegations after the 2010 elections.
**--Obama confronted 195 district vacancies, but five nominees withdrew or were not renominated, thus creating five additional nomination opportunities.
For circuit judges, the comparative waiting times were more cluttered.
Bush’s circuit nominees waited longer for nominations than did Obama’s. The 277 average days for Obama to get nominations to the Senate was less than Clinton’s 372 days and Bush’s average days of 300. (Again, the time was slightly lower for confirmed nominees.)
But, again, the pace of nominations was slower under Obama.
PERCENT OF ALL CIRCUIT NOMINATIONS SUBMITTED AT END OF: 1st year 2nd year 3rd year June, 4th year ALL
WJC 13% 56% 90% 100% 39 GWB 55% 61% 96% 100% 51 BHO 29% 60% 90% 100% 42
Bush submitted 55 percent of his circuit nominees in his first year, Obama only
29 percent. By strong but not ironclad tradition, senators regard court of appeals
judgeships as belonging to particular states, even though federal law requires only that every state in each regional circuit have at least one active member on the
Judicial Nominations and Confirmations in Obama’s First Term
6
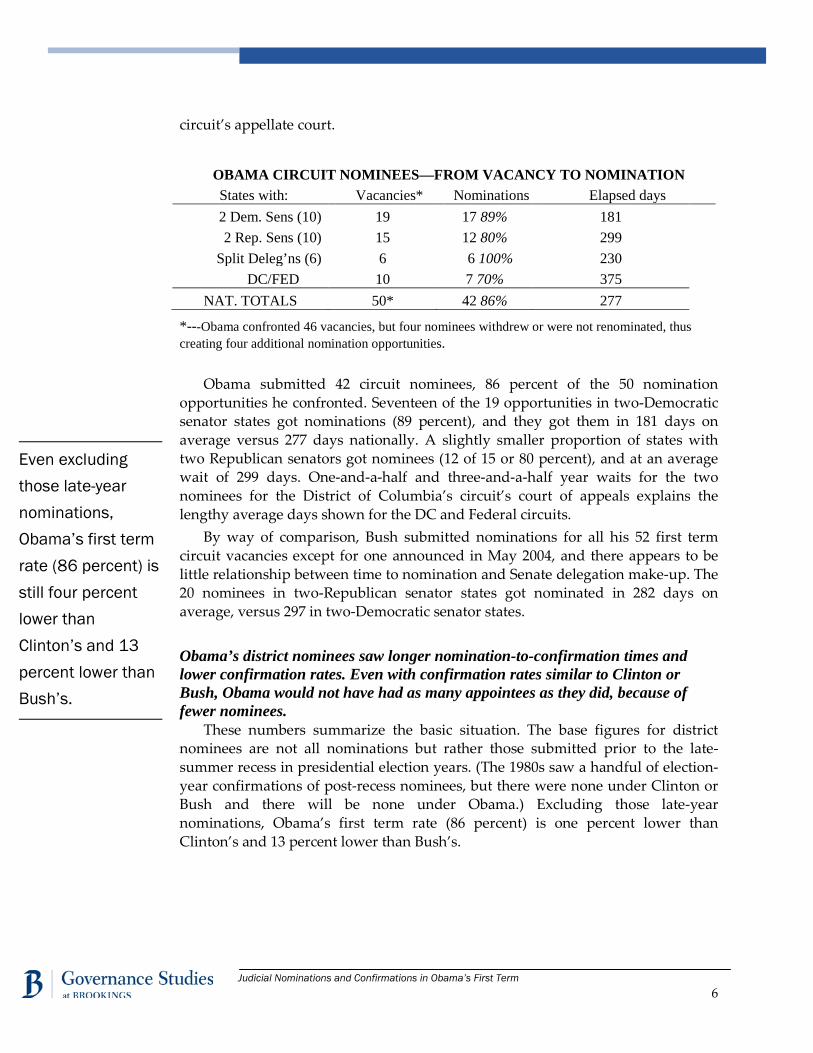
circuit’s appellate court.
OBAMA CIRCUIT NOMINEES—FROM VACANCY TO NOMINATION States with: Vacancies* Nominations Elapsed days 2 Dem. Sens (10) 19 17 89% 181 2 Rep. Sens (10) 15 12 80% 299
Split Deleg’ns (6) 6 6 100% 230 DC/FED 10 7 70% 375
NAT. TOTALS 50* 42 86% 277
*---Obama confronted 46 vacancies, but four nominees withdrew or were not renominated, thus creating four additional nomination opportunities.
Obama submitted 42 circuit nominees, 86 percent of the 50 nomination
opportunities he confronted. Seventeen of the 19 opportunities in two-Democratic senator states got nominations (89 percent), and they got them in 181 days on average versus 277 days nationally. A slightly smaller proportion of states with two Republican senators got nominees (12 of 15 or 80 percent), and at an average wait of 299 days. One-and-a-half and three-and-a-half year waits for the two nominees for the District of Columbia’s circuit’s court of appeals explains the lengthy average days shown for the DC and Federal circuits.
By way of comparison, Bush submitted nominations for all his 52 first term circuit vacancies except for one announced in May 2004, and there appears to be little relationship between time to nomination and Senate delegation make-up. The 20 nominees in two-Republican senator states got nominated in 282 days on average, versus 297 in two-Democratic senator states.
Obama’s district nominees saw longer nomination-to-confirmation times and lower confirmation rates. Even with confirmation rates similar to Clinton or Bush, Obama would not have had as many appointees as they did, because of fewer nominees.
These numbers summarize the basic situation. The base figures for district nominees are not all nominations but rather those submitted prior to the late-summer recess in presidential election years. (The 1980s saw a handful of election-year confirmations of post-recess nominees, but there were none under Clinton or Bush and there will be none under Obama.) Excluding those late-year nominations, Obama’s first term rate (86 percent) is one percent lower than Clinton’s and 13 percent lower than Bush’s.
Even excluding those late-year nominations, Obama’s first term rate (86 percent) is still four percent lower than Clinton’s and 13 percent lower than Bush’s.
Judicial Nominations and Confirmations in Obama’s First Term
7
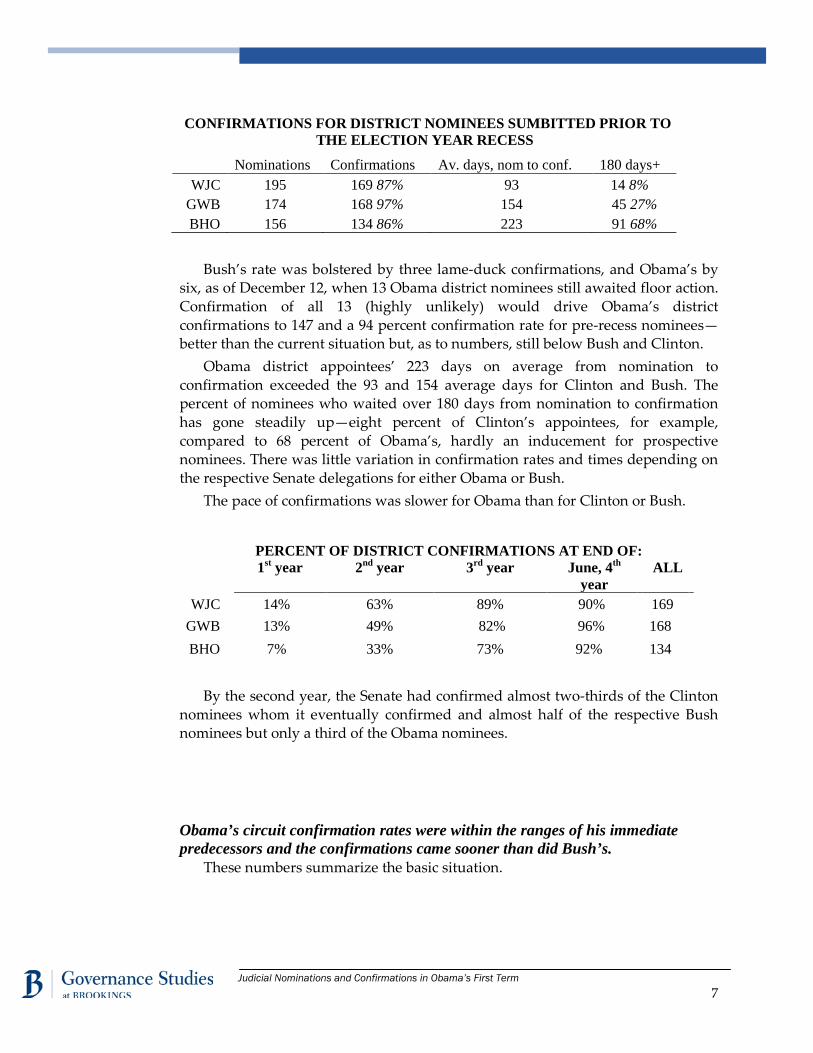
CONFIRMATIONS FOR DISTRICT NOMINEES SUMBITTED PRIOR TO THE ELECTION YEAR RECESS
Nominations Confirmations Av. days, nom to conf. 180 days+ WJC 195 169 87% 93 14 8%
GWB 174 168 97% 154 45 27% BHO 156 134 86% 223 91 68%
Bush’s rate was bolstered by three lame-duck confirmations, and Obama’s by
six, as of December 12, when 13 Obama district nominees still awaited floor action. Confirmation of all 13 (highly unlikely) would drive Obama’s district confirmations to 147 and a 94 percent confirmation rate for pre-recess nominees—better than the current situation but, as to numbers, still below Bush and Clinton.
Obama district appointees’ 223 days on average from nomination to confirmation exceeded the 93 and 154 average days for Clinton and Bush. The percent of nominees who waited over 180 days from nomination to confirmation has gone steadily up—eight percent of Clinton’s appointees, for example, compared to 68 percent of Obama’s, hardly an inducement for prospective nominees. There was little variation in confirmation rates and times depending on the respective Senate delegations for either Obama or Bush.
The pace of confirmations was slower for Obama than for Clinton or Bush.
PERCENT OF DISTRICT CONFIRMATIONS AT END OF: 1st year 2nd year 3rd year June, 4th
year ALL
WJC 14% 63% 89% 90% 169 GWB 13% 49% 82% 96% 168 BHO 7% 33% 73% 92% 134
By the second year, the Senate had confirmed almost two-thirds of the Clinton
nominees whom it eventually confirmed and almost half of the respective Bush nominees but only a third of the Obama nominees.
Obama’s circuit confirmation rates were within the ranges of his immediate predecessors and the confirmations came sooner than did Bush’s.
These numbers summarize the basic situation.

Judicial Nominations and Confirmations in Obama’s First Term
8
CIRCUIT CONFIRMATIONS
Nominations Confirmations Av. days, nom to conf. 180 days+ Clinton 39 30* 77% 127 4 13%
Bush 56 34 67% 283 22 65% Obama 42 30 71% 240 24 80%
*--Includes Roger Gregory, whom Clinton recess-appointed to the Fourth Circuit’s court of appeals, and whom Bush then renominated.
Obama’s first-term confirmation rate of 71 percent is between Clinton’s 77
percent and Bush’s 67 percent. That the Senate has since 1993 denied confirmation to three of every ten circuit nominees reflects a new (and unfortunate) normal, but at least so far it has not worsened under Obama.
Four of every five Obama circuit appointees waited over 180 days for confirmation after nomination. For both Bush and Obama, there were slight differences in rates and time to confirmation depending on the Senate delegation. About three-fourths of Obama nominees to seats in states with two Democratic senators got confirmed—versus two thirds of those in states with two Republican senators—and got confirmed more quickly: 227 days on average for Obama nominees versus 273 for Bush. In Bush’s first term, 15 of 20 nominees in states with two Republican senators got confirmed, versus nine of 16 in two-Democratic senator states, but those nine moved to confirmation in only 185 days, compared to 339 for the 15 two-Republican-senator states.
The early pace of confirmations for Obama’s circuit nominees was more robust than the early pace of his district confirmation. At the end of two years, the Senate had confirmed slightly over half (53 percent) of the Obama nominees it would confirm and slightly under half of Bush’s, but confirmations picked up for Bush in January 2003, when Republicans took back control of the Senate.
PERCENT OF COURT OF APPEALS NOMINEES CONFIRMED BY END OF: 1st year 2nd year 3rd year June, 4th year ALL
WJC 3 10% 8 63% 4 93% 2 100% 30 GWB 5 15% 8 47% 4 85% 5 100% 34 BHO 3 10% 7 53% 6 83% 5 100% 30
Late-term nominees have often been renominated and confirmed in the
subsequent or later Senate sessions. (Seven of Bush’s nine unsuccessful first term district nominees, for example, were eventually confirmed as were eight of his 17 unsuccessful first term circuit nominees.)
Obama appointees got Judiciary Committee hearings sooner than did Bush appointees but waited much longer for floor action.
Overall times from nomination to confirmation—and for its two components,
The much longer time that Obama district and circuit nominees waited, post-hearing, for floor votes reflects the increased difficulty in securing unanimous consent agreements, mainly from the opposition senators, to allow the Senate to vote on nominees.
Judicial Nominations and Confirmations in Obama’s First Term
9
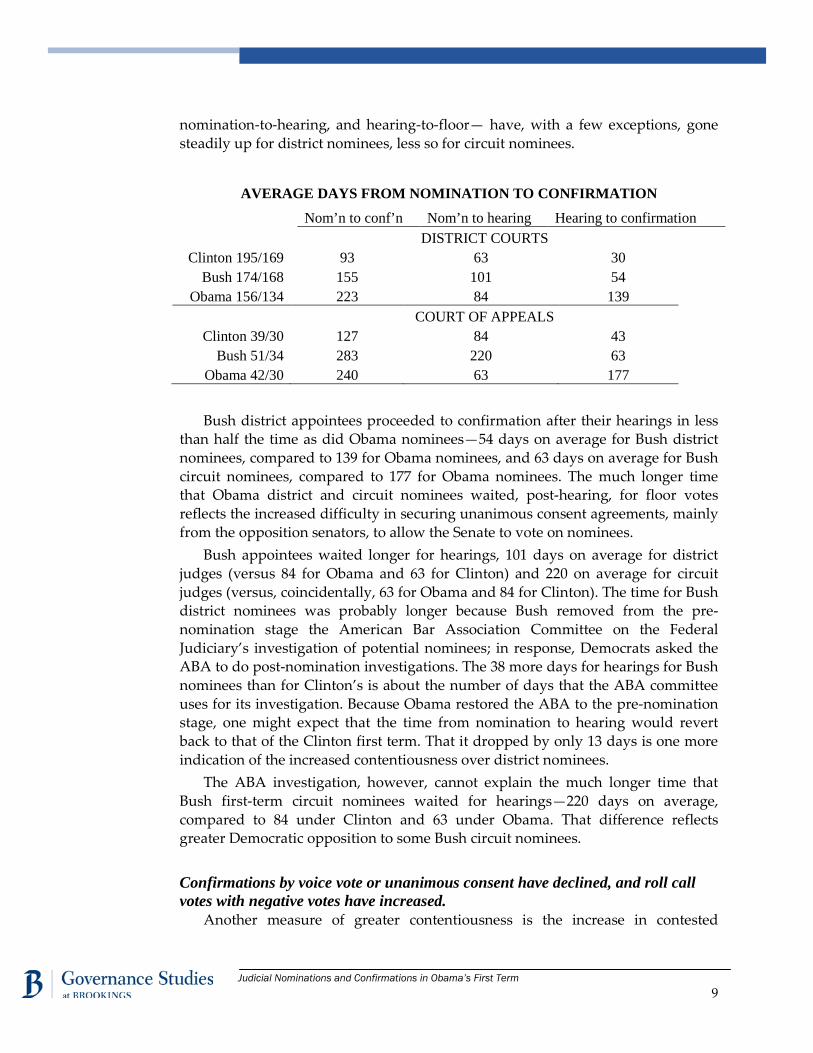
nomination-to-hearing, and hearing-to-floor— have, with a few exceptions, gone steadily up for district nominees, less so for circuit nominees.
AVERAGE DAYS FROM NOMINATION TO CONFIRMATION
Nom’n to conf’n Nom’n to hearing Hearing to confirmation DISTRICT COURTS
Clinton 195/169 93 63 30 Bush 174/168 155 101 54
Obama 156/134 223 84 139 COURT OF APPEALS
Clinton 39/30 127 84 43 Bush 51/34 283 220 63
Obama 42/30 240 63 177
Bush district appointees proceeded to confirmation after their hearings in less
than half the time as did Obama nominees—54 days on average for Bush district nominees, compared to 139 for Obama nominees, and 63 days on average for Bush circuit nominees, compared to 177 for Obama nominees. The much longer time that Obama district and circuit nominees waited, post-hearing, for floor votes reflects the increased difficulty in securing unanimous consent agreements, mainly from the opposition senators, to allow the Senate to vote on nominees.
Bush appointees waited longer for hearings, 101 days on average for district judges (versus 84 for Obama and 63 for Clinton) and 220 on average for circuit judges (versus, coincidentally, 63 for Obama and 84 for Clinton). The time for Bush district nominees was probably longer because Bush removed from the pre-nomination stage the American Bar Association Committee on the Federal Judiciary’s investigation of potential nominees; in response, Democrats asked the ABA to do post-nomination investigations. The 38 more days for hearings for Bush nominees than for Clinton’s is about the number of days that the ABA committee uses for its investigation. Because Obama restored the ABA to the pre-nomination stage, one might expect that the time from nomination to hearing would revert back to that of the Clinton first term. That it dropped by only 13 days is one more indication of the increased contentiousness over district nominees.
The ABA investigation, however, cannot explain the much longer time that Bush first-term circuit nominees waited for hearings—220 days on average, compared to 84 under Clinton and 63 under Obama. That difference reflects greater Democratic opposition to some Bush circuit nominees.
Confirmations by voice vote or unanimous consent have declined, and roll call votes with negative votes have increased.
Another measure of greater contentiousness is the increase in contested
Judicial Nominations and Confirmations in Obama’s First Term
10
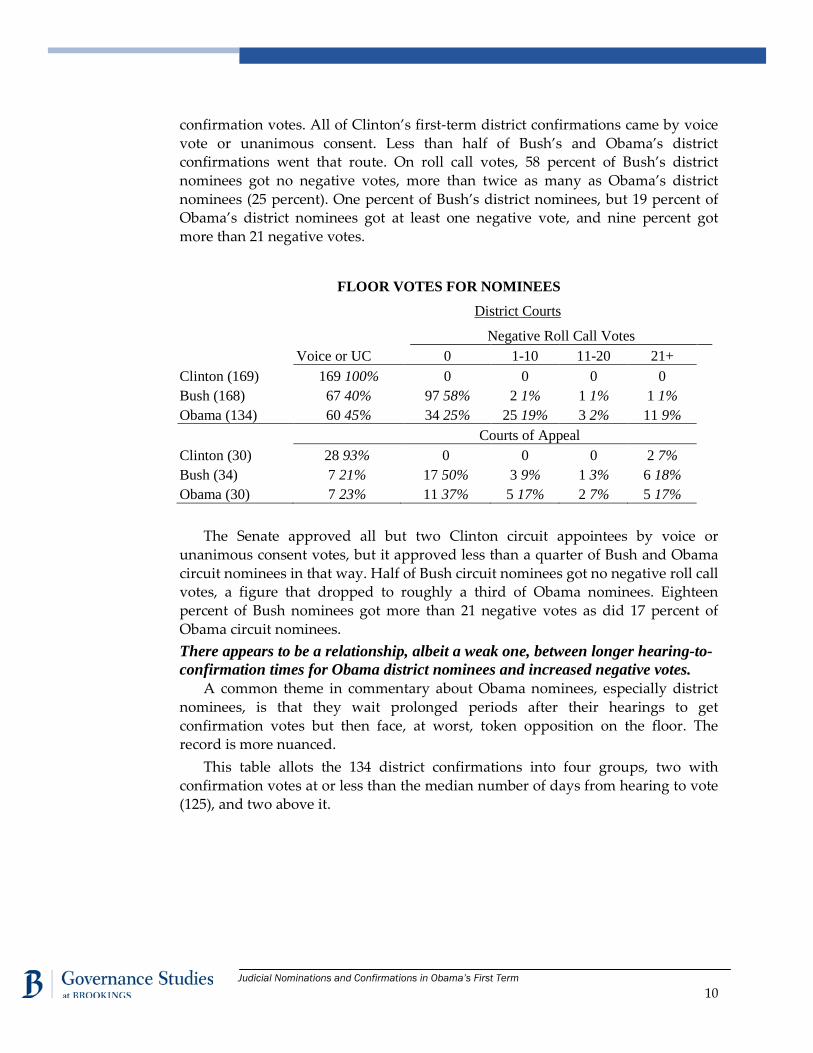
confirmation votes. All of Clinton’s first-term district confirmations came by voice vote or unanimous consent. Less than half of Bush’s and Obama’s district confirmations went that route. On roll call votes, 58 percent of Bush’s district nominees got no negative votes, more than twice as many as Obama’s district nominees (25 percent). One percent of Bush’s district nominees, but 19 percent of Obama’s district nominees got at least one negative vote, and nine percent got more than 21 negative votes.
FLOOR VOTES FOR NOMINEES
District Courts
Negative Roll Call Votes Voice or UC 0 1-10 11-20 21+ Clinton (169) 169 100% 0 0 0 0 Bush (168) 67 40% 97 58% 2 1% 1 1% 1 1% Obama (134) 60 45% 34 25% 25 19% 3 2% 11 9% Courts of Appeal Clinton (30) 28 93% 0 0 0 2 7% Bush (34) 7 21% 17 50% 3 9% 1 3% 6 18% Obama (30) 7 23% 11 37% 5 17% 2 7% 5 17%
The Senate approved all but two Clinton circuit appointees by voice or
unanimous consent votes, but it approved less than a quarter of Bush and Obama circuit nominees in that way. Half of Bush circuit nominees got no negative roll call votes, a figure that dropped to roughly a third of Obama nominees. Eighteen percent of Bush nominees got more than 21 negative votes as did 17 percent of Obama circuit nominees. There appears to be a relationship, albeit a weak one, between longer hearing-to-confirmation times for Obama district nominees and increased negative votes.
A common theme in commentary about Obama nominees, especially district nominees, is that they wait prolonged periods after their hearings to get confirmation votes but then face, at worst, token opposition on the floor. The record is more nuanced.
This table allots the 134 district confirmations into four groups, two with confirmation votes at or less than the median number of days from hearing to vote (125), and two above it.

Judicial Nominations and Confirmations in Obama’s First Term
11
DISTRICT NOMINEES: HEARINGS TO CONFIRMATION TIMES, AND NEGATIVE VOTES
Negative Roll Call Votes Number Days to conf. Voice or UnCon All 1-10 11-20 21-30 Over 30 33 17-109 16 3 3 35 110-125 13 12 7 3 1 1 31 127-166 17 9 7 2 35 168-594 13 16 8 1 7
Proportionately more of the 35 judges who waited the longest for confirmation faced more than token opposition than did the other 99 appointees. Eight from the longest-waiting group got 21 or more negative votes, while seven of the 99 more speedily confirmed nominees had more than eleven negative votes.
ABA ratings appear to have a relationship, albeit tenuous, to confirmations.
The ABA’s Standing Committee on the Federal Judiciary evaluates prospective federal judicial nominees, “strictly,” it claims, “on professional qualifications: integrity, professional competence and judicial temperament.” As noted earlier, the Bush administration removed the committee from the pre-nomination process, but the Obama administration restored it. The committee rates nominees as Well-Qualified or Qualified, either unanimously in either category or with a mix of the two rates. A few nominees received some votes of “Not Qualified.”
I aggregated the votes of Obama district nominees into three groups, assigning a score of three to nominees whom the ABA committee rated “Unanimously Well-Qualified,” two for a mixed vote, and one for those it rated “Unanimously Qualified,” including in that group the 14 nominees who received some Not Qualified votes. Some results:
• The aggregate score for all 171 nominees was 2.14 and 2.21 for the 134 who were confirmed. Those who were confirmed in 125 days or less from hearing to floor vote had an aggregate score of 2.29, while those above the 125 median had an aggregate score of 2.09. Appointees who faced more than token opposition (11 or more negative votes) had an aggregate ABA ranking of 1.92.
• Of the 14 nominees with some “Not Qualified” votes, nine have been confirmed. Four of the five who have not been confirmed were nominated in 2012, which helps explain their unconfirmed status. For the eight appointees with some “Not Qualified” votes, the average from hearing to floor vote was 164 days, more than the 139 for all appointees.
Judicial Nominations and Confirmations in Obama’s First Term
12
These data are suggestive, but they may be hiding other factors and are no basis for assuming ABA ratings are a determining factor in the nomination-confirmation process.
The Obama administration and the Senate have continued the demographic and vocational background diversification of the federal district and appellate courts.
Of Obama’s 134 first-term district appointees, 41 percent are white males, down from 49 percent of Clinton and 68 percent of Bush first term district judges. Thirty-six percent of the 30 Obama circuit judges were white males, compared to half of Clinton’s first term circuit judges and a slightly higher proportion of Bush’s first term circuit judges.
Obama has nominated and gotten confirmed more Asian Americans, by number and by the proportion of all nominees and appointees, than his immediate predecessors combined in their first terms. Clinton nominated four Asian Americans and saw three confirmed; Bush nominated one, who was confirmed. Obama has nominated 14 Asian Americans, ten of whom have been confirmed so far.
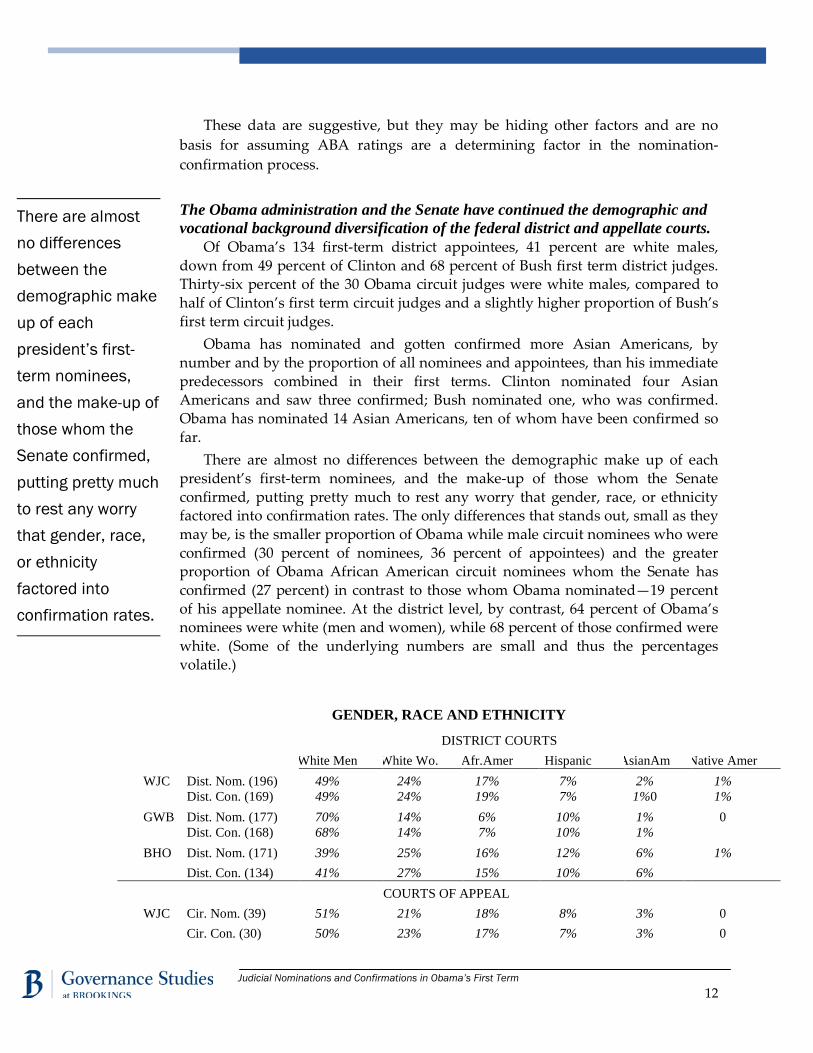
There are almost no differences between the demographic make up of each president’s first-term nominees, and the make-up of those whom the Senate confirmed, putting pretty much to rest any worry that gender, race, or ethnicity factored into confirmation rates. The only differences that stands out, small as they may be, is the smaller proportion of Obama while male circuit nominees who were confirmed (30 percent of nominees, 36 percent of appointees) and the greater proportion of Obama African American circuit nominees whom the Senate has confirmed (27 percent) in contrast to those whom Obama nominated—19 percent of his appellate nominee. At the district level, by contrast, 64 percent of Obama’s nominees were white (men and women), while 68 percent of those confirmed were white. (Some of the underlying numbers are small and thus the percentages volatile.)
GENDER, RACE AND ETHNICITY
DISTRICT COURTS
White Men White Wo. Afr.Amer Hispanic AsianAm Native Amer
WJC Dist. Nom. (196) 49% 24% 17% 7% 2% 1% Dist. Con. (169) 49% 24% 19% 7% 1%0 1% GWB Dist. Nom. (177) 70% 14% 6% 10% 1% 0 Dist. Con. (168) 68% 14% 7% 10% 1%
BHO Dist. Nom. (171) 39% 25% 16% 12% 6% 1% Dist. Con. (134) 41% 27% 15% 10% 6%
COURTS OF APPEAL WJC Cir. Nom. (39) 51% 21% 18% 8% 3% 0 Cir. Con. (30) 50% 23% 17% 7% 3% 0
There are almost no differences between the demographic make up of each president’s first-term nominees, and the make-up of those whom the Senate confirmed, putting pretty much to rest any worry that gender, race, or ethnicity factored into confirmation rates.

Judicial Nominations and Confirmations in Obama’s First Term
13
Immediate Prior Position
The composition of the federal judiciary as to race and gender has been changing since the Carter administration. Changes in the positions that judges held immediately prior to their nomination and appointment have been occurring since the Eisenhower administration, when two-thirds of appointees to the district courts came from private practice of law. That percentage has been coming steadily down. Less than half of Clinton’s district appointees came from private practice, as did about a third of Obama’s district nominees and appointees. Elsewhere I have chronicled the phenomenon, reviewed the asserted pros and cons, and assessed possible reasons for this steady change in the federal judiciary.
Just as few differences appeared between the demographic make-up of first term nominees, and the proportional make-up of those confirmed, neither do the data suggest that Senates have applied different criteria on vocational backgrounds than did the presidents. What differences appear involve the courts of appeals—under Obama, 53 percent of the 30 appellate nominees whom the Senate confirmed were state judges, but they made up only 40 percent of all of Obama’s 42 nominees. It may be tempting to say the Senate is now more inclined to put state judges on the courts of appeal and less likely to approve government or private practice lawyers but, again, the numbers are small and the percentages thus volatile.
DISTRICT COURTS
State Judge
Fed. Judge
Pub. Atty* Priv. Prac Other**
WJC Dist. Nom. (196) 32% 12% 9% 45% 2% Dist. Con. (169) 31% 13% 9% 46% 3%
GWB Dist. Nom. (177) 33% 16% 10% 40% 1% Dist. Con. (168) 34% 17% 9% 39% 1%
BHO Dist. Nom. (171) 29% 19% 19% 32% 1% Dist. Con. (134) 27% 20% 16% 36% 1%
COURTS OF APPEAL
WJC Cir. Nom. (39) 26% 26% 10% 26% 13% Cir. Con. (30) 33% 30% 3% 20% 13%
GWB Cir. Nom. (51) 27% 24% 27% 16% 6% Cir. Con. (34) 24% 26% 24% 21% 6%
BHO Cir. Nom. (42) 40% 19% 10% 19% 12% Cir. Con. (30) 53% 20% 3% 13% 10%
GWB Cir. Nom. (51) 65% 18% 10% 8% 0 0 Cir. Con. (34) 65% 18% 9% 9% 0 0 BHO Cir. Nom. (42) 36% 26% 19% 10% 10% 0 Cir. Con. (30) 30% 23% 27% 13% 7% 0
Judicial Nominations and Confirmations in Obama’s First Term
14
*--Includes federal and state prosecutors, other attorneys holding positions in the government, as well as the handful of public defenders appointed to the federal bench. **--Mainly law professors.
Obama’s circuit nominees are on average older than those of his two predecessors.
Because circuit judges are seen, somewhat misleadingly, as policy makers, some advocate appointing them at younger ages, so that they will have longer tenure after the appointing presidents leave office. For what it’s worth, the average age of Obama’s first-term circuit nominees, at the time of nomination, was 53.2 years, up from Clinton’s 50.8 years and Bush’s 50.3 years.
Senators’ use of vetting committees had little apparent impact on district court nominations, appointments, or demographic or vocational backgrounds.
During the Obama administration, federal legislators (almost all senators) in 20 states and the District of Columbia used vetting committees to screen potential district judge nominees to recommend to White House. These 21 jurisdictions, up from seven during the Bush administration, accounted for 64 percent of Obama’s 171 nominees. A liberal lobbying group referred to their use in one state, for at least one nomination as “a model for senators across the country.” (The nominee is an African-American public defender with a unanimous “Well Qualified” ABA rating whose nomination came 287 days from the vacancy, versus the national average of 406.) Committee supporters, such as the American Bar Association, have argued that good-faith use of committees can help senators identify a greater diversity of candidates (in part because some potential candidates with little political clout, e.g., state judges, may be more willing to apply to a committee than approach the senators’ staffs). Moreover, supporters argue, a nominee with the seal of approval of a truly bi-partisan committee may proceed through the nomination and confirmation process with less resistance.
The record of Obama’s first term doesn’t necessarily bear out committee supporters’ hopes, based on a comparison of nominees and appointees from states where senators say they use vetting committees and those from other states. These comparisons merit some skepticism, because the committees vary in their apparent bi-partisanship and it’s often impossible to know if the names that a senator sends to the White House, or that the White House sends to the Senate, were among those recommended by the committee. Moreover, the committees operate within state nomination cultures and senatorial practices that probably exert more influence on the process than do the committees.
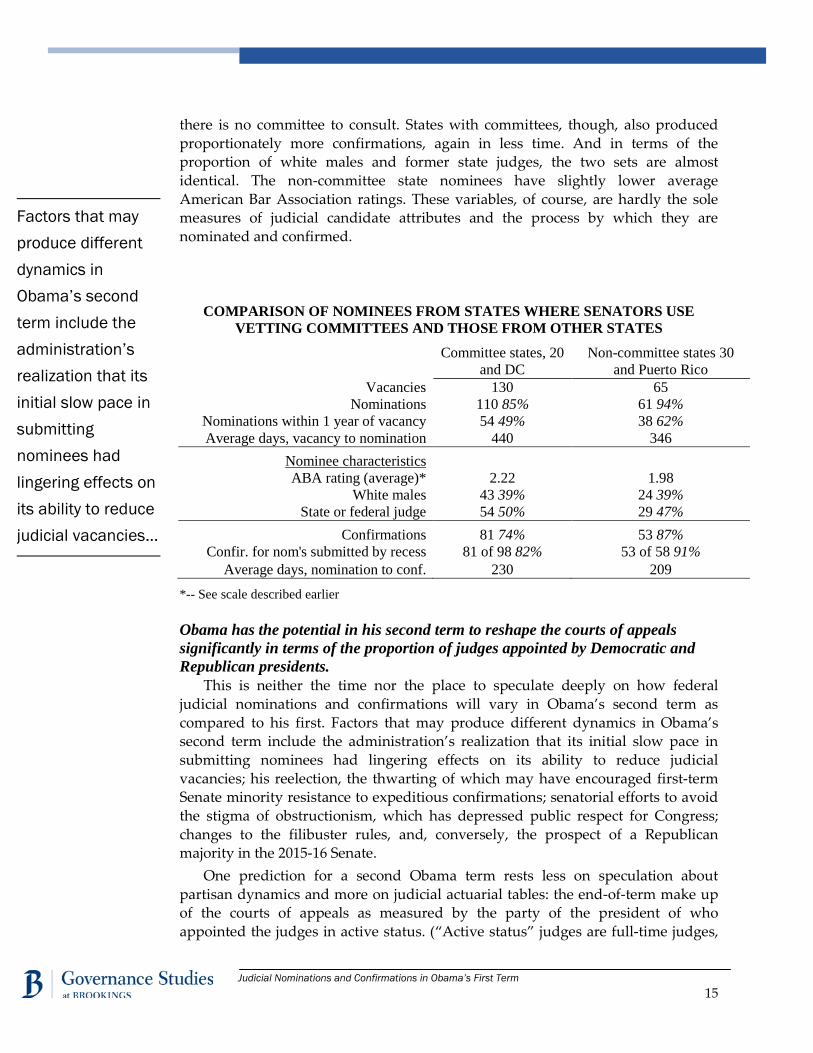
That said, the non-committee states have produced proportionately more nominations and in less time, than the committee states. That may reflect the additional time and effort for at least some committees to do their work, compared to the less formal vetting processes that senators and their staffs employ when
Judicial Nominations and Confirmations in Obama’s First Term
15
there is no committee to consult. States with committees, though, also produced proportionately more confirmations, again in less time. And in terms of the proportion of white males and former state judges, the two sets are almost identical. The non-committee state nominees have slightly lower average American Bar Association ratings. These variables, of course, are hardly the sole measures of judicial candidate attributes and the process by which they are nominated and confirmed.
COMPARISON OF NOMINEES FROM STATES WHERE SENATORS USE VETTING COMMITTEES AND THOSE FROM OTHER STATES
Committee states, 20 and DC
Non-committee states 30 and Puerto Rico
Vacancies 130 65 Nominations 110 85% 61 94%
Nominations within 1 year of vacancy 54 49% 38 62% Average days, vacancy to nomination 440 346
Nominee characteristics ABA rating (average)* 2.22 1.98
White males 43 39% 24 39% State or federal judge 54 50% 29 47%
Confirmations 81 74% 53 87% Confir. for nom's submitted by recess 81 of 98 82% 53 of 58 91%
Average days, nomination to conf. 230 209
*-- See scale described earlier Obama has the potential in his second term to reshape the courts of appeals significantly in terms of the proportion of judges appointed by Democratic and Republican presidents.
This is neither the time nor the place to speculate deeply on how federal judicial nominations and confirmations will vary in Obama’s second term as compared to his first. Factors that may produce different dynamics in Obama’s second term include the administration’s realization that its initial slow pace in submitting nominees had lingering effects on its ability to reduce judicial vacancies; his reelection, the thwarting of which may have encouraged first-term Senate minority resistance to expeditious confirmations; senatorial efforts to avoid the stigma of obstructionism, which has depressed public respect for Congress; changes to the filibuster rules, and, conversely, the prospect of a Republican majority in the 2015-16 Senate.
One prediction for a second Obama term rests less on speculation about partisan dynamics and more on judicial actuarial tables: the end-of-term make up of the courts of appeals as measured by the party of the president of who appointed the judges in active status. (“Active status” judges are full-time judges,
Factors that may produce different dynamics in Obama’s second term include the administration’s realization that its initial slow pace in submitting nominees had lingering effects on its ability to reduce judicial vacancies…

Judicial Nominations and Confirmations in Obama’s First Term
16
as opposed to judges on “senior status.” Federal judges whose years of service as district or circuit judges, plus their age, total 80, are eligible to take senior status. Most but not all senior status judges assume lighter workloads than their active counterparts.)
Party of the appointing president of circuit judges in active service is a crude predictor of appellate court decisions. Almost all decisions are made by three-judge panels, which may not reflect the composition of the entire court, or even comprise only active members of the court. Panels often include senior judges and visiting judges, including district judges. And, differences in decisional patterns between Republican and Democratic appointees, while visible in some areas, are often not large and in some cases are almost non-existent. Nevertheless, party of the appointing president, even as a crude predictor, can give some perspective to the courts’ work.
Obama’s 30 first term circuit appointees altered the balance on the courts in the aggregate and on several specific courts. When he took office, 99 Republican appointees filled 55 percent of the 179 judgeships and were 60 percent of active judges. Now, the breakdown is almost even—81 Republican appointees occupy 45 percent of all 179 judgeships as opposed to 44 percent held by Democratic appointees. Republican appointees are 51 percent of active circuit judges. And five courts of appeals on which Republican appointees had a majority or were split evenly with Democratic appointees in 2009 now have Democratic-appointee majorities—courts in the Second, Third, Fourth, Eleventh, and Federal circuits—although some margins are very thin.
Here is the breakdown of changes. Number of judgeships is in parentheses; R and D designate Republican and Democratic appointees; V designates vacancies in place or announced.
Courts with Republican-appointee majorities in 2009 and December 2012.
1st (6) Then 3R, 2D, 1V. Now, no change
5th (17) Then 12 R, 4D, 1V. Now, 10R, 5D, 2V
6th (16) Then 10 R, 5 D, 1 V. Now, 10 R, 6 D.
7th (11) Then 7 R, 3 D, 1 V. Now, no change
8th (11) Then 9 R, 2 D; Now, 8 R, 2 D, 1 V.
10th (12) Then 8 R, 4 D; Now, 5 R, 4 D, 3 V
DC (11) Then 6 R, 3 D, 2 V. Now, 4 R, 3 D, 4 V.
Courts with equal numbers in 2009, now with Democratic-appointee majorities.
2nd (13) Then 6 R, 6 D, 1 V. Now, 5 R, 8 D.
3rd (14) Then 6 R, 6 D, 2 V. Now, 6 R, 7 D, 1 V.
Judicial Nominations and Confirmations in Obama’s First Term
17
Courts with Republican-appointee majorities in 2009 and Democratic appointee majorities now.
4th (15) Then 6 R, 5 D, 4 V. Now, 5 R, 10 D.
11th (12) Then 7 R, 5 D. Now, 4 R, 6 D, 2 V.
FED (12) Then 8 R, 4 D. Now, 5 R, 4 D, 3 V.
Courts with Democratic-appointee majorities in 2009 and 2012
9th (29) Then 11 R, 16 D, 2 V. Now 9 R, 19 D 1 V. How might Obama be able to affect the composition of the courts in his second
term? That depends on how many vacancies open up, and who creates them (Republican or Democratic appointees), and Obama’s success in filling them. He may, though, be able to effect something of a mirror-image of the balance in the courts of appeals when he took office. Democratic appointees, who in 2009, constituted about a third of active circuit judges, might constitute about two thirds in 2017.
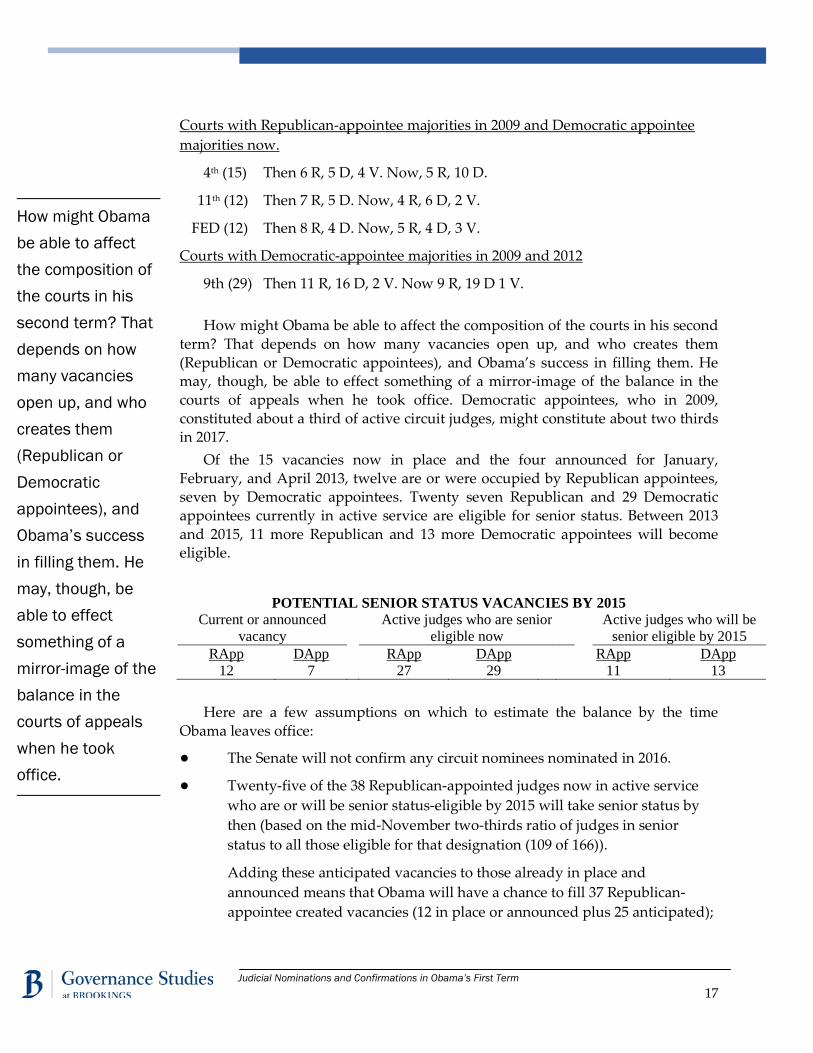
Of the 15 vacancies now in place and the four announced for January, February, and April 2013, twelve are or were occupied by Republican appointees, seven by Democratic appointees. Twenty seven Republican and 29 Democratic appointees currently in active service are eligible for senior status. Between 2013 and 2015, 11 more Republican and 13 more Democratic appointees will become eligible.
POTENTIAL SENIOR STATUS VACANCIES BY 2015 Current or announced
vacancy Active judges who are senior
eligible now Active judges who will be
senior eligible by 2015 RApp DApp RApp DApp RApp DApp
12 7 27 29 11 13 Here are a few assumptions on which to estimate the balance by the time
Obama leaves office:
● The Senate will not confirm any circuit nominees nominated in 2016.
● Twenty-five of the 38 Republican-appointed judges now in active service who are or will be senior status-eligible by 2015 will take senior status by then (based on the mid-November two-thirds ratio of judges in senior status to all those eligible for that designation (109 of 166)).
Adding these anticipated vacancies to those already in place and announced means that Obama will have a chance to fill 37 Republican-appointee created vacancies (12 in place or announced plus 25 anticipated);
How might Obama be able to affect the composition of the courts in his second term? That depends on how many vacancies open up, and who creates them (Republican or Democratic appointees), and Obama’s success in filling them. He may, though, be able to effect something of a mirror-image of the balance in the courts of appeals when he took office.

Judicial Nominations and Confirmations in Obama’s First Term
18
● Obama will nominate candidates for all pre-2016 vacancies (based on the likelihood that the White House will work hard to overcome its first term’s more lethargic nomination effort).
● The 71 percent circuit confirmation rate of the first term will decline to about 65 percent. (Clinton’s first-term rate of 71 percent fell to 63 percent in his second term. Bush’s declined from 67 percent to 60 percent.)
If those assumptions hold true, Obama could appoint judges to 24 of the circuit
judgeships vacated by or currently held by Republican appointees who are in senior status, or will become eligible for it. The balance on the court of appeals in 2016 could be 57 Republican appointees (36 percent of 160 active judges) and 103 Democratic appointees (64 percent of active judges), a rough mirror image of the 99-65 Republican appointee advantage that Obama inherited.
These assumptions are reasonable, based on informed speculation, but they are but hardly rock-solid (and they don’t account for deaths, or Supreme Court elevations, of any active-status circuit judges).
ESTIMATE OF ACTIVE STATUS CIRCUIT JUDGES IN 2016
Total J’Ships Rep. App’tees Dem. App’tees Vacancies Jan. 2009 179 99 65 15
Dec. 2012 179 81 79 19 -24 +24
Dec. 2016 179 57 103 19 % of Active Judges 36% 64%
% of Judgeships 32% 57% 11%
Email your comments to [email protected]
This paper is distributed in the expectation that it may elicit useful
comments and is subject to subsequent revision. The views expressed in
this piece are those of the authors and should not be attributed to the
staff, officers or trustees of the Brookings Institution.
Governance Studies The Brookings Institution 1775 Massachusetts Ave., NW Washington, DC 20036 Tel: 202.797.6090 Fax: 202.797.6144 www.brookings.edu/governance.aspx Editors Christine Jacobs Stephanie Dahle Production & Layout Mitchell Dowd


![Obama’s Monument Proclamations [Full Transcripts]](https://static.fdocuments.net/doc/165x107/55cf9373550346f57b9d8c05/obamas-monument-proclamations-full-transcripts.jpg)