JTEKT CSR Report Environmental Data by Operations Base
13
This page includes the environmental data for the Kokubu Plant and Kariya Plant, out of our 13 locations,including 12 domestic plants and 1 operations center. Environmental Data by Operations Base ① JTEKT CSR Report 2013 [Chemicals] Substances subject to PRTR [Atmosphere] Measured values are the maximum values [Water quality] pH: Hydrogen-ion concentration/ COD:Chemical oxygen demand/ BOD: Biochemical oxygen demand/ SS: Suspended solids in water/ Oil content: N-hexane extract content/ ND: Lower than determination limit/ Values in parenthesis show the daily average values [Regulated value] JTEKT internal standards (some more stricter than regulatory amounts) [Substances subject to PRTR] Shows substances which are handled in amounts of 1,000 kg/year or more. Substance number shows the legislative number for each of the No. 1 type chemical substances of the PRTR regulations. Removal processing amount is the amount of substances subject to PRTR which are incinerated, neutralized, broken down, put through reaction treatment, etc. within JTEKT premises. Consumed amount is the amount of substances subject to PRTR which are changed to another substance through reaction treatment, or removed from JTEKT premises in, or attached to, products. [Target period] April 2012 to March 2013 Kokubu Plant No. of Employees 2,150 Production items ● All types of ball bearings ● Roller bearings ● Ultra-large bearings ● Hub units ● High-accuracy bearings Kariya Plant No. of Employees 1,192 Production items ● Machine tools ● Mechatronics products Water quality measurement data Substances subject to PRTR Unit : kg/year Unit : Dust= g/Nm 3 NOx = ppm SOx = Value K Atmosphere measurement data pH BOD SS Oil content Index Regulation value Results Maximum Average Atmosphere Waterways Soil Sewage Waste Amount released Amount consumed Amount recycled Amount Removed and treated Amount transferred 1 80 412 Water-soluble zinc compounds Xylene Manganese and its compounds 1,676 3,202 1,133 Substance number Chemical name Amount handled Noise / Vibration data Unit : dB Index Morning Afternoon Evening Night Daytime Nighttime Regulation value Maximum Average Noise Vibration 59 64 59 54 68 63 56 62 56 53 44 40 49 56 51 48 34 27 Regulation value Maximum value Facility Index Dust NOx SOx Dust NOx SOx Boiler (Annealing furnace) 0.08 144 - 0.08 120 - 0.003 29 - 0.003 39 - Unit : mg/ ℓ(Excluding Ph) 5.4~8.6 480 480 4 7.4 50 13 3.6 7.0 21 4.8 2.0 - 3,202 - - - - - - - - 23 168 - 408 - - - - - - 1,508 - 702 Foul odor Unit : ppm Measurement item Ammonia Regulation value Measurement 0.8 0.27 * Malodorous substances (22 substances) were measured. * All items not listed were below minimum determination limit. Boiler (Hot and cold water generator) Water quality measurement data Substances subject to PRTR Unit : kg/year Unit : Dust= g/Nm 3 NOx = ppm SOx=Nm 3 /hr Atmosphere measurement data pH COD BOD SS Oil content Zinc Index Regulation value Results Maximum Average Atmosphere Waterways Soil Sewage Waste Amount released Amount consumed Amount recycled Amount Removed and treated Amount transferred 300 Toluene 2,619 Substance number Chemical name Amount handled Noise / Vibration data Unit : dB Index Morning Afternoon Evening Night Daytime Nighttime Regulation value Maximum Average Noise Vibration 64 69 64 59 68 63 54 62 59 57 49 33 49 53 51 50 33 27 Regulation value Maximum value Facility Index Dust NOx SOx Dust NOx SOx Boiler (for cafeteria use) 0.1 104 1.2 0.1 104 1.2 - 66 - 0.003 47 - Unit : mg/ ℓ(Excluding Ph) 5.9~8.4 19 (20) (20) 4 1.6 7.1 4.1 11 2.8 1.3 0.03 6.7 3.4 7.8 2.1 0.39 0.03 Soluble iron Soluble manganese Fluorine Nitrogen Phosphorus Boron Index Regulation value Results Maximum Average 4 1.6 4 (16.1) (1.5) 8 ND ND 0.15 10 0.05 0.04 ND ND 0.13 8.1 0.04 0.02 2,103 - - - - - - 516 Foul odor Measurement item Odor index Regulation value Measurement 12 Less than 10 Boiler (Hot and cold water generator) Classification Overall environmental data Volume 1,152,944 501,148 5,357 45,443 1,165 0 1,285 222,703 4,546 - - 52 5,068 2,125 0 1,314 Energy consumption Water consumed Chemical substances handled Greenhouse gases NOx SOx Chemical substances released Wastewater COD Nitrogen Phosphorus Chemical substances transferred Recycled for profit Recycled at a charge Waste (incineration+landfill) Chemical substances transferred (GJ) (m 3 ) (kg) (t -CO2) (kg) (kg) (kg) (m 3 ) (kg) (kg) (kg) (kg) (t) (t) (t) (kg) INPUT OUTPUT Atmosphere Sewage Materials discarded * Due to sewage disposal, there are no regulation values for COD, nitrogen, or phosphorus 216,356 143,907 3,669 8,434 967 0 3,083 194,520 694 1,032 6.0 0 847 283 0 0 Energy consumption Water consumed Chemical substances handled Greenhouse gases NOx SOx Chemical substances released Wastewater COD Nitrogen Phosphorus Chemical substances transferred Recycled for profit Recycled at a charge Waste (incineration+landfill) Chemical substances transferred (GJ) (m 3 ) (kg) (t -CO2) (kg) (kg) (kg) (m 3 ) (kg) (kg) (kg) (kg) (t) (t) (t) (kg) Classification Overall environmental data Volume INPUT OUTPUT Atmosphere Waterways Materials discarded
Transcript of JTEKT CSR Report Environmental Data by Operations Base
This page includes the environmental data forthe Kokubu Plant and Kariya Plant, out of our 13 locations,including 12 domestic plants and1 operations center.
Environmental Data byOperations Base ①
JTEKT CSR Report 2013 [Chemicals] Substances subject to PRTR [Atmosphere] Measured values are the maximum values [Water quality] pH: Hydrogen-ion concentration/ COD:Chemical oxygen demand/ BOD: Biochemical oxygen demand/ SS: Suspended solids in water/ Oil content: N-hexane extract content/ ND: Lower than determination limit/ Values in parenthesis show the daily average values [Regulated value] JTEKT internal standards (some more stricter than regulatory amounts) [Substances subject to PRTR] Shows substances which are handled in amounts of 1,000 kg/year or more. Substance number shows the legislative number for each of the No. 1 type chemical substances of the PRTR regulations. Removal processing amount is the amount of substances subject to PRTR which are incinerated, neutralized, broken down, put through reaction treatment, etc. within JTEKT premises. Consumed amount is the amount of substances subject to PRTR which are changed to another substance through reaction treatment, or removed from JTEKT premises in, or attached to, products. [Target period] April 2012 to March 2013
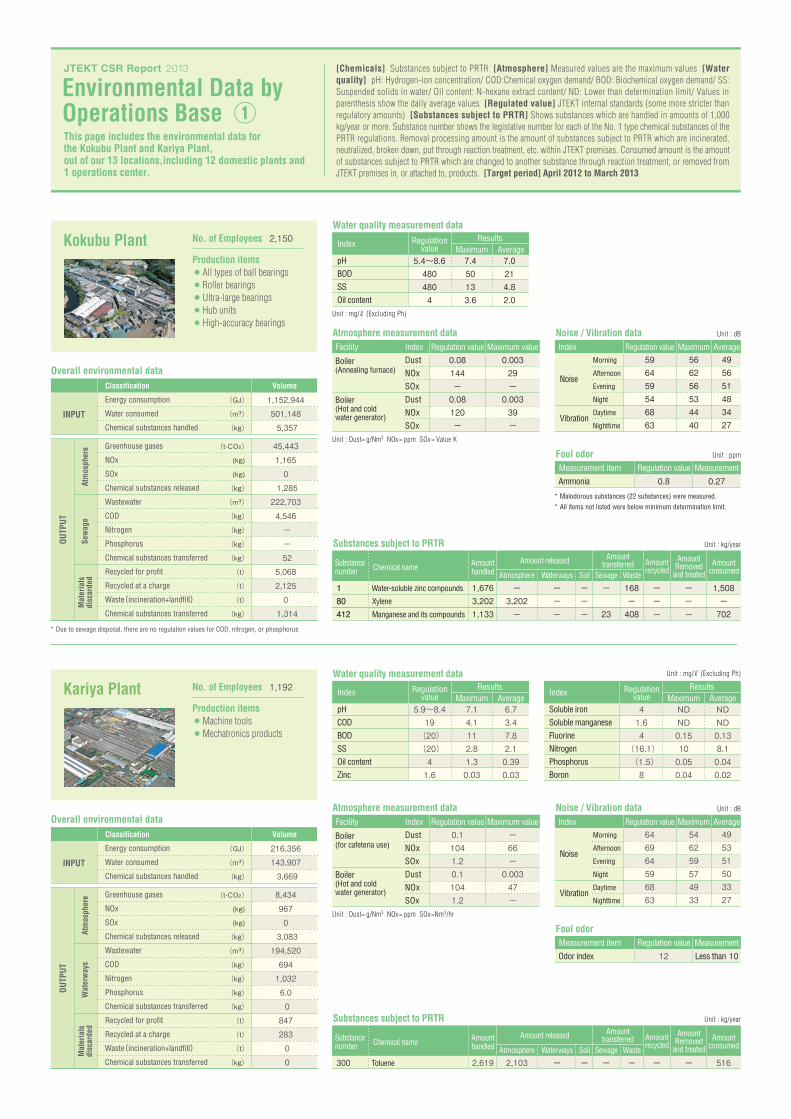
Kokubu Plant No. of Employees 2,150
Production items ● All types of ball bearings● Roller bearings● Ultra-large bearings● Hub units● High-accuracy bearings
Kariya Plant No. of Employees 1,192
Production items ● Machine tools● Mechatronics products
Water quality measurement data
Substances subject to PRTR Unit : kg/year
Unit : Dust= g/Nm3 NOx = ppm SOx = Value K
Atmosphere measurement data
pHBODSSOil content
Index Regulationvalue
ResultsMaximum Average
Atmosphere Waterways Soil Sewage Waste
Amount released Amountconsumed
Amountrecycled
AmountRemoved
and treated
Amounttransferred
180412
Water-soluble zinc compounds
Xylene
Manganese and its compounds
1,6763,2021,133
Substancenumber Chemical name Amount
handled
Noise / Vibration data Unit : dB
IndexMorning
Afternoon
Evening
Night
Daytime
Nighttime
Regulation value Maximum Average
Noise
Vibration
596459546863
566256534440
495651483427
Regulation value Maximum valueFacility IndexDustNOxSOxDustNOxSOx
Boiler(Annealing furnace)
0.08144-0.08120-
0.00329-0.00339-
Unit : mg/ℓ (Excluding Ph)
5.4~8.64804804
7.4 50 13 3.6
7.0 21 4.8 2.0
-3,202-
---
---
-
23
168-408
---
---
1,508-702
Foul odor Unit : ppm
Measurement itemAmmonia
Regulation value Measurement0.8 0.27
* Malodorous substances (22 substances) were measured.* All items not listed were below minimum determination limit.
Boiler(Hot and coldwater generator)
Water quality measurement data
Substances subject to PRTR Unit : kg/year
Unit : Dust= g/Nm3 NOx = ppm SOx=Nm3/hr
Atmosphere measurement data
pHCODBODSS Oil content Zinc
Index Regulationvalue
ResultsMaximum Average
Atmosphere Waterways Soil Sewage Waste
Amount released Amountconsumed
Amountrecycled
AmountRemoved
and treated
Amounttransferred
300 Toluene 2,619
Substancenumber Chemical name Amount
handled
Noise / Vibration data Unit : dB
IndexMorning
Afternoon
Evening
Night
Daytime
Nighttime
Regulation value Maximum Average
Noise
Vibration
646964596863
546259574933
495351503327
Regulation value Maximum valueFacility IndexDustNOxSOxDustNOxSOx
Boiler(for cafeteria use)
0.11041.20.11041.2
-66-0.00347-
Unit : mg/ℓ (Excluding Ph)
5.9~8.419 (20) (20)41.6
7.14.1112.81.30.03
6.73.47.82.10.390.03
Soluble iron Soluble manganese Fluorine Nitrogen Phosphorus Boron
Index Regulationvalue
ResultsMaximum Average
41.64
(16.1) (1.5)8
NDND0.15100.050.04
NDND0.138.10.040.02
2,103 - - - - - - 516
Foul odorMeasurement itemOdor index
Regulation value Measurement12 Less than 10
Boiler(Hot and coldwater generator)
Classification
Overall environmental dataVolume
1,152,944 501,148 5,357
45,443 1,165 0 1,285222,703 4,546 --52
5,068 2,125 0 1,314
Energy consumption
Water consumed
Chemical substances handled
Greenhouse gases
NOx
SOx
Chemical substances released
Wastewater
COD
Nitrogen
Phosphorus
Chemical substances transferred
Recycled for profit
Recycled at a charge
Waste(incineration+landfill)Chemical substances transferred
(GJ)
(m3)
(kg)
(t-CO2)
(kg)
(kg)
(kg)
(m3)
(kg)
(kg)
(kg)
(kg)
(t)
(t)
(t)
(kg)
INPUT
OUTP
UT
Atm
osph
ere
Sew
age
Mat
eria
lsdi
scar
ded
* Due to sewage disposal, there are no regulation values for COD, nitrogen, or phosphorus
216,356 143,907 3,669
8,434 967 0 3,083194,520 694 1,032 6.0 0847 283 00
Energy consumption
Water consumed
Chemical substances handled
Greenhouse gases
NOx
SOx
Chemical substances released
Wastewater
COD
Nitrogen
Phosphorus
Chemical substances transferred
Recycled for profit
Recycled at a charge
Waste(incineration+landfill)Chemical substances transferred
(GJ)
(m3)
(kg)
(t-CO2)
(kg)
(kg)
(kg)
(m3)
(kg)
(kg)
(kg)
(kg)
(t)
(t)
(t)
(kg)
Classification
Overall environmental dataVolume
INPUT
OUTP
UT
Atm
osph
ere
Wat
erw
ays
Mat
eria
lsdi
scar
ded

Environmental Data byOperations Base ②
JTEKT CSR Report 2013 [Chemicals] Substances subject to PRTR [Atmosphere] Measured values are the maximum values [Water quality] pH: Hydrogen-ion concentration/ COD:Chemical oxygen demand/ BOD: Biochemical oxygen demand/ SS: Suspended solids in water/ Oil content: N-hexane extract content/ ND: Lower than determination limit/ Values in parenthesis show the daily average values [Regulated value] JTEKT internal standards (some more stricter than regulatory amounts) [Substances subject to PRTR] Shows substances which are handled in amounts of 1,000 kg/year or more. Substance number shows the legislative number for each of the No. 1 type chemical substances of the PRTR regulations. Removal processing amount is the amount of substances subject to PRTR which are incinerated, neutralized, broken down, put through reaction treatment, etc. within JTEKT premises. Consumed amount is the amount of substances subject to PRTR which are changed to another substance through reaction treatment, or removed from JTEKT premises in, or attached to, products. [Target period] April 2012 to March 2013
Tokushima Plant No. of Employees 1,247
Production items ● Ball bearings● Water pump bearings● Cylindrical roller bearings● Special environment bearings● Double row angular contact ball bearings
Okazaki Plant No. of Employees 763
Production items ● 4WD coupling● Linear solenoid valves for AT and CVT● Oil pumps for AT and CVT● Propeller shafts● Cast parts
Unit : mg/ℓ (Excluding Ph)
Substances subject to PRTR Unit : kg/year
Unit : Dust= g/Nm3 NOx = ppm SOx = Value K
Atmosphere measurement data
Atmosphere Waterways Soil Sewage Waste
Amount released Amountconsumed
Amountrecycled
AmountRemoved
and treated
Amounttransferred
80438
Xylene
Methylnaphthalene
3,8947,505
Substancenumber Chemical name Amount
handled
Noise / Vibration data Unit : dB
IndexMorning
Afternoon
Evening
Night
Daytime
Nighttime
Regulation value Maximum Average
Noise
Vibration
596459546358
525952515655
465650475151
Regulation value Maximum valueFacility IndexDustNOxSOxDustNOxSOx
Boiler(Absorption typecold and hot watergenerator)
0.2414416.80.08902.516.8
0.01650.020.038300.12
3,894-
--
--
--
--
--
-7,505
--
Foul odor* Malodorous substances (22 substances) were measured.* All items were below minimum determination limit.
Diesel engine
Water quality measurement data
pHCODSS Oil content Nitrogen Phosphorus
Index Regulationvalue
ResultsMaximum Average
5.9~8.216242.4252.5
7.611161.87.70.06
6.68.43.81.44.50.05
Water quality measurement data
Substances subject to PRTR Unit : kg/year
Unit : Dust= g/Nm3 NOx = ppm SOx=Nm3/hr
Atmosphere measurement data
pHCODBODSS Oil content Zinc
Index Regulationvalue
ResultsMaximum Average
Atmosphere Waterways Soil Sewage Waste
Amount released Amountconsumed
Amountrecycled
AmountRemoved
and treated
Amounttransferred
300 Toluene 3,139
Substancenumber Chemical name Amount
handled
Noise / Vibration data Unit : dB
IndexMorning
Afternoon
Evening
Night
Daytime
Nighttime
Regulation value Maximum Average
Noise
Vibration
646964596863
596359533439
525652513031
Regulation value Maximum valueFacility IndexDustNOxSOxDustNOxSOxDustNOxSOxDustNOxSOx
Electric furnace 0.1806.10.1104-0.1806.10.041606.1
0.00210-0.00238-0.00210-0.005115-
Unit : mg/ℓ (Excluding Ph)
5.9~8.41616161.60.8
8.13.33.53.00.500.05
7.72.52.21.30.250.05
Soluble iron Soluble manganese Fluorine Nitrogen Phosphorus Boron
Index Regulationvalue
ResultsMaximum Average
2.42.40.8(12)(1.6)8
0.500.250.107.10.100.02
0.500.250.105.60.050.02
2,511 - - - - - - 628
Foul odorMeasurement itemOdor index
Regulation value Measurement12 Less than 10
Boiler(for air conditioning)
Heating furnace
Gas engine(cogeneration)
956,7911,183,86818,944
37,69945,4121,6273,922202,0395,6204,315140
7,0001,55500
Energy consumption
Water consumed
Chemical substances handled
Greenhouse gases
NOx
SOx
Chemical substances released
Wastewater
COD
Nitrogen
Phosphorus
Chemical substances transferred
Recycled for profit
Recycled at a charge
Waste(incineration+landfill)Chemical substances transferred
(GJ)
(m3)
(kg)
(t-CO2)
(kg)
(kg)
(kg)
(m3)
(kg)
(kg)
(kg)
(kg)
(t)
(t)
(t)
(kg)
562,47590,5725,234
23,12118,4180
3,39944,7731212380.70
6,4462,27200
Energy consumption
Water consumed
Chemical substances handled
Greenhouse gases
NOx
SOx
Chemical substances released
Wastewater
COD
Nitrogen
Phosphorus
Chemical substances transferred
Recycled for profit
Recycled at a charge
Waste(incineration+landfill)Chemical substances transferred
(GJ)
(m3)
(kg)
(t-CO2)
(kg)
(kg)
(kg)
(m3)
(kg)
(kg)
(kg)
(kg)
(t)
(t)
(t)
(kg)
Classification
Overall environmental dataVolume
INPUT
OUTP
UT
Atm
osph
ere
Wat
erw
ays
Mat
eria
lsdi
scar
ded
Classification
Overall environmental dataVolume
INPUT
OUTP
UT
Atm
osph
ere
Wat
erw
ays
Mat
eria
lsdi
scar
ded
This page includes the environmental data forthe Tokushima Plant and Okazaki Plant, out of our 13 locations,including 12 domestic plants and1 operations center.

Environmental Data byOperations Base ③
JTEKT CSR Report 2013 [Chemicals] Substances subject to PRTR [Atmosphere] Measured values are the maximum values [Water quality] pH: Hydrogen-ion concentration/ COD:Chemical oxygen demand/ BOD: Biochemical oxygen demand/ SS: Suspended solids in water/ Oil content: N-hexane extract content/ ND: Lower than determination limit/ Values in parenthesis show the daily average values [Regulated value] JTEKT internal standards (some more stricter than regulatory amounts) [Substances subject to PRTR] Shows substances which are handled in amounts of 1,000 kg/year or more. Substance number shows the legislative number for each of the No. 1 type chemical substances of the PRTR regulations. Removal processing amount is the amount of substances subject to PRTR which are incinerated, neutralized, broken down, put through reaction treatment, etc. within JTEKT premises. Consumed amount is the amount of substances subject to PRTR which are changed to another substance through reaction treatment, or removed from JTEKT premises in, or attached to, products. [Target period] April 2012 to March 2013
Tokyo Plant No. of Employees 559
Production items ● Needle roller bearings● Constant velocity joints● Drive shafts● Propeller shafts
Kagawa Plant No. of Employees 858
Production items ● Tapered roller bearings
Foul odor Unit : ppm
Measurement itemAcetaldehyde
Regulation value Measurement0.04 0.013
* Malodorous substances (22 substances) were measured.* All items not listed were below minimum determination limit.
Substances subject to PRTR Unit : kg/year
Atmosphere Waterways Soil Sewage Waste
Amount released Amountconsumed
Amountrecycled
AmountRemoved
and treated
Amounttransferred
180300
Water-soluble zinc compounds
Xylene
Toluene
1,3321,6106,969
Substancenumber Chemical name Amount
handled
-1,6106,969
---
---
---
133--
---
---
1,199--
Substances subject to PRTR Unit : kg/year
Atmosphere Waterways Soil Sewage Waste
Amount released Amountconsumed
Amountrecycled
AmountRemoved
and treated
Amounttransferred
80438
Xylene
Methylnaphthalene
3,0512,240
Substancenumber Chemical name Amount
handled
3,05111
--
--
--
--
--
-2,229
--
Unit : mg/ℓ (Excluding Ph)
Unit : mg/ℓ (Excluding Ph)
Unit : Dust= g/Nm3 NOx = ppm SOx = Value K
Unit : Dust= g/Nm3 NOx = ppm SOx = Value K
Atmosphere measurement data Noise / Vibration data Unit : dB
IndexMorning
Afternoon
Evening
Night
Daytime
Nighttime
Regulation value Maximum Average
Noise
Vibration
596959545848
596158544138
575957523124
Regulation value Maximum valueFacility IndexDustNOxSOx
Gas suction typeboiler
0.1440.3
0.003390.01
Foul odor* Malodorous substances (22 substances) were measured.* All items were below minimum determination limit.
Water quality measurement data
pHBODSS Oil content Nitrogen Phosphorus
Index Regulationvalue
ResultsMaximum Average
5.8~8.0150200209612.8
7.988303.0840.83
7.416161.2180.32
* Less than regulatory amounts (950)
Atmosphere measurement data Noise / Vibration data Unit : dB
IndexMorning
Afternoon
Evening
Night
Daytime
Nighttime
Regulation value Maximum Average
Noise
Vibration
646464594946
595959583432
565656533028
Regulation value Maximum valueFacility IndexDustNOxSOxDustNOxSOx
Boiler 0.242084.00.08902.54.0
0.02791.00.038100.5
Private powergenerator
Water quality measurement data
pHCODBODSS
Index Regulationvalue
ResultsMaximum Average
5.9~8.4404040
7.1333818
6.628366.2
Oil content Nitrogen Phosphorus
Index Regulationvalue
ResultsMaximum Average
2.4486.4
2.3174.5
2.1121.6
337,738130,04712,160
13,0481.64.58,71587,9231,2391,32331771,8057880
1,662
Energy consumption
Water consumed
Chemical substances handled
Greenhouse gases
NOx
SOx
Chemical substances released
Wastewater
BOD
Nitrogen
Phosphorus
Chemical substances transferred
Recycled for profit
Recycled at a charge
Waste(incineration+landfill)Chemical substances transferred
(GJ)
(m3)
(kg)
(t-CO2)
(kg)
(kg)
(kg)
(m3)
(kg)
(kg)
(kg)
(kg)
(t)
(t)
(t)
(kg)
946,329364,6957,830
36,9431,5452993,169257,2704,6182,311906
8,8811,2630154
Energy consumption
Water consumed
Chemical substances handled
Greenhouse gases
NOx
SOx
Chemical substances released
Wastewater
COD
Nitrogen
Phosphorus
Chemical substances transferred
Recycled for profit
Recycled at a charge
Waste(incineration+landfill)Chemical substances transferred
(GJ)
(m3)
(kg)
(t-CO2)
(kg)
(kg)
(kg)
(m3)
(kg)
(kg)
(kg)
(kg)
(t)
(t)
(t)
(kg)
Classification
Overall environmental dataVolume
INPUT
OUTP
UT
Atm
osph
ere
Sew
age
Mat
eria
lsdi
scar
ded
* Due to sewage disposal, there are no regulation values for COD
Classification
Overall environmental dataVolume
INPUT
OUTP
UT
Atm
osph
ere
Wat
erw
ays
Mat
eria
lsdi
scar
ded
This page includes the environmental data forthe Tokyo Plant and Kagawa Plant, out of our 13 locations,including 12 domestic plants and1 operations center.
Environmental Data byOperations Base ④
JTEKT CSR Report 2013 [Chemicals] Substances subject to PRTR [Atmosphere] Measured values are the maximum values [Water quality] pH: Hydrogen-ion concentration/ COD:Chemical oxygen demand/ BOD: Biochemical oxygen demand/ SS: Suspended solids in water/ Oil content: N-hexane extract content/ ND: Lower than determination limit/ Values in parenthesis show the daily average values [Regulated value] JTEKT internal standards (some more stricter than regulatory amounts) [Substances subject to PRTR] Shows substances which are handled in amounts of 1,000 kg/year or more. Substance number shows the legislative number for each of the No. 1 type chemical substances of the PRTR regulations. Removal processing amount is the amount of substances subject to PRTR which are incinerated, neutralized, broken down, put through reaction treatment, etc. within JTEKT premises. Consumed amount is the amount of substances subject to PRTR which are changed to another substance through reaction treatment, or removed from JTEKT premises in, or attached to, products. [Target period] April 2012 to March 2013
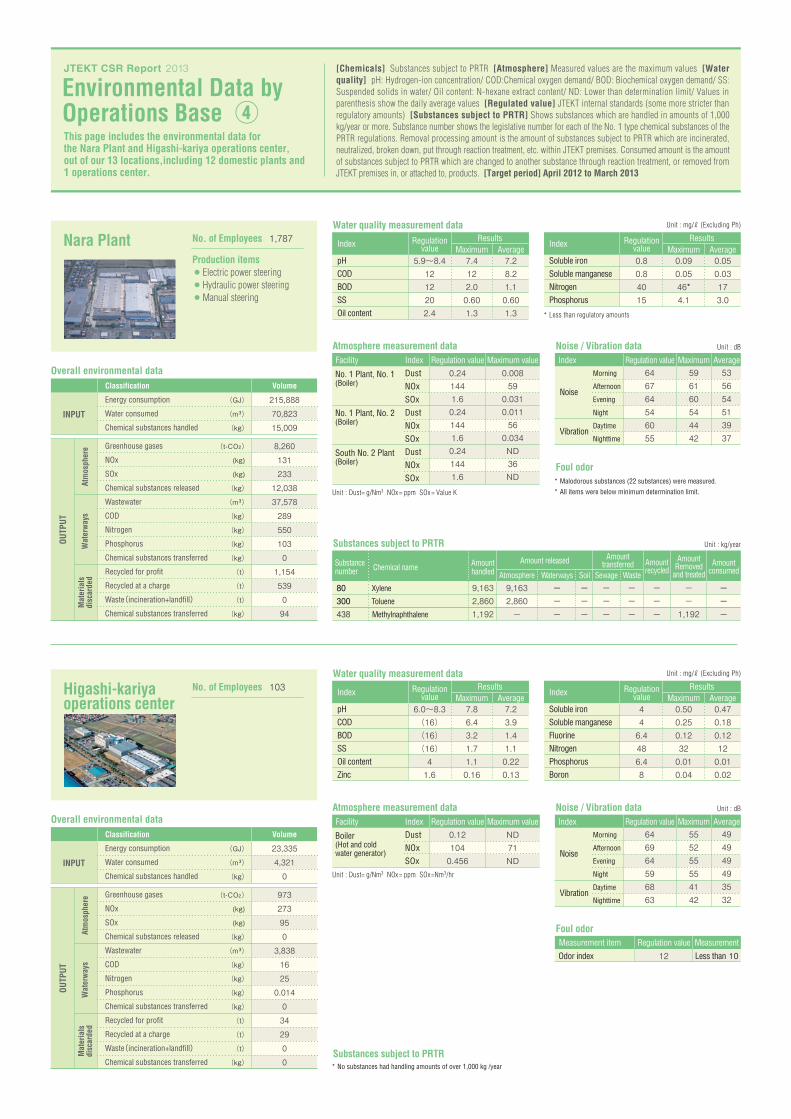
Nara Plant No. of Employees 1,787
Production items ● Electric power steering● Hydraulic power steering● Manual steering
Higashi-kariyaoperations center
No. of Employees 103
Substances subject to PRTR Unit : kg/year
Atmosphere Waterways Soil Sewage Waste
Amount released Amountconsumed
Amountrecycled
AmountRemoved
and treated
Amounttransferred
80300438
Xylene
Toluene
Methylnaphthalene
9,1632,8601,192
Substancenumber Chemical name Amount
handled
9,1632,860-
---
---
---
---
---
--1,192
---
Foul odorMeasurement itemOdor index
Regulation value Measurement12 Less than 10
Water quality measurement data
pHCODBODSS Oil content Zinc
Index Regulationvalue
ResultsMaximum Average
Unit : mg/ℓ (Excluding Ph)
6.0~8.3(16)(16)(16)41.6
7.86.43.21.71.10.16
7.23.91.41.10.220.13
Soluble iron Soluble manganese Fluorine Nitrogen Phosphorus Boron
Index Regulationvalue
ResultsMaximum Average
446.4486.48
0.500.250.12320.010.04
0.470.180.12120.010.02
Foul odor* Malodorous substances (22 substances) were measured.* All items were below minimum determination limit.
* No substances had handling amounts of over 1,000 kg /year
* Less than regulatory amounts
Substances subject to PRTR
Noise / Vibration data Unit : dB
IndexMorning
Afternoon
Evening
Night
Daytime
Nighttime
Regulation value Maximum Average
Noise
Vibration
646964596863
555255554142
494949493532
Unit : Dust= g/Nm3 NOx = ppm SOx=Nm3/hr
Atmosphere measurement dataRegulation value Maximum valueFacility Index
DustNOxSOx
Boiler(Hot and coldwater generator)
0.121040.456
ND71ND
Water quality measurement data
Unit : Dust= g/Nm3 NOx = ppm SOx = Value K
Atmosphere measurement data
pHCODBODSS Oil content
Index Regulationvalue
ResultsMaximum Average
Noise / Vibration data Unit : dB
IndexMorning
Afternoon
Evening
Night
Daytime
Nighttime
Regulation value Maximum Average
Noise
Vibration
646764546055
596160544442
535654513937
Regulation value Maximum valueFacility IndexDustNOxSOxDustNOxSOxDustNOxSOx
No. 1 Plant, No. 1(Boiler)
0.241441.60.241441.60.241441.6
0.008590.0310.011560.034ND36ND
Unit : mg/ℓ (Excluding Ph)
5.9~8.41212202.4
7.4122.00.601.3
7.28.21.10.601.3
Soluble iron Soluble manganese Nitrogen Phosphorus
Index Regulationvalue
ResultsMaximum Average
0.80.84015
0.090.0546*4.1
0.050.03173.0
No. 1 Plant, No. 2(Boiler)
South No. 2 Plant(Boiler)
215,88870,82315,009
8,26013123312,03837,5782895501030
1,154539094
Energy consumption
Water consumed
Chemical substances handled
Greenhouse gases
NOx
SOx
Chemical substances released
Wastewater
COD
Nitrogen
Phosphorus
Chemical substances transferred
Recycled for profit
Recycled at a charge
Waste(incineration+landfill)Chemical substances transferred
(GJ)
(m3)
(kg)
(t-CO2)
(kg)
(kg)
(kg)
(m3)
(kg)
(kg)
(kg)
(kg)
(t)
(t)
(t)
(kg)
23,3354,3210
973273950
3,83816250.0140342900
Energy consumption
Water consumed
Chemical substances handled
Greenhouse gases
NOx
SOx
Chemical substances released
Wastewater
COD
Nitrogen
Phosphorus
Chemical substances transferred
Recycled for profit
Recycled at a charge
Waste(incineration+landfill)Chemical substances transferred
(GJ)
(m3)
(kg)
(t-CO2)
(kg)
(kg)
(kg)
(m3)
(kg)
(kg)
(kg)
(kg)
(t)
(t)
(t)
(kg)
Classification
Overall environmental dataVolume
INPUT
OUTP
UT
Atm
osph
ere
Wat
erw
ays
Mat
eria
lsdi
scar
ded
Classification
Overall environmental dataVolume
INPUT
OUTP
UT
Atm
osph
ere
Wat
erw
ays
Mat
eria
lsdi
scar
ded
This page includes the environmental data forthe Nara Plant and Higashi-kariya operations center, out of our 13 locations,including 12 domestic plants and1 operations center.

Environmental Data byOperations Base ⑤
JTEKT CSR Report 2013 [Chemicals] Substances subject to PRTR [Atmosphere] Measured values are the maximum values [Water quality] pH: Hydrogen-ion concentration/ COD:Chemical oxygen demand/ BOD: Biochemical oxygen demand/ SS: Suspended solids in water/ Oil content: N-hexane extract content/ ND: Lower than determination limit/ Values in parenthesis show the daily average values [Regulated value] JTEKT internal standards (some more stricter than regulatory amounts) [Substances subject to PRTR] Shows substances which are handled in amounts of 1,000 kg/year or more. Substance number shows the legislative number for each of the No. 1 type chemical substances of the PRTR regulations. Removal processing amount is the amount of substances subject to PRTR which are incinerated, neutralized, broken down, put through reaction treatment, etc. within JTEKT premises. Consumed amount is the amount of substances subject to PRTR which are changed to another substance through reaction treatment, or removed from JTEKT premises in, or attached to, products. [Target period] April 2012 to March 2013
Toyohashi Plant No. of Employees 862
Production items ● Hydraulic power steering● Manual steering● Safety handle column
Tadomisaki Plant No. of Employees 1,182
Production items ● Drive shafts● 4WD coupling
Foul odorMeasurement itemOdor index
Regulation value Measurement14 10
Substances subject to PRTR Unit : kg/year
Atmosphere Waterways Soil Sewage Waste
Amount released Amountconsumed
Amountrecycled
AmountRemoved
and treated
Amounttransferred
453 Molybdenum and its compounds 1,318
Substancenumber Chemical name Amount
handled
- - - - - - - 1,318
Unit : Dust= g/Nm3 NOx = ppm SOx=Nm3/hr
Atmosphere measurement dataRegulation value Maximum valueFacility Index
DustNOxSOxDustNOxSOx
Boiler(Hot and coldwater generator)
Continuouscarburizing furnace
0.11040.60.11040.6
0.001380.0010.001100.001
Unit : mg/ℓ (Excluding Ph)
Noise / Vibration data Unit : dB
IndexMorning
Afternoon
Evening
Night
Daytime
Nighttime
Regulation value Maximum Average
Noise
Vibration
606564595550
586461564134
555956533834
Water quality measurement data
pHCODBODSS
Index Regulationvalue
ResultsMaximum Average
6.1~8.0161624
7.3104.913
6.96.21.83.9
Oil content Nitrogen Phosphorus
Index Regulationvalue
ResultsMaximum Average
4486.4
1.0482.9
1.0160.94
Foul odorMeasurement itemOdor index
Regulation value Measurement16 10
Water quality measurement data
pHCODBODSS Oil content Zinc
Index Regulationvalue
ResultsMaximum Average
Unit : mg/ℓ (Excluding Ph)
6.1~8.31212241.64
7.68.32.73.00.500.08
7.36.61.71.30.500.08
Soluble iron Soluble manganese Fluorine Nitrogen Phosphorus Boron
Index Regulationvalue
ResultsMaximum Average
2.41.66.4
(34.8)(3.6)8
0.100.100.10140.340.10
0.100.100.108.50.230.10
* No substances had handling amounts of over 1,000 kg /year
Substances subject to PRTR
Noise / Vibration data Unit : dB
IndexMorning
Afternoon
Evening
Night
Daytime
Nighttime
Regulation value Maximum Average
Noise
Vibration
646964595550
616160594444
575757564141
Unit : Dust= g/Nm3 NOx = ppm SOx = Value K
Atmosphere measurement dataRegulation value Maximum valueFacility Index
DustNOxSOxDustNOxSOxDustNOxSOx
No. 1 Plant(Boiler)
0.031201.00.031201.00.101401.0
0.002340.0040.001350.0020.056640.002
No. 2 Plant(Hot and coldwater generator)
No. 3 Plant(Hot and coldwater generator)
345,55258,4992,717
13,3531,2466062215,871110282160
2,9885040554
Energy consumption
Water consumed
Chemical substances handled
Greenhouse gases
NOx
SOx
Chemical substances released
Wastewater
COD
Nitrogen
Phosphorus
Chemical substances transferred
Recycled for profit
Recycled at a charge
Waste(incineration+landfill)Chemical substances transferred
(GJ)
(m3)
(kg)
(t-CO2)
(kg)
(kg)
(kg)
(m3)
(kg)
(kg)
(kg)
(kg)
(t)
(t)
(t)
(kg)
656,984131,315877
24,9431,3481774
57,9724946525.00
9,295626031
Energy consumption
Water consumed
Chemical substances handled
Greenhouse gases
NOx
SOx
Chemical substances released
Wastewater
COD
Nitrogen
Phosphorus
Chemical substances transferred
Recycled for profit
Recycled at a charge
Waste(incineration+landfill)Chemical substances transferred
(GJ)
(m3)
(kg)
(t-CO2)
(kg)
(kg)
(kg)
(m3)
(kg)
(kg)
(kg)
(kg)
(t)
(t)
(t)
(kg)
Classification
Overall environmental dataVolume
INPUT
OUTP
UT
Atm
osph
ere
Wat
erw
ays
Mat
eria
lsdi
scar
ded
Classification
Overall environmental dataVolume
INPUT
OUTP
UT
Atm
osph
ere
Wat
erw
ays
Mat
eria
lsdi
scar
ded
This page includes the environmental data forthe Toyohashi Plant and Tadomisaki Plant, out of our 13 locations,including 12 domestic plants and1 operations center.

Environmental Data byOperations Base ⑥
JTEKT CSR Report 2013 [Chemicals] Substances subject to PRTR [Atmosphere] Measured values are the maximum values [Water quality] pH: Hydrogen-ion concentration/ COD:Chemical oxygen demand/ BOD: Biochemical oxygen demand/ SS: Suspended solids in water/ Oil content: N-hexane extract content/ ND: Lower than determination limit/ Values in parenthesis show the daily average values [Regulated value] JTEKT internal standards (some more stricter than regulatory amounts) [Substances subject to PRTR] Shows substances which are handled in amounts of 1,000 kg/year or more. Substance number shows the legislative number for each of the No. 1 type chemical substances of the PRTR regulations. Removal processing amount is the amount of substances subject to PRTR which are incinerated, neutralized, broken down, put through reaction treatment, etc. within JTEKT premises. Consumed amount is the amount of substances subject to PRTR which are changed to another substance through reaction treatment, or removed from JTEKT premises in, or attached to, products. [Target period] April 2012 to March 2013
Hanazono Plant No. of Employees 1,370
Production items ● Electric power steering● Hydraulic power steering pump● Control computer
Kameyama Plant No. of Employees 302
Production items ● Ball bearings● Clutch bearings
Substances subject to PRTR Unit : kg/year
Atmosphere Waterways Soil Sewage Waste
Amount released Amountconsumed
Amountrecycled
AmountRemoved
and treated
Amounttransferred
438 Methylnaphthalene 1,818
Substancenumber Chemical name Amount
handled
9 - - - - - 1,809 -
Foul odor* Malodorous substances (22 substances) were measured.* All items were below minimum determination limit.
Unit : Dust= g/Nm3 NOx = ppm SOx=Nm3/hr
Atmosphere measurement dataRegulation value Maximum valueFacility Index
DustNOxSOx
No. 1 Plant(Boiler)
0.11441.65
0.005520.11
Unit : Dust= g/Nm3 NOx = ppm SOx=Nm3/hr
Atmosphere measurement dataRegulation value Maximum valueFacility Index
DustNOxSOxDustNOxSOx
Compactonce-throughboiler
Boiler(Hot and coldwater generator)
0.081006.070.081006.07
0.002230.010.002430.01
Foul odorMeasurement itemOdor index
Regulation value Measurement14 10
Water quality measurement data
pHCODBODSS Oil content Zinc
Index Regulationvalue
ResultsMaximum Average
Unit : mg/ℓ (Excluding Ph)
5.9~8.38881.60.8
7.73.84.01.51.00.08
7.32.71.51.11.00.05
Soluble iron Soluble manganese Fluorine Nitrogen Phosphorus Boron
Index Regulationvalue
ResultsMaximum Average
2.42.40.8(24)(2.4)8
0.500.250.10170.121.0
0.470.240.10120.051.0
* No substances had handling amounts of over 1,000 kg /year
Substances subject to PRTR
Noise / Vibration data Unit : dB
IndexMorning
Afternoon
Evening
Night
Daytime
Nighttime
Regulation value Maximum Average
Noise
Vibration
606060566056
515346455335
454844454033
Water quality measurement data
pHCODBODSS Oil content Zinc
Index Regulationvalue
ResultsMaximum Average
Unit : mg/ℓ (Excluding Ph)
5.9~8.0882014
7.76.02.05.00.500.02
7.32.61.31.60.500.01
Soluble iron Soluble manganese Fluorine Nitrogen Phosphorus Boron
Index Regulationvalue
ResultsMaximum Average
81.66.45018
0.030.020.10280.690.06
0.020.020.10180.170.06
Noise / Vibration data Unit : dB
IndexMorning
Afternoon
Evening
Night
Daytime
Nighttime
Regulation value Maximum Average
Noise
Vibration
646964546358
555850505250
515449504844
284,57492,941912
11,20344211823978,6622468764.208383650132
Energy consumption
Water consumed
Chemical substances handled
Greenhouse gases
NOx
SOx
Chemical substances released
Wastewater
COD
Nitrogen
Phosphorus
Chemical substances transferred
Recycled for profit
Recycled at a charge
Waste(incineration+landfill)Chemical substances transferred
(GJ)
(m3)
(kg)
(t-CO2)
(kg)
(kg)
(kg)
(m3)
(kg)
(kg)
(kg)
(kg)
(t)
(t)
(t)
(kg)
156,75525,6955,210
6,09941718574816,364492802.807112590746
Energy consumption
Water consumed
Chemical substances handled
Greenhouse gases
NOx
SOx
Chemical substances released
Wastewater
COD
Nitrogen
Phosphorus
Chemical substances transferred
Recycled for profit
Recycled at a charge
Waste(incineration+landfill)Chemical substances transferred
(GJ)
(m3)
(kg)
(t-CO2)
(kg)
(kg)
(kg)
(m3)
(kg)
(kg)
(kg)
(kg)
(t)
(t)
(t)
(kg)
Classification
Overall environmental dataVolume
INPUT
OUTP
UT
Atm
osph
ere
Wat
erw
ays
Mat
eria
lsdi
scar
ded
Classification
Overall environmental dataVolume
INPUT
OUTP
UT
Atm
osph
ere
Wat
erw
ays
Mat
eria
lsdi
scar
ded
This page includes the environmental data forthe Hanazono Plant and Kameyama Plant, out of our 13 locations,including 12 domestic plants and1 operations center.
Environmental Data byOperations Base ⑦
JTEKT CSR Report 2013 [Chemicals] Substances subject to PRTR [Atmosphere] Measured values are the maximum values [Water quality] pH: Hydrogen-ion concentration/ COD:Chemical oxygen demand/ BOD: Biochemical oxygen demand/ SS: Suspended solids in water/ Oil content: N-hexane extract content/ ND: Lower than determination limit/ Values in parenthesis show the daily average values [Regulated value] JTEKT internal standards (some more stricter than regulatory amounts) [Substances subject to PRTR] Shows substances which are handled in amounts of 1,000 kg/year or more. Substance number shows the legislative number for each of the No. 1 type chemical substances of the PRTR regulations. Removal processing amount is the amount of substances subject to PRTR which are incinerated, neutralized, broken down, put through reaction treatment, etc. within JTEKT premises. Consumed amount is the amount of substances subject to PRTR which are changed to another substance through reaction treatment, or removed from JTEKT premises in, or attached to, products. [Target period] April 2012 to March 2013
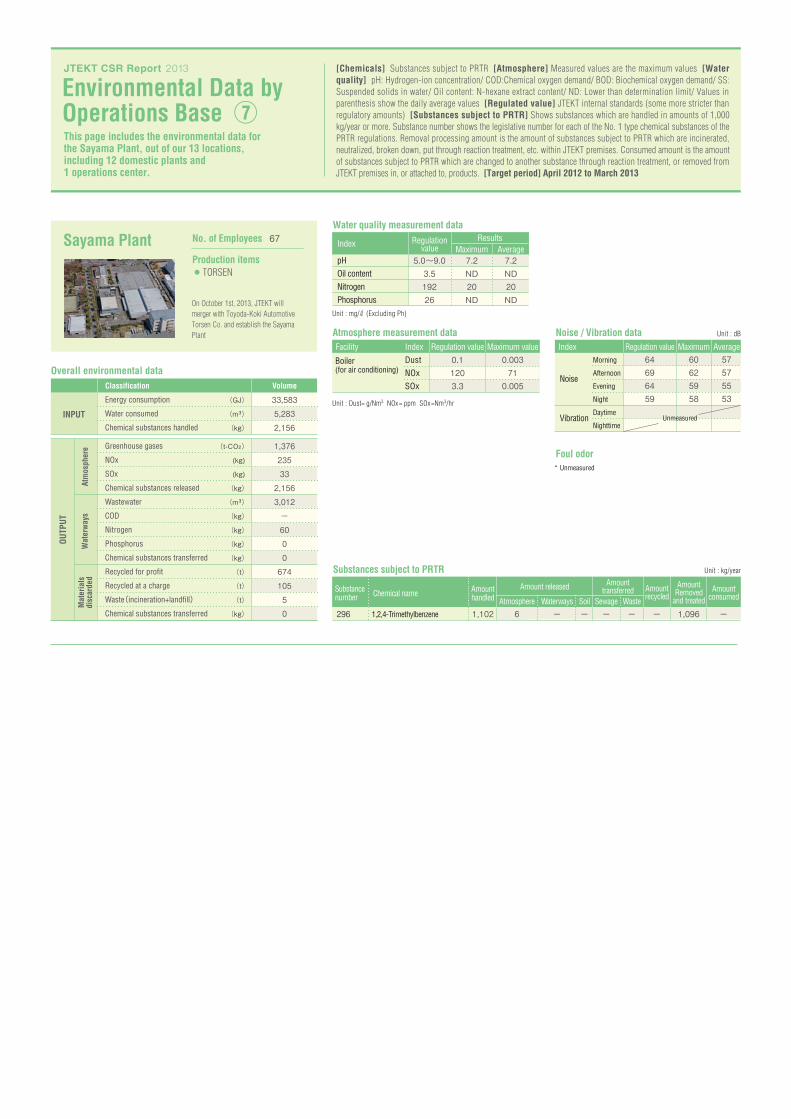
Sayama Plant No. of Employees 67
Production items ● TORSEN
On October 1st, 2013, JTEKT will merger with Toyoda-Koki Automotive Torsen Co. and establish the Sayama Plant
Water quality measurement data
Unit : Dust= g/Nm3 NOx = ppm SOx=Nm3/hr
Atmosphere measurement data
pH Oil content Nitrogen Phosphorus
Index Regulationvalue
ResultsMaximum Average
Noise / Vibration data Unit : dB
IndexMorning
Afternoon
Evening
Night
Daytime
Nighttime
Regulation value Maximum Average
Noise
Vibration
64696459
60625958
57575553
Regulation value Maximum valueFacility IndexDustNOxSOx
Boiler(for air conditioning)
0.11203.3
0.003710.005
Unit : mg/ℓ (Excluding Ph)
5.0~9.03.519226
7.2ND20ND
7.2ND20ND
Substances subject to PRTR Unit : kg/year
Atmosphere Waterways Soil Sewage Waste
Amount released Amountconsumed
Amountrecycled
AmountRemoved
and treated
Amounttransferred
296 1,2,4-Trimethylbenzene 1,102
Substancenumber Chemical name Amount
handled
6 - - - - - 1,096 -
Foul odor* Unmeasured
Unmeasured
33,5835,2832,156
1,376235332,1563,012-600067410550
Energy consumption
Water consumed
Chemical substances handled
Greenhouse gases
NOx
SOx
Chemical substances released
Wastewater
COD
Nitrogen
Phosphorus
Chemical substances transferred
Recycled for profit
Recycled at a charge
Waste(incineration+landfill)Chemical substances transferred
(GJ)
(m3)
(kg)
(t-CO2)
(kg)
(kg)
(kg)
(m3)
(kg)
(kg)
(kg)
(kg)
(t)
(t)
(t)
(kg)
Classification
Overall environmental dataVolume
INPUT
OUTP
UT
Atm
osph
ere
Wat
erw
ays
Mat
eria
lsdi
scar
ded
This page includes the environmental data forthe Sayama Plant, out of our 13 locations,including 12 domestic plants and1 operations center.