JPMorgan European Smaller Companies Trust plc · Capital Structure At 30th September ... Consumer...
24
JPMorgan European Smaller Companies Trust plc Half Year Report & Accounts for the six months ended 30th September 2015
Transcript of JPMorgan European Smaller Companies Trust plc · Capital Structure At 30th September ... Consumer...

JPMorgan European Smaller Companies Trust plcHalf Year Report & Accounts for the six months ended 30th September 2015

Objective Capital growth from smaller European companies (excludingthe United Kingdom).
Investment Policies – To invest in a diversified portfolio of smaller companies inEurope, excluding the United Kingdom.
– To manage liquidity and borrowings to increase potentialreturns to shareholders. The Board’s current policy is to bebetween 20% net cash and 20% geared.
– To emphasise capital growth rather than income. Thereforeshareholders should expect the dividend to vary from year toyear.
– To invest no more than 15% of gross assets in other UK listedinvestment companies (including investment trusts).
Risk It should be noted that the Company invests in the shares ofsmaller companies, which tend to be more volatile than thoseof larger companies. The Company also employs gearing togenerate greater returns. The Company’s shares shouldtherefore be regarded as carrying greater than average risk.
Benchmark Euromoney Smaller European Companies (ex UK) Total ReturnIndex in sterling terms.
Capital Structure At 30th September 2015, the Company’s share capitalcomprised 160,147,885 ordinary shares of 5p each. There wereno shares held in Treasury.
Management Company and Company SecretaryThe Company employs JPMorgan Funds Limited (‘JPMF’ or the‘Manager’) as its Alternative Investment Fund Manager andCompany Secretary. JPMF delegates the management of theCompany’s portfolio to JPMorgan Asset Management (UK)Limited (‘JPMAM’).
FCA regulation of ‘non-mainstream pooledinvestments’The Company currently conducts its affairs so that the sharesit issues can be recommended by Independent FinancialAdvisers to ordinary retail investors in accordance with therules of the Financial Conduct Authority (‘FCA’) in relation tonon-mainstream investment products and intends to continueto do so for the foreseeable future.
The shares are excluded from the FCA’s restrictions which applyto non-mainstream investment products because they areshares in an investment trust.
AICThe Company is a member of the Association of InvestmentCompanies.
WebsiteThe Company’s website, which can be found atwww.jpmeuropeansmallercompanies.co.uk, includes usefulinformation on the Company, such as daily prices, factsheetsand current and historic half year and annual reports.
Features

1
2 HALF YEAR PERFORMANCE
ABOUT THE COMPANY
3 Chairman’s Statement
5 Investment Managers’ Report
INVESTMENT REVIEW
7 List of Investments
9 Portfolio Analyses
00 FINANCIAL STATEMENTS
11 Statement of Comprehensive Income
12 Statement of Changes in Equity
13 Statement of Financial Position
14 Statement of Cash Flows
15 Notes to the Financial Statements
18 Interim Management Report
SHAREHOLDER INFORMATION
19 Glossary of Terms and Definitions
20 Where to buy J.P. Morgan Investment Trusts
21 Information about the Company
Contents

2 JPMORGAN EUROPEAN SMALLER COMPANIES TRUST PLC HALF YEAR REPORT & ACCOUNTS 2015
Financial Data
30th September 31st March %2015 2015 change
Shareholders’ funds (£’000) 436,708 429,727 +1.6
Number of shares in issue 160,147,885 160,147,885 —
Net asset value per share 272.7p 268.3p +1.6
Share price 233.3p 233.5p –0.1
Share price discount to net asset value per share 14.4% 13.0%
Gearing/(net cash) (0.5)% 7.5%
Ongoing Charges 1.15% 1.32%
Glossary of terms and definitions is provided on page 19.1 Source: Morningstar.2 Source: J.P. Morgan.3 Source: Euromoney. The Company’s benchmark is the Euromoney Smaller European Companies (ex UK) Total Return Index in sterling terms.
Half Year Performance
TOTAL RETURNS (INCLUDES DIVIDENDS REINVESTED)
–3.8%Benchmark return3
+0.7%Share price return1
+2.4%Net asset value return2

3
Dear shareholder
PerformanceIn the first six months of the Company’s financial year to 30th September 2015, Europeansmaller companies fared better than their large cap counterparts. However, the market felland the total return from the benchmark index, the Euromoney Smaller EuropeanCompanies (ex UK) Index, was –3.8%. I am pleased to report that our Investment Managersnot only outperformed the benchmark, but they also produced a positive total return on netassets of +2.4% for the six month period. This was due principally to good stock selection.In their report which follows the Investment Managers provide information on the factorsimpacting the market and the Company’s portfolio in the first six months of the financialyear.
The share price return was also positive at +0.7%, however the discount at which theCompany’s shares trade widened from 13.0% at the end of the last financial year to 14.4% at30th September.
The Company’s medium and long term performance record also remains very strong, havingout-performed the benchmark index over one, three, five and ten years. Indeed, the totalreturn on net assets over the ten years ended 30th September 2015 is +152.0% against thebenchmark total return of +93.4%.
Revenue and DividendAs I have explained in previous Chairman’s Statements, the Board’s dividend policy is to payout the vast majority of revenue available each year. I would again remind shareholders thatthe Company’s objective is to achieve capital growth and management of the portfolio is notconstrained to deliver income in any one period. Gross revenue return for the six months to30th September 2015 was slightly lower than the corresponding period in 2014 at£7.4 million (2014: £7.6 million).
The Board has decided to pay an interim dividend of 1.2 pence per share (2014: 1.2 pence),which will be paid on 15th January 2016 to shareholders on the register as at 18th December2015 (the ex-dividend date will be 17th December 2015).
Management FeeAs previously reported, the Company’s management fee was re-negotiated with JPMorganand with effect from 1st April 2015 a reduced fee of 1.0% of net assets has been charged.
Share RepurchasesThe Board continues to monitor the level of the discount carefully and seeks to use its abilityto repurchase shares for cancellation to minimise unexpected fluctuations in the level of thediscount. No shares were repurchased for cancellation during the six months to30th September 2015.
About the Company
CHAIRMAN’S STATEMENT

4 JPMORGAN EUROPEAN SMALLER COMPANIES TRUST PLC HALF YEAR REPORT & ACCOUNTS 2015
OutlookEuropean economies continue their recovery, but the recent slowdown in the rate of growthin the Chinese economy and its associated effect on exports from Europe into China hasmade the Investment Managers more cautious of the immediate market outlook.Accordingly, gearing has been reduced, cyclical investments reduced and the portfolio morefocused on companies whose prospects are more dependent on their own prospects forgrowth rather than broader economic growth.
Carolan DobsonChairman 23rd November 2015
About the Company continued
CHAIRMAN’S STATEMENT CONTINUED

5
ReviewOptimism fuelled by low oil prices and interest rates, a weak Euro and monetary stimulusthrough quantitative easing by the European Central Bank evaporated quickly in Augustwhen data emerging from China suggested a sharp economic slowdown. Markets quicklydiscounted the potential negative repercussions on the Eurozone economy, and in particularGermany, of lower exports to China. The large company MSCI Europe (ex UK) Index declinedby 10.2% in sterling terms in the six months to 30th September 2015. Surprisingly, thereaction of smaller companies was much more muted and the benchmark EuromoneySmaller European Companies (ex UK) Index fell by only 3.8%.
PortfolioWe are pleased to report that in the six month period your Company succeeded in reportinga substantially better result, with the NAV rising by 2.4%. This was achieved largely becauseof good stock selection and to a smaller extent sector allocation. Somewhat unusually andbecause of very volatile markets, we had a small negative impact on performance fromgearing. In the six months we benefited from increased corporate activity. Faively, a Frenchmanufacturer of train components, was approached by a larger US competitor willing inprinciple to offer more than a fifty percent premium, while OVS, the largest Italian apparelretailer, continued to perform strongly following its initial public offering. Stroer, a Germanbillboard advertising company, and Trigano, a French manufacturer of motor vehicle homes,both benefited from a strong pick up in European consumer demand. Poor performers in theperiod included the Italian cement producer Cementir, because of its exposure to Turkey, theSwiss private bank EFG International, due to poor cost control and Elis, the French textilecleaning provider, as it faced a price war in France.
With results of companies exposed to China deteriorating and increasing uncertainty aboutthe state of the world economy, we have made some important changes to the portfolio. Wehave reduced gearing from 8.2% at the end of April to a small cash position at the end ofSeptember. Moreover we have pared back our cyclical exposure, reducing our bigoverweight position in auto components with the sale of companies such as Plastic Omniumin France and George Fischer in Switzerland. We have bolstered our positions in companiesthat should continue to grow regardless of the economic environment such as Temenos, theSwiss world leader in banking software, Ubisoft the European leader in videogamepublishing and Unibet, the online gambling site operator. We have also added to companiesthat are exposed to the European consumer such as the French rental car companyEuropcar and Italian shoe manufacturer and retailer Geox.
Francesco Conte
Jim Campbell
INVESTMENT MANAGERS’ REPORT

6 JPMORGAN EUROPEAN SMALLER COMPANIES TRUST PLC HALF YEAR REPORT & ACCOUNTS 2015
OutlookWhile there does indeed seem to be a slowdown in globally exposed industrial and consumercompanies, the good news is that for now companies exposed to Europe and more especiallythe European consumer are doing well. Europeans are enjoying the benefits of low oil pricesand interest rates at a time when the benefits of economic reform in peripheral Europe areincreasingly evident in their economic renaissance. Consumer confidence indices incountries like Italy are the highest we have seen since 2001.
We have accelerated the process we started in September of focusing on high quality, wellmanaged companies either exposed to the revival in European consumer confidence orcompanies that are generally less correlated with global economic trends. While the macroeconomic outlook may be uncertain we feel confident in the management teams andbusiness models of the companies we are invested in.
Jim CampbellFrancesco ConteInvestment Managers 23rd November 2015
INVESTMENT MANAGERS’ REPORT CONTINUED
About the Company continued
7
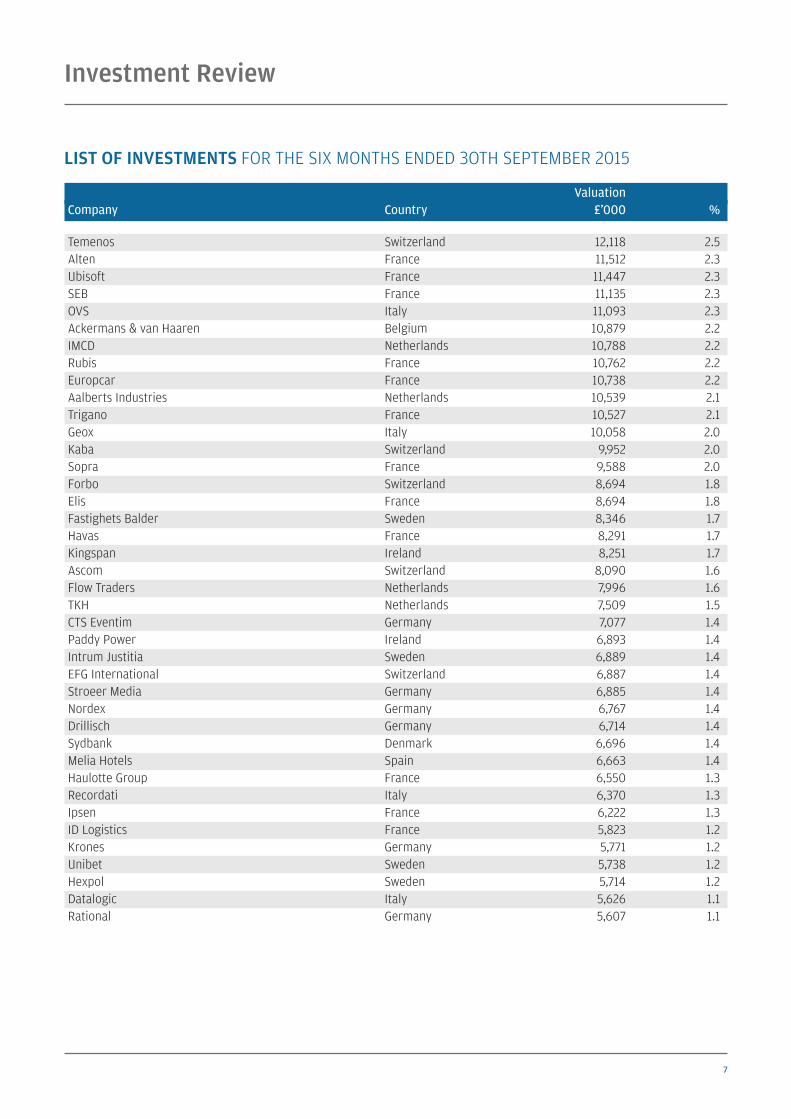
Temenos Switzerland 12,118 2.5Alten France 11,512 2.3Ubisoft France 11,447 2.3SEB France 11,135 2.3OVS Italy 11,093 2.3Ackermans & van Haaren Belgium 10,879 2.2IMCD Netherlands 10,788 2.2Rubis France 10,762 2.2Europcar France 10,738 2.2Aalberts Industries Netherlands 10,539 2.1Trigano France 10,527 2.1Geox Italy 10,058 2.0Kaba Switzerland 9,952 2.0Sopra France 9,588 2.0Forbo Switzerland 8,694 1.8Elis France 8,694 1.8Fastighets Balder Sweden 8,346 1.7Havas France 8,291 1.7Kingspan Ireland 8,251 1.7Ascom Switzerland 8,090 1.6Flow Traders Netherlands 7,996 1.6TKH Netherlands 7,509 1.5CTS Eventim Germany 7,077 1.4Paddy Power Ireland 6,893 1.4Intrum Justitia Sweden 6,889 1.4EFG International Switzerland 6,887 1.4Stroeer Media Germany 6,885 1.4Nordex Germany 6,767 1.4Drillisch Germany 6,714 1.4Sydbank Denmark 6,696 1.4Melia Hotels Spain 6,663 1.4Haulotte Group France 6,550 1.3Recordati Italy 6,370 1.3Ipsen France 6,222 1.3ID Logistics France 5,823 1.2Krones Germany 5,771 1.2Unibet Sweden 5,738 1.2Hexpol Sweden 5,714 1.2Datalogic Italy 5,626 1.1Rational Germany 5,607 1.1
LIST OF INVESTMENTS FOR THE SIX MONTHS ENDED 3OTH SEPTEMBER 2015
Investment Review
ValuationCompany Country £’000 %

8 JPMORGAN EUROPEAN SMALLER COMPANIES TRUST PLC HALF YEAR REPORT & ACCOUNTS 2015
NetEnt Sweden 5,559 1.1Pandox Sweden 5,517 1.1Sartorius Germany 5,457 1.1Irish Continental Ireland 5,438 1.1SimCorp Denmark 5,434 1.1Freenet Germany 5,006 1.0Merlin Properties Spain 4,969 1.0Credito Emiliano Italy 4,553 0.9Moncler Italy 4,452 0.9Manitou France 4,426 0.9Nobia Sweden 4,422 0.9Royal Unibrew Denmark 4,393 0.9Lectra France 4,220 0.9Grenkeleasing Germany 4,143 0.8Moleskine Italy 4,121 0.8Evolution Gaming Sweden 3,476 0.7BasicNet Italy 3,333 0.7Nordax Sweden 3,317 0.7Indutrade Sweden 3,314 0.7XXL ASA Norway 3,240 0.7Faiveley Transport France 3,016 0.6Software Germany 2,597 0.5Cementir Italy 2,549 0.5PER Aarsleff Denmark 2,373 0.5Metsa Board Finland 1,777 0.4Jungheinrich Germany 1,774 0.4Melexis Belgium 1,275 0.3Bakkafrost Norway 1,115 0.2Hibernia REIT Ireland 1,086 0.2Dalata Hotel Ireland 228 —Total investments 438,479 89.2JPM Euro Liquidity Fund 41,486 8.4Net current assets 12,012 2.4Total assets less current liabilities 491,977 100.0
Investment Review continued
LIST OF INVESTMENTS CONTINUED
ValuationCompany Country £’000 %1

9
Geographicalat 30th September 2015 at 31st March 2015Portfolio Benchmark Portfolio Benchmark
% % % %
France 25.1 13.3 21.7 13.1Germany 11.7 14.5 15.0 13.4Sweden 10.7 12.1 15.0 11.4Italy 10.5 12.6 16.4 12.5Switzerland 9.3 10.6 9.7 11.0Netherlands 7.4 4.2 7.6 4.2Ireland 4.4 2.0 1.4 1.6Denmark 3.9 3.3 2.7 3.6Belgium 2.5 4.3 3.4 4.2Spain 2.4 6.9 3.3 7.7Norway 0.9 4.4 — 4.7Finland 0.4 4.7 2.1 4.9Austria — 3.4 — 3.9Greece — 1.9 — 1.9Portugal — 1.8 — 1.9
Total equities 89.2 100.0 98.3 100.0Liquidity Fund 8.4 — 2.1 —Net current assets/(liabilities) 2.4 — (0.4) —
Total 100.0 100.0 100.0 100.0
Based on total assets less current liabilities of £492.0m (31st March 2015: £473.1m).
PORTFOLIO ANALYSES

10 JPMORGAN EUROPEAN SMALLER COMPANIES TRUST PLC HALF YEAR REPORT & ACCOUNTS 2015
Sectorat 30th September 2015 at 31st March 2015Portfolio Benchmark Portfolio Benchmark
% % % %
Consumer Discretionary 23.9 14.9 21.7 14.6Industrials 23.9 24.5 28.0 25.5Information Technology 15.8 7.9 14.4 7.1Financials 14.2 21.4 9.7 21.0Health Care 3.7 10.3 3.3 9.7Telecommunication Services 2.4 1.6 5.9 2.5Utilities 2.2 3.1 1.7 2.8Materials 2.0 6.6 7.9 7.4Consumer Staples 1.1 6.3 5.7 6.0Energy — 3.4 — 3.4
Total equities 89.2 100.0 98.3 100.0Liquidity fund 8.4 — 2.1 —Net current assets/(liabilities) 2.4 — (0.4) —
Total 100.0 100.0 100.0 100.0
Based on total assets less current liabilities of £492.0m (31st March 2015: £473.1m).
PORTFOLIO ANALYSES CONTINUED
Investment Review continued

11
(Unaudited) (Unaudited) (Audited)Six months ended Six months ended Year ended
30th September 2015 30th September 2014 31st March 2015Revenue Capital Total Revenue Capital Total Revenue Capital Total£’000 £’000 £’000 £’000 £’000 £’000 £’000 £’000 £’000
Gains/(losses) on investments held at fair value through profit or loss — 7,428 7,428 — (78,193) (78,193) — (8,060) (8,060)
Net foreign currency (losses)/gains — (1,404) (1,404) — 3,200 3,200 — 7,229 7,229
Income from investments 7,347 — 7,347 7,478 — 7,478 8,448 — 8,448Other interest receivable and
similar income 69 — 69 133 — 133 138 — 138
Gross return/(loss) 7,416 6,024 13,440 7,611 (74,993) (67,382) 8,586 (831) 7,755Management fee (648) (1,512) (2,160) (697) (1,625) (2,322) (1,336) (3,117) (4,453)Other administrative expenses (336) — (336) (306) — (306) (694) — (694)
Net return/(loss) on ordinaryactivities before finance costs and taxation 6,432 4,512 10,944 6,608 (76,618) (70,010) 6,556 (3,948) 2,608
Finance costs (122) (284) (406) (175) (408) (583) (290) (676) (966)
Net return/(loss) on ordinaryactivities before taxation 6,310 4,228 10,538 6,433 (77,026) (70,593) 6,266 (4,624) 1,642
Taxation (354) — (354) (751) — (751) (747) — (747)
Net return/(loss) on ordinaryactivities after taxation 5,956 4,228 10,184 5,682 (77,026) (71,344) 5,519 (4,624) 895
Return/(loss) per share (note 4) 3.72p 2.64p 6.36p 3.55p (48.10)p (44.55)p 3.45p (2.89)p 0.56p
All revenue and capital items in the above statement derive from continuing operations. No operations were acquired ordiscontinued in the period.
The ‘Total’ column of this statement is the profit and loss account of the Company and the ‘Revenue’ and ‘Capital’ columnsrepresent supplementary information prepared under guidance issued by The Association of Investment Companies.
Financial Statements
STATEMENT OF COMPREHENSIVE INCOME FOR THE SIX MONTHS ENDED 30TH SEPTEMBER 2015

12 JPMORGAN EUROPEAN SMALLER COMPANIES TRUST PLC HALF YEAR REPORT & ACCOUNTS 2015
Called up Capitalshare Share redemption Capital Revenuecapital premium reserve reserves reserve1 Total£’000 £’000 £’000 £’000 £’000 £’000
At 31st March 2015 (Unaudited) 8,008 1,312 7,628 406,499 6,280 429,727Net return on ordinary activities — — — 4,228 5,956 10,184Dividends appropriated in the period — — — — (3,203) (3,203)
At 30th September 2015 8,008 1,312 7,628 410,727 9,033 436,708
At 31st March 2014 (Unaudited) 8,008 1,312 7,628 411,139 5,406 433,493Expenses incurred due to stock split — — — (16) — (16)Net (loss)/return on ordinary activities — — — (77,026) 5,682 (71,344)Dividends appropriated in the period — — — — (2,723) (2,723)
At 30th September 2014 8,008 1,312 7,628 334,097 8,365 359,410
At 31st March 2014 (Audited) 8,008 1,312 7,628 411,139 5,406 433,493Expenses incurred due to stock split — — — (16) — (16)Net (loss)/return on ordinary activities — — — (4,624) 5,519 895Dividends appropriated in the year — — — — (4,645) (4,645)
At 31st March 2015 8,008 1,312 7,628 406,499 6,280 429,727
1 This reserve forms the distributable reserves of the Company and may be used to fund distribution of profits to investors via dividend payments.
Financial Statements continued
STATEMENT OF CHANGES IN EQUITY FOR THE SIX MONTHS ENDED 30TH SEPTEMBER 2015 (UNAUDITED)
13
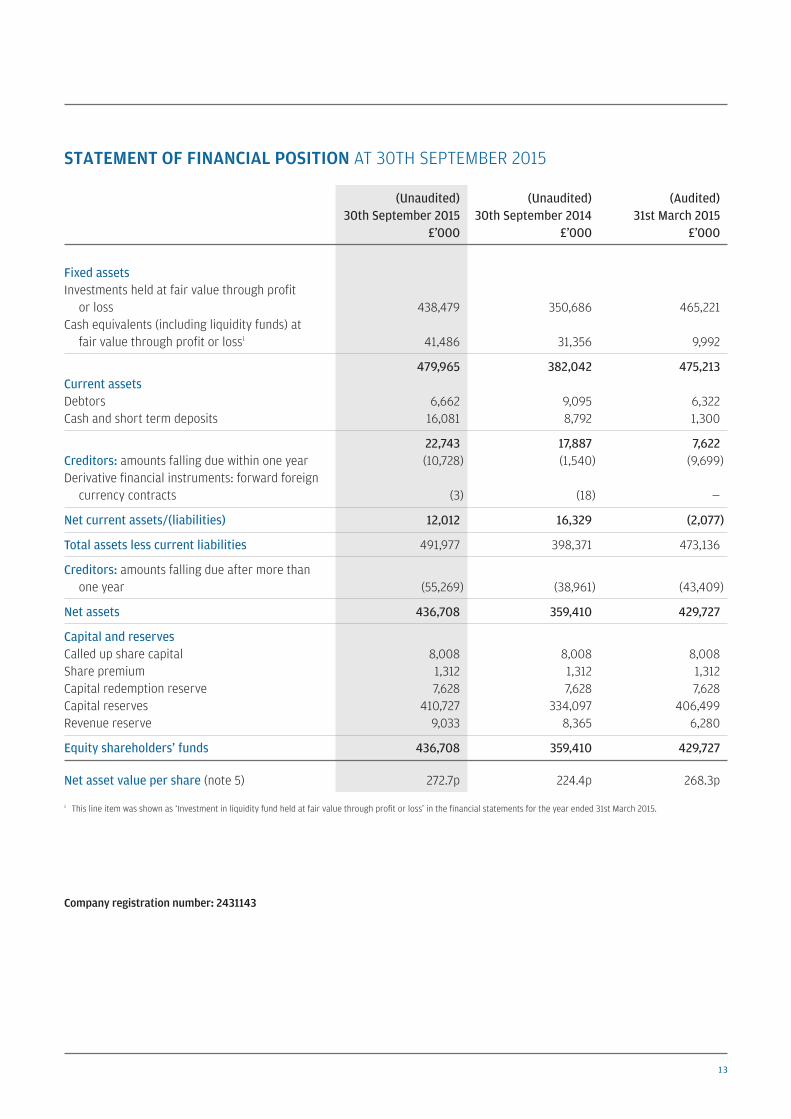
(Unaudited) (Unaudited) (Audited)30th September 2015 30th September 2014 31st March 2015
£’000 £’000 £’000
Fixed assetsInvestments held at fair value through profit
or loss 438,479 350,686 465,221Cash equivalents (including liquidity funds) at
fair value through profit or loss1 41,486 31,356 9,992
479,965 382,042 475,213Current assetsDebtors 6,662 9,095 6,322Cash and short term deposits 16,081 8,792 1,300
22,743 17,887 7,622Creditors: amounts falling due within one year (10,728) (1,540) (9,699)Derivative financial instruments: forward foreign
currency contracts (3) (18) —
Net current assets/(liabilities) 12,012 16,329 (2,077)
Total assets less current liabilities 491,977 398,371 473,136
Creditors: amounts falling due after more thanone year (55,269) (38,961) (43,409)
Net assets 436,708 359,410 429,727
Capital and reservesCalled up share capital 8,008 8,008 8,008Share premium 1,312 1,312 1,312Capital redemption reserve 7,628 7,628 7,628Capital reserves 410,727 334,097 406,499Revenue reserve 9,033 8,365 6,280
Equity shareholders’ funds 436,708 359,410 429,727
Net asset value per share (note 5) 272.7p 224.4p 268.3p
1 This line item was shown as ‘Investment in liquidity fund held at fair value through profit or loss’ in the financial statements for the year ended 31st March 2015.
Company registration number: 2431143
STATEMENT OF FINANCIAL POSITION AT 30TH SEPTEMBER 2015

14 JPMORGAN EUROPEAN SMALLER COMPANIES TRUST PLC HALF YEAR REPORT & ACCOUNTS 2015
(Unaudited) (Unaudited) (Audited)Six months ended Six months ended Year ended
30th September 2015 30th September 2014 31st March 2015£’000 £’000 £’000
Cash inflow from operations (note 6) 3,512 3,798 2,084 Interest paid (402) (580) (974)Taxation 117 223 518
Net cash inflow from operating activities 3,227 3,441 1,628
Purchases of investments and derivatives (478,324) (462,606) (883,929)Sales of investments and derivatives 513,947 515,603 904,941 Other capital charges (49) (128) (207)
Net cash inflow from investing activities 35,574 52,869 20,805
Dividends paid (3,203) (2,723) (4,645)Net drawn down/(repayment) of bank loans 10,341 (27,820) (20,585)Expenses incurred due to stock split — (16) (16)
Net cash inflow/(outflow) from financing activities 7,138 (30,559) (25,246)
Increase/(decrease) in cash and cash equivalents 45,939 25,751 (2,813)
Cash and cash equivalents at start of year 11,292 15,437 15,437 Exchange movements 336 (1,040) (1,332)Cash and cash equivalents at end of year 57,567 40,148 11,292
Increase/(decrease) in cash and cash equivalents 45,939 25,751 (2,813)
Cash and cash equivalents consist of:Cash and short term deposits 16,081 8,792 1,300 Cash equivalents (including liquidity funds) at
fair value through profit or loss 41,486 31,356 9,992
57,567 40,148 11,292
Financial Statements continued
STATEMENT OF CASH FLOWS FOR THE SIX MONTHS ENDED 30TH SEPTEMBER 2015

15
1. Financial statementsThe information contained within the financial statements in this half year report has not been audited or reviewed by theCompany’s auditors.
The figures and financial information for the year ended 31st March 2015 are extracted from the latest published financialstatements of the Company and do not constitute statutory financial statements for that year. Those financial statements have beendelivered to the Registrar of Companies and included the report of the auditors which was unqualified and did not containa statement under either Section 498(2) or 498(3) of the Companies Act 2006.
2. Accounting policiesThe financial statements have been prepared in accordance with the Companies Act 2006, FRS 102 ‘The Financial ReportingStandard applicable in the UK and Republic of Ireland’ of the United Kingdom Generally Accepted Accounting Practice (‘UK GAAP’)and with the Statement of Recommended Practice ‘Financial Statements of Investment Trust Companies and Venture Capital Trusts’(the revised ‘SORP’) issued by the Association of Investment Companies in November 2014.
FRS 104, ‘Interim Financial Reporting’, issued by the Financial Reporting Council (‘FRC’) in March 2015 has been applied in preparingthis condensed set of financial statements for the six months ended 30th September 2015.
As a result of the first time adoption of FRS 102 and the revised SORP, comparative numbers and presentational formats have beenrestated where required.
All of the Company’s operations are of a continuing nature.
The accounting policies applied to this condensed set of financial statements are consistent with those applied in the financialstatements for the year ended 31st March 2015 with the following exceptions and amendments:
Finance costsFinance costs are accounted for on an accruals basis using the effective interest method and in accordance with the provisions ofFRS 102.
Financial instrumentsCash and cash equivalents may comprise cash (including demand deposits which are readily convertible to a known amount of cashand are subject to an insignificant risk of change in value) as well as cash equivalents.
Derivative financial instruments, including short term forward currency contracts, are valued at fair value, which is the netunrealised gain or loss, and are included in current assets or current liabilities in the statement of financial position in accordancewith FRS 102.
Foreign currencyIn accordance with FRS 102 the Company is required to identify its functional currency, being the currency of the primary economicenvironment in which the Company operates. The Board, having regard to the currency of the Company’s share capital and thepredominant currency in which its shareholders operate, has determined that sterling is the functional currency. Sterling is also thecurrency in which the accounts are presented.
TaxationCurrent tax is provided at the amounts expected to be received or paid.
Repurchase of ordinary shares for cancellationThe cost of repurchasing ordinary shares including the related stamp duty and transactions costs is charged to ‘Capital reserves’ anddealt with in the Statement of Changes in Equity. Share repurchase transactions are accounted for on a trade date basis. Thenominal value of ordinary share capital repurchased and cancelled is transferred out of ‘Called up share capital’ and into ‘Capitalredemption reserve’.
NOTES TO THE FINANCIAL STATEMENTS FOR THE SIX MONTHS ENDED 30TH SEPTEMBER 2015

16 JPMORGAN EUROPEAN SMALLER COMPANIES TRUST PLC HALF YEAR REPORT & ACCOUNTS 2015
2. Accounting policies CONTINUEDDividends payableIn accordance with FRS 102 the final dividend is included in the financial statements in the year in which it is approved byshareholders.
Only the relevant section of the applicable policies from the last year end accounts which have changed as a result of the application ofthe 2014 AIC SORP and FRS 102 have been reproduced above – all other aspects of those policies remain the same. The impact of thechanges is substantially in relation to presentational, disclosure and non-quantifiable aspects.
3. Dividends1
(Unaudited) (Unaudited) (Audited)Six months ended Six months ended Year ended
30th September 2015 30th September 2014 31st March 2015£’000 £’000 £’000
Final dividend in respect of the year ended 31st March 2015 of 2.0p (2014: 1.7p) 3,203 2,723 2,723
Interim dividend in respect of the year ended31st March 2015 of 1.2p — — 1,922
Total dividends paid in the period/year 3,203 2,723 4,645
1 All dividends paid and declared in the period have been funded from the Revenue Reserve.
An interim dividend of 1.2p (2014: 1.2p) has been declared in respect of the six months ended 30th September 2015, amounting to£1,922,000.
4. Return/(loss) per share
(Unaudited) (Unaudited) (Audited)Six months ended Six months ended Year ended
30th September 2015 30th September 2014 31st March 2015£’000 £’000 £’000
Return/(loss) per share is based on the following:Revenue return 5,956 5,682 5,519Capital return/(loss) 4,228 (77,026) (4,624)
Total return/(loss) 10,184 (71,344) 895
Weighted average number of shares in issue 160,147,885 160,147,885 160,147,885Revenue return per share 3.72p 3.55p 3.45pCapital return/(loss) per share 2.64p (48.10)p (2.89)p
Total return/(loss) per share 6.36p (44.55)p 0.56p
5. Net asset value per shareThe net asset value per share is calculated by dividing shareholders’ funds of £436,708,000 (30th September 2014: £359,410,000and 31st March 2015: £429,727,000) by the number of shares in issue at 30th September 2015 of 160,147,885 (30th September 2014:160,147,885 and 31st March 2015: 160,147,885).
Financial Statements continued
NOTES TO THE FINANCIAL STATEMENTS CONTINUED

17
6. Reconciliation of total return/(loss) on ordinary activities before finance costs and taxation to net cashinflow from operating activities
(Unaudited) (Unaudited) (Audited)Six months ended Six months ended Year ended
30th September 2015 30th September 2014 31st March 2015£’000 £’000 £’000
Net return/(loss) on ordinary activities before finance costs and taxation 10,944 (70,010) 2,608
(Net capital return)/net capital loss on ordinary activities before finance costs and taxation (4,512) 76,618 3,948
Scrip dividends received as income (888) — —Decrease/(increase) in accrued income 94 (56) (138)Decrease/(increase) in other debtors 13 10 (2)Decrease in accrued expenses (22) (36) (11)Overseas withholding tax (605) (1,103) (1,204)Management fee charged to capital (1,512) (1,625) (3,117)
Net cash inflow from operating activities 3,512 3,798 2,084
7. Fair valuation of investmentsThe fair value hierarchy analysis for investments held at fair value at the period end is as follows:
(Unaudited) (Unaudited) (Audited)Six months ended Six months ended Year ended
30th September 2015 30th September 2014 31st March 2015Assets Liabilities Assets Liabilities Assets Liabilities£’000 £’000 £’000 £’000 £’000 £’000
Quoted prices for identical instruments in active markets 438,479 — 350,686 — 465,221 —
Prices of recent transactions for identical instruments1 41,486 — 31,356 — 9,992 —
Valuation techniques using observable market value2 — (3) — (18) — —
Total value of investments 479,965 (3) 382,042 (18) 475,213 —
1 Includes JPMorgan Euro Liquidity Fund.2 Includes forward foreign currency contracts.

18 JPMORGAN EUROPEAN SMALLER COMPANIES TRUST PLC HALF YEAR REPORT & ACCOUNTS 2015
The Company is required to make the following disclosures in its halfyear report:
Principal Risks and Uncertainties The principal risks and uncertainties faced by the Company have notchanged and fall into the following broad categories: investment andstrategy; market; accounting, legal and regulatory; corporategovernance and shareholder relations; operational going concernand financial. Information on each of these areas is given in theBusiness Review within the Annual Report and Accounts for the yearended 31st March 2015.
Related Party Transactions During the first six months of the current financial year, notransactions with related parties have taken place which havematerially affected the financial position or the performance of theCompany.
Going ConcernThe Directors believe, having considered the Company’s investmentobjectives, risk management policies, capital management policiesand procedures, nature of the portfolio and expenditure projections,that the Company has adequate resources, an appropriate financialstructure and suitable management arrangements in place tocontinue in operational existence for the foreseeable future and,more specifically, that there are no material uncertainties pertainingto the Company that would prevent its ability to continue in suchoperation existence for at least twelve months from the date of theapproval of this half yearly financial report. For these reasons, theyconsider there is reasonable evidence to continue to adopt the goingconcern basis in preparing the accounts.
Directors’ Responsibilities The Board of Directors confirms that, to the best of its knowledge:
(i) the condensed set of financial statements contained withinthe half yearly financial report has been prepared inaccordance with FRS 104 ‘Interim Financial Reports’ and givesa true and fair view of the state of affairs of the Company andof the assets, liabilities, financial position and net return ofthe Company, as at 30th September 2015, as required by theUK Listing Authority Disclosure and Transparency Rules4.2.4R; and
(ii) the interim management report includes a fair review of theinformation required by 4.2.7R and 4.2.8R of the UK ListingAuthority Disclosure and Transparency Rules.
In order to provide these confirmations, and in preparing thesefinancial statements, the Directors are required to:
• select suitable accounting policies and then apply themconsistently;
• make judgements and accounting estimates that arereasonable and prudent;
• state whether applicable UK Accounting Standards have beenfollowed, subject to any material departures disclosed andexplained in the financial statements; and
• prepare the financial statements on the going concern basisunless it is inappropriate to presume that the Company willcontinue in business;
and the Directors confirm that they have done so.
For and on behalf of the BoardCarolan DobsonChairman 23rd November 2015
INTERIM MANAGEMENT REPORT
Financial Statements continued

19
Share Price ReturnTotal return to the investor on a mid-market price to mid-marketprice basis, assuming that all dividends received were reinvested,without transaction costs, into the shares of the Company at thetime the shares were quoted ex-dividend.
Net Asset Value ReturnTotal return on net asset value (‘NAV’) per share, on a bid value tobid value basis, assuming that all dividends paid out by the Companywere reinvested, without transaction costs, into the shares of theCompany at the NAV per share at the time the shares were quotedex-dividend.
In accordance with industry practice, dividends payable which havebeen declared but which are unpaid at the balance sheet date arededucted from the NAV when calculating the total return on netassets.
Benchmark Return Total return on the benchmark, on a mid-market value tomid-market value basis, assuming that all dividends receivedwere reinvested, without transaction costs, into the shares ofthe underlying companies at the time the shares were quotedex-dividend.
The benchmark is a recognised index of stocks which should not betaken as wholly representative of the Company’s investmentuniverse. The Company’s investment strategy does not ‘track’ this
index and consequently, there may be some divergence between theCompany’s performance and that of the benchmark.
Gearing/(Net Cash)Gearing represents the excess amount above shareholders’ funds oftotal assets expressed as a percentage of the shareholders’ funds.Total assets include total investments and net currentassets/liabilities less cash/cash equivalents and excluding bankloans of less than one year. If the amount calculated is negative, thisis shown as a ‘net cash’ position.
Share Price Discount/Premium to Net Asset Value(‘NAV’) Per Share If the share price of an investment trust company is lower than theNAV per share, the shares are said to be trading at a discount. Thediscount is shown as a percentage of the NAV per share. Theopposite of a discount is a premium. It is more common for aninvestment trust’s company’s shares to trade at a discount than ata premium.
Ongoing ChargesEstimated annualised management fee and all other operatingexpenses, excluding finance costs, expressed as a percentage of theaverage of the daily net assets during the period. Ongoing Chargesare calculated in accordance with guidance issued by theAssociation of Investment Companies in May 2012.
Fraudsters use persuasive and high-pressure tactics to lure investors into scams. They may offer to sell shares that turn out to beworthless or non-existent, or to buy shares at an inflated price in return for an upfront payment. While high profits are promised, ifyou buy or sell shares in this way you will probably lose your money.
Keep in mind that firms authorised by the FCAare unlikely to contact you out of the blue withan offer to buy or sell shares.
Do not get into a conversation, note the nameof the person and firm contacting you and thenend the call.
Check the Financial Services Register fromwww.fca.org.uk to see if the person and firmcontacting you is authorised by the FCA.
Beware of fraudsters claiming to be from anauthorised firm, copying its website or givingyou false contact details.
Use the firm’s contact details listed on theRegister if you want to call it back.
Call the FCA on 0800 111 6768 if the firm doesnot have contact details on the Register or youare told they are out of date.
Search the list of unauthorised firms to avoid atwww.fca.org.uk/scams.
Consider that if you buy or sell shares from anunauthorised firm you will not have access to theFinancial Ombudsman Service or FinancialServices Compensation Scheme.
Think about getting independent financial andprofessional advice before you hand over anymoney.
Remember: if it sounds too good to be true, itprobably is!
If you are approached by fraudsters please tell theFCA using the share fraud reporting form atwww.fca.org.uk/scams, where you can find outmore about investment scams.
You can also call the FCA Consumer Helpline on0800 111 6768.
If you have already paid money to share fraudstersyou should contact Action Fraud on 0300 123 2040.
5,000 people contact the Financial ConductAuthority about share fraud each year,with victims losing an average of £20,000
1 6
7
8
9
10
2
3
4
5
Beware of share fraud
How to avoid share fraud
Report a scam
In association with:
Financial Conduct Authority
Shareholder Information
GLOSSARY OF TERMS AND DEFINITIONS

20 JPMORGAN EUROPEAN SMALLER COMPANIES TRUST PLC HALF YEAR REPORT & ACCOUNTS 2015
Savings PlanThe Company participates in the J.P. Morgan Investment TrustsSavings Plan, which facilitates both regular monthly investments andoccasional lump sum investments in the Company’s ordinary shares.Shareholders who would like information on the Savings Plan shouldcall J.P. Morgan Asset Management free on 0800 20 40 20 or visitits website at am.jpmorgan.co.uk
Stocks & Shares Individual Savings Accounts (ISA)The Company’s shares are eligible investments within J.P. Morgan’sStocks & Shares ISA. For the 2015/16 tax year, from 6th April 2015and ending 5th April 2016, the total ISA allowance is £15,240.Details are available from J.P. Morgan Asset Management freeon 0800 20 40 20 or via its website at am.jpmorgan.co.uk
There are a number of ways that you can buy shares in investmenttrust companies; you can invest through J.P. Morgan Online or onthe following:
Fund supermarkets:
Alternatively you can invest through an Investment Professional(e.g. a Financial Adviser) on the following 3rd party platforms:
Ascentric Nucleus Avalon Praemium Axa Elevate TransactNovia
Please note that these websites are third party websites andJ.P. Morgan Asset Management does not endorse or recommend anyof them. This list is not exhaustive and is subject to change. Pleaseobserve each site’s privacy and cookie policies as well as theirplatform charges structure.
You can also buy investment trusts through stockbrokers, wealthmanagers and banks.
To familiarise yourself with the Financial Conduct Authority (‘FCA’)adviser charging and commission rules, visit www.fca.org.uk
AJ BellAlliance TrustBarclays StockbrokersCharles Stanley DirectHalifax Share Dealing ServiceHargreaves Lansdown Interactive Investor
James Brearley James HaySelftradeTD DirectThe Share Centre Tilney BestinvestTransact
Shareholder Information continued
WHERE TO BUY J.P. MORGAN INVESTMENT TRUSTS

HistoryOn 24th April 1990, the Company acquired the undertaking and assets of FlemingEuropean Fledgeling Fund Limited (the ‘Fund’) in exchange for the issue of itsshares and warrants. The Fund was an open-ended, unquoted investmentcompany based in Jersey and formed in June 1987 with the same objectives andinvestment policies as the Company. The Company adopted its present name inJuly 2010.
DirectorsCarolan Dobson (Chairman) Ashok GuptaFederico Marescotti Nicholas SmithStephen White
Company NumbersCompany registration number: 2431143 London Stock Exchange number: 0341969 ISIN: GB00BMTS0Z37 Bloomberg code: JESC LN
Market InformationThe Company’s net asset value (‘NAV’) per share is published daily, via theLondon Stock Exchange. The Company’s shares are listed on the London StockExchange. The market price is shown daily in the Financial Times, The Times,The Daily Telegraph, The Scotsman and on the Company’s website atwww.jpmeuropeansmallercompanies.co.uk, where the share price isupdated every fifteen minutes during trading hours.
Share TransactionsThe Company’s shares may be dealt in directly through a stockbroker or professionaladviser acting on an investor’s behalf. They may also be purchased and held throughthe J.P. Morgan Investment Account and J.P. Morgan ISA. These products are allavailable on the online service at www.jpmorgan.co.uk/online
Manager and Company SecretaryJPMorgan Funds Limited
Company’s Registered Office60 Victoria EmbankmentLondon EC4Y 0JPTelephone: 020 7742 4000
For company secretarial issues and administrative matters, please contactJonathan Latter.
Depositary BNY Mellon Trust and Depositary (UK) LimitedBNY Mellon Centre160 Queen Victoria StreetLondon EC4V 4LA
The Depositary has appointed JPMorgan Chase Bank, N.A. as the Company’scustodian.
RegistrarsEquiniti LimitedReference 1083Aspect HouseSpencer RoadLancingWest Sussex BN99 6DATelephone number: 0371 384 2325
Lines open 8.30 a.m. to 5.30 p.m. Monday to Friday. Calls to the helpline will costno more than a national rate call to a 01 or 02 number. Callers from overseasshould dial +44 121 415 0225.
Notifications of changes of address and enquiries regarding share certificates ordividend cheques should be made in writing to the Registrar quoting reference1083.
Registered shareholders can obtain further details on their holdings on theinternet by visiting www.shareview.co.uk
Independent AuditorsPricewaterhouseCoopers LLP Chartered Accountants and Statutory Auditors7 More London RiversideLondon SE1 2RT
BrokersCenkos Securities plc 6.7.8 Tokenhouse Yard London EC2R 7AS
Savings Product AdministratorsFor queries on the J.P. Morgan Investment Account and J.P. Morgan ISA,see contact details on the back cover of this report.
Information about the Company
FINANCIAL CALENDAR
Financial year end 31st March
Final results announced May/June
Half year end 30th September
Half year results announced November
Annual General Meeting July
Dividend July
A member of the AIC

www.jpmeuropeansmallercompanies.co.uk
Telephone calls may be recorded and monitored for security and training purposes.
J.P. Morgan Helpline
Freephone 0800 20 40 20 or +44 (0) 1268 444470.Telephone lines are open Monday to Friday, 9am to 5.30pm.
GB I112 11/15