Next Plc JPMorgan 24.4.2012
52
www.morganmarkets.com Europe Equity Research 24 April 2012 Next Plc Underweight NXT.L, NXT LN Where next? ▲ Price: 2,999p Price Target: 2,039p Previous: 1,948p European Retail Gillian Hilditch, CFA AC (44-20) 7155-6140 [email protected] Georgina Johanan (44-20) 7155 6157 [email protected] Helena C Sykes (44-20) 7742 0932 [email protected] J.P. Morgan Securities Ltd. For Specialist Sales advice, please contact Sophie L Warrick (44-20) 7779-3409 [email protected] YTD 1m 3m 12m Abs 7.3% 0.0% 12.6% 34.7% Rel 4.2% 6.0% 11.2% 41.9% Next Plc (NXT.L;NXT LN) FYE Jan 2011A 2012A 2013E (Prev) 2013E (Curr) 2014E (Prev) 2014E (Curr) Adj. EPS FY (p) 206.43 237.05 244.73 246.44 245.86 247.82 Revenue FY (£ mn) 3,454 3,506 3,371 3,514 3,400 3,541 Adj EBITDA FY (£ mn) 703 727 712 735 696 716 Pretax Profit Adjusted FY (£ mn) 551 570 545 561 526 542 DPS (Net) FY (p) 78.00 90.00 90.20 99.00 99.22 108.90 EV/EBITDA FY 8.4 8.1 8.4 8.2 8.6 8.4 Adj P/E FY 14.5 12.7 12.4 12.2 12.3 12.1 Net Yield FY 2.6% 3.0% 3.0% 3.3% 3.3% 3.6% EBIT FY (£ mn) 584 607 587 605 570 585 Source: Company data, Bloomberg, J.P. Morgan estimates. Company Data Price (p) 2,999 Date Of Price 23-Apr-12 Price Target (p) 2,039 Price Target End Date 31 May 13 52-week Range (p) 3,073 - 2,108 Mkt Cap (£ bn) 5.8 Shares O/S (mn) 193 See page 50 for analyst certification and important disclosures, including non-US analyst disclosures. J.P. Morgan does and seeks to do business with companies covered in its research reports. As a result, investors should be aware that the firm may have a conflict of interest that could affect the objectivity of this report. Investors should consider this report as only a single factor in making their investment decision. 1,600 2,000 2,400 2,800 3,200 p Apr-11 Jul-11 Oct-11 Jan-12 Apr-12 Price Performance NXT.L share price (p) MSCI-Eu (rebased) We believe Next is likely to experience increasing pressure both on top line and margin in the next few years as online competition grows and the apparel market shifts increasingly to a free delivery model. Slower growth in Directory and continued Retail weakness would weigh on profits as scope to flex costs appears limited and it is not impossible to see a decline of 30% or more in Retail EBIT, which would be negative for sentiment. Next currently sits at a premium to the sector on 12.3x CY12E PER; our 12M TP of 2039p has 33% downside. Brand LFL has been negative over the last 8 yrs. Next’s track record of delivery has been impressive driven by new space and strong Directory growth. However, on a combined Brand basis (Retail and Directory) densities are still down 44% since 2003 and ex new space, Brand “LFL” has declined fairly consistently over the period. Directory is over-penetrated online in our view with an estimated online market share of clothing of c. 14.5% significantly higher than its pure bricks & mortar share of 5.3%. Ability to further flex opex appears limited. With new space and Directory growth set to slow from FY14E onwards, we see risks to estimates, particularly given limited ability to flex Retail costs as Directory slows. Brand opex per sq ft is down 40% in last 9 yrs reflecting staff savings. Free delivery if adopted would cost 18% of group PBT. Directory margin appears to have peaked. Cash customers are c. 8% less profitable and a potential market shift to free delivery could ultimately cost 900bp of Directory margin and up to 18% of group PBT if Next followed suit. Retail downside. There are many moving parts and potential scenarios. Our assessment of the LFL needed in Retail to result in a 30% decline is -1.7% pa over the next five years; whereas to achieve break-even in Retail, LFL sales would need to decline by an avge of 5.5% pa over the period, only 1% worse that the 5 year historic avge (-4.6% pa). Valuation downside. The shares have historically been driven by earnings momentum; if negative this would adversely impact the shares, which are currently at a premium of 11.3% to the retail sector. Our 12M TP of 2039p is based on a blend of our estimates and scenario analysis (weighted towards our forecasts) and implies 33% downside.
-
Upload
maverick227 -
Category
Documents
-
view
108 -
download
1
Transcript of Next Plc JPMorgan 24.4.2012
www.morganmarkets.com
Europe Equity Research24 April 2012
Next PlcUnderweightNXT.L, NXT LN
Where next?▲
Price: 2,999p
Price Target: 2,039pPrevious: 1,948p
European Retail
Gillian Hilditch, CFA AC
(44-20) 7155-6140
Georgina Johanan
(44-20) 7155 6157
Helena C Sykes
(44-20) 7742 0932
J.P. Morgan Securities Ltd.
For Specialist Sales advice, please contact
Sophie L Warrick
(44-20) 7779-3409
YTD 1m 3m 12mAbs 7.3% 0.0% 12.6% 34.7%Rel 4.2% 6.0% 11.2% 41.9%
Next Plc (NXT.L;NXT LN)
FYE Jan 2011A 2012A 2013E(Prev)
2013E(Curr)
2014E(Prev)
2014E(Curr)
Adj. EPS FY (p) 206.43 237.05 244.73 246.44 245.86 247.82Revenue FY (£ mn) 3,454 3,506 3,371 3,514 3,400 3,541Adj EBITDA FY (£ mn) 703 727 712 735 696 716Pretax Profit Adjusted FY (£ mn)
551 570 545 561 526 542
DPS (Net) FY (p) 78.00 90.00 90.20 99.00 99.22 108.90EV/EBITDA FY 8.4 8.1 8.4 8.2 8.6 8.4Adj P/E FY 14.5 12.7 12.4 12.2 12.3 12.1Net Yield FY 2.6% 3.0% 3.0% 3.3% 3.3% 3.6%EBIT FY (£ mn) 584 607 587 605 570 585Source: Company data, Bloomberg, J.P. Morgan estimates.
Company DataPrice (p) 2,999Date Of Price 23-Apr-12Price Target (p) 2,039Price Target End Date 31 May 1352-week Range (p) 3,073 - 2,108Mkt Cap (£ bn) 5.8Shares O/S (mn) 193
See page 50 for analyst certification and important disclosures, including non-US analyst disclosures.J.P. Morgan does and seeks to do business with companies covered in its research reports. As a result, investors should be aware that the firm may have a conflict of interest that could affect the objectivity of this report. Investors should consider this report as only a single factor in making their investment decision.
1,600
2,000
2,400
2,800
3,200
p
Apr-11 Jul-11 Oct-11 Jan-12 Apr-12
Price Performance
NXT.L share price (p)MSCI-Eu (rebased)
We believe Next is likely to experience increasing pressure both on top line and margin in the next few years as online competition grows and the apparel market shifts increasingly to a free delivery model. Slower growth in Directory and continued Retail weakness would weigh on profits as scope to flex costs appears limited and it is not impossible to see a decline of 30% or more in Retail EBIT, which would be negative for sentiment. Next currently sits at a premium to the sector on 12.3x CY12E PER; our 12M TP of 2039p has 33% downside.
Brand LFL has been negative over the last 8 yrs. Next’s track record of delivery has been impressive driven by new space and strong Directory growth. However, on a combined Brand basis (Retail and Directory) densities are still down 44% since 2003 and ex new space, Brand “LFL” has declined fairly consistently over the period. Directory is over-penetrated online in our view with an estimated online market share of clothing of c. 14.5% significantly higher than its pure bricks & mortar share of 5.3%.
Ability to further flex opex appears limited. With new space and Directory growth set to slow from FY14E onwards, we see risks to estimates, particularly given limited ability to flex Retail costs as Directory slows. Brand opex per sq ft is down 40% in last 9 yrs reflecting staff savings.
Free delivery if adopted would cost 18% of group PBT. Directory margin appears to have peaked. Cash customers are c. 8% less profitable and a potential market shift to free delivery could ultimately cost 900bp of Directory margin and up to 18% of group PBT if Next followed suit.
Retail downside. There are many moving parts and potential scenarios. Our assessment of the LFL needed in Retail to result in a 30% decline is -1.7% pa over the next five years; whereas to achieve break-even in Retail, LFL sales would need to decline by an avge of 5.5% pa over the period, only 1% worse that the 5 year historic avge (-4.6% pa).
Valuation downside. The shares have historically been driven by earnings momentum; if negative this would adversely impact the shares, which are currently at a premium of 11.3% to the retail sector. Our 12M TP of 2039p is based on a blend of our estimates and scenario analysis (weighted towards our forecasts) and implies 33% downside.

2
Europe Equity Research24 April 2012
Gillian Hilditch, CFA(44-20) [email protected]
Table of ContentsInvestment thesis .....................................................................3
Summary Points......................................................................................................3
Where Next? .............................................................................6
One Brand, one dream – does it matter where the sales come from?...............................................................................7
Next sales densities fall even on the combined business ...........................................7
Both new space and Directory are key for Brand sales growth..................................8
Directory has been the main driver of sales and profit in the last year .......................9
The switch to offering cash with order has provided a short-term boost …..............10
….., but Next is already over-penetrated online......................................................11
The growth in cash customers encourages cannibalization of the UK store customers.............................................................................................................................13
Overall market share in clothing appears to be stagnant..........................................13
Profit per sq ft has also been falling .......................................................................14
Scope to further cut costs appears limited ..............................................................15
Directory margin could have peaked....................................17
Growth in less profitable cash customers to outpace credit account holders ............17
Move to free delivery could reduce Group PBT by 18%.........................................19
How likely is free delivery?...................................................................................24
Could free delivery grow Next Directory sales? .....................................................25
Outlook for FY13E and beyond .............................................26
FY13E Guidance...................................................................................................26
FY13E assumptions ..............................................................................................27
FY14E assumptions ..............................................................................................28
FY15E assumptions ..............................................................................................28
EBIT margin analysis in more detail......................................................................30
Cash flow and Balance sheet analysis ....................................................................33
Scenario analysis; risks lie to the downside .......................35
P&L cost base has little opportunity for incremental flex .......................................35
Retail break-even scenario.....................................................................................37
Alternative Retail downside scenario.....................................................................38
Valuation .................................................................................40
ROICs...................................................................................................................40
Share price versus earnings revisions.....................................................................40
Valuation versus peers...........................................................................................44
Appendix – online clothing growth.......................................45
Online clothing growth has outperformed the rest of online…................................45
Valuation Methodology and Risks ........................................47

3
Europe Equity Research24 April 2012
Gillian Hilditch, CFA(44-20) [email protected]
Investment thesis
Summary Points
Next’s track record of delivery throughout the downturn has been impressive; reflected in the share price outperformance.
EPS 4 year CAGR +9.2% between 2008 and 2012.
Shares +39% in 2011, an outperformance of 50% vs. the sector.
Growth has been driven by safe haven status and strong performance in Directory
Directory performance reflects structural growth in the market BUT as a first mover Next’s is over penetrated online and looks set to lose share going forward.
Next has a 14.5% share of the online clothing market, significantly higher than its 5.3% share of the bricks and mortar market. Risk of a loss in share is weighted to the downside.
New Space and Directory are key for Brand sales growth.
The average growth in Brand sales over the past 5 years has been +1.6% pa despite an average space contribution of +3% and an average contribution from Directory of +2% to total Brand growth.
Cash customers have been a key driver of Directory Growth.
Of 9.7% growth in active customers in FY12 (to Jan), 6.3% came from the increase in cash customers.
BUT has tempted those “hold-out” Next Retail customers who did not like having to order on credit and is therefore encouraging cannibalization of store customers.
Figure 1: Next vs. FTSE 350 General Retailers Relative Performance
Source: Bloomberg
Figure 2: Next Active Customers vs. ASOS Active Customers
Figure 3: Brand sales growth yoy % less weighted space contribution
Source: Company Data, JPMC estimates
Figure 4: Cash with Order Customers vs. Credit Customer
Source: Company Data, JPMC estimates
0.9
1.1
1.3
1.5
1.7
1.9
Jan 11
Feb 11
Mar 11
Apr 11
May 11
Jun 11
Jul 11
Aug 11
Sep 11
Oct 11
Nov 11
Dec 11
Next:FTSE 350 General Retailers Relative
-4.0%
-2.0%
0.0%
2.0%
4.0%
6.0%
8.0%
10.0%
2002 2003 2004 2005 2006 2007 2008 2009 2010 2011 2012
Brand sales growth less weighted space contribution

4
Europe Equity Research24 April 2012
Gillian Hilditch, CFA(44-20) [email protected]
Directory margin could have also peaked.
Free delivery becoming increasingly prevalent.
Growth in less profitable cash customers/ increasing international mix (we estimate that account customers are at least 8% more profitable on average).
Increasing international mix (margin on international customers c.350bps below UK customers).
Free Delivery could impact the Directory margin by 900 bps and reduce Group PBT by 18%.
Moving to free delivery would mean that Next loses £3.99 of income generated from customer delivery charges on an estimated 15m parcels pa at present -generating a one time hit of £59m.
Combined with likely increased average order frequency and an incremental channel shift this equates to lost margin of c.900bps (over a 2-3 year timeframe). This compares to the cost to Asos of 1300bps from a shift to free shipping (although it has a greater proportion of international sales which will be more expensive).
Next’s sales densities have been falling even on a combined basis.
Combined (i.e. Retail & Directory) sales densities have fallen by 44% from a peak of £953 per sq ft in 2003 to £533 in 2012.
We estimate cumulative underlying Brand LFL decline of -7.7% over the 8 years to 2012.
Cost cutting is important to mitigate this pressure; scope to further cut costs appears limited.
Management has achieved aggressive efficiencies in underlying costs. Per sq ft Brand opex has fallen by 40% in the 9 years to 2012 and Brand FTE’s have halved to 4.1, which is lower than most peers.
Figure 5: Service Income
Source: Company Data, JPMC estimates
Table 1: Potential Impact on Group PBT if Current Paid For Deliveries Were Free
Source: JPMC estimates
Figure 6: Combined Brand Sales Densities
Source: Company Data, JPMC estimates
Figure 7: Next Brand Employees per '000 sq ft
Source: Company Data
Directory sales inc VAT and grossed up for returns £2160m
Collected in store (inc VAT) £432m 20%
Delivered by courier £1728m 80%
Sales delivered by courier with free delivery £259m 15%
Sales where delivery charge paid by the customer £1469m 85%
Directory customers (m) 3.0
Average spend per customer pa £721
Average order value £100
Implied average order frequency pa 7x
Implied no. of parcels (m) pa - total 22
Implied no. of parcels (m) pa - delivery paid by customer 15
Standard delivery charge £3.99
Current income generated from customer delivery charge £59m
0.0%
5.0%
10.0%
15.0%
20.0%
25.0%
30.0%
35.0%
0
200
400
600
800
1000
1200
1996
1997
1998
1999
2000
2001
2002
2003
2004
2005
2006
2007
2008
2009
2010
2011
2012
2013
E
2014
E
Combined sales density £ sq ft (LHS) Space growth yoy % chge (RHS)
0
1
2
3
4
5
6
7
8
9
2001 2002 2003 2004 2005 2006 2007 2008 2009 2010 2011
Next Brand employees per 000 sq ft

5
Europe Equity Research24 April 2012
Gillian Hilditch, CFA(44-20) [email protected]
Our scenario analysis gives a range of outcomes; risks lie to the downside.
Worst case scenario; to reach the tipping point into Retail loss, Next LFL Retail sales would need to fall by 5.5% on average over 5 years.
A 30% fall in Retail EBIT would result if LFL Retail sales declined by only -1.7% on average over 5 years.
PBT expected to fall by 3% pa over the next 3 years
This includes a fall of -1.6% in FY13E, towards the bottom of management’s guidance range (-2% to +7%).
3-year EPS CAGR (including the buyback) +1.6% (FY13E +4.0%)
Valuation; Next is the most expensive stock within the peer group.
Premium rating (CY12E PER of 12.3x) and PEG of 4.4x.
Discounted profit model returns a value of £16.76 per share.
Price target updated to 2039p based on a blend of scenarios.
Table 2: Scenario Summary Table
Retail LFL 5yr avrg
Brand Sales 5yr
CAGRPBT 5yr
CAGR
Base Case 0.2% 5.3% 6.8%Alternative Downside -1.7% 1.7% 0.0%Worst Case -5.5% 0.6% -6.7%
Source: JPMC Estimates.
Figure 8: JPMC annual growth rate estimates.
Source: JPMC Estimates, Bloomberg
Figure 9: EPS CAGR CY11-13 vs. CY12 P/E
Source: Bloomberg, JPMC ests
Table 3: Probability weighted discounted economic profit
Implied value Probability
BBG base case 32.87 20%
Retail break even 14.67 15%
30% downside in Retail 21.57 15%
JPMC base case 16.76 50%
Implied equal weighted implied value (p) 20.39
Source: J.P. Morgan estimates, Company data.
-8.0%
-6.0%
-4.0%
-2.0%
0.0%
2.0%
4.0%
6.0%
Retail LFL (avrg) Brand LFL (avrg) PBT (CAGR)
2008-2012 2013-2015
Home Retail
Kingfisher
M&S
Next
Inchcape
Debenhams
Dunelm
Howdens
Halfords
Kesa
Mothercare
WH Smith
Dixons
H&M
Inditex
R² = 0.4368
-40%
-30%
-20%
-10%
0%
10%
20%
30%
5x 10x 15x 20x 25x 30x 35x 40x
EP
S C
AG
R C
Y1
1-1
3
P/E CY12
Asos PER 33.7x

6
Europe Equity Research24 April 2012
Gillian Hilditch, CFA(44-20) [email protected]
Where Next?
Top performance in 2011 driven by safe haven status and Directory enthusiasm
Next was the best performing stock in UK General Retail in 2011. The shares rose by 36% on an absolute basis and 49% on a relative basis as investors chose to back the security of a well regarded management team and a share buyback programme over the uncertainties of self help programmes or macro recovery stories elsewhere in the sector. However, it was not just about looking for a safe haven. Investor enthusiasm also appeared to be stimulated by the strong growth delivered by the Directory business and Directory's potential to offset the moribund Retail business and perhaps even deliver a “growth” angle for what had hitherto seemed at best to be a stable story.
However, it seems that this enthusiasm has been carried forward into the current year with estimates and the valuation implying that Directory can continue to perform at this high rate of growth and offset the impact of a deteriorating Retail business indefinitely. We disagree with such a view for a number of reasons
Firstly, Next argues frequently that given the cannibalization of the Retail business by Directory, we should look at the business as one combined entity: Next Brand. However, when we do so, we can see that the metrics still look less than appealing
Secondly, we believe that Directory growth has been driven by several one-off factors in the last couple of years and that Next’s first mover online advantage leaves it little room to manouevre as competition online increases, especially given it is already over-penetrated online.
Thirdly and importantly, we believe that Directory margin has peaked and that looking forward there are a number of pressures on margin including but not limited to negative mix effects from growth in cash customers and the potential introduction of free delivery.
Fourthly, we believe that this view ignores the pressures being placed upon the retail business, where management's scope to further reduce costs in our view looks to be limited.
In this note we aim to examine what we consider to be the main pressure points within the Next business, looking at the business on both a combined Brand basis as well as breaking the P&L down into its component parts to examine its ability to flex to meet a lower sales environment.

7
Europe Equity Research24 April 2012
Gillian Hilditch, CFA(44-20) [email protected]
One Brand, one dream – does it matter where the sales come from?
The positive argument in favour of investing in Next’s shares is based on the theory that it does not matter where the sales come from provided combined Brand sales are growing. However, our take is that such a view ignores several key factors:
Growth in the combined Brand sales (ie Retail + Directory) has been driven by new space growth and ex this new space, Brand sales have been falling on a “LFL” basis
Sales densities for the combined business have been falling consistently over time
Directory has been the main driver of group sales and profitability in recent years and has been cannibalizing the retail business
The more recent sales growth in Directory has been coming from cash customers, who are less profitable and who have come, we believe, from the Retail business
The two different channels, Retail and Directory have different cost structures, even though there is some cross-subsidisation of, for example, returns
Brand EBIT per sq ft has fallen by 29% over the last decade despite the substantial improvement Next has delivered in gross margins
Opex as a % of sales (for the combined business) has risen by 450bp over the last 10 years, despite considerable efforts by management to trim costs
A persistent decline in sales densities in Retail will eventually lead to a tipping point in terms of the fixed cost base of the Retail business leading to declines in Retail profit
Next sales densities fall even on the combined business
While we accept management’s argument that the two businesses should be examined as one entity and indeed that is how we look at multi-channel businessesfor other retailers, we equally believe that we cannot ignore the strains on store metrics of a falling sales base. This is discussed in more depth later in this report, but first examining the combined businesses as one, we see that perhaps, contrary to commonly held belief, the combined sales densities for Next Retail and Directory have been falling since 2003 (Figure 10) ie the growth in Directory is not outweighing the decline in Retail on a square footage basis. We estimate that the cumulative LFL decline in Brand sales has been -7.7% over the 8 years to 2012.
Brand sales densities (Next Retail and Next Directory
combined) have fallen by 44%
from their peak in 2003

8
Europe Equity Research24 April 2012
Gillian Hilditch, CFA(44-20) [email protected]
Figure 10: Next Brand sales densities
£ sq ft
Source: J.P. Morgan estimates, Company data.
Both new space and Directory are key for Brand sales growth
Part of the decline in sales densities can be attributed to the decision by Next to open larger space stores, which do dilute density and also to the decision to roll out Home stores which also generate lower sales densities, but this does not explain the entirety of the reduction as even as space growth has slowed, densities have continued to fall (Figure 11).
Figure 11: Space change vs change in combined sales density
Source: J.P. Morgan estimates, Company data.
0
200
400
600
800
1000
1200
Combined sales density £ sq ft
-15.0%
-10.0%
-5.0%
0.0%
5.0%
10.0%
15.0%
20.0%
25.0%
30.0%
35.0%
1996
1997
1998
1999
2000
2001
2002
2003
2004
2005
2006
2007
2008
2009
2010
2011
2012
2013
E
2014
E
Space growth Change in combined sales density

9
Europe Equity Research24 April 2012
Gillian Hilditch, CFA(44-20) [email protected]
Figure 12: Next Brand sales and %ge chge yoy
Source: J.P. Morgan estimates, Company data.
Figure 12 looks at the absolute sales within Next Brand and the rate of growth being delivered and we can see that growth has decreased dramatically since 2002. The average growth in Brand sales over the last five years has been 2% pa despite the addition of 6.6% average new space per annum and growth in Directory. From this, we can see that, despite the headline grabbing growth in Directory, new space has been crucial for the growth of the Next Brand (Figure 13). Without it, sales would have been negative for the combined group in five of the last six years.
Figure 13: Brand sales growth yoy % less weighted space contribution
Source: J.P. Morgan estimates, Company data.
Directory has been the main driver of sales and profit in the last year
Next’s Directory business has grown its sales by 12.4% pa over the comparable period and with c. 80% online penetration of the Directory sales base, we estimate that its fate is inexorably tied to that of the online clothing market. Growth in Directory in the past has been fuelled by two principal factors: an increase in the number of active customers and an increase in the number of pages.
The average spend per customer is also a key factor, but as Figure 14 illustrates has fluctuated considerably over the last decade or so, tending to reflect the economic environment. For instance, it became negative in both 2005 and 2010/2011 as consumers retrenched in a more difficult environment.
0.0%
5.0%
10.0%
15.0%
20.0%
25.0%
0
500
1000
1500
2000
2500
3000
3500
4000
2002
2003
2004
2005
2006
2007
2008
2009
2010
2011
2012
Brand sales £m (LHS) y oy chge in Brand sales (%) (RHS)
-4.0%
-2.0%
0.0%
2.0%
4.0%
6.0%
8.0%
10.0%
2002 2003 2004 2005 2006 2007 2008 2009 2010 2011 2012
Brand sales growth less weighted space contribution
Ex new space we estimate that
the Brand has delivered a
cumulative LFL decline of 7.7% over the last 8 years
c. 80% of Directory’s sales are now online; most levers for
growth appear fully utilised
10
Europe Equity Research24 April 2012
Gillian Hilditch, CFA(44-20) [email protected]
Figure 14: Next Directory
Source: J.P. Morgan estimates, Company data.
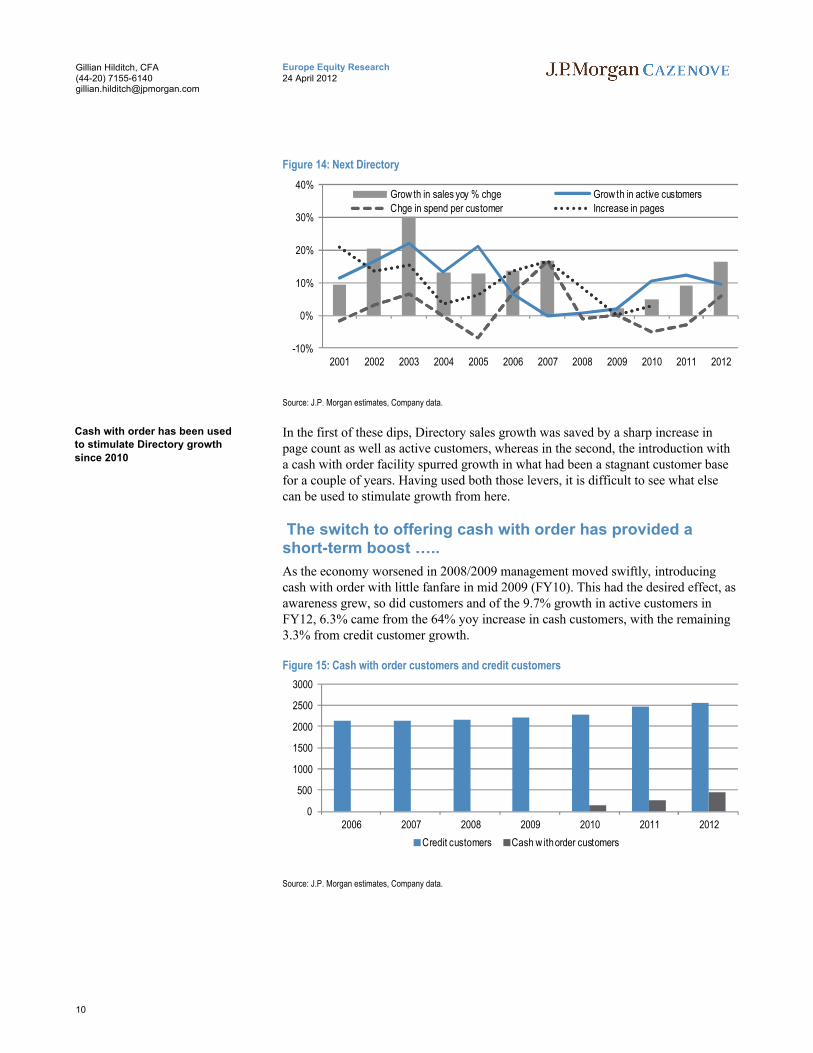
In the first of these dips, Directory sales growth was saved by a sharp increase in page count as well as active customers, whereas in the second, the introduction with a cash with order facility spurred growth in what had been a stagnant customer base for a couple of years. Having used both those levers, it is difficult to see what else can be used to stimulate growth from here.
The switch to offering cash with order has provided a short-term boost …..
As the economy worsened in 2008/2009 management moved swiftly, introducing cash with order with little fanfare in mid 2009 (FY10). This had the desired effect, as awareness grew, so did customers and of the 9.7% growth in active customers in FY12, 6.3% came from the 64% yoy increase in cash customers, with the remaining 3.3% from credit customer growth.
Figure 15: Cash with order customers and credit customers
Source: J.P. Morgan estimates, Company data.
-10%
0%
10%
20%
30%
40%
2001 2002 2003 2004 2005 2006 2007 2008 2009 2010 2011 2012
Grow th in sales yoy % chge Grow th in active customers
Chge in spend per customer Increase in pages
0
500
1000
1500
2000
2500
3000
2006 2007 2008 2009 2010 2011 2012
Credit customers Cash w ith order customers
Cash with order has been used to stimulate Directory growth
since 2010

11
Europe Equity Research24 April 2012
Gillian Hilditch, CFA(44-20) [email protected]
….., but Next is already over-penetrated online
Our analysis suggests that Next’s share of online clothing is unsurprisingly higher than it is in the overall clothing market. This reflects its early entry into this market with an incumbent high customer base through Directory. This market share has been declining as new entrants expand online.
Over time as all its main competitors build their online offering, we believe Next’s online share should trend towards the market share level it achieves of the overall market, especially once we bear in mind that the level of competition and choice on line will ultimately be greater than that in the physical store base which is naturally limited by geographic boundaries. Next's credit offering could provide some competitive advantage, however, by allowing it to maintain a higher share than it would otherwise, but we think it fair to say that further growth in online share seemsunlikely and the risk of a loss in share is weighted to the downside.
Figure 16 illustrates the growth both in Next's active customer base and in that of Asos over time and demonstrates we believe that Next’s first mover advantage is being eroded as other online retailers grow.
Figure 16: Next Directory Active Customers vs. ASOS
Source: Company Data
Figure 17: Market Share: Directory vs. Retail
Source: J.P. Morgan estimates, Company Data, Verdict
0
500
1,000
1,500
2,000
2,500
3,000
2009 2010 2011
Next '000s ASOS '000s
0%
5%
10%
15%
20%
25%
30%
FY
05
FY
06
FY
07
FY
08
FY
09
FY
10
FY
11
FY
12
Next Directory Next Retail
Next’s market share online is
more than twice that of its bricks
& mortar market share
We believe that Next’s online
share should trend down over
time
12
Europe Equity Research24 April 2012
Gillian Hilditch, CFA(44-20) [email protected]
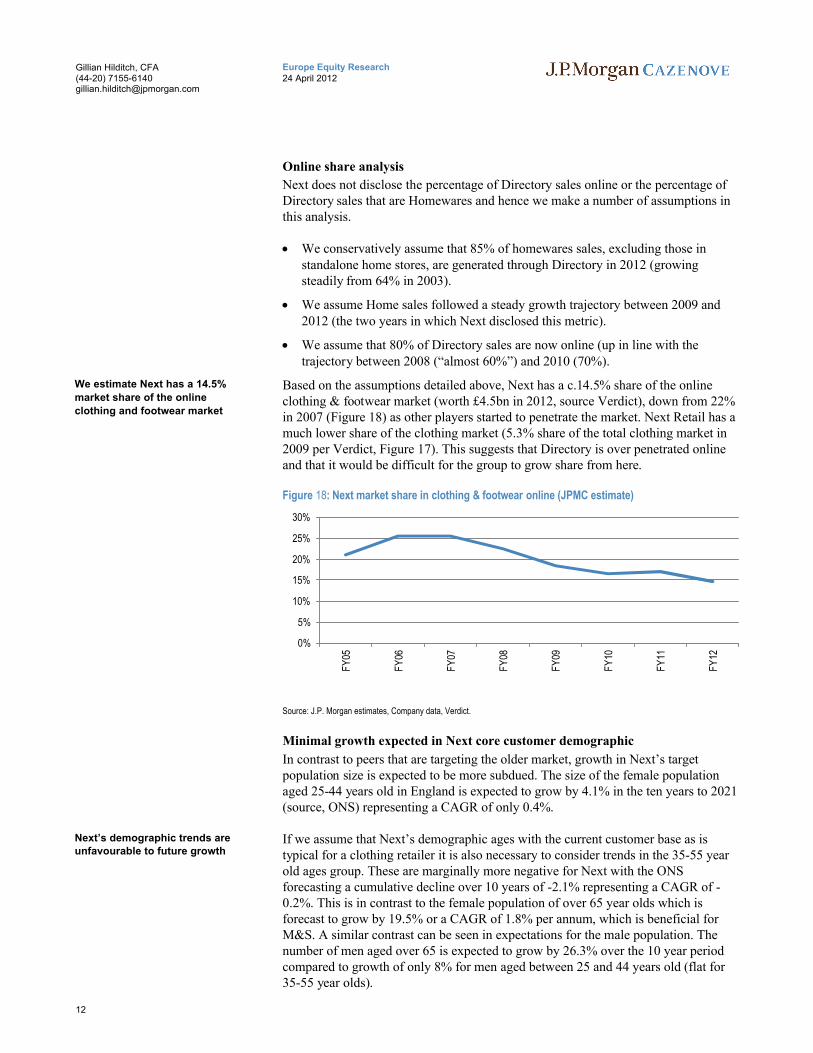
Online share analysis
Next does not disclose the percentage of Directory sales online or the percentage of Directory sales that are Homewares and hence we make a number of assumptions in this analysis.
We conservatively assume that 85% of homewares sales, excluding those in standalone home stores, are generated through Directory in 2012 (growing steadily from 64% in 2003).
We assume Home sales followed a steady growth trajectory between 2009 and 2012 (the two years in which Next disclosed this metric).
We assume that 80% of Directory sales are now online (up in line with the trajectory between 2008 (“almost 60%”) and 2010 (70%).
Based on the assumptions detailed above, Next has a c.14.5% share of the online clothing & footwear market (worth £4.5bn in 2012, source Verdict), down from 22% in 2007 (Figure 18) as other players started to penetrate the market. Next Retail has a much lower share of the clothing market (5.3% share of the total clothing market in 2009 per Verdict, Figure 17). This suggests that Directory is over penetrated online and that it would be difficult for the group to grow share from here.
Figure 18: Next market share in clothing & footwear online (JPMC estimate)
Source: J.P. Morgan estimates, Company data, Verdict.
Minimal growth expected in Next core customer demographic
In contrast to peers that are targeting the older market, growth in Next’s target population size is expected to be more subdued. The size of the female population aged 25-44 years old in England is expected to grow by 4.1% in the ten years to 2021 (source, ONS) representing a CAGR of only 0.4%.
If we assume that Next’s demographic ages with the current customer base as is typical for a clothing retailer it is also necessary to consider trends in the 35-55 yearold ages group. These are marginally more negative for Next with the ONS forecasting a cumulative decline over 10 years of -2.1% representing a CAGR of -0.2%. This is in contrast to the female population of over 65 year olds which is forecast to grow by 19.5% or a CAGR of 1.8% per annum, which is beneficial for M&S. A similar contrast can be seen in expectations for the male population. The number of men aged over 65 is expected to grow by 26.3% over the 10 year period compared to growth of only 8% for men aged between 25 and 44 years old (flat for 35-55 year olds).
0%
5%
10%
15%
20%
25%
30%
FY
05
FY
06
FY
07
FY
08
FY
09
FY
10
FY
11
FY
12
We estimate Next has a 14.5%
market share of the online
clothing and footwear market
Next’s demographic trends are unfavourable to future growth

13
Europe Equity Research24 April 2012
Gillian Hilditch, CFA(44-20) [email protected]
The growth in cash customers encourages cannibalization of the UK store customers
So where, in a difficult consumer market, is this growth in Directory customers coming from? Without access to each customer’s personal details, it is naturally difficult to say definitively, but unsurprisingly our analysis of Next’s online market share and Directory share would seem to suggest that they are primarily coming from the Next Retail store base rather than representing incremental consumers. This is, we believe, undoubtedly the case when we think about the growth in the context both of Next's over-penetration online and of the recent boost provided by the switch to cash with order, which has tempted those "hold-out” Next Retail customers who did not like having to order on credit.
Figure 19: Next Online share change vs Next Directory share change (2009 on 2005)
Source: Verdict
That online is cannibalising store sales is not new news. For some years now the debate in retail has been around the transfer of sales from physical space to online and the impact that could potentially have on store metrics. Nowhere within clothing is that effect more marked than at Next, which has the most developed online business of any of the major apparel players.
Directory now represents 31% of Group sales and is more than half the size of Retail and is cannibalising the store base. Yet investors do not seem to be concerned by this trend, if the share price is any judge, and they have been right not to be over the last few years as the company has maintained profitability in the face of challenging economic conditions. However, we argue that this trend is unsustainable in the longer-term and there will inevitably be a point at which the metrics within the store base will move the wrong way.
Overall market share in clothing appears to be stagnant
We have disaggregated Next Home sales from its overall Brand sales to derive a clothing and footwear number, which we have then divided into the Verdict market value to derive an estimated market share for Next. This clearly is not perfect, but it provides we think a useful guide as to the trend in Next’s market share in recent years ex its growth in Home.
-1.00% -0.50% 0.00% 0.50% 1.00% 1.50% 2.00% 2.50% 3.00%
PrimarkSainsbury
Shop DirectTK Maxx
TescoPeacocksNew Look
AsdaArcadia Group
River IslandN Brown
H&MNext DirectorySports Direct
DebenhamsJohn LewisBonmarche
MatalanHouse of Fraser
Next RetailM&S
Figure 19: illustrates that the growth in Directory between
2005 and 2009 has come at the
expense of Retail

14
Europe Equity Research24 April 2012
Gillian Hilditch, CFA(44-20) [email protected]
Figure 20: Next Market share
Source: J.P. Morgan estimates, Verdict, Company data. Using Next Financial Years
Profit per sq ft has also been fallingUnderlying cost efficiencies have been unable to keep pace with falling sales
Brand sales densities have been falling since 2003, decreasing by 44% in total from £953 to £533 in 2012. This has been partially mitigated by an improving gross margin with COGS falling by 50% on a square foot basis over the period. However, despite aggressive efficiencies in underlying costs, the decline in opex per square foot has been unable to fully keep pace with the Brand LFL sales decline (we estimate -1% on average over the eight years to 2012) resulting in an overall fall in Brand EBIT per square foot of 28% from £130 in 2003 to £93 in 2012. This begs the question as to what happens when sales per square foot approach the point at which profit begins to move backwards. We explore this further in our scenario analysis
Figure 21: Retail EBIT per sq ft
Source: J.P. Morgan estimates Company data.
Figure 22: Next Brand EBIT per sq ft
Source: J.P. Morgan estimates, Company data.
0.0%
2.0%
4.0%
6.0%
8.0%
10.0%
2004 2005 2006 2007 2008 2009 2010 2011
Market Share (sales/ONS mkt value)
0
20
40
60
80
100
120
2002 2003 2004 2005 2006 2007 2008 2009 2010 2011 2012
Retail EBIT per sq ft
0
20
40
60
80
100
120
140
2002 2003 2004 2005 2006 2007 2008 2009 2010 2011 2012
Brand EBIT per sq ft
The decline in sales densities
has been mitigated by strong growth in gross margin. Despite
aggressive reductions in costs,
the decline in opex sq ft has been unable to keep pace

15
Europe Equity Research24 April 2012
Gillian Hilditch, CFA(44-20) [email protected]
Scope to further cut costs appears limited
Next’s cost ratios at first glance appear high when examined against its peer group; however, this is a function of a falling sales base relative to more limited reductions in the cost base. In fact, management has controlled costs very tightly over the period.
Figure 23: Rental costs compared (last reported)
Source: J.P. Morgan estimates Company data. NB Next sales include Directory
Figure 24: Staff costs compared (last reported)
Source: J.P. Morgan estimates, Company data. NB staff costs for Next include Directory staff costs and Directory sales
Focusing on staff as % sales ignores the already efficient nature of Next’s staffing
While Next’s staff costs are high relative to peers (Figure 24), it has been making considerable efficiencies over time (Figure 25), which have allowed it to maintain its staff cost ratios at a fairly constant level of sales despite sales densities halving. This has been achieved through improved scheduling amongst other things, which has allowed Next to reduce staff intensity per 000 sq ft by 50% over the last seven years.
Management argues that staffing densities are an irrelevant measure as the most important metric to focus on is staff costs as a % of sales, as it is throughput of product per staff member that matters, not intensity of staff on the shop floor. While we can see some validity to this argument, we would, however, suggest that having a lower staffing ratio per 000 sq ft than peers may well mean that customers compare their ability to find a staff member when they want one unfavourably across retailers.
0.020.040.060.080.0
100.0120.0140.0
Rental Costs per sq ft
0.0%2.0%4.0%6.0%8.0%
10.0%12.0%14.0%16.0%18.0%
Rent % sales
020406080
100120140160180
Staffing Costs Per Sq ft £
0%
5%
10%
15%
20%
25%
Staff % sales
Next has reduced staff per 000 sq ft by 50% over the last 7 years
Management argues that the most important metric to focus
on is staff costs as a % of sales
as it is throughput of product per staff member that matters,
not intensity on the shop floor

16
Europe Equity Research24 April 2012
Gillian Hilditch, CFA(44-20) [email protected]
More importantly the already low level of staffing means in our view that the scope to make further efficiencies in this area is limited.
Figure 25: Brand staff costs – ratios have improved over time
Source: J.P. Morgan estimates, Company data.
Figure 26: Staff intensity has dropped
Source: J.P. Morgan estimates, Company data. NB this includes Directory staff, store staff per 000 sq ft is even lower
Furthermore, we would note that the above ratios are based on Brand staffing numbers (ie inclusive of Directory) and that Retail FTEs could now be as low as just over 3 per 000 square foot (down from over 7 in 2001) highlighting that whilst cost efficiencies have been aggressive, there is little scope for further savings. If we are correct in our estimate it would also imply store staffing levels only marginally above New Look (2.2 per 000 sq ft) which is well known for its focus on value ahead of customer service.
16.0%
16.5%
17.0%
17.5%
18.0%
18.5%
19.0%
19.5%
20.0%
2004 2005 2006 2007 2008 2009 2010 2011
Staff costs as % of sales
0
20
40
60
80
100
120
140
160
2001 2003 2005 2007 2009 2011
Brand staff costs per sq ft
0
1
2
3
4
5
6
7
8
9
2001 2002 2003 2004 2005 2006 2007 2008 2009 2010 2011
Next Brand employees per 000 sq ft
But the already efficient staff
base in our view shows that the
scope to make more efficiencies is limited

17
Europe Equity Research24 April 2012
Gillian Hilditch, CFA(44-20) [email protected]
Directory margin could have peaked
Whenever we discuss our concerns over the profit densities in the Retail business, bulls on Next point to the attractive margins in the Directory business. However, CEO Simon Wolfson made an intriguing comment at the FY results in March 2012 at which he remarked that “Directory margin has peaked”. This may well have been his usual caution, but we see two very concerning trends, which could well support this view.
Cash customers are growing faster than account customers. Cash customers order less and are less profitable than account holders. Every 10% shift in proportion of cash customers costs c. 80bps of Directory margin.
Free delivery is becoming increasingly prevalent in the market place. While Next is vehemently opposed to the introduction of free delivery as standard, if it were forced to do so as a defensive move then we estimate a c. 18% impact to group PBT
In addition, management expects international customers to grow by 70% in FY13 to 4.5%. These customers generate a margin of 20% (vs Directory average of 23.5%). Every 10% shift towards international costs c. 30bp of margin, so while not significant, it is not helpful, in our view
Growth in less profitable cash customers to outpace credit account holders
Cash customers spend less on average
In the first 2 years following the start of the downturn, sales per customer were relatively flat at £370 in 2008 and £371 in 2009. In 2010 sales per active customer fell by 5% to £352. This was driven by the introduction of cash with order where customer spend is significantly lower in part because they order less in value terms per order and in part because they order much less frequently. Whilst the differential has reduced it remains significant, we estimate in the region of 42% (spend in store is c.third of average Directory account customer spend and hence a differential in cash versus credit spend in the region of 30% to 45% seems reasonable).
In 2012 sales per customer grew by 6% to £364 per customer (albeit remaining below 2007 levels of £374). The increase is explained at least in part by an improved service offering in the year, and in particular the introduction of next day delivery as standard for orders before 9pm. However, it is not clear if the group’s initiatives generated incremental Brand sales, or rather encouraged an acceleration in the shift to Directory, with falling sales densities at a Brand level being supportive of the latter. Furthermore, the impact of the introduction of next day delivery clearly shows the impact of the service offering on customer behavior, highlighting the importance of being at least in line with peers on service with regards to delivery and returns.
Increasing proportion of cash customers will generate further margin dilution
Cash with order customers currently account for 14.6% of the Directory customer base but account for a lower proportion of sales (we estimate c.9%) due to a lower average spend (we estimate spend by cash customers is c.42% lower on average).
We estimate that cash with order
customers spend c. 42% less
than account customers
We believe increased
convenience of the service
proposition stimulated the transfer of Retail customers to
Directory

18
Europe Equity Research24 April 2012
Gillian Hilditch, CFA(44-20) [email protected]
Account customers are more profitable as a result of the service income they generate, effectively the interest income (25.99% APR) and charges on the credit provided by Next, less the bad debt charge. Between 2007 and 2009 (before the introduction on cash with order) the average benefit to the Directory margin as a result of the net service income was 8.3%, implying that account customers are more profitable than cash with order customers. This has been confirmed by management.Since the introduction of cash with order in 2010, Next has lost up to 180bp of margin. Whilst this was in part due to customers paying more quickly (in order not to incur interest and charges that they could ill afford given the difficult macro), weestimate that at the very least, every incremental 10% penetration of cash with order customers will have a dilutive impact on the Directory margin of c.80-90bps. Going forward we expect the growth in cash customers to continue to outpace accountcustomers (account customers +12% in the 2 years to 2012 versus cash customers +196%) as Retail customers who have traditionally paid by cash and have been reluctant to open an account migrate sales online.
Since 2010 cash customers have grown by 8.5% as a proportion of the total Directory customer base to 14.6% and management believes this could comfortably rise to 20% within the next 2 years. The trajectory to date suggests that this forecast could be conservative (and management accepts that in the long term cash penetration could be substantially higher, although it does not necessarily think it will be). Merely taking the 20% number given by management would imply an incremental 5.4% penetration, which would impact the Directory margin by c.40bps to 50bps.
Figure 27: Service income as % of Directory sales
Source: J.P. Morgan estimates, Company data.
0%
2%
4%
6%
8%
10%
12%
14%
2005 2006 2007 2008 2009 2010 2011 2012
Serv ice income as % of sales
We estimate that every 10% shift
towards cash customers costs c.
800bps of margin
Management believes that
penetration could in theory
comfortably exceed 20%

19
Europe Equity Research24 April 2012
Gillian Hilditch, CFA(44-20) [email protected]
Move to free delivery could reduce Group PBT by 18%
We have carried out some analysis to estimate the potential margin dilution if Next were to move to a free shipping policy. We have made a number of assumptions in doing so; but the key impacts are:
Moving to free delivery on the remaining c. 85% of parcels adversely impacts Directory margin by 500bp equating to 20% of Directory EBIT and 10% of group PBT
Free delivery as standard is likely to increase frequency of purchase and reduce average order size, further impacting profit by up to 4.3%
Free delivery could encourage a faster channel shift away from Retail. This could cost c. 3.7% of PBT over a 3 year period
In aggregate we estimate that free delivery could cost c. 18% of group PBT over a 2-3 year time frame. This equates to lost margin of c. 900bp. This compares to the cost to Asos of 1300bp from a shift to free shipping,although Asos has a greater proportion of international sales, which will be more expensive.
Free delivery – negative impact of 900bp on Directory margin
At present Next charges for c. 85% of deliveries. The standard charge is in the region of £3.99 per order/ parcel. However, management does not disclose enough detail forus to calculate the number of order/ parcels shipped to customers per annum and hence we attempt to estimate this based on a number of assumptions.
We use the following information in our calculations:
20% of Directory sales are collected in store (company disclosed that 20% of Directory parcels are collected in store at the FY12 results).
15% of the Directory sales delivered by courier are already free (Next commented at the FY12 interim results that 20% of Delivery was effectively free and although management noted at the FY results that this had reduced, we use 15% as our best estimate).
There are 3 million Directory customers (as disclosed by Next at the FY results). This implies an average annual spend per customer in 2012 of £721 including VAT and grossed up for returns (excluding both returns and VAT average annual spend is £364).
We estimate a Directory returns rate of 41% (calculated from disclosure in the FY12 results and supported by management’s comments that Directory returns are in the high thirties).
We assume that the average standard delivery charge for paid for orders is £3.99 as per the website (this charge appears to be applied to all orders as standard regardless of product category or value).
We assume an average order value (inc VAT) of £100, implying an average order frequency of 7 times per annum. This is in line with management’s comments that account customers order over £100 of product 2-3 times a season (2 main
We estimate that free delivery
would negatively impact
Directory margin by 900bp
20
Europe Equity Research24 April 2012
Gillian Hilditch, CFA(44-20) [email protected]
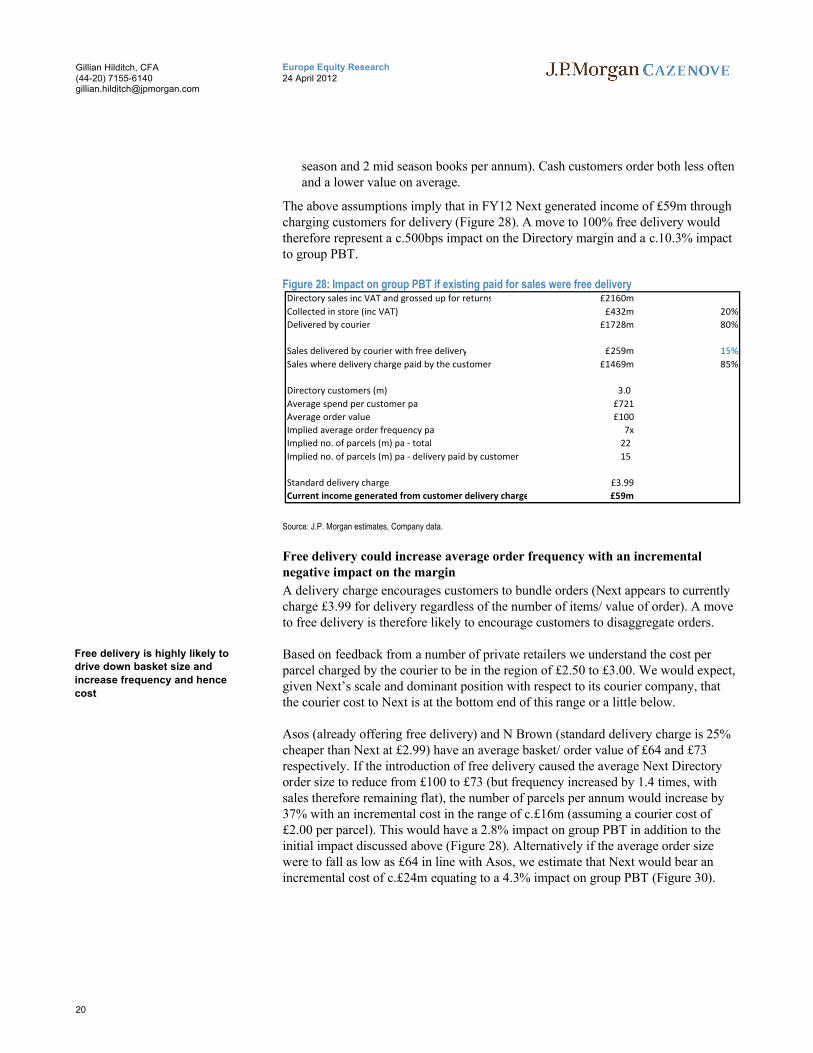
season and 2 mid season books per annum). Cash customers order both less often and a lower value on average.
The above assumptions imply that in FY12 Next generated income of £59m through charging customers for delivery (Figure 28). A move to 100% free delivery would therefore represent a c.500bps impact on the Directory margin and a c.10.3% impact to group PBT.
Figure 28: Impact on group PBT if existing paid for sales were free delivery
Source: J.P. Morgan estimates, Company data.
Free delivery could increase average order frequency with an incremental negative impact on the margin
A delivery charge encourages customers to bundle orders (Next appears to currently charge £3.99 for delivery regardless of the number of items/ value of order). A move to free delivery is therefore likely to encourage customers to disaggregate orders.
Based on feedback from a number of private retailers we understand the cost per parcel charged by the courier to be in the region of £2.50 to £3.00. We would expect,given Next’s scale and dominant position with respect to its courier company, that the courier cost to Next is at the bottom end of this range or a little below.
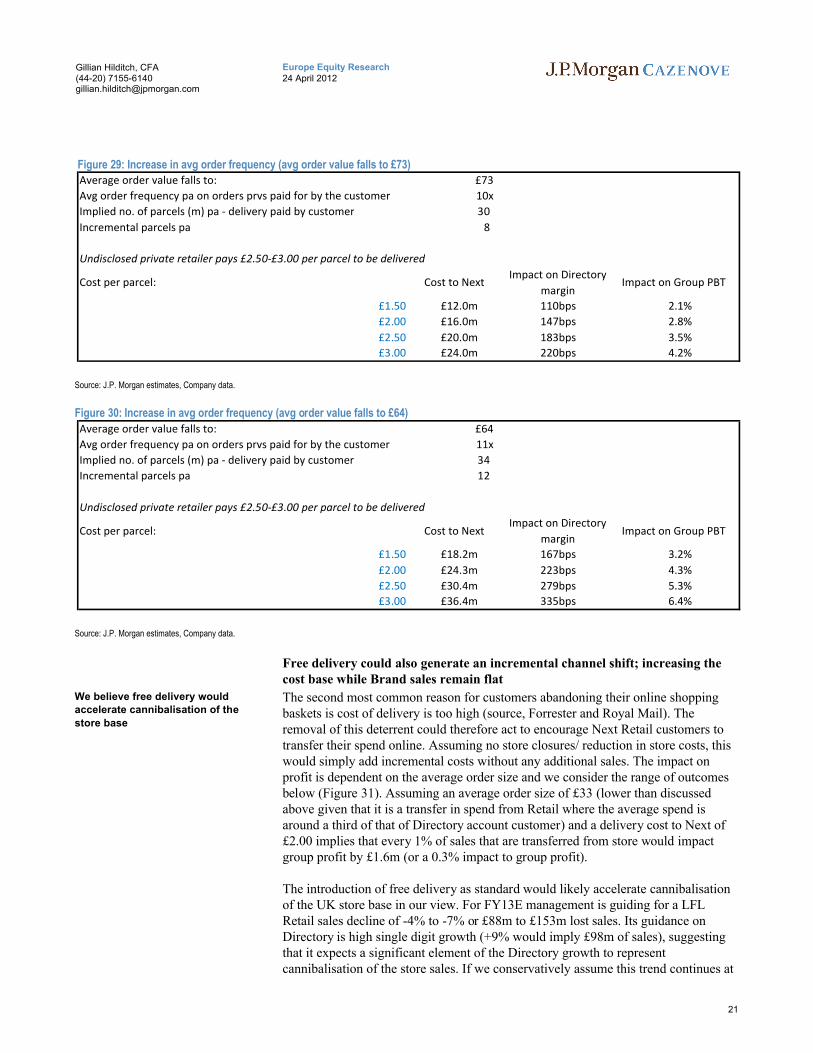
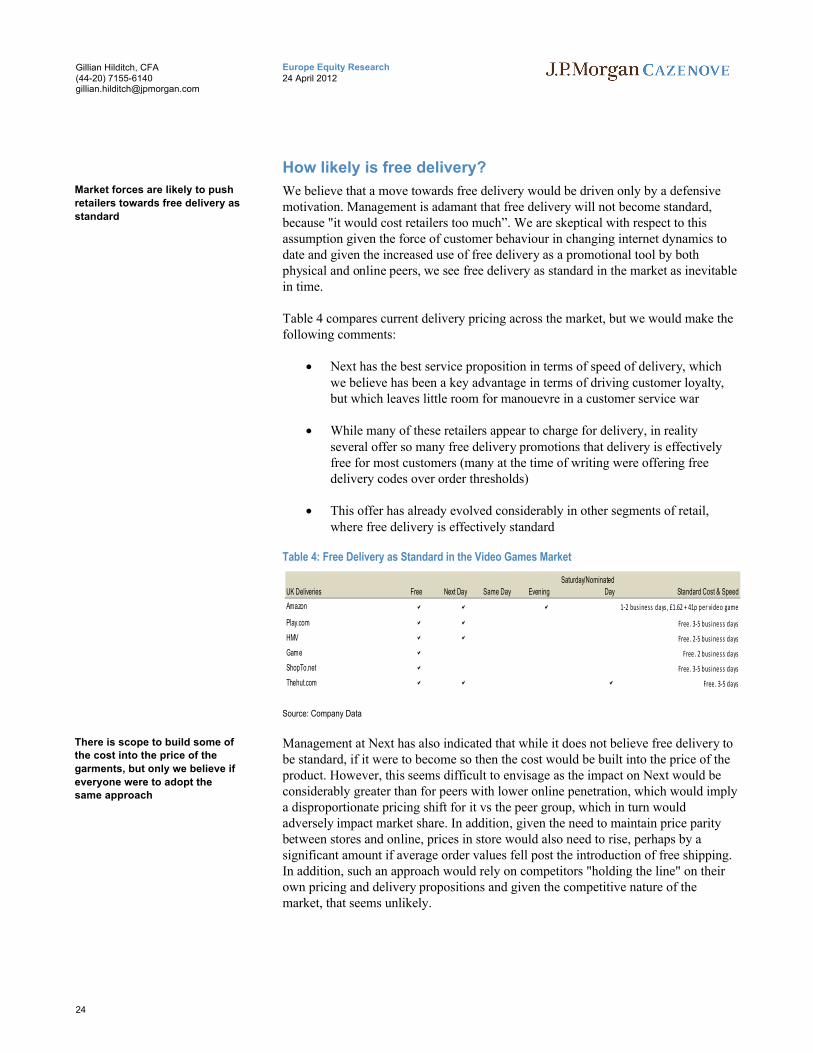
Asos (already offering free delivery) and N Brown (standard delivery charge is 25% cheaper than Next at £2.99) have an average basket/ order value of £64 and £73 respectively. If the introduction of free delivery caused the average Next Directory order size to reduce from £100 to £73 (but frequency increased by 1.4 times, with sales therefore remaining flat), the number of parcels per annum would increase by 37% with an incremental cost in the range of c.£16m (assuming a courier cost of £2.00 per parcel). This would have a 2.8% impact on group PBT in addition to the initial impact discussed above (Figure 28). Alternatively if the average order size were to fall as low as £64 in line with Asos, we estimate that Next would bear an incremental cost of c.£24m equating to a 4.3% impact on group PBT (Figure 30).
Directory sales inc VAT and grossed up for returns £2160m
Collected in store (inc VAT) £432m 20%
Delivered by courier £1728m 80%
Sales delivered by courier with free delivery £259m 15%
Sales where delivery charge paid by the customer £1469m 85%
Directory customers (m) 3.0
Average spend per customer pa £721
Average order value £100
Implied average order frequency pa 7x
Implied no. of parcels (m) pa - total 22
Implied no. of parcels (m) pa - delivery paid by customer 15
Standard delivery charge £3.99
Current income generated from customer delivery charge £59m
Free delivery is highly likely to drive down basket size and
increase frequency and hence
cost
21
Europe Equity Research24 April 2012
Gillian Hilditch, CFA(44-20) [email protected]
Figure 29: Increase in avg order frequency (avg order value falls to £73)
Source: J.P. Morgan estimates, Company data.
Figure 30: Increase in avg order frequency (avg order value falls to £64)
Source: J.P. Morgan estimates, Company data.
Free delivery could also generate an incremental channel shift; increasing the cost base while Brand sales remain flat
The second most common reason for customers abandoning their online shopping baskets is cost of delivery is too high (source, Forrester and Royal Mail). The removal of this deterrent could therefore act to encourage Next Retail customers to transfer their spend online. Assuming no store closures/ reduction in store costs, this would simply add incremental costs without any additional sales. The impact on profit is dependent on the average order size and we consider the range of outcomes below (Figure 31). Assuming an average order size of £33 (lower than discussed above given that it is a transfer in spend from Retail where the average spend is around a third of that of Directory account customer) and a delivery cost to Next of £2.00 implies that every 1% of sales that are transferred from store would impact group profit by £1.6m (or a 0.3% impact to group profit).
The introduction of free delivery as standard would likely accelerate cannibalisation of the UK store base in our view. For FY13E management is guiding for a LFL Retail sales decline of -4% to -7% or £88m to £153m lost sales. Its guidance on Directory is high single digit growth (+9% would imply £98m of sales), suggesting that it expects a significant element of the Directory growth to represent cannibalisation of the store sales. If we conservatively assume this trend continues at
Average order value falls to: £73
Avg order frequency pa on orders prvs paid for by the customer 10x
Implied no. of parcels (m) pa - delivery paid by customer 30
Incremental parcels pa 8
Undisclosed private retailer pays £2.50-£3.00 per parcel to be delivered
Cost per parcel: Cost to NextImpact on Directory
marginImpact on Group PBT
£1.50 £12.0m 110bps 2.1%
£2.00 £16.0m 147bps 2.8%
£2.50 £20.0m 183bps 3.5%
£3.00 £24.0m 220bps 4.2%
Average order value falls to: £64
Avg order frequency pa on orders prvs paid for by the customer 11x
Implied no. of parcels (m) pa - delivery paid by customer 34
Incremental parcels pa 12
Undisclosed private retailer pays £2.50-£3.00 per parcel to be delivered
Cost per parcel: Cost to NextImpact on Directory
marginImpact on Group PBT
£1.50 £18.2m 167bps 3.2%
£2.00 £24.3m 223bps 4.3%
£2.50 £30.4m 279bps 5.3%
£3.00 £36.4m 335bps 6.4%
We believe free delivery would accelerate cannibalisation of the
store base

22
Europe Equity Research24 April 2012
Gillian Hilditch, CFA(44-20) [email protected]
the lower end of the range (that is, 4% of Retail sales shift into Directory per annum) and that these sales are free delivery this implies a c.1.2% negative impact on group profit per annum (that is 4x the 0.3% impact discussed above). Over 3 years therefore this would reduce PBT in the region of 3.6%.
Figure 31: Impact if sales are transferred from Retail to Directory
Source: J.P. Morgan estimates, Company data.
Experience of Asos highlights risk of margin dilution
All of this, of course is theoretical, but we do have a real life example to look at in Asos, which has been a leader relative to other UK retailers in developing its service offering to consumers. Both delivery and returns are now free for UK customers. Initially both delivery and returns were charged for and Asos formally moved to free delivery in the UK in April 2010. However, in the years prior to this it had been increasingly moving towards this point with an increasing number of promotional free delivery offers. Over this period the group moved from making a small profit on delivery receipts of £1.9m in 2008, to a loss of £21.9m in 2011, representing an impact on the group operating margin of 9.5% (marginally inflated by the impact of free global shipping in one quarter of 2011). In 2013 this is expected to move to a loss of £85m on a sales base of £676m (this compares to Next Directory’s sales of £1.1bn), representing 13% of sales. This gives some context to our assumptions above and provides us with some comfort on the assumptions.
Free returns is much less significant - 94% of returns are free already
The Directory business has a returns rate in the high 30s. Customers make 59% of their returns through stores at no tangible delivery cost to Next (whilst there is a cost of processing a return in store, a processing cost would also have been incurred had the goods been returned directly to the warehouse and this is therefore simply an allocation issue in our view). Returns are free for Next cardholders and therefore we estimate that Next already incurs the delivery charge for a further 35% of returns. This leaves only 6% of returns where the cost is currently incurred by the customer. Assuming a cost of c.£2.00-2.50 to Next per parcel and an average return value of £41 (given the 41% returns rate and assumed average order value of £100) would imply a c.0.4% impact to group earnings if free returns were implemented. Given that 85% of the Directory customer base (that is, account customers) are already eligible for free returns, we would not anticipate a significant change in the
Retail sales £2191m
1% transfer of Retail sales (ex VAT) £22m
1% transfer of Retail sales (inc VAT) £26m
Avg order size £33 £64 £73 £100
Implied no. of parcels (m) 0.8 0.4 0.4 0.3
Undisclosed retailer pays £2.50 to £3.00 per parcel
Incremental cost:
£1.50 £1.2m £0.6m £0.5m £0.4m
£2.00 £1.6m £0.8m £0.7m £0.5m
£2.50 £1.9m £1.0m £0.9m £0.6m
£3.00 £2.3m £1.2m £1.1m £0.8m
Free shipping is expected to
cost Asos c.13% of sales in FY13E, up from zero in 2008
Free returns are not expected to
have a significant impact as
virtually all returns are already free.

23
Europe Equity Research24 April 2012
Gillian Hilditch, CFA(44-20) [email protected]
percentage going through store if a blanket free returns policy was introduced and hence we would not expect the impact to be material.
Given the high proportion of free returns already in place, we would not expect a move to free delivery/ returns to significantly change the returns rate.
Reduced production and print costs could partially offset the impact – but high risk
Despite customers paying c.£4 for a Next Directory, each book costs the company c.£12 to produce and deliver, generating a loss therefore of around £8 per book. Each year there are 4 editions of the catalogue (Christmas, Autumn/Winter, Spring/Summer and Summer). Of the almost 3 million Directory customers we assume 2.3m buy a copy of the book, implying a maximum cost, and therefore maximum potential saving, in the region of £72m, representing 12.6% of PBT.
However, there are two reasons why any potential saving is likely to be some way below this level. Firstly there are costs associated with the production of the Directory that would continue to be incurred regardless of the size of the print run (all the photography for example is also necessary for displaying the product on the website). We estimate that the delivery cost is c.£4 of the full £12 cost per book. In 2000 we estimate that print costs were c.£4.20 per book (based on active customernumbers and disclosure that print costs represented 6% of Directory sales at the time). Given the threefold increase in customers since then we would expect the current print cost per book to be at a lower level. However, this implies current photography costs in the region of £36m (ie c. 50% of the total cost) and therefore a maximum potential saving of £36m (representing 6.3% of PBT).
Secondly, whilst the number of catalogues is likely to decline over time as Next customers become increasingly comfortable with using the internet to browse rather than simply to order, at present management view it as a key sales driver and there is therefore a risk that any sharp deterioration in catalogue distribution could negatively impact the top line to a significant degree.
We estimate the Big Book production and print costs are
c.12.6% of PBT annually
Scope to cut these is limited as we estimate c. 50% are fixed
In addition, the adverse impact on sales of withdrawal of the Big
Book would be in our view
significant
24
Europe Equity Research24 April 2012
Gillian Hilditch, CFA(44-20) [email protected]
How likely is free delivery?
We believe that a move towards free delivery would be driven only by a defensive motivation. Management is adamant that free delivery will not become standard, because "it would cost retailers too much”. We are skeptical with respect to this assumption given the force of customer behaviour in changing internet dynamics to date and given the increased use of free delivery as a promotional tool by both physical and online peers, we see free delivery as standard in the market as inevitable in time.
Table 4 compares current delivery pricing across the market, but we would make the following comments:
Next has the best service proposition in terms of speed of delivery, which we believe has been a key advantage in terms of driving customer loyalty, but which leaves little room for manouevre in a customer service war
While many of these retailers appear to charge for delivery, in reality several offer so many free delivery promotions that delivery is effectively free for most customers (many at the time of writing were offering free delivery codes over order thresholds)
This offer has already evolved considerably in other segments of retail, where free delivery is effectively standard
Table 4: Free Delivery as Standard in the Video Games Market
Source: Company Data
Management at Next has also indicated that while it does not believe free delivery to be standard, if it were to become so then the cost would be built into the price of the product. However, this seems difficult to envisage as the impact on Next would be considerably greater than for peers with lower online penetration, which would imply a disproportionate pricing shift for it vs the peer group, which in turn would adversely impact market share. In addition, given the need to maintain price parity between stores and online, prices in store would also need to rise, perhaps by a significant amount if average order values fell post the introduction of free shipping. In addition, such an approach would rely on competitors "holding the line" on their own pricing and delivery propositions and given the competitive nature of the market, that seems unlikely.
UK Deliveries Free Next Day Same Day Evening
Saturday/Nominated
Day Standard Cost & Speed
Amazon 1-2 bus iness days , £1.62 + 41p per vide o game
Play.com Free . 3-5 bus iness days
HMV Free . 2-5 bus iness days
Game Free . 2 bus iness days
ShopTo.net Free . 3-5 bus iness days
Thehut.com Free . 3-5 days
Market forces are likely to push
retailers towards free delivery as
standard
There is scope to build some of the cost into the price of the
garments, but only we believe if
everyone were to adopt the same approach

25
Europe Equity Research24 April 2012
Gillian Hilditch, CFA(44-20) [email protected]
Table 5: Comparison of free delivery options in the UK
Source: J.P. Morgan estimates, Company data.
Could free delivery grow Next Directory sales?
It is possible that free delivery could drive incremental sales. This has been the case with Asos but we would argue that it had a first mover advantage as well as no significant incumbent store base to cannibalise.
Furthermore, Next already has significant penetration of its customer profile base (ABCD1 women in the 25-44 year old age bracket). Assuming that the majority of the almost 3 million Directory customers are women implies 41% penetration in this age bracket alone (7.2 million, 25-44 year old women in the UK, source ONS), and in practice will be higher than this given that the Next demographic is focused on ABC1’s. Furthermore this excludes any Next Retail customers that do not shop through Directory. This implies an even higher penetration in their core customer demographic. Hence, in our view, incremental Next Brand customer growth in the UK is unlikely from here and we would not expect to see a material impact on Brand sales as a result of free delivery.
UK Deliveries Free Next Day Same Day Evening
Saturday
/Nominated Day Standard Cost & Speed
Free Standard Delivery
Rachets
ASOS £3.95. Within 3 working days On orders over £70
Debenhams Free. 2-4 working days
Next £3.99. Next Day
Marks & Spencer £3.50. Up to working 5 days
H&M £3.90. Within 4-6 working days
Zara £3.95. Within 3-5 working days
John Lewis £3.00. Within 4 working days On orders over £30
Ted Baker £4.50. Within 2-5 working days
House of Fraser £3.00. Within 3-5 working days On orders over £50
River Island £3.95. Within 5-7 working days
Very.com £3.95. Next Day
Boohoo.com £3.99. Within 4 working days
Warehouse £2.99. Within 5 working days On orders over £55
Topsop £4.00. Within 2-4 working days
French Connection £3.95. Within 3 to 5 working days On orders over £75
Free delivery a defensive stance;
incremental Brand customers unlikely given existing
penetration

26
Europe Equity Research24 April 2012
Gillian Hilditch, CFA(44-20) [email protected]
Outlook for FY13E and beyond
We are looking for PBT at Next to fall by an average of 3% per annum over the next three years (to 2015E). This includes a fall of 1.6% in FY13E, at the bottom of management's guidance range (Table 6).
FY13E Guidance
Management’s guidance for FY13E is outlined in Table 6: .
Table 6: Management guidance for H1 and FY 2013
Low-scenario High scenarioH1 guidanceLFL Retail sales -7% -4%Total Retail sales -3% 0%Directory sales +9% +12%Brand sales +1% +4%
FY13 guidanceBrand sales +1% +4%PBT £560m £610mPBT growth -2% +7%Buyback (% of shares) +4% +4%EPS growth +3% +12%
Source: Company reports.
Total Brand sales are expected to increase by +1% to +4% with high single digit growth expected from Directory (H1 guidance is +9% to +12%). Assuming 9% growth for Directory, would imply a FY change in Retail sales of between +1% and -3% (H1 guidance is 0 to -3%), which given an expected space contribution of 4% (60% conversion) implies an expected LFL of between -3% and -7%.
Bought in gross margins are expected to be flat with manufacturing costs and selling prices level yoy. No significant changes to markdown are expected; hence, gross margins are expected to remain flat.
Annual LFL inflation in the cost base is expected to be £36m driven by wage inflation of 2.5% and underlying increases in rent and rates. Management expects to offset £28m of this cost pressure with cost savings.
Management has also indicated that we should expect a £28m interest charge, £8m of profit from international and £25m of profit from sourcing.
Implementing management’s guidance, results in a modest upgrade to our PBT estimate for FY13E from £545m to £561m. This puts us at the bottom of the range of guidance and 5% below BBG consensus of £590m. This appears to be primarily due to our assumptions on margin as we are only 1% below BBG consensus on sales. These assumptions are discussed in more depth below.
Management guidance implies
an FY13E LFL of between -4% and -7%

27
Europe Equity Research24 April 2012
Gillian Hilditch, CFA(44-20) [email protected]
FY13E assumptions
Q1 likely to be difficult
Next is due to report its Q1 IMS on 2 May. We expect LFL Retail sales to have declined by 9% which, while a deterioration on a headline basis (Q4 FY12 -3.2%), represents a broad maintenance of the underlying run-rate on a comparative that is c.650bps tougher. In line with management’s FY guidance we expect a contribution from new space in the region of +4% resulting in a decline in total Retail sales of -5% (expected new space contribution to total Brand sales +2.7%). In the Directory business we also assume that the underlying trend continues (2-year growth rate +26%) implying Q1 sales +11% yoy.
Retail sales data and commentary for Q1 has to date been marginally more positive than over the last 6 months. John Lewis has reported strong performances with fashion being up mid to high single digit on average. M&S sales, whilst disappointing, were the result of the group under potentialising and M&S data actually suggested that the consumer environment was stable to marginally more positive. The warm weather in March also provided a boost. Overall therefore it appears that underlying trends in the consumer environment are largely unchanged since Next released its FY results in mid-March and as such we do not expect any material changes to FY guidance (JPMCe FY13E PBT c. 5% below consensus).
FY sales growth bolstered by strong Directory
Within the Retail business we expect square footage to grow by c.6% in FY13 and contribute 4% to top line growth (60% conversion), in line with the guidance. At this stage management expects around half of the space to be in standalone home stores. We forecast a FY13 LFL of -5.5% at the mid-point of the implied guided range (-4% to -7%). Overall therefore we expect sales in the Retail business to decline by -1.5%. We expect Directory growth to continue to be impressive at +9% (guidance is for high single digit growth) driven by in part by the ongoing annualisation of the “offers” tab and in the main by a continued shift in spend from Retail, through both growth in cash customers and an increase in account customer spending online rather than via cash in store. In line with management guidance we also assume an incremental £20m from international online sales (taking the total to £50m) which contributes 1.8% to total Directory growth of +9%. Overall therefore this implies total growth in Brand sales of +2%, within the range of management guidance of +1% to +4%. We would note however, that given the new space contribution, this implies a negative underlying Brand LFL of -0.7% (or -1.3% excluding international online).
FY margin in both businesses under pressure
We assume that the gross margin in both divisions remains flat yoy given no material change expected by management in bought in gross margin or the level of markdown yoy. We expect the Retail EBIT margin to decline by 100bps yoy (discussed in detail below) which, combined with the negative top line performance, results in EBIT of £297m, a yoy decline of 8.2%. We expect Directory EBIT margin to fall by 60bps yoy (discussed in detail below), generating growth of only 6.2% yoy in Directory profits (despite the more impressive top line performance).
Contribution from new space is
expected to be 4% pa
Gross margins expected to
remain flat

28
Europe Equity Research24 April 2012
Gillian Hilditch, CFA(44-20) [email protected]
We model international and sourcing profit and interest in line with guidance as detailed above. Combined with a share option charge of £17m (flat yoy) we expect PBT of £561m, a decline of -1.6% yoy, at the bottom of the guided range of -2% to +7%.
FY14E assumptions
Sales trend unchanged in Retail, but Directory slows to +5%
In FY14E we expect top line trends within the Retail division to remain broadly unchanged with space growth of +4.3% and Retail LFL of -6% resulting in an overall decline in Retail sales of -1.7%. However, we anticipate that the extent of mitigation caused to the overall decline in Brand sales reduces as the rate of Directory growth slows. We forecast Directory growth of only 5% in FY14, implying LFL Brand sales of -2.1% (total Brand sales +0.6%).
Pressure persists on margin
We have little visibility on gross margins out to CY13, however, we see little reason for the sourcing environment to move in the retailers’ favour (with Chinese wages for example continuing to experience double digit increases). With any improvement in the aggressively promotional environment that currently persists likely to be offset, we assume gross margins remain flat. We assume a continued decline in both the Retail and Directory EBIT margins, by 110bps and 60bps respectively (discussed in more detail below). With the other largest elements of PBT (share option charge and interest) being unchanged yoy this results in FY14E PBT of £542m (-3.5% yoy).
FY15E assumptions
We expect sales trends in both the Retail and Directory business to be unchanged versus FY14 with Retail sales falling by 2% in total (space +4% and LFL -6%) and Directory growth of +5%. This results in total Brand sales rising by only +0.6% and a negative Brand LFL of -1.9%.
In line with FY14 at this stage we assume flat gross margins in both divisions in FY15 and that the EBIT margin will fall by 130bps and 50bps in Retail and Directory respectively. With the share option and interest charge remaining unchanged yoy we forecast FY15E PBT of £521m, a yoy decline of -3.8%.

29
Europe Equity Research24 April 2012
Gillian Hilditch, CFA(44-20) [email protected]
Table 7: Summary P&L
Source: Company Data, JPMC ests
Table 8: Summary Cashflow
Summary Cash Flow (£m) 2009 2010 2011 2012E 2013E 2014E 2015E
Gross cash flow (post tax & interest) 439.9 491.5 507.9 576.2 556.3 541.7 526.2Change in working capital -39.8 46.8 -76.6 -69.2 -56.1 -13.7 -13.8Operating cash flow 400.1 538.3 431.3 507 500.1 528 512.3Cashflow from investing -134.4 -96.2 -138.1 -70.2 -115 -115 -115Dividends paid -106.5 -108.5 -129.6 -135.1 -140.8 -146.8 -153Cashflow from financing -51.3 -107.3 -290.3 -330.2 -240 -240 -240Change in cash 107.9 226.3 -126.7 -28.5 4.3 26.2 4.3Opening Net Cash -740.5 -628.6 -400.1 -530.4 -574.7 -570.4 -544.3Other 4 2.1 -3.6 -15.8 0 0 0Closing Net cash/(debt) -628.6 -400.1 -530.4 -574.7 -570.4 -544.3 -540
Source: Company Data, JPMC ests
Y/E January 2009 2010 2011 2012 2013E 2014E 2015E
£m
Retail Sales 2197.2 2274.2 2222.1 2191.4 2158.5 2120.9 2078.3
Retail LFL -7.1% 0.3% -4.0% -5.7% -5.5% -6.0% -6.0%
Retail Space 4.5% 3.2% 3.0% 4.3% 4.0% 4.3% 4.0%
Retail Growth -2.6% 3.5% -1.0% -1.4% -1.5% -1.7% -2.0%
Retail EBIT 288.6 324.0 328.8 323.7 297.2 268.1 236.2
EBIT Margin 13.1% 14.2% 14.8% 14.8% 13.8% 12.6% 11.4%
Directory Sales 816.4 873.2 935.5 1088.7 1186.7 1246.0 1308.3
Directory Sales Growth 2.1% 7.0% 7.1% 16.4% 9.0% 5.0% 5.0%
Directory EBIT 157.6 183.6 221.9 262.6 278.9 285.3 293.1
EBIT Margin 19.3% 21.0% 23.7% 24.1% 23.5% 22.9% 22.4%
Brand Sales 3088.1 3215.1 3229.0 3363.9 3433.0 3458.3 3481.6
Group PBT 428.5 505.3 551.4 570.3 561.3 541.8 521.2
Brand Gross Margin 50.4% 51.3% 52.0% 52.5% 52.4% 52.3% 52.3%
PBT Growth -14.0% 17.9% 9.1% 3.4% -1.6% -3.5% -3.8%
EPS (p) 155.7 175.9 206.4 237.0 246.4 247.8 248.3
EPS Growth -6.6% 13.0% 17.3% 14.8% 4.0% 0.6% 0.2%
Consensus PBT 589.1 617.0 654.7
JPMC vs Cons -4.7% -12.2% -20.4%
Consensus EPS 265.7 292.2 322.3
JPMC vs. Cons -7.2% -15.2% -23.0%

30
Europe Equity Research24 April 2012
Gillian Hilditch, CFA(44-20) [email protected]
Table 9: Summary Balance Sheet
Source: Company Data, JPMC ests
EBIT margin analysis in more detail
We assume gross margins remain flat going forward
The Retail gross margin has increased by 700bps over the last 5 years. This has been driven by improvements in the bought in gross margin (+380bps cumulatively) and a reduction in markdown (+290bps). The majority of the benefit in bought in gross margin has had been driven by a shifting in sourcing overseas and more recently by building increased lead times back into in the supply chain. However, lengthening lead times naturally comes with increased fashion risk and we see limited scope for this to continue going forward. The reduction in markdown was most noticeable in 2009 and 2010 as management continued its stance of not discounting ahead of Christmas and as surplus stock fell due to Next significantly beating initial sales budgets, particularly post the credit crunch. A key contributor has also been the ongoing shift of a higher proportion of sale stock into the Directory business. It is possible that this could continue going forward as Directory continues to grow as a proportion of sales.
However, as a result the improvement in the Directory margin over the 5 years to FY12 has been less impressive than that seen in Retail, albeit still a positive performance at +130bps on a cumulative basis (as the overall impact from markdown has been broadly flat). In line with the Retail business, the benefit to the gross margin over the period has been driven by an improvement in the bought in gross margin.
Summary Balance Sheet (£m) FY2009 FY2010 FY2011 FY2012E FY2013E FY2014E FY2015E
Tangibles 612.8 577.2 592.4 581.9 576.9 571.9 566.9
Intangibles 55.4 47.4 46.5 45.6 45.6 45.6 45.6
Investments 4.5 5 5.1 6.1 6.1 6.1 6.1
Other financial assets 14.1 22.7 81.0 80.7 82.2 83.7 85.2
Deferred Tax Asset 0.0 0.0 0.0 0.0 0.0 0.0 0.0
TOTAL FIXED ASSETS 687 652 725 714 711 707 704
Stock 318.7 309 368.3 371.9 381.1 383.9 386.5
Debtors 524.4 529.9 558.9 612.4 624.5 636.7 649.3
Other Assets 199.6 95.3 90.8 99.2 99.2 99.2 99.2
Cash 47.8 107 49.3 56.4 66.3 97.9 107.4
CURRENT ASSETS 1091 1041 1067 1140 1171 1218 1242
TOTAL ASSETS 1777 1694 1792 1854 1882 1925 1946
Debt 121.3 4.7 10.2 7.6 7.6 7.6 7.6
Trade Creditors 204.8 175.0 195.5 223.7 188.8 190.2 191.5
Other Liabilities 1281 1367 1341 1388 1405 1422 1438
TOTAL LIABILITIES 1607 1546 1547 1619 1601 1619 1637
Provisions 13.1 13.4 13.3 12.0 12.0 12.0 12.0
Shareholder Funds 156.6 133.4 232.5 222.7 268.4 293.4 296.5
TOTAL FUNDS 1777 1693 1792 1854 1882 1925 1946

31
Europe Equity Research24 April 2012
Gillian Hilditch, CFA(44-20) [email protected]
Going forward therefore we expect gross margins to remain flat across both divisions.
Negative operational gearing has impacted cost metrics
Whilst Next has performed well historically on cost control, the decline in top line in the Retail division has nevertheless resulted in a cumulative deterioration in the opex ratio of 700bps in total over the 6 years. The key driver of this has been occupancy costs which have negatively impacted
the EBIT margin by 570bps over the period in total (or 100bps pa on average). This is unsurprising in view of the limited scope for savings in this area given the upward only nature of UK lease agreements and the negative operational gearing of a declining retail sales base. We expect this trend to continue
The second key driver of the decline has been central overheads which have contributed 80bps to the decline in the margin in total given their relatively fixed nature.
Perhaps surprisingly given the aggressive efficiencies that Next appears to have made in staffing, store payroll costs have also had a negative impact of -20bps over the period
Up until FY11, distribution and warehouse expenses have remained flat as a proportion of Retail sales which is unsurprising given their largely variable nature. However, in FY 2012 they started to have a detrimental effect on the margin (-30bps), we assume in part due to the deterioration in the top line and in part due to increased handling costs in store on the behalf of the Retail business
We expect the cost ratio to continue to deteriorate
In the Retail business, as LFL sales remain in negative territory we expect the cost ratio to continue to deteriorate over time driven by the impact of negative operational gearing, and we forecast a cumulative fall of 340bps over the 3 years to 2015 (-100bps in FY13 and -120bps in both FY14 and FY15).
Negative operational gearing on occupancy costs is a key factor
The biggest contributor to the forecast decline is occupancy costs (both rent and utilities). The group has been experiencing rental inflation across the portfolio of c.+1% to +1.5% on average in recent years and we expect at least this rate of increase going forward. Whilst we expect Next to continue to negotiate aggressively with landlords (particularly in less desirable locations when a lease is up for renewal), with upward only rent reviews in place there is little opportunity to mitigate rental costs without a reduction in the size of the portfolio which is something that management has confirmed it is not considering.
Implicit in our margin assumption is therefore an annual decline 60-80bps from store occupancy costs versus a historic average of -100bps pa.
We assume that central overheads are already at very efficient levels and hence as sales deteriorate, these increase by 30bps as a percentage of the top line per annum(in line with the deterioration in 2012).
We see downside risk to our occupancy cost assumptions. Given the variable nature of staff costs we assume that the ratio of staff payroll costs to sales remains constant yoy going forward. However, as discussed in some detail in earlier sections, Next

32
Europe Equity Research24 April 2012
Gillian Hilditch, CFA(44-20) [email protected]
already appears to have one of the lowest number of FTE staff per 000 square foot versus peers which therefore begs the question whether further efficiencies in these costs can actually be achieved without a significant impact on current customer service levels. We therefore consider this assumption to be relatively generous(particularly given a negative impact on the ratio of 20bps over the past 6 years when cost savings in this area were ongoing) and see the potential for downside risk to the margin as a result.
We assume warehousing and distribution costs should also continue to deteriorate
Despite the variable nature of distribution and warehouse costs in theory, we assume that there is a minimum level of costs which is effectively fixed (delivery costs to stores, fixed element of the warehouse costs attributable to Retail etc) and therefore assume some negative operational gearing in this element of the margin going forward of -40bps on a cumulative basis over the 3 years to FY15 (relatively generous versus a -30bps impact in FY12).
Table 10: Retail Margin Breakdown
Source: Company Data, JPMC estimates
Directory operating margin breakdown
The improvement to the Directory margin as a result of opex movements over the 5 years to FY12 has been impressive at +820bps on a cumulative basis. The key drivers have been:
The warehouse and distribution element which has contributed 420bps to the improvement. However, we would note that the majority of this was in 2007 (+330bps when Next opened its new boxed warehouse) and the trend has beennegative in the last two years (-80bp in FY11 and -70bp in FY12). Perhaps generously given the trend of the last 2 years, we have assumed that this cost ratio declines by 50bp pa over the next three years.
A significant reduction in the bad debt charge (+480bps). However, this was weighted towards 2008 when we saw an improvement of 270bps as management tightened up credit terms during the credit crunch. Management said recently that bad debts were at record low levels, hence we believe there is little scope to reduce this further, although in theory it should fall as the proportion of account customers in the mix declines – we have assumed a 40bp annual benefit to Directory margin from a reduction in bad debt ratio.
The benefit to margin from a falling bad debt ratio due to cash customer growth will be offset by a commensurate decline in service income. The adverse fall in this ratio has been 80bp over the last five years, but this has accelerated to -
RETAIL MARGIN BREAKDOWN 2007 2008 2009 2010 2011 2012 2013E 2014E 2015E
Starting margin 14.8% 14.0% 14.2% 13.1% 14.2% 14.8% 14.8% 13.8% 12.6%
Increase in achieved gross margin 1.5% 1.8% 1.4% 1.0% 0.6% 0.7% 0.0% 0.0% 0.0%
Change in bought gross margin 1.6% 1.4% -0.1% -0.4% 1.0% 0.3% 0.0% 0.0% 0.0%Reduction in markdown -0.1% 0.0% 1.6% 1.4% -0.4% 0.4% 0.0% 0.0% 0.0%
Provisions and Slippage 0.0% 0.0% -0.1% 0.0% 0.0% 0.0% 0.0% 0.0% 0.0%
Increase in store occupancy costs -1.9% -1.0% -2.1% 0.3% -0.6% -0.4% -0.6% -0.7% -0.8%
Reduction in store payroll costs -0.4% -0.2% 0.1% 0.0% 0.0% 0.3% 0.0% 0.0% 0.0%
Increase in central overheads 0.0% -0.4% -0.5% -0.2% 0.6% -0.3% -0.3% -0.3% -0.3%
Increase in distribution and warehouse costs 0.0% 0.0% 0.0% 0.0% 0.0% -0.3% -0.1% -0.2% -0.1%Change in cost ratios -2.3% -1.6% -2.5% 0.1% 0.0% -0.7% -1.0% -1.2% -1.2%
Closing operating margin 14.0% 14.2% 13.1% 14.2% 14.8% 14.8% 13.8% 12.6% 11.4%

33
Europe Equity Research24 April 2012
Gillian Hilditch, CFA(44-20) [email protected]
100bps in FY11 and FY12 post the introduction of cash customers. We expect this trend to continue. .
We expect positive operational gearing effects as the top line continues to grow and hence are assuming central overheads fall as a percentage of Directory sales by 50bps pa.
Overall we are assuming that Directory margin deteriorates by 170bps on a cumulative basis over the 3 years to FY15 with the key driver of this decline a fall in the proportion of service charge income (net of bad debts).
We expect a significant proportion of growth in the Directory top line to be driven by an increase in less profitable cash customers (and estimate that every incremental 10% penetration in cash sales has a c.80bps impact on the Directory margin). We therefore assume that a 60bps pa decline in the Directory margin in the 3 years to FY15.
Table 11: Directory Margin Breakdown
Source: Company Data, JPMC estimates
Cash flow and Balance sheet analysis
Cash flow comfortably supports 10% dividend growth and ongoing buyback
Next is well known as being efficient at converting profit into cash and is one of the most cash generative retailers amongst its peer group. In FY12 FCF was £333m and the cash conversion rate (CFO less capex as a percentage of EBIT) was high at 88%. Despite falling EBIT, looking ahead to FY13 we expect the FCF to continue to progress to £351m as depreciation falls by £20m yoy to £115m (in line with guidance). Going forward we expect depreciation to remain below capex, reflecting the cumulative capex spend ahead of depreciation of c.£84m over the past 5 years. We forecast FCF to continue to rise in FY14 to £378m as the working capital outflow improves yoy, resulting in very impressive cash conversion of 99%. In FY15 we expect FCF to fall below FY14 levels by 4.2% to £363m, albeit remaining above FY13, as the yoy decline in operating profits is not offset by any other factors.
Given the strong cash generation, we are forecasting that Next continues to grow the dividend by 10% pa, some way ahead of underlying earnings growth (JPMCe 3 year PBT CAGR to 2015 of -3%). This results in an increase in the cash dividend in the region of £6m pa rising from £135m in FY12 to £153m by 2015. The dividend payment is well covered by FCF, by 2.5x in FY13 and FY14 although falling to 2.4x in FY15. Whilst this compares favourably to the decline in P&L coverage to 2.1x in FY15 (from 2.6x in FY12).
DIRECTORY OPERATING MARGIN 2007 2008 2009 2010 2011 2012 2013E 2014E 2015E
Starting margin 14.1% 18.6% 20.6% 19.3% 21.0% 23.7% 24.1% 23.5% 22.9%
Increase achieved in gross margin -0.2% 0.1% -1.2% 0.5% 1.3% 0.8% 0.0% 0.0% 0.0%
Change in bought in gross margin 1.2% 0.8% -0.9% -0.4% 1.3% 0.6% 0.0% 0.0% 0.0%
Reduction in markdown -0.2% -0.5% -0.3% 0.9% 0.0% 0.2% 0.0% 0.0% 0.0%
Other provisions 0.0% -0.2% 0.0% 0.0% 0.0% 0.0% 0.0% 0.0% 0.0%Decrease in bad debt -0.6% 2.7% 0.0% 0.7% 0.6% 0.4% 0.4% 0.4% 0.4%
Increase in service charge income 1.5% 0.4% 0.2% -0.3% -0.6% -0.9% -1.0% -1.0% -1.0%Warehouse and distribution 3.3% 0.7% -0.3% 1.0% 1.0% -0.7% -0.5% -0.5% -0.4%Decrease (Increase) in central overheads 0.5% -1.9% 0.0% -0.2% 0.4% 0.8% 0.5% 0.5% 0.5%
Other factors 0.0% 0.0% 0.0% 0.0% 0.0% 0.0% 0.0% 0.0% 0.0%
Closing margin 18.6% 20.6% 19.3% 21.0% 23.7% 24.1% 23.5% 22.9% 22.4%

34
Europe Equity Research24 April 2012
Gillian Hilditch, CFA(44-20) [email protected]
The cash generative nature of the group has also allowed it to consistently buyback shares. In FY11 and FY12 it purchased £222m and £291m of shares respectively,contributing 7.5% to EPS growth in FY11 and 6% in FY12. Going forward we forecast buybacks of £200m pa out to FY15 (FY13 guidance is for between £140m and £200m). This level of buyback, combined with the dividend is fully covered by FCF out to 2015 (average FCF cover over the period of 1.0x versus 0.8x in FY12). However, ultimately we would expect to see a convergence in the P&L and cashflow over the longer term and hence 10% growth in the dividend, combined with a substantial buyback, is not sustainable on a long term basis if profits deteriorate.
In line with our assumption that the majority of FCF going forward is returned to shareholders (through a combination of dividend payments and buybacks) we therefore expect a relatively small reduction in net debt over the 3 years to FY15 of £51m to £524m (from £575m in FY12). In this scenario the net debt/ EBITDA ratio remains comfortable at c.0.8x over the period (in line with FY12 levels).
Debt facilities robust
In FY12 Next renewed its medium term bank facilities (supported by a syndicate of 6 banks) and issued a new 10 year £325m bond (as well as buying back £158m existing bond debt). The group’s current facilities and corporate debt are detailed below:
£85m of 2013 bonds
£213m of 2016 bonds
£325m of 2021 bonds
£300 committed bank facilities out to 2016
As is the case with the majority of retailers across our coverage Next has substantial off balance sheet debt in the form of operating leases. We estimate the capitalized leave value to be £633m. However, we would also note freehold property on the balance sheet at a carrying value as at January 2011 of £66m.
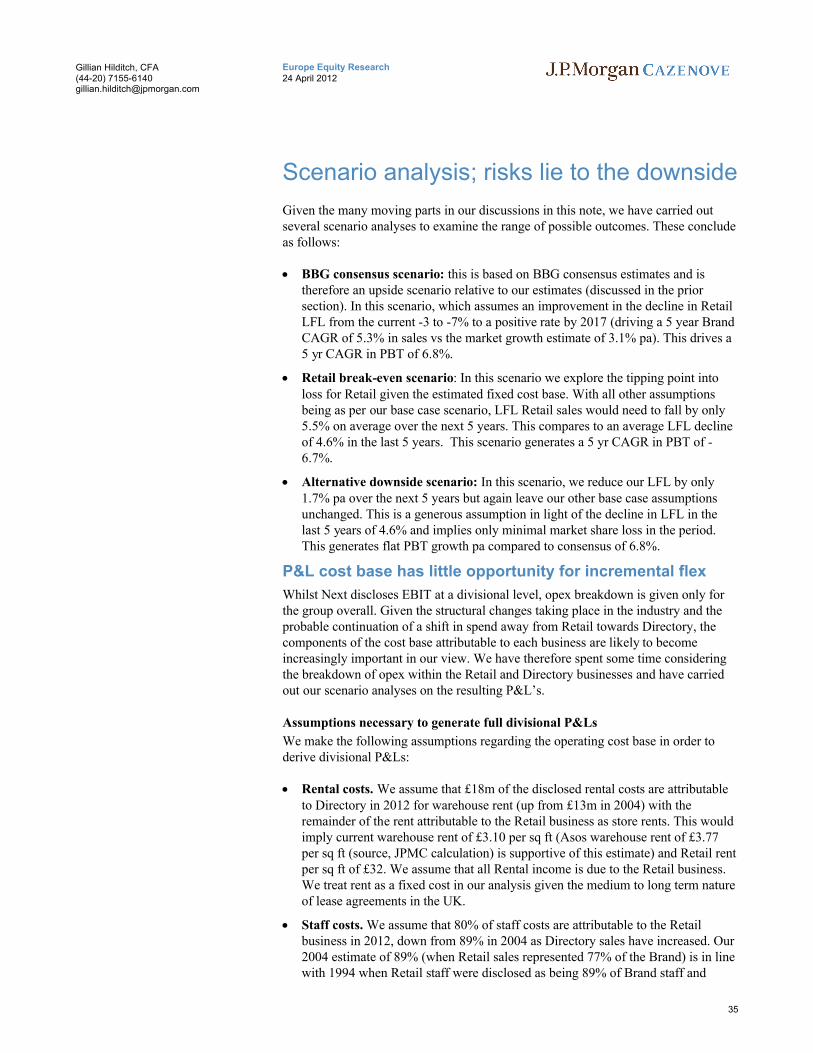
35
Europe Equity Research24 April 2012
Gillian Hilditch, CFA(44-20) [email protected]
Scenario analysis; risks lie to the downside
Given the many moving parts in our discussions in this note, we have carried out several scenario analyses to examine the range of possible outcomes. These conclude as follows:
BBG consensus scenario: this is based on BBG consensus estimates and is therefore an upside scenario relative to our estimates (discussed in the prior section). In this scenario, which assumes an improvement in the decline in Retail LFL from the current -3 to -7% to a positive rate by 2017 (driving a 5 year Brand CAGR of 5.3% in sales vs the market growth estimate of 3.1% pa). This drives a 5 yr CAGR in PBT of 6.8%.
Retail break-even scenario: In this scenario we explore the tipping point into loss for Retail given the estimated fixed cost base. With all other assumptions being as per our base case scenario, LFL Retail sales would need to fall by only 5.5% on average over the next 5 years. This compares to an average LFL decline of 4.6% in the last 5 years. This scenario generates a 5 yr CAGR in PBT of -6.7%.
Alternative downside scenario: In this scenario, we reduce our LFL by only 1.7% pa over the next 5 years but again leave our other base case assumptions unchanged. This is a generous assumption in light of the decline in LFL in the last 5 years of 4.6% and implies only minimal market share loss in the period. This generates flat PBT growth pa compared to consensus of 6.8%.
P&L cost base has little opportunity for incremental flex
Whilst Next discloses EBIT at a divisional level, opex breakdown is given only for the group overall. Given the structural changes taking place in the industry and the probable continuation of a shift in spend away from Retail towards Directory, the components of the cost base attributable to each business are likely to become increasingly important in our view. We have therefore spent some time considering the breakdown of opex within the Retail and Directory businesses and have carried out our scenario analyses on the resulting P&L’s.
Assumptions necessary to generate full divisional P&Ls
We make the following assumptions regarding the operating cost base in order to derive divisional P&Ls:
Rental costs. We assume that £18m of the disclosed rental costs are attributable to Directory in 2012 for warehouse rent (up from £13m in 2004) with the remainder of the rent attributable to the Retail business as store rents. This would imply current warehouse rent of £3.10 per sq ft (Asos warehouse rent of £3.77 per sq ft (source, JPMC calculation) is supportive of this estimate) and Retail rent per sq ft of £32. We assume that all Rental income is due to the Retail business. We treat rent as a fixed cost in our analysis given the medium to long term nature of lease agreements in the UK.
Staff costs. We assume that 80% of staff costs are attributable to the Retail business in 2012, down from 89% in 2004 as Directory sales have increased. Our 2004 estimate of 89% (when Retail sales represented 77% of the Brand) is in line with 1994 when Retail staff were disclosed as being 89% of Brand staff and
36
Europe Equity Research24 April 2012
Gillian Hilditch, CFA(44-20) [email protected]
Retail sales were 80% of the total. We treat staff costs as variable in our analysis. We allocate pension costs according to our assumed Brand staff percentage;however, we treat this as a fixed cost.
Depreciation. We allocate depreciation according the divisional contribution to Brand sales in the year.
Other costs (distribution, marketing and utilities). We attribute the undisclosed remainder of costs to marketing, distribution and utilities.
We split marketing costs between both Retail and Directory with the majority being allocated to the latter given the Directory book. We assume distribution costs are in the region of 7% of Brand sales (in line with the variable cost portion of Asos’ warehouse costs) and we attribute just over half to the Retail business. We assume that utility costs are fixed (given the medium to long term nature of leases in the UK) and that marketing and distribution costs are variable.
Service income and bad debt charge. We attribute this to Directory and treat it as variable.
We allocate share based payments and central costs (both of which we treat as fixed) according to the annual Brand EBIT contribution from each division.
BBG consensus scenarioThe base case scenario we have used is based on consensus estimates rather than on our own existing assumptions, as we are already lower than the market and we believe that flexing the consensus case will have a greater impact. We would note, however, that we consider the base case scenario to be a relatively optimistic one, building in a macro recovery.
We make the following assumptions in our base case scenario:
Retail space growth. We assume space +4% pa to 2017E.
Directory top line. FY13E growth of +9% (in line with guidance of high single digit). We assume that the growth rates drops to 7% thereafter and remains steady at 7% out to FY17E.
Retail LFL growth LFL Retail sales to decline by -4.1% in FY13E (NB this is at the top of the indicative LFL range implied by management of -4% to -7% and is the main difference between our estimates and consensus (we have -5.5%). We then have a decline of 1.4% in FY14E, +0.7% in FY15E and +3.5% in FY16E This seems an incredibly positive assumption given the track record of the last 5 years in which retail LFL has averaged -4.6%.
Gross margin. Remains flat at FY12 levels on a divisional basis. We would note that dependent on the scenario this could generate a small gross margin move at a Brand level (dependent on the relative divisional growth rates given the margin differential).
Brand sales growth. The combination of Retail and Directory growth detailed above gives a 5 year CAGR in Brand sales of 5.3% significantly above the historic 5 year average of +1.6%).
Store rents. We conservatively assume growth of +1.5% pa in line with the current underlying rate across the portfolio on average plus a further 4% increasepa to reflect the space increase.
Consensus estimates imply 5 year Brand sales CAGR of
+5.3%, which seems unlikely in
the context of a challenged Retail business

37
Europe Equity Research24 April 2012
Gillian Hilditch, CFA(44-20) [email protected]
Retail staff costs. We assume that Retail FTE’s per sq ft remain at the 2012 level of 3.0 (JPMC estimate) and that the average annual Retail wage grows by +2.5% in FY13E in line with guidance and then 1.5% thereafter.
Directory staff costs. We conservatively assume that Directory staff costs trend down by 10bps pa as a percentage of sales over the 5 years to FY17 driven by some efficiencies as the business continues to transition to internet.
Marketing and distribution. We assume that Retail marketing and distribution costs fall by 80bps as a percentage of sales over the next 5 years. We assume that Directory marketing and distribution costs trend down as a percentage of sales by 140bps over the 5 years to FY17 as relative demand for the book reduces somewhat.
Depreciation. We assume this grows by 1% in both FY13 and FY14, but remains flat thereafter given the lower capex spend versus historic levels.
Pension. We assume this grows by 1% in both FY13 and FY14 but remains flat thereafter.
Central costs. We assume growth of 1% pa.
Service income and bad debt charge. We assume that this grows at a third of the rate of Directory sales (as new customers are, in the main, Retail customers who have traditionally paid cash with order).
We conservatively assume that warehouse rent and share-based payments remain flat in absolute terms.
These assumptions result in the following scenario, which gives us PBT in line with the current consensus estimates and a 5 year CAGR in PBT of 6.8% pa. This is significantly ahead of the historic 5 year CAGR in PBT, which was +3.6% (FY2007-2012).
Table 12: BBG consensus scenario summary
Base case (2013-15E in line with consensus)
2012 2013E 2014E 2015E 2016E 2017ERetail LFL -5.7% -4.1% -1.4% 0.7% 3.5% 2.2%Implied u/l Brand LFL 0.9% 0.2% 1.6% 3.0% 4.8% 4.0%Retail sales (£m) 2,191 2,189 2,246 2,352 2,528 2,685 Directory sales (£m) 1,089 1,187 1,270 1,359 1,454 1,555 Brand sales (£m) 3,280 3,376 3,516 3,710 3,982 4,240 Retail EBIT (£m) 323 295 290 303 348 382Directory EBIT (£m) 263 314 346 372 400 430Brand EBIT (£m) 586 608 636 675 748 812Brand EBIT margin 17.9% 18.0% 18.1% 18.2% 18.8% 19.1%PBT (£m) 570 589 617 655 728 7915-year CAGRRetail sales 4.1%Brand sales 5.3%PBT 6.8%
Source: J.P. Morgan estimates, Company data.
Retail break-even scenario
In our retail break-even scenario, we explore the tipping point into loss given the estimated fixed cost base.
Tipping point into Retail loss; 5-year CAGR in Brand sales of -
0.6%

38
Europe Equity Research24 April 2012
Gillian Hilditch, CFA(44-20) [email protected]
The key assumption here is to assume a persistently weak LFL in Retail (we begin with the bottom of the range for FY13E of -7% and assume a slight improvement in trend on an underlying basis throughout the period to 2017E). This is offset at Group level by strong and consistent growth in Directory (+9% in FY13E, +7% thereafter) to drive a broadly flat Brand LFL on average over the period (-0.6%). This compares to an average for the Brand LFL of -1.3% in the prior 5 years, so while a worst case, this scenario is far from apocalyptic.
We have also reduced our space growth assumption from +4% pa over the entire period to +1% in FY15E and then flat thereafter.
This drives a marginally worse marketing ratio as we assume that management would spend on marketing to drive sales. The ratio increases by 130bp over the 5 year period. All other assumptions stay as in the base case scenario.
These assumptions result in a Retail EBIT of 0 in 2017E and a negative PBT 5-year CAGR of -6.7% and a cumulative fall in PBT of £167m between 2012 and 2017 to £403m.
Table 13: Scenario analysis: Retail EBIT goes to break even
Break-even Retail scenario2012 2013E 2014E 2015E 2016E 2017E
Retail LFL -5.7% -7.0% -6.2% -5.2% -5.0% -4.0%Implied u/l Brand LFL 0.9% -1.7% -1.5% -0.6% -0.1% 0.8%Retail sales (£m) 2,191 2,126 2,079 1,992 1,892 1,816 Directory sales (£m) 1,089 1,187 1,270 1,359 1,454 1,555 Brand sales (£m) 3,280 3,312 3,349 3,350 3,346 3,372 Retail EBIT (£m) 323 253 185 117 54 0Directory EBIT (£m) 263 308 333 361 391 424Brand EBIT (£m) 586 560 518 478 446 424Brand EBIT margin 17.9% 16.9% 15.5% 14.3% 13.3% 12.6%PBT (£m) 570 541 499 458 426 4035-year CAGRRetail sales -3.7%Brand sales 0.6%PBT -6.7%
Source: J.P. Morgan estimates, Company data.
We think this scenario is unlikely. Next’s management team is undoubtedly high quality and thus would likely take action before such a severe scenario is realized. Nevertheless, a CAGR in LFL Brand sales of -0.6% is not dramatic, highlighting the extent of the risk in our view, to both profits and also sentiment if the Retail profit came anywhere near close to loss.
Alternative Retail downside scenario
As discussed above a move to a break even position in Retail would likely be very negative for sentiment indeed, even if Directory sales compensated somewhat. Potentially, equally negative for sentiment, however, would be a decline of even 30% in Retail EBIT and the LFL threshold to reach that is much less dramatic.
In essence, if we assume an average decline in Retail LFL of a mere 1.7% in the next 5 years (vs a historic 5 year average of -4.6%) we see a scenario where Retail EBIT falls by 30%.
Despite a 5 year CAGR in Brand
sales of 1.7% Retail EBIT could
still fall by 30%

39
Europe Equity Research24 April 2012
Gillian Hilditch, CFA(44-20) [email protected]
Under this scenario, we also assume that Directory sales growth is commensurately slower (under the assumption that the two are inversely correlated; ie the rate of decline in Retail LFL would only slow if the Directory growth also slowed). This implies a flat Brand LFL over the period, implying some loss of market share for Next on a combined basis.
In this scenario our PBT is flat over a 5 year period, which would not, we believe be a bad outcome at the group level. However, the impact on sentiment of a 30% decline in Retail EBIT would we believe be significant.
Table 14: Scenario analysis; EBIT falls by 30% over 5 years
EBIT falls by 30% 2012 2013E 2014E 2015E 2016E 2017ERetail LFL -5.7% -2.9% -2.0% -1.5% -1.0% -1.0%Implied u/l Brand LFL 0.9% 1.0% 0.4% 0.1% 0.1% 0.1%Retail sales (£m) 2,191 2,216 2,260 2,271 2,248 2,226 Directory sales (£m) 1,089 1,187 1,246 1,283 1,309 1,335 Brand sales (£m) 3,280 3,402 3,506 3,555 3,557 3,561 Retail EBIT (£m) 323 306 290 271 249 227Directory EBIT (£m) 263 308 327 341 352 363Brand EBIT (£m) 586 614 617 612 601 590Brand EBIT margin 17.9% 18.0% 17.6% 17.2% 16.9% 16.6%PBT (£m) 570 594 598 592 581 5695-year CAGRRetail sales 0.3%Brand sales 1.7%PBT 0.0%
Source: J.P. Morgan estimates, Company data.

40
Europe Equity Research24 April 2012
Gillian Hilditch, CFA(44-20) [email protected]
Valuation
Next’s shares have risen by 49% since the beginning of 2011, outperforming the wider retail sector by 46%. This puts the shares on a PER of 12.3x, which is a premium to sector of 11.3%, reflecting the inherent investment attractions of its well regarded management team, resilient profit line, share buyback strategy and attractive cash flows and high ROIC.
ROICs
Figure 32: ROIC Comparison
Source: Company Data, JPMC estimates
The shares have historically been driven by earnings momentum and in 2011 benefited on a relative basis versus the rest of the sector which was delivering downgrades. This situation could reverse this year if Next holds estimates when everyone else upgrades.
Share price versus earnings revisions
Historically Next’s share price has been driven by earnings revisions. During the last two years, however, it has de-coupled somewhat as investors have favoured its relatively resilient earnings profile over the potential volatility of its peer group.
A possible explanation for this de-coupling is that Next shares have performed according to relative earnings revisions versus the wider sector, rather than absolute revisions of its own earnings estimates. That is, in 2011estimates for Next experienced an effective upgrade relative to peers as we saw estimates across the sector consistently revised down throughout the year (for example, consensus expectations at the start of CY 2011 were for Retail sector earnings growth of +12%versus realised sector growth of +4.3%). Looking ahead, if we are correct in our sector view that estimates across the peer group now look sensibly based with upside risk to CY13 (from the combination an improving consumer macro and high operational gearing), the opposite scenario could occur. That is, in the absence of upgrades to Next estimates versus the wider sector, the share could de-rate on a relative basis.
0.00%
5.00%
10.00%
15.00%
20.00%
25.00%
30.00%
We believe Next’s shares have
been driven by its relative
earnings revisions over the last year or so; this implies that with
the opposite scenario now more
likely, we could see the shares de-rate

41
Europe Equity Research24 April 2012
Gillian Hilditch, CFA(44-20) [email protected]
Figure 33: Share price versus earnings revisions
Source: Bloomberg
Discounted economic profit analysis allows us to better assess Next’s long-term prospects
Given the focus on the cash generation and superior ROIC of the Next business (25.8% fully adjusted), we believe it appropriate to examine the business on a discounted economic profit and discounted cash flow basis. Both analyses examine the future earnings stream of a business with the discounted present value of the future free cash flows equating to the discounted present value of the economic profit generated by the business. The economic profit being equivalent to the EBIT adjusted to a cash based net operating profit after taxes (NOPLAT) less a capital charge for invested capital (WACC x Invested Capital). Most notably in our three stage hold and fade discounted economic profit analysis, we have capitalised up Next's operating leases and included the capitalised value in our invested capital, while also adding the lease charge back on to our EBIT in the NOPLAT calculation.
Our key assumptions are as follows:
During the explicit period (3 years) we have utilized our existing estimates for turnover, NOPLAT and invested capital. We can see from this that we expect Next to deliver turnover growth of sub 1%, an invested capital decline of 2% (this tallies with management’s indications that depreciation will run at slightly more than capex over the next 2/3 years) and a pre-tax margin, which is falling by 60bp pa (see Outlook section for more detail) from its very high level.
A semi-explicit (hold) period also of 3 years during which time invested capital is flat (with depreciation matching capex), turnover continues to decline at a slightly higher rate of -2-3% and pre-tax margin continues to drop by 60bp pa.
A fade period of 10 years over which Next’s current very high ROIC converges with its estimated cost of capital of 8%. During this period turnover continues to fall by 2% pa, while pre-tax margin also declines by c. 80bp pa in the early years accelerating in later years to reach a level of 8.2% - approximately half of the level expected at the end of the semi-explicit period and actually broadly in line with that delivered by many clothing peers. This move may seem extreme, but should be considered within the context of the scenario analysis and in the context of the relatively benign turnover forecasts (ie., we believe the margin sacrifice protects the turnover).
-8.0%
-6.0%
-4.0%
-2.0%
0.0%
2.0%
4.0%
6.0%
8.0%
10.0%
-25.00%-20.00%-15.00%-10.00%-5.00%0.00%5.00%
10.00%15.00%20.00%25.00%30.00%
Feb
-05
May
-05
Aug
-05
Nov
-05
Feb
-06
May
-06
Aug
-06
Nov
-06
Feb
-07
May
-07
Aug
-07
Nov
-07
Feb
-08
May
-08
Aug
-08
Nov
-08
Feb
-09
May
-09
Aug
-09
Nov
-09
Feb
-10
May
-10
Aug
-10
Nov
-10
Feb
-11
May
-11
Aug
-11
Nov
-11
Feb
-12
% c
hg in
EP
S e
st.
% c
hg in
Nex
t Sha
re P
rice
Next EPS Ests.
We have capitalized Next’s lease debt in our analysis of ROIC

42
Europe Equity Research24 April 2012
Gillian Hilditch, CFA(44-20) [email protected]
We use a WACC of 8%
We use an average lease length of 8 years and a yield of 6% to capitalize our leases, giving an overall implicit capitalized lease value of £633m
Table 15: Discounted economic profit analysis vs discounted cash flow
Discounted economic profit £m Discounted cash flow £mPV of economic profit 1,985 PV of operating free cash flows 4,163PV of tax shield 68 PV of tax shield 68Opening invested capital 2,177Appraised value of the enterprise 4,231 4,231Value of non-core assets 0 Value of non-core assets 0Value of debt -1,208 Value of debt -1,208Value of minorities 0 Value of minorities 0Appraised value of the equity 3,023 Appraised value of the equity 3,023Number of shares (m) 180 Number of shares (m) 180Appraised share price (p) 16.76 Appraised share price (p) 16.76Current share price (p) 29.54 Current share price (p) 29.54Upside/(downside) -43.2% Upside/(downside) -43.2%
Source: J.P. Morgan estimates, Company data.
Figure 34: Discounted economic profit analysis illustrated
Source: J.P. Morgan estimates, Company data.
Table 16: Sensitivity of fair value to fade and cost of capital assumptions
5 years 10 years 20 years6.0% 19.76 21.56 24.35 6.5% 18.41 20.13 22.74 7.0% 17.24 18.88 21.31 7.5% 16.20 17.76 20.04 8.0% 15.28 16.76 18.90 8.5% 14.44 15.86 17.86 9.0% 13.69 15.04 16.91 9.5% 13.00 14.29 16.05
Source: J.P. Morgan estimates, Company data.
Our discounted economic profit analysis returns a value of £16.76 per share, a discount of 43% to the current share price (Table 13). While we are comfortable in our estimates and assumptions, this seems quite aggressive (Table 12: also shows the sensitivity of our model to changes in the fade period and cost of capital) and it may well be more appropriate to use a 20 year fade period, albeit this seems overly generous in the context of the rapidly changing competitive and structural environment within apparel retail.
10
100
1000
0.0%
5.0%
10.0%
15.0%
20.0%
25.0%
30.0%
35.0%
2013
2016
2019
2022
2025
2028
£m
Cos
t of e
quity
/RO
IC
IC (RHS) T/over (RHS) ROIC Cost of capital
Our analysis returns an implied fair value of £16.76; doubling our
fade period to 20 years would
increase this by c. 13% to £18.90 – still well below the current
share price

43
Europe Equity Research24 April 2012
Gillian Hilditch, CFA(44-20) [email protected]
This would still return an implied value significantly below the current share price and hence we have also approached the valuation from the opposite direction i.e. by assessing the level of growth or length of superior returns implied by the current share price.
Growth implied by current valuation (2921p as at April 16)
Working back from the current valuation, we can see the following key assumptions need to be made:
Post the explicit forecast period, turnover remains consistently at +1% for the 13 years hold and fade period.
Pre-tax margin remains at 18.5% in line with the level we expect at the end of the 3 year explicit period despite the pressures on margin discussed in the outlook and scenario section.
This allows Next to generate a ROIC significantly above its cost of capital indefinitely (Figure 35) despite the absence of a unique proprietary product or indeed any evidence from other apparel players that it is possible to earn such super-normal returns within apparel for an indefinite period of time.
Figure 35: Discounted economic profit progress implied by current share price
Source: J.P. Morgan estimates, Company data.
This seems an unlikely scenario for the reasons given above, and it seems more likely that the most probable outcome lies somewhere in between the two valuations, although we would stress that our initial estimate of £16.76 is based on our existing forecasts not on the downside outcomes possible if the market were to move to free delivery.
Given the wide range of estimates and the number of moving parts in the business, we have carried out the discounted economic profit exercise for our three scenarios (see scenario section). We have then equally weighted all three of these possible outcomes together with the valuation driven by our current estimates and discussed above. This returns a per share value of £20.39, which we adopt as our 12M TP. This is 33% discount to the current share price.
Table 17: Probability weighted discounted economic profit
Implied value ProbabilityBBG base case 32.87 20%Retail break even 14.67 15%30% downside in Retail 21.57 15%JPMC base case 16.76 50%Implied equal weighted implied value (p) 20.39
Source: J.P. Morgan estimates, Company data.
10
100
1000
0.0%
5.0%
10.0%
15.0%
20.0%
25.0%
30.0%
35.0%
2013
2016
2019
2022
2025
2028
£m
Cos
t of e
quity
/RO
IC
IC (RHS) T/over (RHS) ROIC Cost of capital
To justify the current share price we need to assume that Next is
able to generate its current
extremely high ROIC indefinitely

44
Europe Equity Research24 April 2012
Gillian Hilditch, CFA(44-20) [email protected]
Valuation versus peers
We consider the closest peers to Next to be Marks & Spencer (similar geographic exposure to the relatively mature UK clothing market) and Kingfisher. Whilst in the latter case the product categories and geographic exposure is different, both have highly respected management teams, robust balance sheets and are regarded as top quality stocks within in the UK sector. Whilst we have included the European retailers for comparative purposes, the substantial roll-out potential and more diverse geographic exposure of these stocks means that we would not include them in Next’s core peer group. We have also included Debenhams, which in terms of customer demographic offers a good degree of overlap with Next.
Next’s free cash flow yield is impressive and is the highest amongst the large cappeer group (Debenhams offers a FCF yield 50bps ahead of Next in CY12E), but on all other metrics both Kingfisher, M&S and Debenhams appear better value. On the key valuation measures of PE and EV/EBITDA in particular Next is expensiveversus the UK peer group trading at a 18% and 26% premium respectively for CY12and 27% and 35% for CY13. Furthermore, on a PEG basis Next is trading on 4.4x, albeit on our bottom of the range estimates for 2 year EPS CAGR of +2.8%, highlighting the limited growth potential versus peers on an underlying basis.
Figure 36: Forward PER Comparison
Source: Datastream
We therefore consider that to still be appropriate and would highlight in particular its relationship to Kingfisher, which has superior earnings growth (c. 13.7% pa). While we accept Next has considerable cash generation attractions as well as the support ofa buyback, Kingfisher also appears to be building up a cash pile and could in theory return cash to shareholders in future. Next has an expected 2 year CAGR in EPS of only 2.8%, which is less than the UK peer group average of c.8%.
Table 18: Peer Group Comparison
Source: Company Data, JPMC estimates (priced 20/04/2012)
0
5
10
15
20
25
30
Jan
87
Dec
87
Nov
88
Oct
89
Sep
90
Aug
91
Jul 9
2
Jun
93
May
94
Apr
95
Mar
96
Feb
97
Jan
98
Dec
98
Nov
99
Oct
00
Sep
01
Aug
02
Jul 0
3
Jun
04
May
05
Apr
06
Mar
07
Feb
08
Jan
09
Dec
09
Nov
10
Oct
11
Next Forward PER Kingfisher Forward PER Marks & Spencer Forward PER
PEG EPS CAGR Net debt/ EBITDA
CY12 CY13 CY12 CY13 CY12 CY13 CY12 CY13 CY11-13 FY12
H&M 22.0 20.1 2.4 13.8 12.8 3.8% 3.8% 4.4% 4.6% 8.5% -0.5
Inditex 20.1 18.2 1.7 10.6 9.7 4.3% 5.2% 2.7% 3.0% 10.8% -1.3
Debenhams 8.4 7.1 0.6 5.1 4.6 8.3% 12.5% 3.9% 4.6% 12.0% 1.4
Kingfisher 10.9 9.6 0.7 5.8 5.2 4.4% 6.4% 3.3% 3.8% 13.7% -0.1
M&S 10.1 9.7 1.9 5.6 5.4 5.9% 3.1% 4.6% 4.9% 5.1% 1.5
Next 12.3 12.2 4.4 7.7 7.8 7.8% 7.9% 3.2% 3.6% 2.8% 0.8
Average 14.0 12.8 1.9 8.1 7.6 5.8% 6.5% 3.7% 4.1% 8.8% 0.3
UK average 10.5 9.7 1.9 6.0 5.8 6.6% 7.5% 3.8% 4.2% 8.4% 0.9
Next vs. UK average 18.1% 26.7% 132.3% 26.9% 35.8% 1.2% 0.4% -0.5% -0.7% -5.6% -11.9%
PE EV/EBITDA FCF yield Dividend yield
M&S and Kingfisher represent
Next’s closest peers
Next is the most expensive stock
within the peer group

45
Europe Equity Research24 April 2012
Gillian Hilditch, CFA(44-20) [email protected]
Appendix – online clothing growth
Online clothing growth has outperformed the rest of online…
While the growth in online has been the subject of much discussion over the last decade or more, it is only really in the last couple of years that the channel's penetration into the clothing segment has accelerated. Online clothing sales have grown at a faster pace than other segments of retail over the last 11 years (49.4% pa vs 28% for all online) and c. 10.6% of all clothing sales are now online representing a surprising 26.4% share of the £27bn online retail market in the UK (Source: Verdict).
Figure 37: Clothing and Footwear Sales as % of Total Online Market
Source: Verdict
Figure 38: Share of the non-food online market 2011
Source: J.P. Morgan estimates, Verdict
….and is expected to continue to do so
This growth is likely only set to continue. Retail forecasters Verdict estimate an average annual growth rate of 20% between 2010 and 2015 vs. the non-food average of 10%. This should take the total market value to £9.1bn by 2015, representing online penetration of c. 21%.
0.0%
5.0%
10.0%
15.0%
20.0%
25.0%
2000
2001
2002
2003
2004
2005
2006
2007
2008
2009
2010
2011
E
2012
E
2013
E
2014
E
2015
E0.0%5.0%
10.0%15.0%20.0%25.0%30.0%35.0%40.0%45.0%
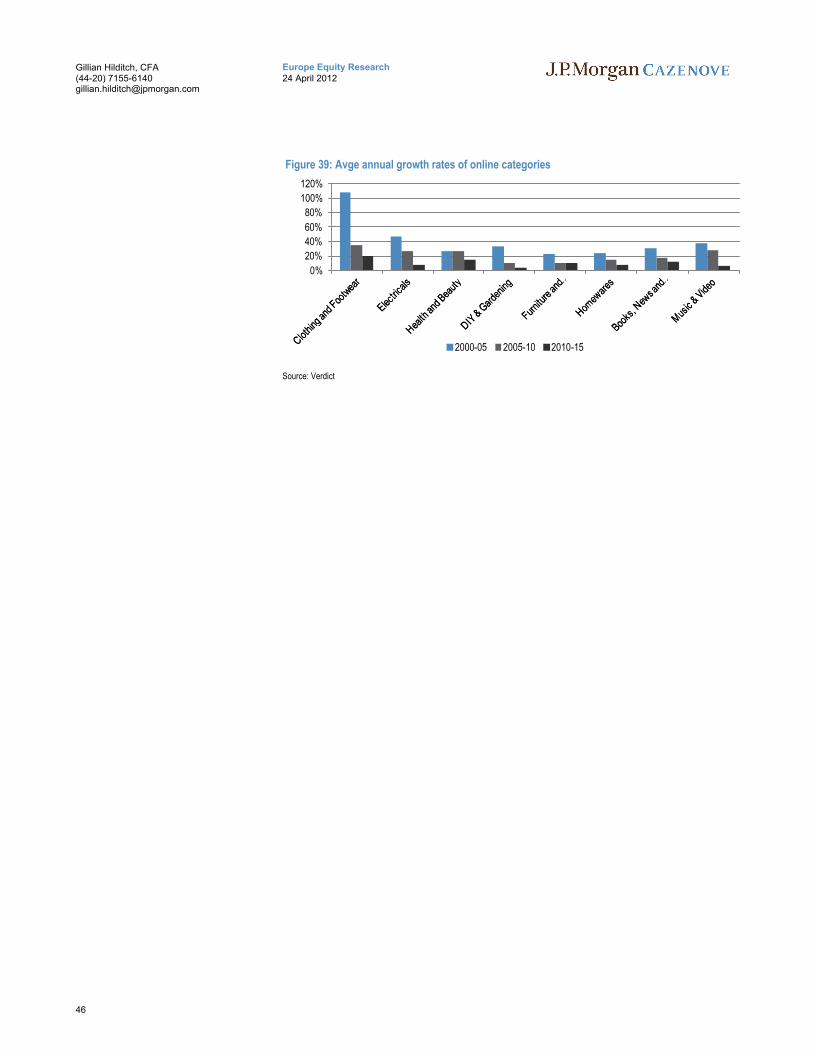
46
Europe Equity Research24 April 2012
Gillian Hilditch, CFA(44-20) [email protected]
Figure 39: Avge annual growth rates of online categories
Source: Verdict
0%
20%
40%
60%
80%
100%
120%
2000-05 2005-10 2010-15
47
Europe Equity Research24 April 2012
Gillian Hilditch, CFA(44-20) [email protected]
Valuation Methodology and Risks
Next Plc (Underweight Price Target: 2,039p)
Investment Thesis
Our long term negative view on the stock is driven by our belief that Next is likely to experience increasing pressure both on the top line and margin in the coming years as online competition grows and the apparel market shifts increasingly to a free deliverymodel. Next is trading at a premium to the sector on a CY12E PER of 12.3x and a PEG of 4.4x (albeit on our bottom of the range estimates) highlighting the limited growth potential versus peers.
Valuation Methodology :
We have upgraded our 12M TP for Next from 1,948p to 2039p. Our new TP is based on a probability weighted blended average of 4 different discounted economic profit models – each based on a different scenario.
Risks to Our View :
We perceive the following risks to achieving our price target and our Underweight rating: 1) better pricing power than we expect could result in a better than anticipated ability to pass through price increases and hence higher LFL sales growth; 2) Next accelerates the expansion of its Lipsy brand in the UK; 3) better management of markdown risk in the face of market uncertainties; and 4) Next generates greater cost savings than anticipated resulting in higher earnings than forecast.

48
Europe Equity Research24 April 2012
Gillian Hilditch, CFA(44-20) [email protected]
JPM Q-ProfileNext PLC (BRITAIN / Consumer Discretionary)As Of: 13-Apr-2012 [email protected]
Local Share Price Current: 29.50 12 Mth Forward EPS Current: 2.72
Earnings Yield (& local bond Yield) Current: 9% Implied Value Of Growth* Current: -27.38%
PE (1Yr Forward) Current: 10.9x Price/Book Value Current: 22.4x
ROE (Trailing) Current: 190.90 Dividend Yield (Trailing) Current: 3.02
Summary
Next PLC 7888.02 As Of:
BRITAIN 32.8578 SEDOL 3208986 Local Price: 29.50
Consumer Discretionary Multiline Retail EPS: 2.72
Latest Min Max Median Average 2 S.D.+ 2 S.D. - % to Min % to Max % to Med % to Avg12mth Forward PE 10.86x 6.07 21.07 12.39 12.87 19.40 6.35 -44% 94% 14% 19%P/BV (Trailing) 22.35x -55.15 48.61 6.68 8.62 50.17 -32.92 -347% 117% -70% -61%
Dividend Yield (Trailing) 3.02 1.97 5.76 2.96 3.12 4.62 1.62 -35% 91% -2% 3%
ROE (Trailing) 190.90 24.00 1335.10 117.70 245.82 939.28 -447.63 -87% 599% -38% 29%
Implied Value of Growth -27.4% -0.84 0.57 0.17 0.08 0.75 -0.58 -206% 310% 161% 131%
Source: Bloomberg, Reuters Global Fundamentals, IBES CONSENSUS, J.P. Morgan Calcs * Implied Value Of Growth = (1 - EY/Cost of equity) where cost of equity =Bond Yield + 5.0% (ERP)
13-Apr-12
-0.50
0.00
0.50
1.00
1.50
2.00
2.50
3.00
Mar
/97
Oct
/97
May
/98
Dec
/98
Jul/9
9
Feb
/00
Sep
/00
Apr
/01
Nov
/01
Jun/
02
Jan/
03
Aug
/03
Mar
/04
Oct
/04
May
/05
Dec
/05
Jul/0
6
Feb
/07
Sep
/07
Apr
/08
Nov
/08
Jun/
09
Jan/
10
Aug
/10
Mar
/11
Oct
/11
0%
2%
4%
6%
8%
10%
12%
14%
16%
18%
Mar
/97
Oct
/97
May
/98
Dec
/98
Jul/9
9
Feb
/00
Sep
/00
Apr
/01
Nov
/01
Jun/
02
Jan/
03
Aug
/03
Mar
/04
Oct
/04
May
/05
Dec
/05
Jul/0
6
Feb
/07
Sep
/07
Apr
/08
Nov
/08
Jun/
09
Jan/
10
Aug
/10
Mar
/11
Oct
/11
12Mth fwd EY US BY Proxy
0.00
5.00
10.00
15.00
20.00
25.00
30.00
35.00
Mar
/97
Oct
/97
May
/98
Dec
/98
Jul/9
9
Feb
/00
Sep
/00
Apr
/01
Nov
/01
Jun/
02
Jan/
03
Aug
/03
Mar
/04
Oct
/04
May
/05
Dec
/05
Jul/0
6
Feb
/07
Sep
/07
Apr
/08
Nov
/08
Jun/
09
Jan/
10
Aug
/10
Mar
/11
Oct
/11
-1.00
-0.80
-0.60
-0.40
-0.20
0.00
0.20
0.40
0.60
0.80
1.00
Mar
/97
Oct
/97
May
/98
Dec
/98
Jul/9
9
Feb
/00
Sep
/00
Apr
/01
Nov
/01
Jun/
02
Jan/
03
Aug
/03
Mar
/04
Oct
/04
May
/05
Dec
/05
Jul/0
6
Feb
/07
Sep
/07
Apr
/08
Nov
/08
Jun/
09
Jan/
10
Aug
/10
Mar
/11
Oct
/11
0.0x
5.0x
10.0x
15.0x
20.0x
25.0x
Mar
/97
Oct
/97
May
/98
Dec
/98
Jul/9
9
Feb
/00
Sep
/00
Apr
/01
Nov
/01
Jun/
02
Jan/
03
Aug
/03
Mar
/04
Oct
/04
May
/05
Dec
/05
Jul/0
6
Feb
/07
Sep
/07
Apr
/08
Nov
/08
Jun/
09
Jan/
10
Aug
/10
Mar
/11
Oct
/11
-80.0x
-60.0x
-40.0x
-20.0x
0.0x
20.0x
40.0x
60.0x
Mar
/97
Oct
/97
May
/98
Dec
/98
Jul/9
9
Feb
/00
Sep
/00
Apr
/01
Nov
/01
Jun/
02
Jan/
03
Aug
/03
Mar
/04
Oct
/04
May
/05
Dec
/05
Jul/0
6
Feb
/07
Sep
/07
Apr
/08
Nov
/08
Jun/
09
Jan/
10
Aug
/10
Mar
/11
Oct
/11
PBV hist PBV Forward
0.00
200.00
400.00
600.00
800.00
1,000.00
1,200.00
1,400.00
1,600.00
Mar
/97
Oct
/97
May
/98
Dec
/98
Jul/9
9
Feb
/00
Sep
/00
Apr
/01
Nov
/01
Jun/
02
Jan/
03
Aug
/03
Mar
/04
Oct
/04
May
/05
Dec
/05
Jul/0
6
Feb
/07
Sep
/07
Apr
/08
Nov
/08
Jun/
09
Jan/
10
Aug
/10
Mar
/11
Oct
/11
0.0
1.0
2.0
3.0
4.0
5.0
6.0
7.0
Mar
/97
Oct
/97
May
/98
Dec
/98
Jul/9
9
Feb
/00
Sep
/00
Apr
/01
Nov
/01
Jun/
02
Jan/
03
Aug
/03
Mar
/04
Oct
/04
May
/05
Dec
/05
Jul/0
6
Feb
/07
Sep
/07
Apr
/08
Nov
/08
Jun/
09
Jan/
10
Aug
/10
Mar
/11
Oct
/11

49
Europe Equity Research24 April 2012
Gillian Hilditch, CFA(44-20) [email protected]
Next Plc: Summary of FinancialsProfit and Loss Statement Cash flow statement
£ in millions, year end Jan FY11 FY12 FY13E FY14E FY15E £ in millions, year end Jan FY11 FY12 FY13E FY14E FY15E
Revenues 3,454 3,506 3,514 3,541 3,566 EBIT 584 607 605 585 564
% change Y/Y 1.4% 1.5% 0.2% 0.8% 0.7% Depreciation & amortisation 119 120 120 120 120Gross Margin (%) 52.0% 52.5% 52.4% 52.3% 52.3% Change in working capital (77) (69) (56) (14) (14)EBITDA 703 727 724 705 684 Taxes (142) (144) (135) (130) (125)
% change Y/Y 6.3% 3.4% -0.3% -2.6% -2.9% Cash flow from operations 626 657 668 691 671EBITDA Margin (%) 20.3% 20.7% 20.6% 19.9% 19.2%
EBIT 584 607 605 585 564 Capex (140) (135) (115) (115) (115)
% change Y/Y 8.4% 4.1% -0.4% -3.2% -3.5% Net interest - - - - -EBIT Margin (%) 16.9% 17.3% 17.2% 16.5% 15.8% Free cash flow 223 333 351 378 363
Net Interest (23) (28) (28) (28) (28) Disposal/ (purchase) 2 65 - - -Earnings before tax 551 570 561 542 521
% change Y/Y 9.1% 3.4% -1.6% -3.5% -3.8% Equity raised/ (repaid) (222) (291) (200) (200) (200)
Tax - - - - - Debt raised/ (repaid) - - - - -as % of EBT 27.3% 25.1% 24.0% 24.0% 24.0% Other - - - - -
Net Income (Reported) - - - - - Dividends paid (130) (135) (141) (147) (153)
% change Y/Y - - - - - Net cash flow 217 308 278 300 278Shares Outstanding 194.3 180.3 173.1 166.2 159.5EPS 206.43 237.05 246.44 247.82 248.31 DPS 78.00 90.00 99.00 108.90 119.79
% change Y/Y 17.3% 14.8% 4.0% 0.6% 0.2%
Balance sheet Ratio Analysis
£ in millions, year end Jan FY11 FY12 FY13E FY14E FY15E £ in millions, year end Jan FY11 FY12 FY13E FY14E FY15E
Cash and cash equivalents 49 56 66 98 107 Total number of stores - - - - -
Accounts receivable 549 603 615 627 640 LFL sales growth (%) -4.0% -5.7% -5.5% -6.0% -Inventories 368 372 381 384 386 Space growth (%) - - - - -Other current assets 10 10 10 10 10 EBIT Margin 16.9% 17.3% 17.2% 16.5% 15.8%
Current assets 1,067 1,140 1,171 1,218 1,242Adjusted EPS growth 17.3% 14.8% 4.0% 0.6% 0.2%
LT investments 5 6 6 6 6Net fixed assets 725 714 711 707 704 Interest coverage (x) 24.9 21.4 21.6 20.9 20.2Total assets 1,792 1,854 1,882 1,925 1,946 Dividend cover (x) - - - - -
Net debt to equity - - - - -Liabilities ROCE 58.9% 49.6% 46.9% 44.2% -Short term loans 10 8 8 8 8
Trade payables 170 87 87 87 87 PE 14.5 12.7 12.2 12.1 12.1Others - - - - - EV/EBITDA 8.4 8.1 8.2 8.4 8.7
Current liabilities 833 742 724 742 760 FCF Yield (%) - - - - -Pension liabilities 0 0 0 0 0 Dividend Yield (%) 2.6% 3.0% 3.3% 3.6% 4.0%Shareholders' equity - - - - -
Total liabilities 1,547 1,619 1,601 1,619 1,637BVPS 368 363 361 359 355
Source: Company reports and J.P. Morgan estimates.

50
Europe Equity Research24 April 2012
Gillian Hilditch, CFA(44-20) [email protected]
Analyst Certification: The research analyst(s) denoted by an “AC” on the cover of this report certifies (or, where multiple research analysts are primarily responsible for this report, the research analyst denoted by an “AC” on the cover or within the document individually certifies, with respect to each security or issuer that the research analyst covers in this research) that: (1) all of the views expressed in this report accurately reflect his or her personal views about any and all of the subject securities or issuers; and (2) no part of any of the research analyst's compensation was, is, or will be directly or indirectly related to the specific recommendations or views expressed by the research analyst(s) in this report.
Important Disclosures
Company-Specific Disclosures: Important disclosures, including price charts, are available for compendium reports and all J.P. Morgan–covered companies by visiting https://mm.jpmorgan.com/disclosures/company, calling 1-800-477-0406, or emailing [email protected] with your request.
Date Rating Share Price (p)
Price Target (p)
04-Apr-07 N 2286 2000
25-Jul-07 N 1842 2052
23-Aug-07 N 1886 2160
28-Aug-07 OW 1869 2160
20-Sep-07 OW 1935 2250
30-Oct-07 OW 2145 2400
17-Dec-07 OW 1602 2100
21-Jan-08 N 1300 1500
19-Mar-08 N 1179 1200
19-May-08 N 1284 1275
27-Jun-08 N 974 1100
17-Jul-08 N 922 1050
10-Sep-08 N 1143 1120
13-Oct-08 UW 948 1000
05-Nov-08 UW 1189 1025
22-Jan-09 UW 1098 1055
19-Mar-09 UW 1231 1050
29-Mar-09 UW 1255 1150
06-May-09 UW 1640 1400
01-Mar-10 OW 1875 --
04-Nov-10 UW 2133 2032
03-Mar-11 UW 1924 1620
04-May-11 UW 2319 1670
28-Sep-11 UW 2592 1948
The chart(s) show J.P. Morgan's continuing coverage of the stocks; the current analysts may or may not have covered it over the entire period. J.P. Morgan ratings: OW = Overweight, N= Neutral, UW = Underweight
Explanation of Equity Research Ratings and Analyst(s) Coverage Universe: J.P. Morgan uses the following rating system: Overweight [Over the next six to twelve months, we expect this stock will outperform the average total return of the stocks in the analyst's (or the analyst's team's) coverage universe.] Neutral [Over the next six to twelve months, we expect this stock will perform in line with the average total return of the stocks in the analyst's (or the analyst's team's) coverage universe.] Underweight [Over the next six to twelve months, we expect this stock will underperform the average total return of the stocks in the analyst's (or the analyst's team's) coverage universe.] In our Asia (ex-Australia) and UK small- and mid-cap equity research, each stock’s expected total return is compared to the expected total return of a benchmark country market index, not to those analysts’ coverage universe. If it does not appear in the Important Disclosures section of this report, the certifying analyst’s coverage universe can be found on J.P. Morgan’s research website, www.morganmarkets.com.
Coverage Universe: Hilditch, Gillian: ASOS (ASOS.L), Debenhams (DEB.L), Dunelm Group plc (DNLM.L), Halfords (HFD.L), Hennes & Mauritz (HMb.ST), Home Retail Group (HOME.L), Howden Joinery Group Plc (HWDN.L), Inchcape (INCH.L), Inditex (ITX.MC), Kingfisher Plc (KGF.L), Marks & Spencer (MKS.L), Mothercare (MTC.L), Next Plc (NXT.L)
0
754
1,508
2,262
3,016
3,770
4,524
5,278
Price(p)
Feb07
Nov07
Aug08
May09
Feb10
Nov10
Aug11
Next Plc (NXT.L, NXT LN) Price Chart
OW 2,160pOW 2,100pN 1,275pN 1,120pUW 1,055pUW 1,400p
N 2,160pOW 2,400pN 1,200pN 1,050pUW 1,025pUW 1,150p UW 1,670p
N 2,000pN 2,052pOW 2,250pN 1,500pN 1,100pUW 1,000pUW 1,050p OW UW 2,032pUW 1,620pUW 1,948p
Source: Bloomberg and J.P. Morgan; price data adjusted for stock splits and dividends.
Break in coverage Mar 01, 2010 - Nov 04, 2010.

51
Europe Equity Research24 April 2012
Gillian Hilditch, CFA(44-20) [email protected]
J.P. Morgan Equity Research Ratings Distribution, as of April 3, 2012
Overweight(buy)
Neutral(hold)
Underweight(sell)
J.P. Morgan Global Equity Research Coverage 45% 43% 12%IB clients* 51% 45% 34%
JPMS Equity Research Coverage 43% 48% 9%IB clients* 70% 61% 53%
*Percentage of investment banking clients in each rating category.For purposes only of FINRA/NYSE ratings distribution rules, our Overweight rating falls into a buy rating category; our Neutral rating falls into a hold rating category; and our Underweight rating falls into a sell rating category.
Equity Valuation and Risks: For valuation methodology and risks associated with covered companies or price targets for covered companies, please see the most recent company-specific research report at http://www.morganmarkets.com , contact the primary analyst or your J.P. Morgan representative, or email [email protected].
Equity Analysts' Compensation: The equity research analysts responsible for the preparation of this report receive compensation based upon various factors, including the quality and accuracy of research, client feedback, competitive factors, and overall firm revenues, which include revenues from, among other business units, Institutional Equities and Investment Banking.
Registration of non-US Analysts: Unless otherwise noted, the non-US analysts listed on the front of this report are employees of non-US affiliates of JPMS, are not registered/qualified as research analysts under NASD/NYSE rules, may not be associated persons of JPMS, and may not be subject to FINRA Rule 2711 and NYSE Rule 472 restrictions on communications with covered companies, public appearances, and trading securities held by a research analyst account.
Other Disclosures
J.P. Morgan ("JPM") is the global brand name for J.P. Morgan Securities LLC ("JPMS") and its affiliates worldwide. J.P. Morgan Cazenove is a marketing name for the U.K. investment banking businesses and EMEA cash equities and equity research businesses of JPMorgan Chase & Co. and its subsidiaries.
Options related research: If the information contained herein regards options related research, such information is available only to persons who have received the proper option risk disclosure documents. For a copy of the Option Clearing Corporation's Characteristics and Risks of Standardized Options, please contact your J.P. Morgan Representative or visit the OCC's website at http://www.optionsclearing.com/publications/risks/riskstoc.pdf
Legal Entities Disclosures U.S.: JPMS is a member of NYSE, FINRA, SIPC and the NFA. JPMorgan Chase Bank, N.A. is a member of FDIC and is authorized and regulated in the UK by the Financial Services Authority. U.K.: J.P. Morgan Securities Ltd. (JPMSL) is a member of the London Stock Exchange and is authorized and regulated by the Financial Services Authority. Registered in England & Wales No. 2711006. Registered Office 125 London Wall, London EC2Y 5AJ. South Africa: J.P. Morgan Equities Limited is a member of the Johannesburg Securities Exchange and is regulated by the FSB. Hong Kong: J.P. Morgan Securities (Asia Pacific) Limited (CE number AAJ321) is regulated by the Hong Kong Monetary Authority and the Securities and Futures Commission in Hong Kong. Korea: J.P. Morgan Securities (Far East) Ltd, Seoul Branch, is regulated by the Korea Financial Supervisory Service. Australia: J.P. Morgan Australia Limited (ABN 52 002 888 011/AFS Licence No: 238188) is regulated by ASIC and J.P. Morgan Securities Australia Limited (ABN 61 003 245 234/AFS Licence No: 238066) is a Market Participant with the ASX and regulated by ASIC. Taiwan: J.P.Morgan Securities (Taiwan) Limited is a participant of the Taiwan Stock Exchange (company-type) and regulated by the Taiwan Securities and Futures Bureau. India: J.P. Morgan India Private Limited, having its registered office at J.P. Morgan Tower, Off. C.S.T. Road, Kalina, Santacruz East, Mumbai - 400098, is a member of the National Stock Exchange of India Limited (SEBI Registration Number - INB 230675231/INF 230675231/INE 230675231) and Bombay Stock Exchange Limited (SEBI Registration Number - INB 010675237/INF 010675237) and is regulated by Securities and Exchange Board of India. Thailand: JPMorgan Securities (Thailand) Limited is a member of the Stock Exchange of Thailand and is regulated by the Ministry of Finance and the Securities and Exchange Commission. Indonesia: PT J.P. Morgan Securities Indonesia is a member of the Indonesia Stock Exchange and is regulated by the BAPEPAM LK. Philippines: J.P. Morgan Securities Philippines Inc. is a member of the Philippine Stock Exchange and is regulated by the Securities and Exchange Commission. Brazil: Banco J.P. Morgan S.A. is regulated by the Comissao de Valores Mobiliarios (CVM) and by the Central Bank of Brazil. Mexico: J.P. Morgan Casa de Bolsa, S.A. de C.V., J.P. Morgan Grupo Financiero is a member of the Mexican Stock Exchange and authorized to act as a broker dealer by the National Banking and Securities Exchange Commission. Singapore: This material is issued and distributed in Singapore by J.P. Morgan Securities Singapore Private Limited (JPMSS) [MICA (P) 088/04/2012 and Co. Reg. No.: 199405335R] which is a member of the Singapore Exchange Securities Trading Limited and is regulated by the Monetary Authority of Singapore (MAS) and/or JPMorgan Chase Bank, N.A., Singapore branch (JPMCB Singapore) which is regulated by the MAS. Malaysia: This material is issued and distributed in Malaysia by JPMorgan Securities (Malaysia) Sdn Bhd (18146-X) which is a Participating Organization of Bursa Malaysia Berhad and a holder of Capital Markets Services License issued by the Securities Commission in Malaysia. Pakistan: J. P. Morgan Pakistan Broking (Pvt.) Ltd is a member of the Karachi Stock Exchange and regulated by the Securities and Exchange Commission of Pakistan. Saudi Arabia: J.P. Morgan Saudi Arabia Ltd. is authorized by the Capital Market Authority of the Kingdom of Saudi Arabia (CMA) to carry out dealing as an agent, arranging, advising and custody, with respect to securities business under licence number 35-07079 and its registered address is at 8th Floor, Al-Faisaliyah Tower, King Fahad Road, P.O. Box 51907, Riyadh 11553, Kingdom of Saudi Arabia. Dubai: JPMorgan Chase Bank, N.A., Dubai Branch is regulated by the Dubai Financial Services Authority (DFSA) and its registered address is Dubai International Financial Centre - Building 3, Level 7, PO Box 506551, Dubai, UAE.
Country and Region Specific Disclosures U.K. and European Economic Area (EEA): Unless specified to the contrary, issued and approved for distribution in the U.K. and the EEA by JPMSL. Investment research issued by JPMSL has been prepared in accordance with JPMSL's policies for managing conflicts of interest arising as a result of

52
Europe Equity Research24 April 2012
Gillian Hilditch, CFA(44-20) [email protected]
publication and distribution of investment research. Many European regulators require a firm to establish, implement and maintain such a policy. This report has been issued in the U.K. only to persons of a kind described in Article 19 (5), 38, 47 and 49 of the Financial Services and Markets Act 2000 (Financial Promotion) Order 2005 (all such persons being referred to as "relevant persons"). This document must not be acted on or relied on by persons who are not relevant persons. Any investment or investment activity to which this document relates is only available to relevant persons and will be engaged in only with relevant persons. In other EEA countries, the report has been issued to persons regarded as professional investors (or equivalent) in their home jurisdiction. Australia: This material is issued and distributed by JPMSAL in Australia to "wholesale clients" only. JPMSAL does not issue or distribute this material to "retail clients". The recipient of this material must not distribute it to any third party or outside Australia without the prior written consent of JPMSAL. For the purposes of this paragraph the terms "wholesale client" and "retail client" have the meanings given to them in section 761G of the Corporations Act 2001. Germany: This material is distributed in Germany by J.P. Morgan Securities Ltd., Frankfurt Branch and J.P.Morgan Chase Bank, N.A., Frankfurt Branch which are regulated by the Bundesanstalt für Finanzdienstleistungsaufsicht. Hong Kong: The 1% ownership disclosure as of the previous month end satisfies the requirements under Paragraph 16.5(a) of the Hong Kong Code of Conduct for Persons Licensed by or Registered with the Securities and Futures Commission. (For research published within the first ten days of the month, the disclosure may be based on the month end data from two months prior.) J.P. Morgan Broking (Hong Kong) Limited is the liquidity provider/market maker for derivative warrants, callable bull bear contracts and stock options listed on the Stock Exchange of Hong Kong Limited. An updated list can be found on HKEx website: http://www.hkex.com.hk. Japan: There is a risk that a loss may occur due to a change in the price of the shares in the case of share trading, and that a loss may occur due to the exchange rate in the case of foreign share trading. In the case of share trading, JPMorgan Securities Japan Co., Ltd., will be receiving a brokerage fee and consumption tax (shouhizei) calculated by multiplying the executed price by the commission rate which was individually agreed between JPMorgan Securities Japan Co., Ltd., and the customer in advance. Financial Instruments Firms: JPMorgan Securities Japan Co., Ltd., Kanto Local Finance Bureau (kinsho) No. 82 Participating Association / Japan Securities Dealers Association, The Financial Futures Association of Japan, Type II Financial Instruments Firms Association and Japan Securities Investment Advisers Association. Korea: This report may have been edited or contributed to from time to time by affiliates of J.P. Morgan Securities (Far East) Ltd, Seoul Branch. Singapore: JPMSS and/or its affiliates may have a holding in any of the securities discussed in this report; for securities where the holding is 1% or greater, the specific holding is disclosed in the Important Disclosures sectionabove. India: For private circulation only, not for sale. Pakistan: For private circulation only, not for sale. New Zealand: This material is issued and distributed by JPMSAL in New Zealand only to persons whose principal business is the investment of money or who, in the course of and for the purposes of their business, habitually invest money. JPMSAL does not issue or distribute this material to members of "the public" as determined in accordance with section 3 of the Securities Act 1978. The recipient of this material must not distribute it to any third party or outside New Zealand without the prior written consent of JPMSAL. Canada: The information contained herein is not, and under no circumstances is to be construed as, a prospectus, an advertisement, a public offering, an offer to sell securities described herein, or solicitation of an offer to buy securities described herein, in Canada or any province or territory thereof. Any offer or sale of the securities described herein in Canada will be made only under an exemption from the requirements to file a prospectus with the relevant Canadian securities regulators and only by a dealer properly registered under applicable securities laws or, alternatively, pursuant to an exemption from the dealer registration requirement in the relevant province or territory of Canada in which such offer or sale is made. The information contained herein is under no circumstances to be construed as investment advice in any province or territory of Canada and is not tailored to the needs of the recipient. To the extent that the information contained herein references securities of an issuer incorporated, formed or created under the laws of Canada or a province or territory of Canada, any trades in such securities must be conducted through a dealer registered in Canada. No securities commission or similar regulatory authority in Canada has reviewed or in any way passed judgment upon these materials, the information contained herein or the merits of the securities described herein, and any representation to the contrary is an offence. Dubai: This report has been issued to persons regarded as professional clients as defined under the DFSA rules.
General: Additional information is available upon request. Information has been obtained from sources believed to be reliable but JPMorgan Chase & Co. or its affiliates and/or subsidiaries (collectively J.P. Morgan) do not warrant its completeness or accuracy except with respect to any disclosures relative to JPMS and/or its affiliates and the analyst's involvement with the issuer that is the subject of the research. All pricing is as of the close of market for the securities discussed, unless otherwise stated. Opinions and estimates constitute our judgment as of the date of this material and are subject to change without notice. Past performance is not indicative of future results. This material is not intended as an offer or solicitation for the purchase or sale of any financial instrument. The opinions and recommendations herein do not take into account individual client circumstances, objectives, or needs and are not intended as recommendations of particular securities, financial instruments or strategies to particular clients. The recipient of this report must make its own independent decisions regarding any securities or financial instruments mentioned herein. JPMS distributes in the U.S. research published by non-U.S. affiliates and accepts responsibility for its contents. Periodic updates may be provided on companies/industries based on company specific developments or announcements, market conditions or any other publicly available information. Clients should contact analysts and execute transactions through a J.P. Morgan subsidiary or affiliate in their home jurisdiction unless governing law permits otherwise.
"Other Disclosures" last revised April 18, 2012.
Copyright 2012 JPMorgan Chase & Co. All rights reserved. This report or any portion hereof may not be reprinted, sold or redistributed without the written consent of J.P. Morgan. #$J&098$#*P