
J.P. Morgan Homebuilding and Building Products...
13
J.P. Morgan Homebuilding and Building Products Conference May 17, 2017 Maracay Homes® – Pardee Homes® – Quadrant Homes® – Trendmaker® Homes – TRI Pointe Homes® – Winchester® Homes
Transcript of J.P. Morgan Homebuilding and Building Products...

J.P. Morgan Homebuilding and Building Products ConferenceMay 17, 2017
Maracay Homes® – Pardee Homes® – Quadrant Homes® – Trendmaker® Homes – TRI Pointe Homes® – Winchester® Homes

Forward Looking Statement
Various statements contained in this presentation, including those that express a belief, expectation or intention, as well asthose that are not statements of historical fact, are forward-looking statements. These forward-looking statements may includeprojections and estimates concerning the timing and success of specific projects and our future production, land and lot sales, operational and financial results, financial condition, prospects, and capital spending. Our forward-looking statements are generally accompanied by words such as “estimate,” “project,” “predict,” “believe,” “expect,” “intend,” “anticipate,” “potential,” “plan,” “goal,” “target,” “guidance,” “outlook,” “will,” or other words that convey future events or outcomes. The forward-looking statements in this presentation speak only as of the date of this presentation, and we disclaim any obligation to update these statements unless required by law, and we caution you not to rely on them unduly. These forward-looking statements are inherently subject to significant business, economic, competitive, regulatory and other risks, contingencies and uncertainties, most of which are difficult to predict and many of which are beyond our control. The following factors, among others, may cause our actual results, performance or achievements to differ materially from any future results, performance or achievements expressed or implied by these forward-looking statements: the effect of general economic conditions, including employment rates, housing starts, interest rate levels, availability of financing for home mortgages and strength of the U.S. dollar; market demand for our products, which is related to the strength of the various U.S. business segments and U.S. and international economic conditions; levels of competition; the successful execution of our internal performance plans, including restructuring and cost reduction initiatives; global economic conditions; raw material prices; oil and other energy prices; the effect of weather, including the re-occurrence of drought conditions in California; the risk of loss from earthquakes, volcanoes, fires, floods, droughts, windstorms, hurricanes, pest infestations and other natural disasters; transportation costs; federal and state tax policies; the effect of land use, environment and other governmental regulations; legal proceedings or disputes and the adequacy of reserves; risks relating to any unforeseen changes to or effects on liabilities, future capital expenditures, revenues, expenses, earnings, synergies, indebtedness, financial condition, losses and future prospects; changes in accounting principles; risks related to unauthorized access to our computer systems, theft of our customers’ confidential information or other forms of cyber-attack; and additional factors discussed under the sections captioned “Risk Factors” included in our annual and quarterly reports filed with the Securities and Exchange Commission. The foregoing list is not exhaustive. New risk factors may emerge from time to time and it is not possible for management to predict all such risk factors or to assess the impact of such risk factors on our business. This presentation includes certain non-GAAP financial metrics, including adjusted homebuilding gross margin, EBITDA and adjusted EBITDA and net debt-to-capital. These non-GAAP financial measures should be considered only as supplemental to, and not as superior to, financial measures prepared in accordance with GAAP. Please refer to the Supplemental Data and Reconciliation section of this presentation for a reconciliation of the non-GAAP financial measures included in this presentation to the most directly comparable financial measures prepared in accordance with GAAP. Winchester is a registered trademark and is used with permission.
2

Management Team
Michael GrubbsChief Financial Officer
• Over 28 years of real estate and homebuilding experience
• Former SVP / CFO of William Lyon Homes
Douglas BauerChief Executive Officer
• Over 28 years of real estate and homebuilding experience
• Former President and COO of William Lyon Homes
Thomas Mitchell President & COO
• Over 28 years of real estate and homebuilding experience
• Former EVP and Southern California Regional President at William Lyon Homes
Working together for over 28 years, TRI Pointe senior management has significant experience running a large, geographically diverse, growth-oriented public homebuilder. Deep managerial talent at each operating division with key local relationships supports dynamic tailored growth strategies.
3

TRI Pointe Group OverviewA Leading U.S. Homebuilder with a Portfolio of Six Premium Brands
Key Operating Metrics(LTM as of 3/31/17, $ in millions)
Founded in 2009 by TRI Pointe Group’s existing management team, who have a 28 year track record of working together in the homebuilding industry
Initially focused on California, TRI Pointe Group was transformed into a national homebuilder through the 2014 merger with Weyerhaeuser Real Estate Company (“WRECO”)
– WRECO was founded in 1969 and has a long history in many key markets
– Reverse merger transaction structure resulted in ~$1.5bn in WRECO land assets recorded at historical basis, which we believe is below current fair market value
TRI Pointe Group’s current portfolio consists of six premium homebuilding brands operating in fourteen markets across eight states
– Arizona, California, Colorado, Maryland, Nevada, Texas, Virginia and Washington
– Each homebuilding brand has a tailored strategy for each market
Named “Builder of the Year” in 2015 by Builder Magazine
Substantial land position of 28,760 lots owned or controlled via option, located in attractive markets characterized by strong long-term housing fundamentals
– Over 15,000 fully-entitled lots in California, where land supply is constrained
Strong financial performance with a LTM Adj. Homebuilding Gross Margin of 22.7%(1)
and a 12% projected CAGR in home deliveries from 2016 through 2018
TRI Pointe Solutions offers complete mortgage services to homebuyers across the entire portfolio and title services in Maryland, Virginia and Texas contributing ~$5.5mm of LTM pre-tax income
Approximately 1,100 employees as of December 31, 2016
Source: Company filings. All financials as of March 31, 2017, unless otherwise noted. Market data as of trading on May 12, 2017.(1) See “Reconciliation of Non-GAAP Measures” in the appendix of this presentation.See Forward Looking Statement disclosure on page 2 of this presentation.
Company Highlights
4
Total Lots Owned or Controlled 28,760
LTM Home Deliveries 4,198
Implied Years of Supply 6.9
LTM Total Revenue $2,373
Adj. Homebuilding GM % (1) 22.7%
Adj. EBITDA(1) $340
Adj. EBITDA Margin % (1) 14.3%

Market: Seattle metro areaLTM Deliveries: 354LTM ASP: $569,000Controlled Lots(1): 1,800
Markets: Los Angeles, Inland Empire, San Diego, Las VegasLTM Deliveries: 1,208LTM ASP: $525,000Controlled Lots(1): 16,482
Markets: Orange County, Los Angeles, San Diego, San Francisco, Denver LTM Deliveries: 1,096LTM ASP: $659,000Controlled Lots(1): 3,555
Markets: Phoenix, TucsonLTM Deliveries: 629LTM ASP: $415,000Controlled Lots(1): 2,611
Markets: Houston, AustinLTM Deliveries: 492LTM ASP: $504,000Controlled Lots(1): 1,902
Markets: Washington, DC metro areaLTM Deliveries: 419LTM ASP: $555,000Controlled Lots(1): 2,410
Note: Data as of March 31, 2017. “ASP” means average sales price(1) Includes lots owned or controlled under option contract.
Each of TRI Pointe Group’s six homebuilding brands is focused on executing a tailored market strategy to optimize asset turns and earnings in its respective market(s).
Owned or Controlled Lots by BrandIn units as of March 31, 2017
Diverse National FootprintOperations in Fourteen Markets Across Eight States With a Tailored Strategy for Each Market
Pardee57%
TRI Pointe12%
Winchester9%
Maracay9%
Trendmaker7%
Quadrant6%
5
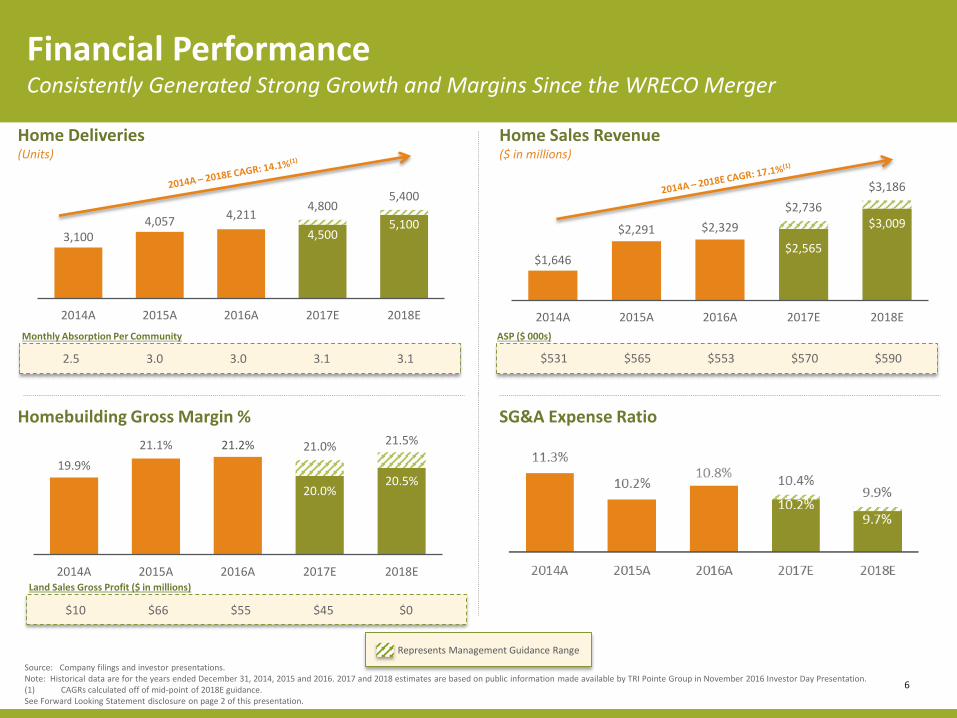
Financial PerformanceConsistently Generated Strong Growth and Margins Since the WRECO Merger
Home Deliveries(Units)
Home Sales Revenue($ in millions)
SG&A Expense RatioHomebuilding Gross Margin %
Source: Company filings and investor presentations.Note: Historical data are for the years ended December 31, 2014, 2015 and 2016. 2017 and 2018 estimates are based on public information made available by TRI Pointe Group in November 2016 Investor Day Presentation.(1) CAGRs calculated off of mid-point of 2018E guidance.See Forward Looking Statement disclosure on page 2 of this presentation.
Monthly Absorption Per Community
2.5 3.0 3.0 3.1 3.1
ASP ($ 000s)
Represents Management Guidance Range
Land Sales Gross Profit ($ in millions)
3,100 4,057
4,211
4,500 5,100
4,800 5,400
2014A 2015A 2016A 2017E 2018E
$1,646
$2,291 $2,329
$2,565
$3,009 $2,736
$3,186
2014A 2015A 2016A 2017E 2018E
19.9%
21.1% 21.2%
20.0% 20.5%
21.0% 21.5%
2014A 2015A 2016A 2017E 2018E
6
$531 $565 $553 $570 $590
$10 $66 $55 $45 $0

7
The TRI Pointe Difference
Note: Historical data is as of and for the year ended December 31, 2016 from publicly available filings with the SEC. Historical performance may not be predictive of future results.
Initiated land development on over 4,000 lots throughout Southern California
Opened 5 communities to date in 2017 and anticipate an additional 25 by the end of 2018 from these long-term assets
Create a new strategy to utilize both our TRI Pointe and Pardee Homes brands in certain master plan communities
Outcome:Above average absorption rates, higher sales prices and higher homebuilding gross margins
FY 2016 Results:Average Sales Price - $553,000 Absorption Rate – 3.0/month/commHomebuilding Gross Margin – 21.2% ROE Goal: low-to-mid teens

10
4 6
21
57
83
9
San Francisco
San Diego
Los Angeles
Note: Data as of September 30, 2016. All estimates based on public information made available by TRI Pointe Group in November 2016 Investor Day Presentation, available on our website at www.TRIPointeGroup.com. See Investor Day Presentation for more details related to the long-term California assets.
(1) Reflects the projected number of lots remaining, in some cases including anticipated changes to the development plan or future entitlements. (2) Table excludes lots remaining to close after 2022 (Meadowood, Banning, South Otay Mesa and Bear Creek). See Forward Looking Statement disclosure on page 2 of the this presentation.
Embedded Value of our Long-Term California Assets
8
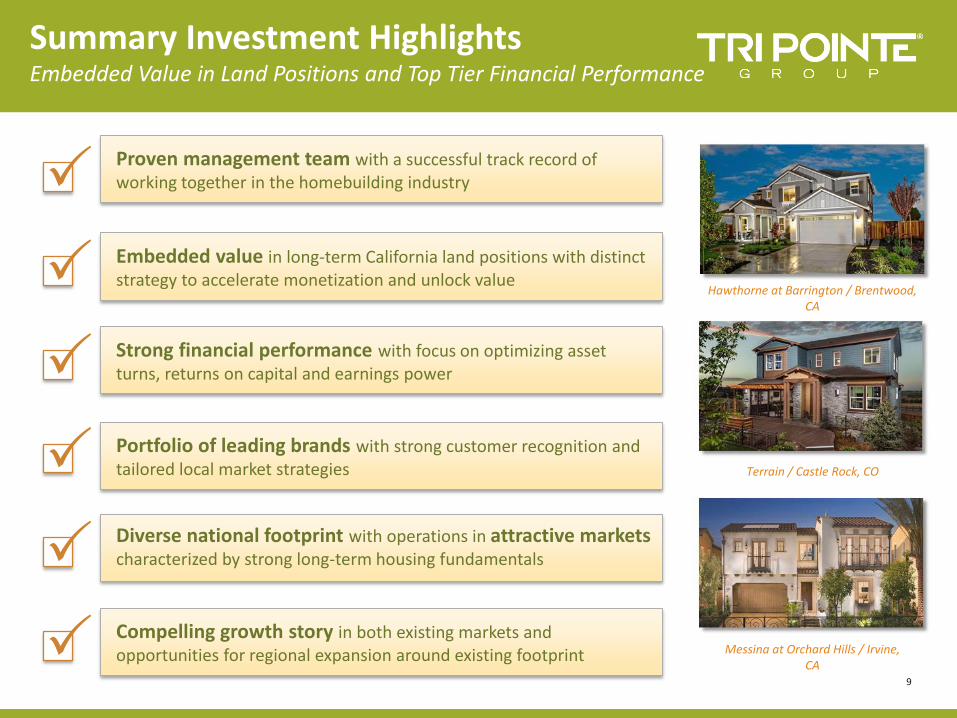
Portfolio of leading brands with strong customer recognition and tailored local market strategies
Diverse national footprint with operations in attractive markets characterized by strong long-term housing fundamentals
Embedded value in long-term California land positions with distinct strategy to accelerate monetization and unlock value
Strong financial performance with focus on optimizing asset turns, returns on capital and earnings power
Compelling growth story in both existing markets and opportunities for regional expansion around existing footprint
Proven management team with a successful track record of working together in the homebuilding industry
Hawthorne at Barrington / Brentwood, CA
Terrain / Castle Rock, CO
Messina at Orchard Hills / Irvine, CA
Summary Investment HighlightsEmbedded Value in Land Positions and Top Tier Financial Performance
9
Supplemental Data and Reconciliation

Reconciliation of Non-GAAP Financial Measures(unaudited)
11
In this presentation, we utilize certain financial measures that are non-GAAP financial measures as defined by the Securities and Exchange Commission. We present these measures because we believe they and similar measures are useful to management and investors in evaluating the Company’s operating performance and financing structure. We also believe these measures facilitate the comparison of our operating performance and financing structure with other companies in our industry. Because these measures are not calculated inaccordance with Generally Accepted Accounting Principles (“GAAP”), they may not be comparable to other similarly titled measures of other companies and should not be considered in isolation or as a substitute for, or superior to, financial measures prepared in accordance with GAAP.
The following table reconciles homebuilding gross margin percentage, as reported and prepared in accordance with GAAP, to the non-GAAP measure adjusted homebuilding gross margin percentage. We believe this information is meaningful as it isolates the impact that leverage has on homebuilding gross margin and permits investors to make better comparisons with our competitors, who adjust gross margins in a similar fashion.
LTM
Period Ended
($ in 000s) 3/31/2017
Home sales revenue 2,298,285$
Cost of home sales 1,830,232
Homebuilding gross margin 468,053
Add: interest in cost of home sales 51,961
Add: impairments and lot option abandonments 1,609
Adjusted homebuilding gross margin 521,623$
Homebuilding gross margin percentage 20.4%
Adjusted homebuilding gross margin percentage 22.7%
Reconciliation of Non-GAAP Financial Measures (cont’d)(unaudited)
12
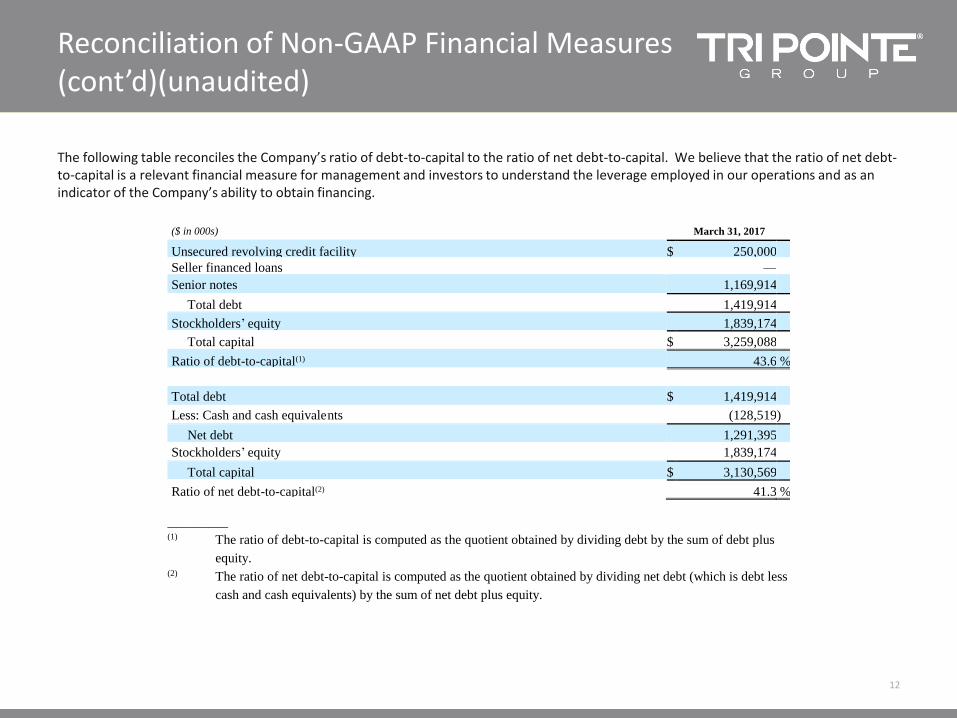
The following table reconciles the Company’s ratio of debt-to-capital to the ratio of net debt-to-capital. We believe that the ratio of net debt-to-capital is a relevant financial measure for management and investors to understand the leverage employed in our operations and as an indicator of the Company’s ability to obtain financing.
__________ (1) The ratio of debt-to-capital is computed as the quotient obtained by dividing debt by the sum of debt plus
equity.
(2) The ratio of net debt-to-capital is computed as the quotient obtained by dividing net debt (which is debt less
cash and cash equivalents) by the sum of net debt plus equity.
($ in 000s) March 31, 2017
Unsecured revolving credit facility $ 250,000
Seller financed loans —
Senior notes 1,169,914
Total debt 1,419,914
Stockholders’ equity 1,839,174
Total capital $ 3,259,088
Ratio of debt-to-capital(1) 43.6 %
Total debt $ 1,419,914
Less: Cash and cash equivalents (128,519 )
Net debt 1,291,395
Stockholders’ equity 1,839,174
Total capital $ 3,130,569
Ratio of net debt-to-capital(2) 41.3 %

Reconciliation of Non-GAAP Financial Measures (cont’d)(unaudited)
13
The following table calculates the non-GAAP measures of EBITDA and Adjusted EBITDA and reconciles those amounts to net income, as reported and prepared in accordance with GAAP. EBITDA means net income before (a) interest expense, (b) income taxes, (c) depreciation and amortization, (d) expensing of previously capitalized interest included in costs of home sales and (e) amortization of stock-based compensation. Adjusted EBITDA means EBITDA before (f) impairment and lot option abandonments (g) restructuring charges and (h) transaction related expenses. Other companies may calculate EBITDA and Adjusted EBITDA (or similarly titled measures) differently. We believe EBITDA and Adjusted EBITDA are useful measures of the Company’s ability to service debt and obtain financing.
Note: Historical data are for the years ended December 31, 2014, 2015 and 2016. LTM data is based on the last twelve months ended March 31, 2017.
LTM
Period Ended
($ in 000s) 2014A 2015A 2016A 3/31/2017
Net income available to common stockholders 84,197$ 205,461$ 195,171$ 174,814$
Interest expense:
Interest incurred 41,706 60,964 68,306 72,030
Interest capitalized (38,975) (60,964) (68,306) (72,030)
Amortization of interest in cost of sales 52,747 45,114 51,288 52,145
Provision for income taxes 43,767 112,079 106,094 95,218
Depreciation and amortization 11,423 8,273 3,087 2,117
Amortization of stock-based compensation 7,679 11,935 12,612 13,848
EBITDA 202,544 382,862 368,252 338,142
Impairments and lot abandonments 2,515 1,930 1,470 1,609
Restructuring charges 10,543 3,329 649 717
Transaction expenses 17,960 — — —
Adjusted EBITDA 233,562$ 388,121$ 370,371$ 340,468$
Interest Coverage Ratio 5.6 6.4 5.4 4.7
Year Ended December 31,


