Journal of the Vivekananda Institute of Medical Sciences · Journal of the Vivekananda Institute of...
64
Journal of the Vivekananda Institute of Medical Sciences EDITORIAL BOARD Chairman Swami Satyadevananda Executive Editors Prof. Dilip Mukherjee Prof. Debasish Maji Prof. A. K. Saraf Members Prof. Arabinda Mukherjee Prof. Barin Kr. Roychaudhuri Prof. Jayanta Chakraborty Prof. Sukanta Misra Prof. Asha Mukherjee Prof. Sanjay Bhattacherjee Prof. Pradip Kr. Saraf Prof. Sudip Chatterjee Prof. Kishore Chowdhury Prof. Samir Chakraburtty Prof. Tapas Chakraborty Prof. Jayanta Bhattacharjee Prof. Anjan Das Prof. Ashok Ganguly Annual Subscription Rs 90 $30 £ 14 Single Copy Rs 50 $ 15 £ 07 Prof. Nanigopal Bhattacherjee
Transcript of Journal of the Vivekananda Institute of Medical Sciences · Journal of the Vivekananda Institute of...

Journal of theVivekananda Institute of Medical Sciences
EDITORIAL BOARD
ChairmanSwami Satyadevananda
Executive EditorsProf. Dilip Mukherjee
Prof. Debasish MajiProf. A. K. Saraf
Members
Prof. Arabinda Mukherjee
Prof. Barin Kr. Roychaudhuri
Prof. Jayanta Chakraborty
Prof. Sukanta Misra
Prof. Asha Mukherjee
Prof. Sanjay Bhattacherjee
Prof. Pradip Kr. Saraf
Prof. Sudip Chatterjee
Prof. Kishore Chowdhury
Prof. Samir Chakraburtty
Prof. Tapas Chakraborty
Prof. Jayanta Bhattacharjee
Prof. Anjan Das
Prof. Ashok Ganguly
Annual Subscription Rs 90 $30 £ 14Single Copy Rs 50 $ 15 £ 07
Prof. Nanigopal Bhattacherjee

Editorial Page No.Diabetes Mellitus – Its Many Facets
— Dr. Debasish Maji 5
Original Article:a) A Study of Diabetic Retinopathy
in Gestational Diabetes &Overt Diabetes with Pregnancy— Dr. Sweety Trivedi
Dr. D. Maji 6
b) Occurrence and Level of Depression among thePatients Suffering fromDiabetes Mellitus— Ms. Mita Mandal
Dr. A. RayDr. D. MondalDr. J. Roy Chowdhury 13
c) Genetic Polymorphism ofCytochrome P450 Gene amongBetel Quid Chewers of Easternand North Eastern Population— Shri Aniket Adhikari
Ms. Arunima GhoshMs. Priyanka BiswasDr. Madhusnata De 19
d) Study on Device AssociatedInfections in Intensive Care Unitin a Tertiary Care Hospital inKolkata— Dr. Rana Rajak
Dr. J. ChakrabortyDr. P. Mukherjee 24
Journal of theVivekananda Institute of Medical Sciences
Page No.Review Article :
a) Haemolysis: A Real Challenge in Clinical Chemistry Test Reporting— Dr. Rinini Dastidar
Ms. Tirna Halder 34
CME :Type 1 Diabetes— Dr. D. Maji
Dr. R. U. Roy 44
Case Report:a) Think Beyond Sepsis
— Dr. N. MukherjeeDr. S. GuhaDr. S. BasuDr. D. K. Mukherjee 52
b) Bilateral & Extensive Nevus Comedonicus— Dr. Heena Parmar
Dr. Jayanta Kr. DasDr. Asok Gangopadhyay 55
c) Giantsolitary Osteochondroma of Iliac Crest - A Case Report— Dr. G. Basu
Dr. P. PalDr. S. BiswasDr. J. AliDr. G. Chatterjee 58
Pictorial CME :Lingual Thyroid 63
Obituary 64

JOURNAL OF THEVIVEKANANDA INSTITUTE OF MEDICAL SCIENCESInstructions to Authors
All articles for publication in this journal mustbe contributed to is exclusive and, if accepted,will be subject of editorial revision. Forreproduction elsewhere, previous permission ofthe editors will be required and the customaryacknowledgement must be made.
Statements and observations made and opinionsor conclusion drawn in the articles are those ofthe authors and not those of the editors.
Manuscripts :
Manuscripts should be neatly typed on one sideof the paper with triple space margines of 5 cm.Should be left at the top of each page and on itsleft side. The authors should keep a spare copyfor reference and proof-reading. Each authormust sign the covering letter as evidence ofconsent to publication. Original articles shouldconfirm to the conventional structure of summaryand conclusions (in 150 to 200 words, to beprinted at the beginning of each article),introduction, methods, results, discussion andreferences.
Original articles should not normally exceed2000 words and should not have more than sixtables or illustrations; they should normally reportoriginal research. Case reports should preferablyby limited to 600 words, with one table orillustration, and not more than five references.Clinical case histories and brief or negativeresearch findings may be included among them.Letters should not exceed 400 words, and mustbe signed by each author.
Articles on the organization, operation andplanning of medical care should be limited to1500 words, with not more than four tales orfigures.
Each manuscript component should begin on anew page, in this sequence; Title page; abstractand key words; text; acknowledgements;references; tables (each table complete with titleand footnotes on a separate page); legends forillustrations. Pages should be numbered.
Title page :
The title page should have (1) the title of thearticle, which should be concise but informative;(2) initial(s) and surname of each author below;(3) at the foot of the page, the initials and name(s)again, with the highest academic degrees (notmore than two degrees and or diplomas) of eachauthor, and the designation and department ofeach, ranged alongside.
The second page should repeat only the articletitle [not the author's(s) name(s)] and shouldcarry the abstract (summary and conclusions).For further details, see Vancouver stylerequirements.
Appropriate scientific nomenclature giving bothgenus and species should be italicised (underlinedin typescript), with an initial capital andabbreviation for the genus only, after a fullspelling at the first mention, thus : MycobacterumTuberculosis, the Myco, tuberculosis, Drugsshould be given their approved names, not theirproprietary names.

4
Spelling should confirm the chambers TwentiethCentury dictionary. The standard capitalization,punctuation and hyphenation is to be mentioned.
Numbers up to ten should be spelt, unlesscontrasted with other numbers. Larger numbersshould be in the form of numerals and not words,except when beginning a sentence, thus : "Fifteenpatients out of a total 60 exhibited......."
Illustrations and tables :
A restricted number of illustrations will bereproduced, the photographic plates or drawingsshould be of good quality. An article should havenot more than six tables or illustrations. Tablesshould be simple and brief and should notduplicate information in the text of the article.Illustrations should be used only when the datacannot be expressed clearly in any other way.
All tables and illustrations should be separatedfrom the text, but with their positions indicated.Tables should be numbered with Romannumerals, and figures with Arabic numerals.Tables with brief titles should be typed one to apage.
As far as practicable, marking of lines and lettersshould be avoided; if absoltely necessary, separatesets of marked and unmarked prints should be
drawn with black India ink on the whitebackground. Original artwork, X-ray films, ECGtracing, etc. should be photographed and enlargedon glossypaper, identity of patients should bemasked. The magnification of photomicrographsshould be stated (e.g. x 200). All illustrationsshould accompany the manuscript with suitablelegends, numbered and marked on the back withthe author's name and article title.
Abbreviations should be avoided and, if used,should be explained in brief footnotes.
The author must obtain permission forreproduction of illustrations previouslypublished.
References :
References should be appended to the articletyped triple space, numbered in the order inwhich they appear in the text and must be in theVancouver style. Authors must check theiraccuracy before submission; articles withinaccurate references or with those containingwrong abbreviations of standard journal nameswill be returned to the author. Names of journalsand books must be itialicised (underlined intypescript).
The Journal of the Vivekananda Institute ofMedical Sciences is published by themanagement of the Ramkrishna Mission SevaPratishthan, 99 Sarat Bose Road, Kolkata - 700026, India. Phone : (033) 2475-3636 (4 lines).E-mail : [email protected] & [email protected] : www.rkmsevapratishthan.org
Printed by : Print Excel
AUTHORS ARE BEING REQUESTED TO SUBMIT ONE SOFT COPY (CD)OF THE ARTICLE, ALONGWITH TWO PRINTOUT COPIES.
4
Books for ReviewBooks for review should be sent to the Editor.CorrespondenceAll correspondences should be addressed to theEditor.

Editorial
Diabetes Mellitus – Its Many Facets
5
All of us now have realized that, diabetes isgrowing in our population like an epidemic. Allover the world the picture is the same. This globalpicture is mainly of type 2 diabetes where diabetesis controlled in the initial period of few years bydietary regulation, physical activity and oral anti- diabetic drugs.
The picture is not same as seen in type 1 diabeteswhich initiates mainly in the younger age andthese patients require insulin injection to survivefrom the day one of the diagnosis. It is interestingto note that there is uneven prevalence of type1 diabetes in different parts of the world. Type1 diabetes is seen more in numbers in Finlandand other northern European countries. On theother hand it is not a common disease in India,China and Venezuela. In Finland 40% of diabeticpopulation is type 1 diabetes whereas in Indiatype 1 diabetes constitutes less than 1 % of totaldiabetic population of 66 million at present. Indiawith such a vast population has a little more thanone lakh population of type 1 diabetic. The exactreason for this uneven distribution of type 1diabetes across the globe is not known. Thoughseveral postulations like mandatory BCG vaccine,breast feeding, repeated childhood infection anddifferent gut microbiata structure playing therole. As type 1 diabetic population is a minority,very few people think about them. Type 1 diabetesneeds special attention with a very goodinfrastructure for treatment. It is sad to note that
poor type 1 diabetics staying in remote villagein our country are often neglected and die ofnon-availability of proper care- sometimes eveninsulin.
This issue has a nice article by Dr. SweetyTribedi on gestational diabetes (GDM) whereshe found no retinopathy in a cohort ofgestational diabetes, explaining that even GDMis considered as a pre-diabetic condition, microvascular complications are rarely seen in GDMmothers. Dr. Tribedi has recommended thatFundus examination for retinopathy need notbe done in GDM.
Prof. J. Roy Chowdhury has in another articlein this issue, highlighted another area of clinicalmedicine- diabetes and depression. Three mostcommon chronic non-communicable diseasesin the population according to the prevalenceare - 1) hypertension (20-25%), 2) depression(10-15%) and 3) diabetes mellitus (8-12%). Itis not surprising that both diabetes and depressionare found in one patient in clinical practice. Onecan imagine an elderly patient having diabetes,hypertension, coronary artery disease along withdepression. The pill burden, the physical andsocial problem, the depression and other co-morbid conditions in an elderly patient,compounds the situation.
It is a well known saying – one, who knowsdiabetes, knows medicine.
Dr. Debasish Maji, MD, DM, Prof. Dept. of Medicine, RKMSP, VIMS

Original Article
Abstract:
Objectives:
To find out the incidence of Diabetic Retinopathy(DR) in pregnant patients with overt diabetesand gestational diabetes mellitus and to evaluatethe progression and risk factors of diabeticretinopathy during pregnancy.
Materials and Methods:
Case series study at the Endocrine and ObstetricsOPD of Vivekananda Institute of MedicalSciences, Kolkata over 1 year in 30 normalpregnancy, 30 gestational diabetes and 30 overtdiabeties patients was performed.
Results:
Among the 30 GDM patients 0% developedretinopathy whereas 13.3% of overt DM hadretinopathy with progression only in 3.3%. Thosewho developed DR had longer duration ofdiabetes (mean 5.62 yrs), poorer baselineg l y c e m i c s t a t u s a n d h i g h e r u r i n emicroalbuminuria.
Conclusion:
GDM is not a risk factor for diabetic retinopathy.Thus fundus examination may not be requiredin GDM whereas it is essential in overt diabetics.Glycemic status, conception and duration ofdiabetes were more contributory to developmentand progression of DR. Presence ofmicroalbuminuria is a risk factor whereashaemoglobin and lipid profile were noncontributory.
A Study of Diabetic Retinopathy in Gestational Diabetes &Overt Diabetes with Pregnancy
Dr. Sweety Trivedi1, Dr. D. Maji2
Introduction:Diabetes is a group of metabolic disorderscharacterized by high blood glucose levels thatresult from defects in the body's ability toproduce and/or use insulin. Diabetes Mellitusis associated with long term microvascularcomplications like retinopathy, nephropathy andneuropathy. Diabetic retinopathy is amicrovascular complication of diabetes mellitus(DM) resulting in chronic progressive changesin the retina. It is the most frequent cause ofnew cases of blindness among adults aged 24–64years. For a proportion of diabetic women, thefirst half of this period coincides with peakfertility and childbearing years. Diabeticretinopathy may develop for the first time duringpregnancy.Abnormal maternal glucose regulation occursin 3-10% of pregnancies and gestational diabetesmellitus (GDM), which is defined as glucoseintolerance of variable degree with onset or firstrecognition during pregnancy, accounts for 90%of cases of diabetes mellitus (DM) in pregnancy.However, the rising prevalence of diabetesmellitus has resulted in increasing numbers ofpregnant women with preexisting diabetes[1].GDM is considered to be a prediabetic condition.So, we want to see incidence of retinopathywhich may help us to prevent long termmicrovascular complications from early stage.Pregnancy with its hormonal, haemodynamic,metabolic and immunological changes is a riskfactor for progression of diabetic retinopathy[2].
1MD (Med.) PGT; 2MD DM, Prof. Dept. of Medicine, RKMSP, VIMS
6

The prevalence of retinopathy in diabeticpregnancies in some studies is 10–27%[3]. Theduration of diabetes before the onset of pregnancyis the prime risk factor for the presence, severityand progression of retinopathy duringpregnancy[4]. Progression of retinopathy is alsoassociated with early onset of diabetes, highbaseline retinopathy level and suboptimalglycemic control before pregnancy,and rapidnormalization of hyperglycaemic blood glucoselevels during pregnancy[5-10].This study proposes to know if any retinopathyoccur during pregnancy in gestational diabetesand the incidence and progression of diabeticretinopathy in overt diabetics with pregnancy.Aims and Objectives:1. To find out the incidence of diabetic
retinopathy in pregnant patients with overtdiabetes and gestational diabetes mellitus.
2. To evaluate the progression of diabeticretinopathy during pregnancy.
3. To evaluate the effect of others risk factorsfor diabetic retinopathy during pregnancy.
Materials and Methods:Case series study at the Endocrine and ObstetricsOPD of Vivekananda Institute of MedicalSciences, Kolkata over 1 year in 30 normalpregnancy, 30 gestational diabetes and 30 overtdiabeties patients was performed.Inclusion Criteria:Patients of normal pregnancy, overt diabetes inpregnancy and gestational diabetes.Exclusion Criteria:Patients with retinal diseases other than diabeticretinopathy and patients with hypertension.History, clinical examination and eyeexamination along with fundus photographywas performed in each trimester and relevantinvestigations including blood sugar,haemoglobin, urine examination, lipid profilewere noted.Statistical Analysis:Analysis of variance (ANOVA) has been usedto find the significance of study parametersbetween three or more groups of patientsObservations and Results:
Table 1: Age Distribution of Patients Studied
100
90
80
70
60
50
40
30
20
10
0
Perc
enta
ges
19-20 21-25 26-30 31-35 36-40
DM GroupGDM GroupNormal Pregnancy
Age in years
7

Table 2: Distribution of Duration of Diabetesin the overt diabetes group patients studied
Duration No. of Patients %
1-6 months 5 16.7
6 mo-1 year 11 36.7
1 yr-2 yrs 3 10.0
3 yrs-5yrs 9 30.0
5yrs -10 yrs 2 6.7
Total 30 100.0
Table 3: Comparison of FBS in three groupsstudiedFBS 1st Trimester 2nd Trimester 3rd Trimester
DM Group 109.83±20.44 86.57±8.70 85.67±4.74
GDM Group 78.40±6.21 85.17±9.51 81.33±7.93
NormalPregnancy 79.20±8.18 80.47±5.95 81.83±8.15
P value <0.001** 0.013* 0.040*
Table 4: Comparison of PPBS in three groupsstudied
PPBS 1st Trimester 2nd Trimester 3rd Trimester
DM Group 209.17±32.03 123.57±10.69 114.33±7.24
GDM Group 111±14.27 161.4±14.89 113±17.39
NormalPregnancy 106.33±12.98 110.43±9.8 116±12.7
P value <0.001** <0.001** 0.675
Table 5: Comparison of HbA1c in three groupsstudied
HbA1c 1st Trimester 2nd Trimester 3rd Trimester
DM Group 6.69±0.96 6.23±0.67 6.06±0.61
GDM Group 4.70±0.24 4.79±0.31 4.76±0.33
NormalPregnancy 4.71±0.35 4.64±0.29 4.65±0.33
P value <0.001** <0.001** <0.001**
Table 6: Comparison of Hemoglobin (g/dl) inthree groups studied
Hbin (g/dl) 1st Trimester 2nd Trimester 3rd Trimester
DM Group 11.11±1.19 11.39±1.12 11.49±1.54
GDM Group 11.34±1.00 11.60±0.93 12.00±0.91
NormalPregnancy 11.40±1.06 11.37±0.99 11.43±0.78
P value 0.571 0.633 0.102
Table 7: Comparison of TGL in three groupsstudied
TGL 1st Trimester 2nd Trimester 3rd Trimester
DM Group 146.17±33.61 228.30±35.07 304.47±34.57
GDM Group 132.83±32.32 223.13±54.75 278.10±47.94
NormalPregnancy 127.03±26.47 213.23±40.90 283.80±53.88
P value 0.054+ 0.413 0.072+
Table 8: Comparison of LDL in three groupsstudied
LDL 1st Trimester 2nd Trimester 3rd Trimester
DM Group 98.00±18.51 121.70±16.94 138.77±14.18
GDM Group 80.83±14.60 117.47±25.53 129.80±20.98
NormalPregnancy 94.63±19.16 115.53±17.46 129.97±16.37
P value 0.001** 0.490 0.080+
Table 9: Comparison of Total Cholesterol inthree groups studied
Total 1st Trimester 2nd Trimester 3rd TrimesterCholesterol
DM Group 165.43±30.27 204.70±22.79 242.33±27.69
GDM Group 153.27±30.27 196.17±37.29 224.17±37.89
NormalPregnancy 169.70±25.24 202.07±23.50 228.43±25.40
P value 0.076+ 0.500 0.063+
8

Table 10: Comparison of Urine MACR in three groups studied
Urine 1st Trimester 2nd Trimester 3rd TrimesterMACR
DM Group 18.02±7.79 24.45±19.15 25.81±13.23
GDM Group 14.90±5.72 18.47±8.85 22.18±10.64
NormalPregnancy 16.71±3.87 16.16±3.28 16.53±3.95
P value 0.136 0.031* 0.002**
Table 11: Comparison of Blood Pressure in Three Groups Studied
% ChangeBlood PressureDM Group
(n=30)GDM Group
(n=30)Normal Pregnancy
(n=30)
1st Trimester
• =140/90 30(100.0%) 30(100.0%) 30(100.0%) 0.0
• >140/90 0 0 0 0.0
2nd Trimester
• =140/90 28(93.3%) 30(100.0%) 30(100.0%) +6.7%
• >140/90 2(6.7%) 0 0 -6.7%
3rd Trimester
• =140/90 28(93.3%) 30(100.0%) 30(100.0% +6.7%
• >140/90 2(6.7%) 0 0 -6.7%
Table 12: Comparison of DR Grade in Three Groups Studied
% ChangeBlood PressureDM Group
(n=30)GDM Group
(n=30)Normal Pregnancy
(n=30)
1st Trimester
• No DR 27(90%) 30(100%) 30(100%) 3.0%
• DR Present 3(10%) 0(0%) 0(0%) -3.0%
2nd Trimester
• No DR 26(86.7%) 30(100%) 30(100%) 4.0%
• DR Present 4(13.3%) 0(0%) 0(0%) -4.0%
3rd Trimester
• No DR 26(86.7%) 30(100%) 30(100%) 4.0%
• DR Present 4(13.3%) 0(0%) 0(0%) -4.0%
9

Table 13: Comparison of Type of DR in Three Groups Studied
Type of DR DM Group GDM Group Normal Pregnancy(n=30) (n=30) (n=30)
1st Trimester
• Nil 27(90%) 30(100%) 30(100%)
• Mild NPDR (BDR) 3(10%) 0(0%) 0(0%)
• Moderate NPDR (BDR) 0(0%) 0(0%) 0(0%)
• PreproliferativeBDR 0(0%) 0(0%) 0(0%)
• PDR 0(0%) 0(0%) 0(0%)
• CSME 0(0%) 0(0%) 0(0%)
2nd Trimester
• Nil 26(86.7%) 30(100%) 30(100%)
• Mild NPDR (BDR) 3(10%) 0(0%) 0(0%)
• Moderate NPDR (BDR) 1(3.3%) 0(0%) 0(0%)
• PreproliferativeBDR 0(0%) 0(0%) 0(0%)
• PDR 0(0%) 0(0%) 0(0%)
• CSME 0(0%) 0(0%) 0(0%)
3rd Trimester
• Nil 26(86.7%) 30(100%) 30(100%)
• Mild NPDR (BDR) 3(10%) 0(0%) 0(0%)
• Moderate NPDR (BDR) 1(3.3%) 0(0%) 0(0%)
• Preproliferative BDR 0(0%) 0(0%) 0(0%)
• PDR 0(0%) 0(0%) 0(0%)
• CSME 0(0%) 0(0%) 0(0%)
Table 14: Comparison of Overall Incidence ofDR in Three Groups Studied
Incidence of DR is significantly more associatedwith DM group with p=0.015*
Table 15: Comparison of Progression of DR inThree Groups Studied
Incidence DM Group GDM Group Normalof DR (n-30) (n=30) Pregnancy
(n=30)
• Yes 4(13.3%) 0 0
• No 26(86.7%) 30(100.0%) 30(100.0%)
Progression DM Group GDM Group Normalin DR (n-30) (n=30) Pregnancy
(n=30)1(3.3%)
• Progression NO DR 0 0TO BDR
• No Progression 29(96.7%) 30(100.0%) 30(100.0%)
10

Discussion:Pregnancy is a prominent risk factor forhyperglycemia and retinopathy (being amicrovascular complication of hyperglycemia).Progression of retinopathy has been reported tobe associated with sub-optimal regulation ofb lood g lucose , b lood pressure andmicroalbuminuria. Gestational diabetes has notbeen found to be a risk factor for developmentof retinopathy[11].In our study, the aim was to find out the incidenceof diabetic retinopathy in pregnant women withGDM and overt diabetes with pregnancy in ourpopulation attending the endocrine and obstetricdepartment of our hospital.We conducted our study in 30 overt diabetes inpregnancy patients and 30 GDM patients.Among these patients, none of the GDM patientsdeveloped any retinopathy. The incidence ofretinopathy in overt diabetic group (all T2DM)was 13.3% whereas 86.7 % of the overt diabeticgroup did not have any DR (table 14). Thus,most of our patients did not have any DR.The incidence of retinopathy in type 2 diabeticwomen was reported to be 14% by Rassmussenet al[12] whereas Hoorvat et al[13] reported 27%.In our study out of the 4 women in overt DMgroup with retinopathy, 3 had backgroundretinopathy (mild NPDR) in first trimesterwhereas 1 woman developed mild NPDR insecond trimester. Of the 3 women who had mildNPDR at first trimester, only 1 further developedmoderate NPDR which still was underBackground DR classification (table 12, table13). Thus, progression occurred only in 3.3% ofovert diabetics although one patient haddeveloped moderate NPDR but still she was inBDR category (table 15). No patient developedPDR or CSME.Stephens et al.[14] reported that of the 114
pregnancies of 78 diabetic women, retinopathydeveloped during only one pregnancy, andproliferative retinopathy occurred during another.Also Temple et al[14] shown that moderate orsevere progression of retinopathy duringpregnancy was rare, occurring in only 5% ofpregnancies with only four women (2.2%pregnancies) requiring laser therapy fordevelopment of proliferative retinopathy.On the other hand, Rassmussen et al[12] reporteda progression of 14% in their study. In recentstudy by Hampshire et al[15], 186 pregnantwomen were screened for retinopathy of which27% of patients were found to have stableretinopathy throughout and 10% presented withsight threatening retinopathy.With respected to duration of diabetes it wasseen that those who developed retinopathy hadlonger duration of diabetes (mean of 5.62 yrs)than those who did not. Axer et al[16] also reportedthat duration of diabetes was significant withrespect to retinopathy development (p=<000.7).The Diabetes in Early Pregnancy (DIEP)[17] datashowed that the patients in whom retinopathywas most likely to progress had the poorestcontrol of their diabetes at conception. We foundin our study that level of glycemic control wasalso a significant factor in the development ofDR in pregnancy with diabetes. Poor earlyglycemic status in first trimester was associatedwith more incidence of DR in DM group thanGDM. P value was found to be <0.001 for bothFBS and PPBS in first trimester (table 3,4).HbA1c was found to have strong significantdifference when compared with GDM andnormal pregnancy group (p<0.01) (table 5).Urine microalbumin as measured by spot urineMACR was find to have strong significantdifference in the third trimester of pregnancy(p<0.001) and moderately significant in second
11

trimester (p<0.05) in overt diabetic group ascompared to GDM and normal pregnancyalthough this was not the case during firsttrimester (table 10).Haemoglobin, cholesterol, triglyceride, LDLwere not found to have any significant correlationwith DR.Conclusion:1. GDM was not a risk factor for development
of diabetic retinopathy.2. Fundus examination may not be necessary
in patients with GDM.
3. Fundus examination is a must in patientswith type 2 DM going for pregnancy andshould be done in all trimester as follow upexamination.
4. Glycemic status at conception and durationof diabetes were more contributory todevelopment and progression of DR.
5. Presence of microalbuminuria is a risk factorfor development of retinopathy.
6. There is no association betweenhaemoglobin and lipids and developmentor progression of DR.
References:1. Baptiste-Roberts K, Barone BB, Gary TL. Risk factors
for type 2 diabetes among women with gestationaldiabetes: a systematic review. Am J Med. Mar2009;122(3):207-214.e4.
2. Klein BE. Overview of epidemiologic studies ofdiabetic retinopathy. Ophthalmic epidemiol.2007;14:179-83.
3. Hadden DR. Diabetes in pregnancy. Diabetologia.1986; 29:1–9. Sunness JS. The pregnant woman’s eye.Surv Ophthalmol. 1988; 32:219–238.
4. Lauszus F, Klebe JG, Bek T. Diabetic retinopathy inpregnancy during tight metabolic control. Acta ObstetGynecol Scand. 2000; 79:367–370.
5. Larinkari J, Laatikainen L, Ranta T, Moronen, P,Pesonen K, Laatikainen T. Metabolic control andserum hormone levels in relation to retinopathy indiabetic pregnancy. Diabetologia. 1982; 22:327–332.
6. Rosenn B, Miodovnik M, Kranias G, Khoury J, CombsCA, Mimouni F, Siddiqi TA, Lipman MJ. Progressionof diabetic retinopathy in pregnancy: association withhypertension in pregnancy. Am J Obstet Gynecol.1992; 166:1214–1218.
7. Chaturvedi N, Stephenson JM, Fuller JH, and theEURODIAB IDDM Complications Study Group:Relationship between pregnancy and long-termmaternal complications in the EURODIAB IDDMcomplications study. Diabet Med. 1995; 12:494–499.
8. Reece EA, Homko CJ, Hagay Z. Diabetic retinopathyin pregnancy. Obstet Gynecol Clin North Am. 1996;23:161–171.
9. Rosenn B, Miodovnik M. Medical complications ofdiabetes mellitus in pregnancy. Clin Obstet Gynaecol.2000; 43:17–31.
10. Maji D, Roy R U, Das S, Maji T. Neuropathy is thecommonest long term complication of type 2 diabeticindividuals at diagnosis. International congress ofIDF. 2003.
11. Rasmussen KL, Laugesen CS, Ringholm L, VestgaardM, Damm P, Mathiesen ER. Progression of diabeticretinopathy during pregnancy in woman with type 2diabetes. Diabetologia 2010 Jun;53(6):1076-83.
12. Hoorvat M, Maclean H, Goldberg L, Crock GW:Diabetic retinopathy in pregnancy: a 12-yearprospective survey. Br J Ophthalmol 1980;64:398–403.
13. Stephens JW, Page OC, Hare RL: Diabetes andpregnancy: a report of experiences in 119 pregnanciesover a 18. period often years. Diabetes 12:213-19,1963.
14. Temple RC, Aldridge VA, Sampson MJ, GreenwoodRH, Heyburn PJ, Glenn A. Impact of pregnancy onthe progression of diabetic retinopathy in type Idiabetes. Diabetic Medicine. 2001;18:573-577.
15. Hampshire R, Wharton H, Leigh R, Wright A, DodsonP. Screening for diabetic retinopathy in pregnancyusing photographic review clinics. Dibet. Med. 2013;30:475-477.
16. Axer-Siegel R, Hod M, Fink-Cohen A, Kramer M,Weinberger D, Schindel B, Yassur Y: Diabeticretinopathy during pregnancy. Ophthalmology 1996;103:1815–1819.
17. Diabetes in Early Pregnancy Study. Metabolic controland progression of retinopathy. Diabetes Care1995;18:631–7.
12

Abstract:
A descriptive survey was conducted on theoccurrence and level of depression among thepatients suffering from diabetes mellitus attendingdiabetic OPD in selected hospital Kolkata, W.B.The objectives of the study were to determinethe occurrence of depression among the patientsuffering from diabetes mellitus, to find out thelevel of depression among the diabetes patients,and to find out the association between level ofdepression with socio demographic factors.Systematic Random Sampling technique wasused to select 230 diabetic patients (age group30 -70 yrs) attending diabetic OPD of MedicalCollege and Hospital, Kolkata. The tool selectedwere semi structured interview schedule on background data, standardized Prime MD patienthealth questionnaire (PHQ-9) for screening ofdepression, standardized Beck DepressionInventory (BDI-II) for level of depression. Thefindings of the study revealed that out of 230patients 135 (59%) patients had depression.Among that 135 patients 36% moderate, and14% had severe level of depression. Gender,Marital status, Duration of illness, complicationof diabetes mellitus were significantly associatedwith level of depression. The study has severalimplications in Nursing service, nursingadministration and nursing research. Based onthe study findings, the recommendations weremade for an study to find out the ‘quality of life’of the patients.
Occurrence and Level of Depression among thePatients Suffering from Diabetes Mellitus
Ms. Mita Mandal1, Dr. A. Ray2, Dr. D. Mondal3, Dr. J. Roy Chowdhury4
Key words:Depression, Diabetes Mellitus, OPD.Introduction:Depression is a disorder that is characterized bysadness, changes in appetite, altered sleep pattern,feeling of dejection or hopelessness andsometimes suicidal tendencies. It can occur atany age: however it is common mental healthdisorder among the persons who suffered withchronic physical disease or disorder.Diabetes is a chronic debilitating condition thataffects approximately 61.3 million people inIndia (IDF 2011)[4]. International DiabeticFederation shows that 366 million people haddiabetes in 2011, by 2030, this will have risen552 million. 183 million people (50 %) withdiabetes are undiagnosed, which causes 4.6million deaths in 2011[3]. WHO estimates that80% of Diabetes death occurs in low and middleincome countries, and projects that such deathwill double between 2005-2030[1].Undiagnosed depression creates a major publichealth problem among the diabetes patients.Their functional level, health care seekingbehavior, barriers to depression, treatmentinclude lack of knowledge of depressionsymptom, negative attitudes towards mentalillness, perception that individuals withdepression are stigmatized lack of understandingof health resources available to his or her andunder his/her control and lack of time (Logsdon,Hines, Martin and Rakestraw, 2009; Logsdon).
1M.Sc. Nursing, MCH, Kolkata; 2Sr. Lecturer, CON, MCH, Kolkata;3HOD, Dept. of Psychiatry, MCH, Kolkata; 4Prof., Dept. of Psychiatry, RKMSP
Original Article
13

Prevalence of depression in diabetes varies from8.5% - 27.3%. A review of 8 epidemiologicalstudies of common mental disorders in southAsia has shown that the prevalence in primarycare was 26.3 % (25.3% - 27.4%). Severalreviews indicate that the prevalence of co-morbidmajor depressive disorder in persons with diabetesranges from 11-33% and this co morbidity isassociated with high symptom burden anddisability[2].Despite the enormous advances in researches inthe past twenty years depression often goesundiagnosed and untreated. People with diabetes,their families and friends, and even theirphysicians may not distinguish the symptom ofdepression. However, the skilled health personnelmay encounter these symptoms, inquire abouttheir duration and severity, diagnose and suggestfor proper treatment. Screening as well as treatingdepression is not just about improve quality oflife, it may actually improve patients health andoutcome.Materials and Methods:Descriptive Survey approach and Descriptivedesign was adopted for the present study. Theparticipants were recruited on systematic randombasis i.e. every 7th case attending the OPD registerover a period of one and half month from October11th to 23rd November, 2013. All the patientsattending diabetic OPD, suffering from DM,understanding Bengali or English or hindi. Datawere collected through face to face interviewusing structured interview schedule. Interviewswere conducted by the researchers in the privacyof an OPD side and it was taken 20 minutes toconduct the interview.The following tools were used to collect thedata:
1. Socio-Demographic proforma includes age,
sex, marital status, family type, locality, andDisease variable like, duration of illness, historyof hospitalization, any complication of DM,compliance to drug, past history of depression,past history of attempted suicide, family historyof DM, family history of mental illness.
2. Depression screening tool: PRIME-MDPHQ-9 : The Patient Health Questionnaire (PHQ)is a diagnostic tool for mental health disordersused by health care professionals that is quickand easy for patients to complete. In the mid-1990s, Robert L. Spitzer, MD, Janet B.W.Williams, DSW, and Kurt Kroenke, MD, andcolleagues at Columbia University developedthe ‘Primary Care Evaluation of MentalDisorders’ (PRIME-MD). The PHQ-9 is a 9-item self-reported questionnaire designed toevaluate the presence of depressive symptomsduring the prior 2 weeks. The nine items of thePHQ-9 are based directly on the nine diagnosticcriteria for major depressive disorder in theDSM-IV (Diagnostic and Statistical ManualFourth Edition). Scores can range from 0(absence of depressive symptoms) to 27 (mostsevere depressive symptoms). Each of the 9items, by asking for each of the DSM-IVsymptoms, can be scored from 0 (not at all) to3 (nearly every day). As a diagnostic measure,major depression is diagnosed if 5 or more ofthe 9 depressive symptoms have been presentfor at least “more than half, the days” (i.e. ascore of 2) during the past 2 weeks, and if oneof the symptoms is depressed mood[10].
3. Level of depression or severity of depressionwas assessed by ‘Beck Depression Inventory’(BDI): The Beck depression inventory (secondedition)[11] is the modified version of BDI-IA(1979) and BDI (1961), developed andstandardized by Beck, Ward, Mendelson and
14

Erbaugh (1961). Each of the inventory itemscorresponds to a specific category of depressivesymptom and/or attitude. Each category purportsto describe a specific behavioral manifestationof depression and consists of a graded series offour self evaluative statements. The statementsare rank ordered and weighted to reflect the rangeof severity of the symptom from neutral tomaximum severity. Numerical values of zero,one, or three are assigned to each statement toindicate degree of severity. Each of the 21 itemscorresponding to a symptom of depression issummed to give a single score for the BDI-II.There is a 4 – point scale for each item rangingfrom 0 to 3. On two items (16 and 18) there are7 options to indicate either an increase or decreaseof appetite and sleep. Cut score guidelines forthe BDI-II are given in the manual with therecommendation that thresholds be adjustedbased on the characteristics of the sample, andthe purpose for use of the BDI-II. The inventoryprovides a quick and fairly accurate overview ofhow any one person is feeling at the time theytake it.
The following is the current and scoring matrixof BDI-II.
1-10 — Normal ups and downs.
11-16 — Mild mood disturbances.
17-20 — Borderline clinical depression.
21-30 — Moderate depression.
31- 40 — Severe depression.
Over 40 — Extreme depression.
Results:
The findings of the study revealed that out of230 patients 135 (59%) patients had depression.Among that 135 patients 36% moderate, and14% had severe level of depression. Most of thepatients (43.5%) belongs in more than 56 yearsof age, 52.5% are in female, 70.5% Hindu,83.5% married, 73% living in Rural community,47% have per capita income Rs. 773 - 1547,54.5% Suffered in diabetes mellitus (0-5 yrs).48% had eye related complications. GenderMarital status, Duration of illness, complicationof diabetes mellitus were significantly associatedwith level of depression.
N=230
Occurence of depression
59%41%
No depression
Depression
Figure 1: Pie diagrams shows occurrence of depression among diabetes mellitus patients.The data represented in figure 1 shows that (59%) patients have depression, whereas (41%) nodepression.
15

16
N=230
Level of depression
41%
36%
14%
2.10%1.30% 5.60%
moderate depression (21-30)
severe depression (30-40)
borderline (17-20)
mild mood disturbancess (11-16)
very severe (> 40)
no depression
Figure 2: Pie diagrams shows level of depression among diabetes mellitus patients.
Table 1. Association between depression & selected socio demographic factors. N=230
Selected demographic variable Depression Scores df Chi2 valueAt & above below
median medianAge in years 35-45 years 12 7
46-55 years 22 33 2 7.641*> 56 years 39 22
Sex Male 40 211 5.92*
Female 33 41
Marital status Married 63 441 4.79*
Single 10 18
Duration of illness 0-1 years 32 61-5 years 11 8 2 18.322*> years 30 48
Presence of One complication 32 42complication of 1 7.735*diabetes mellitus > One complication 41 20
p< 0.05 *

Table 1. Shows that there is significant associationbetween depression score and selecteddemographic variable (age, sex, marital status,duration of illness, presence of complication ofDM).
Discussion:
The present study findings indicate that 59%diabetes patients suffered from depression, morethan 56 years age group patients suffer moredepression. Dhar Goutam (2013)[5] has conducteda cross sectional community based study amongelderly population in a slum of Midnapur town,West Bengal. Study result showed that 59.8%suffering from depression and prevalenceincreased with age. There was significantassociation with female sex, marital status andprevalence of depression.
The cross sectional community based studyconducted by Moulik S and Dasgupta (2012)[6]
on depression and its determinants in rural elderlyof West Bengal. Aim of the study was to assessthe psychosocial status of the elderly populationat Singur Block, Hoogly Dist,WB. Sample sizewas 82. Study result showed prevalence ofdepression 53.7%. Female sex, illiterate, poorper capita income people were significant riskfactors for depression. The World Mental HealthSurvey Initiative carried out cross-sectionalresearch in mental health, especially in developingcountries. The prevalence of depression in apopulation based study conducted in urbanPakistan was 45.9%.[7]
This study also identified that sex is associatedwith depression A possible explanation is thatwomen have to play many specific activities,which exposes them to increased or, demands,responsibilities in the family. Furthermore, the
social role attributed to women i.e. passivity,emotional expression, dependence allows themto be more emotional and extroversive in naturethan men. Hence being female is an independentfactor associated with depression.
In the present study it shows that associationbetween marital status and level of depression.An Indian study at Chennai supports thesefindings. Their study findings shows lack ofeducation and marital status are associated withdepression. Prevalence of depression was alsohigher among divorced (26.5%) and widowed(20%) compared to currently married subjects(15.4%, p<0.001), et al.
In this study depression was significantlyassociate with duration of illness with level ofdepression and complication of diabetes. AD etal[9] supports the present study findings. Theirstudy findings revealed increased risk fordiabetes was primarily associated with age,ethnicity, family history of diabetes, smoking,obesity, and physical inactivity. Diabetes-relatedcomplications—including cardiovasculardisease, kidney disease, neuropathy, blindness,and lower-extremity amputation—are asignificant cause of increased morbidity andmortality among people with diabetes.
Conclusion:
Screening for depression among patientssuffering from diabetes mellitus may lead toearly detection of the depression which ultimatelyhas better prognostic effects on disease courseitself. Depressed people should be counseledand if appropriate be referred to psychiatrist foroptimum management of the condition. Thiswill ultimately lead to delay in complicationsand improve the quality of life.
17

Reference :
1. World Health Report (2009)WHO, Geneva,Switzerland.
2. World Health Organization, Revised global burden ofdisease (GBD) 2004 update. Geneva:Who 2008.estimates. Available from:http://www.who.int/healthinfo/bodgbd2002revised/en/index.html.
3. International Diabetes Federation: The IDF. DiabetesAtlas. 4th ed. Brussels International Diabetes Federation2009. Retrieved Feburary 2 2010 from:
http://www.diabetesatlas.org/content/some-285-million-people-worldwide-will-live-diabetes-2010.
4. Egede LE & Ellis C. Diabetes and Depression: GlobalPerspectives. Diabetes Resclin pract 2010, 87:302-312.
5. Dhar Goutam. Prevalence of depression among elderly.2013 April, International Journal of Pharma & BioSciences; Apr-Jun2013; vol.4 (2):PB-11251.
6. Moulik S, Dasgupta A. Depression and its determinantsin rural elderly of West Bengal-A cross sectional study.International Journal of Biological and medicalResearch. 2012; 3(1):1299-1302.
7. Perveen S, Otho MS, Siddiqi MN, Hatcher J, RafiqueG. Association of depression with newly diagnosedtype II diabetes among adults aged between 25-60years in Karachi Pakistan. Diabetol Metab Syndrome.2010; 2:17.
8. Katon WJ. Clinical & Health services relationshipsbetween major depression, depressive symptoms, andgeneral medical illness. Biol psychiatry 2003; 54 :216-26.
9. Deshpande A D, MH, Schootman M. Epidemiologyof Diabetes and Diabetes-Related Complications.American Physical Therapy Association. DiabetesCare. May 16, 2008; 17 : 224-31.
10. Kroeke K, Spitzer RL, Williams JB, Lowe B. ThePatient Health Questionnaire Depressive SymptomsScales: A Systematic review. Gen Hosp. Psychiatry2010; 32: 345-59.
11. Beck AT, Steer RA, Brown GK. Beck depressionInventory- 2nd ed (BDI-II). The PsychologicalCorporation; 2012. Available from:http://cps.nova.edu/~cpphelp/BDIII.html.
18

Genetic Polymorphism of Cytochrome P450 Gene among BetelQuid Chewers of Eastern and North Eastern Population.Shri Aniket Adhikari1, Ms. Arunima Ghosh2, Ms. Priyanka Biswas3, Dr. Madhusnata De4
Original Article
1M.Sc, Research Scholar, 2M.Sc, Research Scholar, 3M.Sc, Research Scholar, 4M.Sc, PhD. Prof.Dept. of Genetics, VIMS, RKMSP
Abstract :
Betel quid (BQ) products have been classifiedby the International Agency for Research onCancer (IARC) as group I human carcinogensthat are associated with an elevated risk of oralcancers. The human genome encodes fifty-sevencytochrome P45O (P45O, or CYP) proteins. Themajority of these are involved in the metabolismof steroids, bile acids, fatty acids and xenobioticcompound which activate carcinogens. Thepresent paper focuses on the relationship ofCYP450 with betel quid which induces oralcancer.
Keywords:
Betel Quid, Cancer, Cytochrome P450.
Introduction:
The annual incidence of head and neck cancersworldwide is more than 550,000 cases witharound 300,000 deaths each year[1]. Male tofemale ratio ranges from 2:1 to 4:1. About 90%of all head and neck cancers are squamous cellcarcinomas (HNSCC). HNSCC is the sixthleading cancer by incidence worldwide. MostHNSCCs arise in the epithelial lining of the oralcavity, oropharynx, larynx and hypopharynx[2,3].These cancers are strongly associated with certainenvironmental and lifestyle risk factors liketobacco and alcohol consumption. The five-yearoverall survival rate of patients with HNSCC isabout 40-50%. About one third of patients presentwith early stage disease (T1-2, N0). Alcohol and
smokeless tobacco are known risk factors formost head and neck cancers, and incidence ratesare found to be higher in regions with high ratesof alcohol and tobacco consumption[4]. Earlysymptoms occurs as a lump or nodule, numbness,swelling, hoarseness, sorethroat, difficulty inmoving jaw or swallowing[5]. In south centralAsia 80% of head and neck cancer are found inoral cavity and oropharynx[6]. Betel quid chewingis a popular traditional activity that is integratedinto social and cultural practices andceremonies[7]. It is a cheaper pleasure, affordableby the least advantaged members of thecommunity. The habit has been prevailing forat least 2000 years throughout South Asia, South-East Asia and the South Pacific[8]. It is the fourthmost commonly used psychoactive substancein the world after caffeine, alcohol and nicotine[9].
It is also used as a mildly euphoric stimulantbecause it contains relatively high levels ofpsychoactive alkaloids. Chewing increases thecapacity to work, causes a hot sensation in thebody and heightens alertness. It is used amongthe poor to avoid boredom and to suppresshunger. Betel quid chewing is socially acceptablein all sections of society, in all age groups, andamong women; although in most countries it ismore often confined to the older age groups[7,9].Case-control studies from India, Pakistan andTaiwan reported an independent effect of betelquid as a risk factor for oral cancer. It hadincreased relative risks for pre-cancers; and
19

dose-response trends were also noticed for bothfrequency and duration of betel quid use[10].Thecytochrome P450(CYP) enzyme system consistsof a superfamily of hemoproteins that catalysethe oxidative metabolism of a wide variety ofexogenous chemicals including drugs,carcinogens, toxins and endogenous compoundssuch as steroids, fatty acids and prostaglandins[11].The CYP enzyme family plays an important rolein phase-I metabolism of many drugs. The namecytochrome P450 is derived from the fact thatthese proteins have a heme group and an unusualspectrum. These enzymes are characterised bya maximum absorption wavelength of 450 nmin the reduced state in the presence of carbonmonoxide. Of the 74 gene families so fardescribed, 14 exist in all mammals. These 14families comprise of 26 mammaliansubfamilies[12].
Materials & Methods :(A) Screening of Subjects:I) Camp in Eastern India, II) Camp in NorthEast India and III) patients attendingMaxillofacial and ENT department of RKMSPhospital.(B) Methods :i) Detailed history was taken from all cases byfilling up questionnaire.ii) Isolation of DNA3 ml peripheral blood was taken from each casesand DNA was isolated by QIAamp DNA bloodmini kit. (QIAGEN, Germany)iii) Molecular studyPCR of different cases were performed withforward and reverse primer at 58° C for annealingtemp with 35 cycle and total amount of PCRproduct is 26.5µL.
Result:
Table 1a: Detailed history of subjects from North East India:
TOTAL 56 1 2 12 24 11 6 9 6 33 23 40 16
PLACENorth EastIndia
NO
AGE GROUP( in years)
Addiction
No
BQ
Add
ictio
n
Tea
Dri
nker
Non
Tea
Dri
nker
Bel
ow 3
0
31-4
0
41-5
0
51-6
0
61-7
0
Abo
ve 7
0
Smok
ing
Alc
ohol
Bet
el Q
uid
20

Table 1b: Detailed history of subjects from Eastern India:
TOTAL 255 65 71 52 41 21 5 105 59 157 98 225 30
PLACEEasternIndia
NO
AGE GROUP( in years)
Addiction
No
BQ
Add
ictio
n
Tea
Dri
nker
Non
Tea
Dri
nker
Bel
ow 3
0
31-4
0
41-5
0
51-6
0
61-7
0
Abo
ve 7
0
Smok
ing
Alc
ohol
Bet
el Q
uid
Total 311 cases who had oral lesion was includedin this study. Out of which 56 cases were fromNorth Eastern states and 255 cases were fromEastern Indian states.
33 cases out of 56 cases had betel quid chewinghabit among North East population i.e. 58.92%and 157 cases had betel quid chewing habitamong Eastern Indian population i.e. 61.5%(Table 1a and 1b).
Table 2a: Poor metabolizer and Early metabolizer from North Eastern India
AreaNo. of Betal
Quid ChewersPoor Metabolizer Early Metabolizer
Karimganj, Assam 33 60% 40%
Table 2a: Poor metabolizer and Early metabolizer from North Eastern India
AreaNo. of Betal
Quid ChewersPoor Metabolizer Early Metabolizer
Eastern India 157 35.8% 64.2%
21

Early metabolizer are susceptible to oral cancerwhereas in case of poor metabolizer chances areless.
Discussion:
Betel quid chewing and its association withlocality, sex, education, occupation, smoking andother characteristics, even without tobacco, wasrecently classified as a human carcinogen by theInternational Agency for Research on Cancer(IARC). The CYPs of family of enzymes isresponsible for oxidation metabolism ofnumerous endogenous and exogenouschemicals[13]. Metabolism through CYPs in theoral mucosal lining could influence the uptakeof drugs prescribed for oral administration andmay generate toxic and mutagenic products fromprecarcinogens of food, tobacco and othersources. The buccal mucosa is a primary site fororal cancer in high incidence area[14]. CYP2A6activates some nitrosamines and is expressed inthe head and neck; a cancer risk may thus beassociated with higher expression of CYP2A6[15].A study by Kamataki and colleagues associateda poor metabolizer genotype with decreased riskof lung cancer in Japan[16]. One factor in the
analysis, however, may be a tendency forsmokers deficient in CYP2A6 to smoke lessbecause of its involvement in nicotinemetabolism [17]. CYP2A6 was found to be them o s t e f f i c i e n t a c t i v a t o r o f 3 -methylnitrosaminopropionitrile (MNPN) whichwere detected in the saliva of chewers of BQfollowed by CYP1A1, and N-nitrosoguvacoline(NGL), was activated by CYP2A6. Thegenotoxicity of NGL was observed to besubstantially lower than that of MNPN or 3-methyl nitrosaminopropionaldehyde (MNPA)[18].Human CYP2A andCYP2E subfamily membersplay important roles in the metabolic activationof arecoline-related N-nitrosamines [19,20,21].Poor metabolizer are less prone to oral cancerthan early metabolizer due to CYP2A6 genepolymorphism. Subjec t s who havepolymorphism in CYP2A6 are poor metabolizerand showed band in PCR. Early matabolizerhad normal CYP2A6 gene and showed no bandin PCR. In our study it has been found that morethan 50% cases from North Eastern stateswere poor metabolizer, whereas more than50% cases of Eastern region were earlymetabolizer.
References :
1. Jemal A, Bray F, Center MM, Ferlay J, Ward E, FormanD. Global cancer statistics. CA Cancer J Clin 2011;61(2):69-90.
2. Jemal A, Siegel R, Ward E, Murray T, Xu J, Thun MJ.Cancer statistics 2007. CA Cancer J Clin.; 57(1):43-66.
3. Boyle P and Bernard Levin. World Cancer Report2008. International Agency for Research on Cancer.
4. Hashibe M, Brennan P, Chuang S, et al. Interactionbetween Tobacco and Alcohol Use and the Risk ofHead and Neck Cancer: Pooled Analysis in the
International Head and Neck Cancer EpidemiologyConsortium. Cancer Epidemiol Biomarkers Prev 2009;18(2): 541-550.
5. Jemal A, Siegel R, Ward E, Murray T, Xu J, ThunMJ. Cancer statistics 2009. CA Cancer J Clin. 1999;59:225.
6. Parkin DM, Pisani P, Ferlay J. Estimates of theworldwide incidence of 25 major cancers in 1990.IntJ Cancer 1999;80:827.
7. Khawaja MRH, Mazahir S, Majeed A, Malik F,Merchant KA, Maqsood M, et al. Chewing betel,
22

areca and tobacco: perceptions and knowledgeregarding their role in head and neck cancers in anurban squatter settlement in Pakistan. Asian Pac JCancer Prev. 2006; 7: 95-100.
8. Mack TM. The new Pan-Asian paan problem. Lancet.2001; 357: 1638-1639.
9. Gupta PC, Ray CS. Epidemiology of betel quid usage.Ann Acad Med Singapore. 2004; 33 (Suppl): 31S-36S.
10. Jacob BJ, Straif K, Thomas G, Ramadas K, MathewB, Zhang ZF, et al. Betel quid without tobacco as arisk factor for oral pre-cancers. Oral Oncol. 2004; 40:697-704.
11. Shimada T, Yamazaki H, Mimura M, Inui Y,Guengerich FP.Interindividual variation in human livercytochrome P450 enzymes involved in oxidation ofdrugs, carcinogens and toxic chemicals: studies withliver microsomes of 30 Japanese and 30 Causasians.J Pharmacol Exp Ther. 1994; 270: 414-23.
12. Nelson DR, Koymans L, Kamataki T, Stegeman JJFeyereisen R, Waxman DJ et al. P450 superfamily:update on new sequence, gene mapping, accessionnumbers and nomenclature. Pharmacogenetics 1996;6:1-42.
13. Guengerich FP, Hosea NA, Parikh A, Bell Parikh LC,Johnson WW, Gillam EM, Shimada T. Twenty yearsof biochemistry of human P450s: purification,expression, mechanism and relevance to drug. Drugmetab dispos. 1998; 26: 1175 -1178.
14. Jussawalla DJ and Deshpande VA. Evaluation of cancerrisk in tobacco chewers and smokers an epidemiologicassessment. Cancer 1971; 28: 244-252.
15. Ding X, Kaminsky LS. “Human extrahepatic
cytochromes P450: Function in xenobiotic metabolism and tissue-selective chemical toxicity in the respiratoryand gastrointestinal tracts”. Annu Rev PharmacolToxicol 2003; 43:149–173. Review article.
16. Ariyoshi N, Miyamoto M, Umetsu Y,et al. “Geneticpolymorphism of CYP2A6 gene and tobacco-inducedlung cancer risk in male smokers”, Cancer EpidemiolBiomarkers Prev 2002; 11: 890–894.
17. Pianezza ML, Sellers EM, Tyndale RF. “Nicotinemetabolism defect reduces smoking”, Nature 1998 ;393:750.
18. M. Miyazaki, E. Sugawara, T. Yoshimura, et al,“Mutagenic activation of betel quid-specific N-nitrosamines catalyzed by human cytochrome P450coexpressed with NADPH-cytochrome P450 reductasein Salmonella typhimurium YG7108,” MutationResearch 2005; 581(1-2): 165–171.
19. Yamazaki H, Inui Y, Yun CH, Guengerich FP, ShimadaT. “Cytochrome P450 2E1 and 2A6 enzymes as majorcatalysts for metabolic activation of N-nitrosodialkylamines and tobacco-related nitrosaminesin human liver microsomes,” Carcinogenes is1992;13(10): 1789–1794.
20. Patten CJ, Smith TJ, Friesen M J, et al, “Evidence forcytochrome P450 2A6 and 3A4as major catalysts forN-nitrosonornicotine α-hydroxylation by human livermicrosomes,” Carcinogenesis 1997; 18(8): 1623–1630.
21. Nakagawa T, Sawada M, Gonzalez F J et al, “Stableexpression of human CYP2E1 in Chinese hamstercells: high sensitivity to N, N-dimethylnitrosaminein cytotoxicity testing.” Mutation Research 1996;360(3): 181–186.
23

Abstract:
Background And Aims:
Device-associated infection is a key factordetermining the clinical outcome among patientsadmitted in critical care areas. The objective ofthe study is to ascertain the epidemiology anddrug sensitivity pattern of organisms involvedin Device-associated infections in Intensive CareUnits (ICUs) in a tertiary care hospital.
Aims And Objectives:
To find out the incidence and prevalence ofvarious types device associated infections in ICUpatient.
To identify common organisms associated withvarious types of device associated infections inICU Care patients.
To find out the drug sensitivity pattern ofcommonly associated organisms producingdifferent types of device associated infections inICU care patients.
Materials:
Type of Study:
Prospective observational study.
Sample Population:
721 patient was admitted in this study period ofsix month in ICU, among those 312 patient wascatheterised at the time of admission due tovarious reasons, 50 patient developed sign and
Study on Device Associated Infections in Intensive Care Unitin a Tertiary Care Hospital in Kolkata
Dr. Rana Rajak1, Dr. J. Chakraborty2, Dr. P. Mukherjee3
symptoms of CAUTI.
Similarly among those 245 patient was intubatedat the time of admission due to various reason,45 patient developed signs and symptoms ofVAP.
Similarly among those 99 patients underwentcentral venous lines, 14 developed signs andsymptoms of CLABSI.
Time Period:
6 month from September, 2013 to February,2014.
Methods:
This prospective, observational clinical studyincluded patients admitted in ICU over a periodof six month from September, 2013 to February2014. Routine surveillance of various device-associated infections such as catheter-associatedurinary tract infections (CAUTI), central-line-associated blood stream infections (CLABSI),and ventilator-associated pneumonias (VAP)was done through specific Infection SurveillanceProforma.
Results:
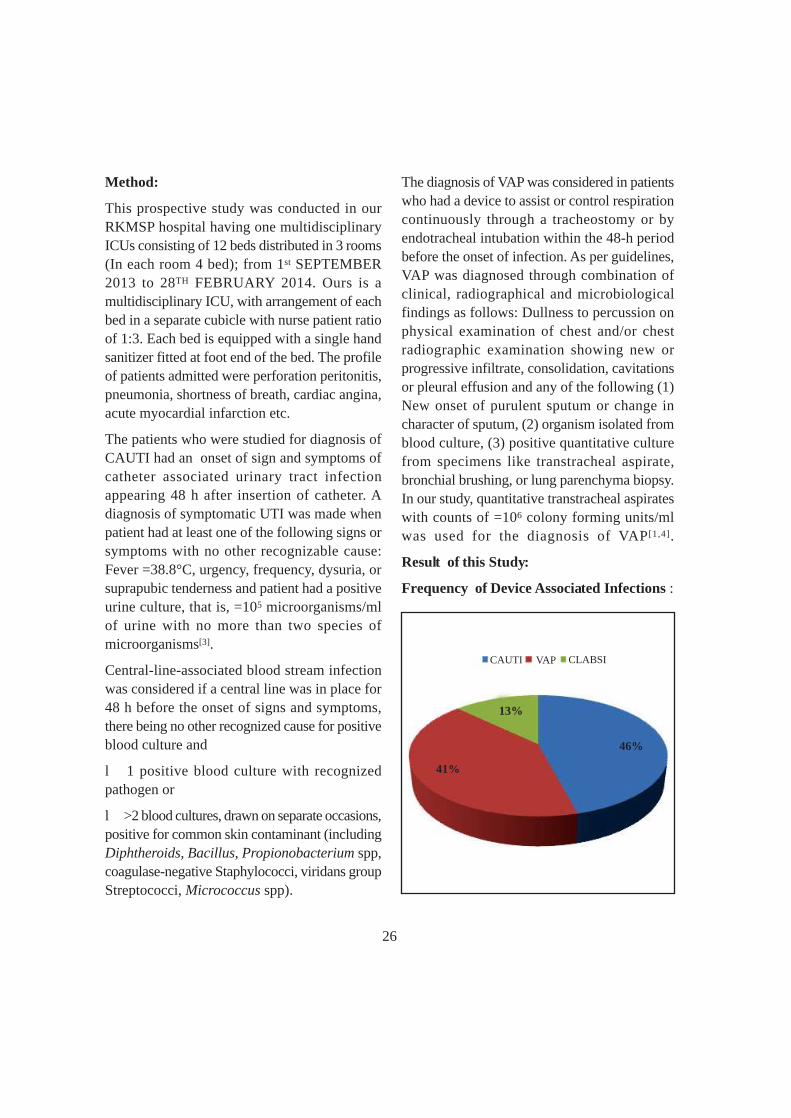
During my study from Sept. 2013 to Feb. 2014,721 patient were admitted in our ICU. Amongthem 109 patient developed DAI. Rate of DAIwere 15.11 per 100 patient. Among DAI, mostprevalent is CAUTI 45.9%, followed by VAP41.28% and CLABSI 12.8%. Overall rate of
12nd year PGT in RKMSP, VIMS; 2Prof. & HOD, Dept. of Medicine, RKMSP, VIMS;3Asstt. Prof., Dept. of Medicine, RKMSP, VIMS
Original Article
24

CAUTI were 22.89 (50/2184) per 1000 catheterdays and rate of VAP was 26.23 (45/1715) per1000 device days and rate of CLABSI was 14.14(14/990) per 1000 central venous catheter days.Commonly detected organisms in CAUTI wereE.coli (58%) followed by K. pneumoniae (14%).Drug sensitivity pattern of Ecoli showed 44%CRE, 37% beta lactum antibiotic sensitive, 6.9%ESBL sensitive and 10% Carbapenem sensitive.Commonly detected organisms in VAP wereAcinetobacter baumannii (44%) followed byK.pneumoniae (36%) and Pseudomonasaeruginosa (18%). The drug sensitivity patternof Acinetobacter showed carbapenem resistant(33%) and only 11% were ESBL sensitive anddrug sensitivity pattern of K.pneumoniae showed28% CRE and 4.44% beta lactum sensitive wheredrug sensivity pattern of Pseudomonas showed13% CRE and 2.22% were ESBL and 2.22%were beta lactum antibiotic sensitive. Commonlydetected organisms in CLABSI were alsoAcinetobacter baumannii (28%) followed byK.pneumoniae (22%) and Enterococcus sp.(14%).Here in CLABSI Acinetobacter and Klebsiellaboth were 100% carbapenem resistant andEnterococcus sp were 50% CRE and 50% wereglycopeptides sensitive.Conclusions:Gram-negative bacteria are common causes ofdevice-associated nosocomial infections. Mostof the organisms found in DAI are multi drugresistant. Prevention is more important thanmanagement of device-associated infections,simple measures of asepsis while insertion ofcatheters and general management of hygienecan decrease the incidence of nosocomialinfections. We recommended that education andawareness among health care workers as well as
adherence to standard guidelines forprevention of nosocomial infections.
Introduction:
Device-associated infection is a key factordetermining clinical outcome among patientsadmitted in critical care areas. Surveillance ofdevice-associated infections has become anintegral feature of infection control in allhospitals. These infections include catheter-associated urinary tract infections (CAUTI),central-line-associated blood stream infections(CLABSI), and ventilator-associated pneumonias(VAP). The Center for Disease Controland Prevention (CDC) has providedsimple definitions for the diagnosis of theseinfections.[1]
Surveillance of Device-associated infectionsdefines the extent and nature of problem, whichis the initial step toward reducing threat ofinfection in vulnerable hospitalized patients.[2]
Infection Control Committee, of any hospital,serves as a major tool for the surveillance ofthese infections. The hospitals in developedcountries generate their infection-controlsurveillance data from time to time. This is alsopertinent for empirically treating infections,especially in the intensive care unit (ICU) setting,where a thorough knowledge of theepidemiology, type, nature, and risk factors forinfections as well as the antimicrobial resistancepatterns of invading microorganism is needed[2]
It has been observed that there is scanty publisheddata on device-associated infections availablefrom Indian ICUs. The objective of the studywas to ascertain the epidemiology and riskfactors of device-associated infections in ICUsof a tertiary care hospital.
25
Method:
This prospective study was conducted in ourRKMSP hospital having one multidisciplinaryICUs consisting of 12 beds distributed in 3 rooms(In each room 4 bed); from 1st SEPTEMBER2013 to 28TH FEBRUARY 2014. Ours is amultidisciplinary ICU, with arrangement of eachbed in a separate cubicle with nurse patient ratioof 1:3. Each bed is equipped with a single handsanitizer fitted at foot end of the bed. The profileof patients admitted were perforation peritonitis,pneumonia, shortness of breath, cardiac angina,acute myocardial infarction etc.
The patients who were studied for diagnosis ofCAUTI had an onset of sign and symptoms ofcatheter associated urinary tract infectionappearing 48 h after insertion of catheter. Adiagnosis of symptomatic UTI was made whenpatient had at least one of the following signs orsymptoms with no other recognizable cause:Fever =38.8°C, urgency, frequency, dysuria, orsuprapubic tenderness and patient had a positiveurine culture, that is, =105 microorganisms/mlof urine with no more than two species ofmicroorganisms[3].
Central-line-associated blood stream infectionwas considered if a central line was in place for48 h before the onset of signs and symptoms,there being no other recognized cause for positiveblood culture and
l 1 positive blood culture with recognizedpathogen or
l >2 blood cultures, drawn on separate occasions,positive for common skin contaminant (includingDiphtheroids, Bacillus, Propionobacterium spp,coagulase-negative Staphylococci, viridans groupStreptococci, Micrococcus spp).
The diagnosis of VAP was considered in patientswho had a device to assist or control respirationcontinuously through a tracheostomy or byendotracheal intubation within the 48-h periodbefore the onset of infection. As per guidelines,VAP was diagnosed through combination ofclinical, radiographical and microbiologicalfindings as follows: Dullness to percussion onphysical examination of chest and/or chestradiographic examination showing new orprogressive infiltrate, consolidation, cavitationsor pleural effusion and any of the following (1)New onset of purulent sputum or change incharacter of sputum, (2) organism isolated fromblood culture, (3) positive quantitative culturefrom specimens like transtracheal aspirate,bronchial brushing, or lung parenchyma biopsy.In our study, quantitative transtracheal aspirateswith counts of =106 colony forming units/mlwas used for the diagnosis of VAP[1,4].
Result of this Study:
Frequency of Device Associated Infections :
CAUTI VAP CLABSI
41%
13%
46%
26

Percentage Prevalence of Organisms in Cauti:
Organisms No. of Subjects Percent P
Acinatobacter baumannii 1 2
Candida albicans 2 4
Candida lusitaniae 1 2
Candida tropicalis 2 4 <0.001
Citrobacter freundii 1 2
E.Coli 29 58
Enterococcus gallinerum 2 4
Klebsiella pneumonia 7 14
Proteus mirabilis 2 4
Pseudomonas aeruginosa 3 6
Percentage Prevalence of Organisms in CAUTI
ACINATOBACTER BAUMANNII
CANDIDA ALBICANS
CANDIDA LUSITANIAE
CANDIDA TROPICALIS
CITROBACTER FREUNDII
E.COLI
ENTEROCOCCUS GALLINERUM
KLEBSIELLA PNEUMONIA
PROTEUS MIRABILIS
58
4
14
46 2 4 2 4
2
27

Drug Sensitivity Pattern of Organisms Found in Cauti:
Table (A):
Organism Enterococcus Klebsiella Proteus PseudomonasGallinerum Pneumonia Mirabilis Aeruginosa
Beta lactum Sensitive 0 71.43 0 33.33
Esbl sensitive 0 0 0 0
Glycopeptides sensitive 100 0 0 0
Azoles sensitive 0 0 0 0
Carbapenem resistant 0 14.29 0 66.67
Carbapenem sensitive 0 14.29 100 0
Fluroquinolones 0 0 0 0
Table (B):
Organism Acinatobacter Candida Citrobacter E.ColiBaumannii Species Freundii
Beta lactum sensitive 0 0 0 37.93
ESBL sensitive 0 0 0 6.9
Glycopeptides sensitive 0 0 0 0
Azoles sensitive 0 100 0 0
Carbapenem resistant 100 0 0 44.83
Carbapenem sensitive 0 0 0 10.34
Fluroquinolones 0 0 100 0
28

Overall Antibiotic Sensitivity Pattern of Organisms Found in Cauti:
Organisms No. of Subjects Percent P
Acinetobacter Baumannii 20 44.44
E.coli 1 2.22 <0.003
Klebsiella Pneumoniae 16 35.56
Pseudomonas Aeruginosa 8 17.78
Percentage Prevalence of Organisms Found in Ventilator Associated Pneumonia:
Percentage Prevalence of Organisms in CAUTIBeta Lactum Sensitive ESBL Glycopeptides Sensitive Azoles Sensitive
Carbapenem Resistant Carbapenem Sensitive Fluroquinolones
150
100
50
0
Acinato
bacte
r...Can
dida S
pecie
sCitr
obac
ter Fr
eund
ii
E.Coli
Entero
cocc
us....
Klebsie
lla Pn
eumon
iaPr
oteus
Mira
bilis
Pseu
domon
as....
100 100 100 100 100
10.3444.83
6.937.93
14.2914.2971.43
66.6733.33
Percentage Prevalence of Organisms in VAP
44
2
36
18
Acinetobacterbaumannii
E.coli KlebsiellaPneumoniae
PseudomonasAeruginosa
29

Drug Sensitivity Pattern of Organisms Found in VAP:
Drug SensitivityPattern
OrganismsAcinetobacter
BaumanniiKlebsiella
PneumoniaeBeta Lactam Antibiotics 0 2.22 4.44 2.22Sensitive
Carbapenem Sensitive 0 0 2.22 0
Esbl Sensitive 11.11 0 0 2.22
Carbapenem Resistant 33.33 0 28.88 13.33
E.ColiPseudomonasAeruginosa
Percentage Prevalence of Organisms Found in Clabsi:
Organisms No. of Subjects Percent
E. coli 1 7.14
Elizabeth kingimeningoseptica 1 7.14
Enterococcus Species2 14.29
Staphlococcus Haemolyticus 1 7.14
Acinetobacter baefae 1 7.14
Acinetobacter baumanii 4 28.57
Klebsiella pneumonae3 21.43
Pseudomonas aeruginosa 1 7.14
BETA LACTAM ANTIBIOTICS Sensitive Carbapenem Sensitive ESBL Carbapenem Resistant
454035302520151050
33.33
11.112.22
28.88
4.44
13.332.222.22
0
Acinetobacter E.coli KlebsiellaPneumoniae
PseudomonasAeruginosa
ORGANISMS
30

Drug Sensitivity Pattern of Organisms Found in Clabsi:
E coli 100 0 0 0
Elizabeth kingimeningoseptica 0 0 0 100
Enterococcus Species 0 50 50 0
Staphlococcus haemolyticus 0 100 0 0
Acinetobacter baefae 0 0 100 0
Acinetobacter baumanii 0 0 100 0
Klebsiella pneumonae 0 0 100 0
Pseudomonas aeruginosa 0 0 100 0
Organisms
Pattern
ESBL GlycopeptideSensitive
CarbapenemResistant
Fluoroquinolones
Percentage Prevalence of Organisms : CLABSI
E.coli
Staphlococcus haemolyticus
Klebsiella pneumonae
Elizabeth kingi meningoseptica
Acinetobacter baefae
Psedomonas aeruginosa
Enterococcus Species
Acinetobacter baumanii
7% 7%7%
14%22%
20%
7%
7%
31

Antibiotic Sensitivity Pattern : CLABSI
ESBL Glycopeptide Sensitive Carbapenem Resistant Fluoroquinolones
100806040200
100 100
50 50
100 100 100 100 100
E.Coli
Elizab
eth ki
ngi...
..Ente
roco
ccus
Spec
iesSt
aphlo
cocc
us....
.
Acineto
bacte
r bae
faeAcin
etoba
cter b
auman
iiKieb
siella
pneu
monae
Psed
omon
as ae
rugin
osa
Discussion:
Infection surveillance analysis is an imperativeprerequisite for quality care and prevention ofdevice-associated infections. Several studies haveshown that routine surveillance of these infectionscan reduce the incidence by as much as 30%.However, in developing countries, due to lackof formal surveillance the rate of health-care-associated infections is high and compliance withhand hygiene is low.
In India, the rate of device-associated infectionsshows variations and has great implication. Habibiet al. in their study from AIIMS, Delhi, India,found the incidence rates of health-care-associatedinfections to be 11.3/1000 urinary catheter days,3.4/1000 central venous pressure line days and31.4/1000 ventilator days. But in our studyincidence rate of CAUTI (22.8 per 1000 catheterdays) and CLABSI (14.14 per 1000 central linecatheter days) are quite high and the incidencerate of VAP (26.23 per 1000 device days) isalmost similar to that study.
In comparison to gram-positive bacteria, gram-negative bacteria were more commonly isolatedfrom cases of device associated infections.Acinetobacter species, Klebsiella, Pseudomonas,E.coli, Enterococcus sp that are widely knownto be the most common cause of device-associated infections were also found to be themost culpable organisms in our ICUs. Similarpicture has been observed by other investigators.The study of Agarwal et al. in another institute,from our geographical region, also foundmajority of infections with gram-negative bacilliin respiratory ICU. Moreover, Acinetobacterspecies followed by P. aeruginosa were foundto be the most common cause of pneumonia.[5]
Here in my study most common offender inventilator associated pneumonia is alsoAcinetobacter (44%) followed by K.pneumoniae(36%) and Psedomonas aeruginosa (18%). Heremost of organisms are carbapenem resistant(Acinetobacter-33% CRE, Klebsiella-28.8%CRE, Pseudomonas -13.33% CRE) and few areESBL and betalactum antibiotics sensitive
32

(Acinetobacter 11.11% ESBL sensitive andKlebsiella-4.44% beta lactum sensitive, 2.22ESBL sensitive and Pseudomonas -2.22% ESBLand 2.22% beta lactum sensitive).
In a study done on the prevalence of urinarycatheter related infections in Federal Medicalcentre, Abeokuta, Nigeria; out of 200 samplesexamine, 82 (41.10%) yielded growth of bacteriawhile 118 (59.00%) were negative. The urine ofthe 82 positive cases yielded E. Coli 29 (35.40%),Klebsiella pneumoniae 17 (20.9%).
Pseudomonas aeruginsa 10 (15.5%), S. aureus13 (12.1%), Proteus mirabilis (9.75%) and C.albicans (6.0%). In our study percentageprevalence of E.coli is quite high (58%), followedby Klebsiella (14%), Candida sp (10%),Pseudomonas (6%), Acinetobacter (2%). Herecarbapenem resistan E.coli are 44% and 37.93%E.coli are beta lactum antibiotic sensitive and10% are carbapenem sensitive. All candida spfound in CAUTI are 100% azoles sensitive.
In our institute various reasons for increasedincidence of CLABSI include multidisciplinary
ICU, less stringent infection control practicesand high cost of alcoholic hand disinfectant thatis not available at the bed side of all patients.Berenholtz et al. found a significant decline inCLABSI after following five points interventionmodule in their surgical ICU. The interventionmodule included education of staff, creating acatheter insertion cart, asking providers eachday whether catheters could be removed,implementing a checklist to ensure the adherenceto evidence-based guidelines for preventingCLABSI and empowering nurses to stop thecatheter insertion procedure if a violation of theguidelines was observed.[6] In this study rate ofCLABSI is 14.14 per 1000 catheter days whichis quite high in comparison to other study. Heremost common organisms found is Acinetobacterbaumanii (28%), followed by K.pneumoniae(21%), Enterococcus sp (14%), Acinetobacterbaefae (7%), Staphy lococcus haemolyticus(7%). All Acinetobacter, Klebsiella andPseudomonas are 100% carbapenem resistantand 50% Enterococcus are Carbapenem resistantand rest 50% are glycopeptides sensitive.
References:
1. Horan TC, Andrus M, Dudeck MA. CDC/NHSNsurveillance definition of health care-associated infectionand criteria for specific types of infections in the acutecare setting. Am J Infect Control. 2008;36:309–32.[PubMed].
2. Eggimann P, Pittet D. Infection control in ICU. Chest.2001;120:2059–93.
3. CDC/NHSN surveillance definition of Catheter.Associated Urinary Tract Infection Event. 2009. Mar,[Last cited on 2013 Mar 13]. Available from:http://www.cdc.gov/nhsn/library/html.
4. Koenig SM, Truwit JD. Ventilator-associatedpneumonia: Diagnosis, treatment and prevention. ClinMicrobiol Rev. 2006;19:637–57. [PMC free article][PubMed]
5. Agarwal R, Gupta D, Ray P, Aggarwal AN, JindalSK. Epidemiology, risk factors and outcome ofnosocomial infections in a respiratory intensive careunit in north India. J Infect. 2006; 53:98–105.
6. Berenholtz SM, Pronovost PJ, Lipsett PA, Hobson D,Earsing K, Farley JE, et al. Eliminating catheter-relatedbloodstream infections in the intensive care unit. CritCare Med. 2004;32:2014–20. [PubMed].
33

Pre analytical factors play a major role in thevariation of test results in routine clinicalchemistry. It accounts for 81% of all errors inthe diagnostic lab[1]. Haemolysis is the mostprevalent interferent among all pre-analyticalvariables which exert a strong influence on thereliability of laboratory test results[2,3,4]. In clinicallabs the mostly encountered problem is theoccurrence of haemolysed samples and itsprevalence is as high as 3.3% of all routinesamples[5] accounting for up to 40-70% of allunaccepted samples identified[5]. It is found tobe five times higher than all pre analytical issues.Haemolysed samples are considered to beunsuitable for routine chemistry testing due toits biological and analytical interference thatleads to not only erroneous results but also causesdelay in patient management.
With the advent of time the clinical laboratorieshas expanded its horizon towards a newdimension. The increasing availability ofautomated analyzers with advanced technologyand properly trained lab technologists diminishthe chances of analytical errors and contributeto the accuracy of test results. In spite of thisdevelopment most labs are still struggling withthe most primitive preanalytical issue ofhaemolysis. In – vitro haemolysis still persistsin most of the clinical labs and hospitalsthroughout the world and is the leading cause ofsample rejection for routine testing for the indooras well as outdoor patients as reported by theCollege of American pathologist (CAP)[6] and
Haemolysis: A Real Challenge in Clinical Chemistry Test ReportingDr. Rinini Dastidar1, Ms. Tirna Halder2
continues to be a growing concern. EuropeanPre analytical Scientific Committee., EPSC hases tabl ished thei r speci f ic web s i tespecimencare.com to deal with this mostimportant and challenging issue of haemolysisin daily lab testing.
The aim of this article to summarise the currentknowledge of different causes of haemolysis.Italso tries to evaluate the influence of in vitrohaemolysis on clinical chemistry testing andprovides a tentative guidelines for detection andmanagement of haemolysed samples inlaboratory practice.
Causes of Haemolysis:
Haemolysis may be defined as the release ofhaemoglobin and other intracellular componentsfrom erythrocytes to the surrounding plasmadue to breakage of cell membrane. 2 mg/dl ishigher reference limit for free hemoglobin inplasma and in serum the value is 5 mg/dl[7]
Haemolysis is visually detectable showing red/pink tinge of colour in plasma or serum whenhaemoglobin concentration exceeds this range.
Haemolysis is of two types: In-vitro and In vivohaemolysis
l In-vivo hemolysis may be due topathological conditions, such as autoimmunehemolytic anemia or transfusion reaction[8].
l In-vitro hemolysis may be due to improperspecimen collection, specimen processing, orspecimen transport.
1Assoc. Prof., Dept. of Biochemistry, RKMSP, VIMS; 2Project Assistant, Dept. of Biochemistry, RKMSP, VIMS
Review Article
34

Causes of In-Vitro Haemolysis:a) Specimen Collection:Vein Size and Trauma—l Haemolysis is caused by improper selectionof venepuncture site such as distal region froman antecubital region of the arm[9].l Repeated unsatisfactory attempts, missingof vein or traumatic venepuncture can causehaemolysis.l Slow blood flow through the syringe dueto improper venepuncture may indicate tovenous occlusion due to the lumen of the needlebeing too close to the inner wall of the vein isresponsible for the haemolysis[10].l Avoid puncturing areas that have ahematoma.Alcohol Preparation: Cleaning the venepuncturesite with alcohol and immediately drawing bloodwithout waiting it to be dried off causeshaemolysis[11].Tourniquet Time: Prolonged tourniquet timecauses interstitial fluid to leak into the tissuesand causes haemolysis[12].Needle Size: Very small bore needle applies alarge vacuum force to the blood and exerts shearstress on the red blood cells causing haemolysis.Similarly usage of large bore needle may causefaster and forceful flow of blood through theneedle ending in haemolysis[13, 14].Syringe Collection: At the time of bloodcollection if the plunger of a syringe is pulledback too far while using a large bore needle itcauses haemolysis. Haemolysis is caused if theblood from the syringe is pushed down into thetube with too much force.Loose Collection: Ensure that all connectionsof the collection components are tightened.Several studies have noted that when blood isdrawn from a peripheral IV catheter, a higher
incidence of hemolysis occurs due to frothingof the blood from a loose connection of theblood collection assemblies[8,15,16]. Looseconnections introduce air into the system andcause frothing in the specimen, which can resultin hemolysis.Improper Ratio of Anticoagulant to Blood:All tubes to be filled to the full capacity to ensurethe proper blood-to-additive ratio. Certainadditives in high concentrations, such as sodiumfluoride, EDTA can cause varying degrees ofhemolysis[17].Specimen Processing:l It is recommended that blood to be mixedwith the anti coagulant by gentle tube inversions.Haemolysis is caused by vigorous shaking ofblood in the tube after collection.l Blood Samples are to be kept for arecommended period of time for clot formation.Otherwise it leads to appearance of fibrin inthe serum and attempt of dislodging of thisfibrin with the applicator stick may causehaemolysis[18,19].l Exposure to excessive heat or cold can causeRBC rupture and hemolysis[20].l Contact of plasma or serum with blood fora prolonged period of time causes haemolysis[21].l Centrifugation at a too high speed for aprolonged period may result in haemolysis.Transport of Samples:l Delayed transport of samples to thelaboratory is another cause for haemolysis.l Cautions to be taken while blood is to betransported in pneumatic tube systems which isreported to create turbulence and RBC traumawithin the tube[22]. Hand delivery of specimenswhen ever feasible is recommended.l Store and transport specimens in regulatedtemperature conditions, as temperature that are
35

too high or too low can rupture red cellmembranes.In –Vivo Haemolysis:In vivo haemolysis is reported to be rare andaccounts to less than 2% of all haemolysedsamples[23].Causes:l In vivo haemolysis might be caused due tohereditary, acquired and iatrogenic conditions:l Typically, in vivo hemolysis does not dependon the techniqueof the healthcare provider andit is thus virtually unavoidable and potentiallyinsurmountable.l Autoimmune hemolytic anaemial Hemoglobinopathiesl Drugsl Severe infectionsl DICl Transfusion reactionsl HELLP syndrome of variabilityEffect of Haemolysis on Clinical ChemistryTest Parameters:Interference by haemolysis is linearly dependenton the final concentration of blood cell lysate inthe specimen. The International Federation ofClinical Chemistry (IFCC) and LaboratoryMedicine provides the following definition“Analytical interference is the systematic errorof measurement caused by a sample componentwhich does not by itself produce a signal in themeasuring system[24]. Chemical interference offree Hb due to haemolysis is noted in theanalytical reactions and confers problems withthe true measurement of analytes and inducesfalse elevation of some analytes (K, LDH, andAST) though some analytes show decreasedvalue due to dilution effect. On a whole spectralinterference imparts a role in the measurement
of analytes which are employed at 415, 540 and570 nm. The interference caused by haemolysisis due to strong absorbance of Hb at thiswavelength (550 nm)[25,26,27]. It has beendocumented that the interference of in vitrohaemolysis on laboratory testing might be causedby the leakage of intracellular component fromRBC. Apart from Hb erythrocytes containstructural proteins, enzyme lipids andcarbohydrates which also cause interference tothe assay parameters[28]. Several laboratoryresults are seriously affected by haemolysis suchas potassium, sodium, calcium, magnesium,bilirubin, total protein, aldolase, alkalinephosphatase, GGT, iron and folate[29,30]. Overestimation of AST, CK, Creatinine, Fe, LDH,lipase Mg, K, urea are reported by haemolysis.Whereas Alb, ALK, Bil, Cl, GGT, Glu, Sodiumare reported to be underestimated due todilution[31]. Relative increase of AST, LDH, Mg,P, K are due to large difference between intraand extracellular concentration for theseanalytes[32,33]. CK value increases due toanalytical interference caused by releasedintracellular kinase which is not completelyinhibited under operating condition[34].Spectral overlap and a reaction betweenhaemolysate and reaction components causehaemolytic interference on Bil, lipase and Fe[35].The haemolytic interference on immune assay are reported less frequent than spectro-photometric method[36] but even small degreeof haemolysis is not accepted for certainimmunological assay such as insulin, glucagon,calcitonin, PTH, ACTH and gastrin due to releaseof proteolytic enzyme that destroy small peptide.Folate estimation in haemolysed sample is notat all recommended due to its 30 times greaterconcentration in RBC than serum.
36

Table 1 : Laboratory parameters affeced by haemolysis and/or blood cell lysis in the specimen.
Source : Giuseppe Lippi, Norbert Blanckaert Pierangelo Boraini et al; Haemolysis: an overviewof the leading cause of unsuitable specimens in clinical laboratories; Clin Chem Lab Med 2008;
Parameter Bias Cause Reference
Adrenocorticotropic hormone Negative Proteolysis 36Activated partial thromboplastin time Negative Release of thromboplastic substances 39Antithrombin Negative Analytical Interference 41Aspartate aminotransferase Positive Cellular release 27Alanine aminotransferase Positive Cellular release 27Albumin Negative Dilution 27Alkaline phosphates Negative Analytical interference 27Bilirubin (neonatal) Variable Analytical interference 29Bilirubin (total) Negative Analytical interference 23Calcitonine Positive Proteolysis 36Chloride Negative Dilution 27Cortisol Negative Analytical interference 31Creatine kinase Positive Analytical interference 27Creatinine Positive Analytical interference 27D-dimer Positive Release of thromboplastic substances 39Fibrinogen Negative Release of thromboplastic substances 39Folate Positive Cellular release 36y-Glutamyltransferase Negative Analytical interference 27Gastrin Negative Proteolysis 36Glucagon Negative Proteolysis 36Glucose Negative Dilution 27Haptoglobin Negative Analytical interference 38Homocysteine Negative Analytical interference 37Insulin Negative Proteolysis 36Iron Positive Analytical interference 27Lactate dehydrogenase Positive Cellular release 27Lipase Positive Analytical interference 27Magnesium Positive Cellular release 27Parathormon Negative Proteolysis 36Phosphorus Positive Cellular release 27Potassium Positive Cellular release 27Prostate specific antigen Positive Analytical interference 31Prothrombin time Positive Release of thromboplastic substances 39Sodium Negative Dilution 27Urea Positive Cellular release 27Testosterone Negative Analytical interference 31Troponin T Negative Analytical interference 33Vitamin B12 Negative Analytical interference 31
37

Detection and Management of Haemolysis:
A significant source of error on clinical chemistrymeasurements due to its analytical interferencecaused by haemolysis. The altered result due to
In vitro haemolysis is usually caused by inappropriate blood collection, handling andprocessing of the specimen as many non technicalpersons are involved in phlebotomy practices.Proficiency of nursing staffs in phlebotomy isalso being questioned[18]. Though haemolysis
HaemolyticSpecimen
Systematic detectionand qualification
of haemolysis
Clinically or analyticallysignificant haemolysis
Clinically or analyticallyinsignificant haemolysis
Clinicians warningon the probability ofin vivo heaemolysis
Registernon-conformity Perform analyses and
Report results without warnings
Analyses affectedby haemolysis
Analyses unaffectedby haemolysis
Do not perform analysesand
Ask for an additional sample
Figure 1 : Suggested procedure for identification and management of haemolytic specimens inclinical laboratories.Source : Giuseppe Lippil, Norbert Blanckert, Pierangelo Bonini et al; Haemolysis : an overviewof the leading cause of unsuitable specimens in clinical laboratories; Clin Chem Lab Med 2008;46(6):764-772; 2008.
this interference leads to incorrect interpretation,wrong diagnosis and potentially inappropriateand unfavorable outcome of the patients. Thiscan be prevented by implementing someoperating guidelines and recommendations.
has very detrimental effect on patient reportsbut too often it is underestimated and remainundetected in daily clinical laboratory practice[38].Detection, recognition, quantitation andmanagement of extra analytical source ofvariability are mandatory in this aspect[39].
38

Data Correction for Haemolysis :
Requesting for a fresh sample unaffected byhaemolysis is the best option for better patientmanagement but sometimes recollectionbecomes very problematic especially frompediatric departments. Correction for haemolysismay be an alternative approach to this problemwhen intravascular haemolysis is definitely ruledout. Analytical methods which are not affectedby haemolysis should be employed butelimination of analytical interference isproblematic. Multi wavelength analysis andblank measurement[42] could be employed toinfluence spectral interference. But it cannot beapplied for those analytes whose concentrationsare affected by intracellular leakage or dilution.
Data correction is based on specific equationwhere Hb concentration is multiplied by slopeobtained from linear regression curve betweenthe bias observed for each analyte at relativefree Hb concentration in serum or plasma.However the practice of correcting results is notrecommended and might introduce in accuracyof test results[45].
Reports with Interpretative Comments:
It has been recommended to a qualitativecomment should be accompanied with the testresults affected by haemolysis which might behelpful in early diagnosis and provide appropriatetreatment[43]. Reports with the critical valuesshould be timely intimated to requestingclinician[44] with specific parameters should berelated with alerts or flags generated byautomated machines at the time of testinghaemolysed sample.
There are differences of opinions in this regard,some are in favour and others disapprove thisway of management[45]. The main reason of
Detection and Management of haemolysis:Visual assessment of degree of actualconcentration of haemolysis not reliable and isbeing supported by many studies[40] though it ispracticed in various labs. The recent advancesin lab technology lead to an increasing trends inautomation of various process. Analyzersprovided with a software capable of automatic(testing and evaluating and correcting haemolyticinterference) detection of serum indices ofhaemolysis (Haemolysis index). It isadvantageous for many reasons. Beyond itsincreased productivity, throughput and decreaseerror rate it helps to detect even mildlyhaemolysed sample (less than 0.6 mg/dl) whichremains undetected by visual process and AST,LDH, K and Na measurements are unsuitableat this degree of haemolysis[33].Dealing with haemolysed samples in differentlabs vary across the country and worldwide. Ithas been published that 30% of laboratory neverask for a fresh sample if serum is haemolysedand 43% of lab determines the degree ofhaemolysis based on potassium concentration isif K+ concentration is not elevated in haemolysedsamples, the fresh samples are not asked.Three potential approaches could be suggestedto deal with haemolysed samples[31]
a) Mathematical correction of haemolysisaccording to the estimated degree ofhaemolysis.
b) Report of test results with a standard indication(interpretative comment) of the potentialinterference arising from haemolysis.
c) Request for fresh samples as haemolysedsamples are rejected for analysis.
d) Intimation to clinician to rule out thepossibility of in vivo haemolysis.
39

disapproval is that these results are actuallyerroneous and seriously misleading and thecomments might not be noticed or interpretedalways by the responsible clinical staff for patientcare at that time.
Clinician Warning:
Clinicians should be informed to safely rule outin vivo haemolysis and evaluating recollection[46].
Management:
Besides this training is a pre requisite factors tominimize the errors of pre analytical phase ofthe test [47].
The guidelines and procedures of blood collectionshould be kept under strict surveillance especiallyat ICU, Maternity, Pediatrics and Emergencydepartments [48].
Prolonged tourniquet time should be avoidedand collection from a haematoma site is a bigno-no affair.
Vigorous shaking of blood after collection is tobe prohibited.
Appropriate temperature and humidity at thecollection site is to be properly maintained.
Transportation and storage of the samples is tobe strictly monitored as per standard guidelines.
Centrifugation temperature, speed and time hasto be monitored regularly[49].
Detection and Management of Haemolysis inOur Lab:
Haemolysis is of great concern in our day to daypractice at our hospital based laboratory whichnot only puts biochemist into a great dilemmaof reporting the test results of these haemolysedsamples but also creates lots of confusion and
delay in clinical management. This problem isbeing addressed by our team and sincere effortsare being taken to solve the problem ofhaemolysis. Though as per standard laboratoryguidelines haemolysis is a big rejection criterionfor routine chemistry samples but it is notpractically feasible to reject all the samples.Haemolysis is detected by our routine chemistryautoanalyser Vitros 5,1 FS (Ortho ClinicalDiagnostics). Automated assay specificthresholds (like H indices, lipemic and icteric)are the inbuilt characteristic of this machine.This enables use of the micro sensor technologyto evaluate degree of interference caused byhaemolysis, lipemia and icteric in the samplesof specific wavelength[51] .Vitros 5,1 FS provideshaemolysis index based on mathematicalcalculations from measuring the absorbance ofthe sample at different wave lengths. The reportsare released with comments and flags (H) withthe parameters affected by hemolysis generatedby the analyzer. Reports are also accompaniedwith a note indicating degree of haemolysis ashaemolytic index. This automated serum indexof haemolysis improves reproducibility andaccurate resulting for proper clinicalinterpretation by the physicians[52,53,54,55,56] asdemonstrated by previous studies.
Initiatives are taken to document the total no.of haemolysed samples received by the lab onregular basis and gradation of haemolysedsamples is determined by the machine. Effectof haemolysis on K, AST, LDH, T Bil, ALT,CK, Mg, Alb, TP, ALK P, lipase, phosphorousare noticed and evaluated by the machine andthis observation is being supported by otherpublications across the world. It is observed thatall the analytes except lipase and Mg are affectedby moderate (H- index >250) and significant
40

Reference :1. Goswami B, Singh B, Chawla R, Mallika V. Evaluation
of errors in a clinical laboratory:a one year experience.Clin Chem Lab Med 2010;48:63-66.
2. Simundic AM, Nikolac N, Vukasovic I, Vrkic N. Theprevalence of preanalytical errors in Croatian ISO15189 accredited laboratory. Clin Chem Lab Med 2010;May 4.
3. Lippi G, Bassi A, Brocco G, Montagnana M, SalvagnoGL, Guidi GC. Preanalytic error tracking in a laboratorymedicine department: results of a 1 year experience.Clin Chem 2006;52:14423.
4. Rattan A, Lippi G. Frequency and type of preanalyticalerrors in a laboratory medicine department in India.Clin Chem Lab Med 2008; 46:16579.
(H- index >500) haemolysis. K+ showed 5-10 %positive bias in moderately haemolysed samplesbut CK and iron values are significantly increasedat moderately haemolysed samples. LDH issignificantly increased even at slighty haemolysed(HI >100) samples. ALT and ALK showed anegative bias in moderate as well as significanthemolysis. The integrity of grossly haemolysedsamples are being questioned so, generally theyare rejected, and requests are made for freshsamples in such cases.Conclusion:Hemolysis is still one of the biggest challengesto the laboratory specialists. As for the currentknowledge, automated platforms are to beadopted by laboratories for continuous successfuland standardized detection and management ofhemolyzed specimens, visual detection shouldbe abandoned, due to the low sensitivity and lowreproducibility. It is strongly recommended toask for a new sample if a lab receives haemolysedsample instead of giving spurious resultsgenerated by haemolysed samples. In case newsample(s) cannot be obtained, the responsibilityof the laboratory personnel is to communicate
the problem to the physician responsible for thepatient management and seek for the bestsolution for the best of the patient care. OnlyEducation and awareness of the cause, effectand consequences of haemolysis among the labprofessionals and other health care staffsincluding the clinicians are pivotal in order toreduce the uncertainties in the pre analyticalphase. Early recognition and identification ofthe unsuitability of samples can reduceunnecessary in vestigations.
Our sincere appeal to all health careprofessionals including laboratory staffs, wardsisters, phlebotomists and clinicians not tounderestimate this serious pre-analytical issueand its severe detrimental effects on clinicalchemistry test results. We are optimistic thatwith joint efforts we will definitely be able toovercome this problem in near future.
Acknowledgement:
The assistance provided by the DMLT studentsto document regular incidence of haemolysedsamples received in the Department ofBiochemistry is gladly acknowledged.
5. Giuseppe Lippi1, Norbert Blanckaert, PierangeloBonini, Sol Green, Steve Kitchen, Vladimir Palicka,Anne J. Vassault and Mario Plebani. Haemolysis: anoverview of the leading cause of unsuitable specimensin clinical laboratories. Clin Chem Lab Med 2008;46(6):764–772 _ 2008.
6. Evacuated Tubes and Additives for Blood SpecimenCollection, Fourth Edition; Approved Standard,NCCLS Dec. 1996, Doc. H1-A4, Vol. 16, No. 13.
7. Thomas L. Haemolysis as influence and interferencefactor. eJIFCC vol 13(4).
8. Lemery L. Oh, No! It’s Hemolyzed! What, Why, Who,How? Advance for Medical Laboratory Professionals,Feb. 15, 1998: 24-25.
41

25. Guder W. Haemolysis as an influence and interferencefactor in clinical chemistry. J Clin Chem Clin Biochem1986;24:125–6.
26. Sonntag O. Haemolysis as an interference factor inclinical chemistry. J Clin Chem Clin Biochem 1986;24;127– 39.
27. Steen G, Vermeer HJ, Naus AJ, Goevaerts B, AgricolaPT, Schoenmakers CH. Multicenter evaluation of theinterference of hemoglobin, bilirubin and lipids onSynchron LX-20 assays. Clin Chem Lab Med 2006;44:413–9.
28. Guder W. Haemolysis as an influence and interferencefactor in clinical chemistry. J Clin Chem Clin Biochem1986; 24:125–6.
29. Sonntag O. Haemolysis as an interference factor inclinical chemistry. J Clin Chem Clin Biochem 1986;24:127–39.
30. Yucel D, Dalva K. Effect of in vitro hemolysis on 25common biochemical tests. Clin Chem 1992; 38:575–7.
31. Giuseppe Lippi, Gian Luca Salvagno, MartinaMontagnana, Giorgio Brocco and Gian Cesare Guidi.Influence of hemolysis on routine clinical chemistrytesting. Clin Chem Lab Med 2006; 44(3):311–316_2006.
32. Kroll MH, Elin RJ. Interference with clinical laboratoryanalyses. Clin Chem 1994; 40:1996–2005.
33. Lippi G, Salvagno GL, Montagnana M, Brocco G,Guidi GC. Influence of hemolysis on routine clinicalchemistry testing. Clin Chem Lab Med 2006; 44:311–6.
34. Plebani M. Errors in laboratory medicine and patientsafety: the road ahead. Clin Chem Lab Med 2007;45:700–7.
35. Steen G, Vermeer HJ, Naus AJ, Goevaerts B, AgricolaPT, Schoenmakers CH. Multicenter evaluation of theinterference of hemoglobin, bilirubin and lipids onSynchron LX-20 assays. Clin Chem Lab Med 2006;44:413–9.
36. Lyon ME, Ball CL, Krause RD, Slotsve GA, LyonAW. Effect of hemolysis on cardiac troponin Tdetermination by the Elecsys 2010 immunoanalyzer.Clin Biochem 2004; 37:698–701.
37. Kroll MH, Elin RJ. Interferences with clinicallaboratory analyses. Clin Chem 1994; 40:1996–2005.
38. Plebani M. The detection and prevention of errors inlaboratory medicine. Ann Clin Biochem 2010; 47:101.
38. Lippi G, Simundic AM, Mattiuzzi C. Overview onpatient safety in healthcare and laboratory diagnostics.Biochem Med 2010;20;13143.
9. Burns ER, Yoshikawa N. Hemolysis in serum samplesdrawn by emergency department personnel versuslaboratory phlebotomists. Lab Med.2002; 33: 378 –380.
10. Garza D and Becan-McBride K. PhlebotomyHandbook, 5th Ed. Stamford, CT: Appleton & Lange;1999.
11. NCCLS Document H3-A4. Procedures for thecollection of diagnostic blood specimens byvenipuncture; approved standard – 4th ed. Wayne, PA:National Committee for Clinical Laboratory Standards;1998.
12. Burns ER, Yoshikawa N. Hemolysis in serum samplesdrawn by emergency department personnel versuslaboratory phlebotomists. Lab Med.2002; 33: 378-380.
13. Sharp MK, Mohammad SF. Scaling of hemolysis inneedles and catheters. Ann Biochem Engineer. 1998;26: 788-797.
14. Savory J. Bill JG. Hemolysis of specimens drawn inthe ER [Q&A]. Lab Med. 1996; 27: 802.
15. Lemery L. Oh, No! It’s Hemolyzed! What, Why, Who,How? Advance for Medical Laboratory Professionals,Feb. 15, 1998: 24-25.
16. Kennedy C, Angemuller S, King R, et al. A comparisonof hemolysis rates using intravenous catheters versusvenipuncture tubes for obtaining blood samples. J EmerNurs 1996; 22: 566-9.
17. Lena Arzoumanian, volume 2, no. – 2 Techtalk, October2003.
18. Lemery L. Oh, No! It’s Hemolyzed! What, Why, Who,How? Advance for Medical Laboratory Professionals,Feb. 15, 1998: 24-25.
19. Laessig RH, Hassemer DJ, Paskey TA., Schwartz TH,The effects of 0.1 % and 1.0 % erythrocytes andhemolysis on serum chemistry values. Am J Clin.Pathol. 1976; 66: 639-44.
20. Kroll MH, Elin RJ. Interference with clinical laboratoryanalyses (review). Clin. Chem. 1994; 40: 1996-2005.
21. Boyanton BL. Jr. Blick KE., Stability studies of twenty-four analytes in human plasma and serum. Clin. Chem.2002; 48: 2242-7.
22. Sodi R, Darn SM, Stott A. Pneumatic tube systeminduced haemolysis: assessing sample type susceptibilityto haemolysis. Ann Clin Biochem 2004;41:237–40.
23. Carraro P, Servidio G, Plebani M. Hemolyzedspecimens: a reason for rejection or a clinical challenge?Clin Chem 2000;46:306–7.
24. Thomas L. Haemolysis as influence and interferencefactor. eJIFCC vol 13(4).
42

39. Lippi G. Governance of preanalytical variability:travelling the right path to the bright side of the moon?Clin Chim Acta 2009;404:326.
39. Simundic AM, Topic E. Quality indicators. BiochemMed 2008;18:3119.
40. Simundic AM, Nikolac N, Ivankovic V, FerenecRuzicD, Magdic B, Kvaternik M, Topic E. Comparison ofvisual vs. automated detection of lipemic, icteric andhemolyzed specimens: can we rely on a human eye?Clin Chem Lab Med 2009; 47:13615.
41. BilicZulle L, Simundic AM, Supak Smolcic V, NikolacN, Honovic L. Self reported routines and proceduresfor the extraanalytical phase of laboratory practice inCroatia – crosssectional survey study. Biochem Med2010;20:6474.
42. Grafmeyer D, Bondon M, Manchon M, Levillain P.The influence of bilirubin, haemolysis and turbidityon 20 analytical tests performed on automatic analysers.Results of an interlaboratory study. Eur J Clin ChemClin Biochem 1995;33:31–52.
43. Carraro P. Potassium report of hemolyzed serumsamples. Clin Chem Lab Med 2008; 46:425; authorreply 426.
44. Dimeski G, Clague AE, Hickman PE. Correction andreporting of potassium results in haemolysed samples.Ann Clin Biochem 2005;42:119–23.
45. Lippi G, Blanckaert N, Bonini P, Green S, Kitchen S,Palicka V, et al. Haemolysis: an overview of the leadingcause of unsuitable specimens in clinical laboratories.Clin Chem Lab Med 2008;46:76472.
45. Lippi G. Reply to the letter by Carraro: appropriateactions in the detection of haemolytic specimens. ClinChem Lab Med 2008;46:426.
46. Kroll MH, Elin RJ. Interference with clinical laboratoryanalyses. Clin Chem 1994; 40:1996–2005.
47. Fang L, Fang SH, Chung YH, Chien ST. Collectingfactors related to the haemolysis of blood specimens.J Clin Nurs 2007; Nov 30 wEpub ahead of printx.
48. Grant MS. The effect of blood drawing techniquesand equipment on the hemolysis of ED laboratoryblood samples. J Emerg Nurs 2003; 29:116–21.
49. Lippi G, Salvagno GL, Montagnana M, Franchini M,Guidi GC. Phlebotomy issues and quality improvementin results of laboratory testing. Clin Lab 2006;52:217–30.
50. Shweta Agarwal, German Vargas, Cristina Nordstrom,Estella Tam, Gregory J. Buffone, Sridevi Devaraj.Effect of interference from hemolysis, icterus andlipemia on routine pediatric clinical chemistry assays.Clinica Chimica Acta 438 (2015) 241–245.
51. Shweta Agarwal, German Vargas, Cristina Nordstrom,Estella Tam, Gregory J. Buffone, Sridevi Devaraj.Effect of interference from hemolysis, icterus andlipemia on routine pediatric clinical chemistry assays.Clinica Chimica Acta 438 (2015) 241–245
52. Lippi G, Luca Salvagno G, Blanckaert N, GiavarinaD, Green S, Kitchen S, et al. Multicenter evaluationof the hemolysis index in automated clinical chemistrysystems. Clin Chem Lab Med 2009; 47:934–9.
53. Vermeer HJ, Thomassen E, de Jonge N. Automatedprocessing of serum indices used for interferencedetection by the laboratory information system. ClinChem2005; 51: 244–7.
54. Lippi G, Banfi G, Buttarello M, Ceriotti F, Daves M,Dolci A, et al. Recommendations for detection andmanagement of unsuitable samples in clinicallaboratories. Clin Chem Lab Med 2007; 45:72836.
55. AnaMaria Simundic, Elizabeta Topic, Nora Nikolac,Giuseppe Lippi. Hemolysis detection and managementof hemolysed specimens. Biochemia Medica 2010;20(2):1549.
56. Sen Gupta P, Sharma M, Timms PM. Laboratorysamples deemed ‘unsuitable for analysis’ can bediagnostically useful. Clin Med 2013;13:309–11.
43

Type 1 diabetes is being considered as a disorderin children and adolescents due to an autoimmuneassociated selective destruction of insulinproducing pancreatic β cells.[1, 2]
Usually the type 1 diabetes presented with aclassic trio of symptoms like Polydipsia, Polyuriaand Polyphagia but unfortunately 10-15% of thecases are presented with Diabetic Ketoacidosis,the serious and severe complication of diabetesas the patients were not cared or unaware initiallyabout the onset of this disease.
In the present context the key issues related totype 1 diabetes are
a) Epidemiology
b) Pathogenesis
c) Management:-
Particularly two important factors
i) Effectiveness of current therapy
ii) Uneven quali ty of diabetesmanagement across the globe
d) Prevention
e) Cure
Epidemiology
Globally, incidence of the diagnosis of type 1diabetes per year is 1 in 1, 00,000, with a lot ofdifferences from country to country.[3,4] Maximumnumber is found in Finland (>60 per 1,00,000per year), followed by Sardinia (40), Estonia(20) and 0.1 in China, India and Venezuela).[5,6]
CMEType 1 Diabetes
Dr. D. Maji1, Dr. R. U. Roy2
So in India, it is not a common disease. Thereare country wise differences even in increase inthe incidence of type 1 diabetes in some countrieslike 3.3% increase in Norway, 2.6% in Germany,2-4% in Finland while neither increase nordecrease is found in Sweden.[7,9] The mechanismof this country wise difference or increase inincidence of type 1 diabetes is still unclearalthough some workers have proposed the roleof either genetic or environmental factors behindit, those postulations are not been establishedbeyond doubt.
It is interesting to note that 10-15% of type 2diabetes showed positive autoantibody andrequire insulin therapy in early age of their lifefor control of their glycemic status. Thosepatients may be considered as slowly progressingtype 1 diabetes, although the term has not beenconfirmed yet. In this regard, it may also be saidthat if these 10-15% patients would be confirmedas type 1 diabetes and not type 2, the totalnumber of type 1 diabetes might have beenincreased.
Some people subdivided type 1 diabetes into1A and 1B where 1A is β cell destruction dueto auto immune disorder. (70-90% of the patientsfall in this category)[10] and 1B (rest 10-20%) istermed as Idiopathic where the pathogenesis isunclear.[11] A subset of this type is termed asMODY (Maturity Onset Diabetes of theYoung).[12] This type of sub grouping as 1A and1B is not being used commonly.
1MD DM Prof., Dept. of Medicine, RKMSP, VIMS2PH.D. Asso. Prof., Dept. of Genetics, RKMSP, VIMS
44

Pathogenesis:
Considering the basic concept in thepathophysiology of type 1 diabetes, it is an autoimmune destruction of insulin secreting pancreaticβ cells which are not capable of regeneration.But this concept is still debated as type 1 diabetesis not a pure auto immune disease and the processof β cell regeneration has become evidenced ininfants and very young children.[13,14]
Therefore, it may be explained as a series offunctional defects of the organs and system likeBone Marrow, Thymus, Immune system and βcells which collectively contribute to thedevelopment of this disease.
In type 1 diabetes, the overall mass of the pancreasis decreased with atrophy of exocrine portionalso and dorsal region at the same time. Lobularloss of β cells are observed with pseudo atrophic(Glucagon staining) islets. The β cells showMHC Class I expression and these cells becomesensitive to free radicals.[15] The inflammatorychanges appear which could not be resolved. Asa result they produce more cytokines andchemokines potential for replication being limitedand finally, immune destruction is being quickerinfluenced by metabolic activity. In Bone Marrow,intrinsic defects in lymphocytic precursor cellsare found due to immunological disturbance andtherefore, it remains a safe place for persistentautoreactive lymphocytes.
The Immune system is mostly suffered. TheAntigen Presenting Capacity of the cells is beingenhanced resulting more autoantibody production.Abnormal cytokines are produced causing cellulartrafficking and adhesions defect. Finally there isa failure to resolve autoactive immune memoryand therefore total immune regulations are beingdefective.[6]
Serology of Type 1 Diabetes:
Serum of a type 1 diabetic show presence ofIAA (Insulin AutoAntibody), GADA (GlutamicAcid Decarboxylase Antibody), IA2A(Insulinoma Associated Auto Antigen2) andZnT8A (Zinc Transporter 8 Antibody).[16] Thoseparameters are very important particularly forthe prevention aspect because either one or twoof those parameters may identify a person atincreased risk to develop type 1 diabetes. It wasobserved that IAA correlates with the rate ofprogression of the disease. It is also under doubtthat Pro-Insulin may play the role of keyAutoantigen in type 1 diabetes.
Genetics:
Regarding the role of genetics in the pathogenesisof the disease, it may be mentioned that type 1diabetes is known as a polygenetic disorder with40 loci and the common findings in this regardare as follows: [17]
a) Type 1 diabetes is characterized byautoimmune destruction of insulin producingβ cells by CD4+ and CD8+ T cells andmacrophages.
b) Two HLA genes (Haplotypes): DR4-DQ8and DR3-DQ2are present in 90% of type 1diabetes.
c) The genotype combining the twosusceptibility Haplotypes (DR4-DQ8 andDR3-DQ2) contributes the greater risk ofthe disease and is most common in childrenin whom the disease develops very early inlife.[18]
d) First degree relatives of these children areat greater risk of type 1 diabetes than are therelatives of children in whom the diseasedevelops later.
45

Environmental Factors:
There are some environmental factors also whichare involved in the pathogenesis of type 1 diabeteseither by triggering or modifying the mechanismand those are Viral Infection, Childhood Vaccines,early consumption of cereals, Cow’s Milk Proteinand lack of breast feeding. It has been claimedrecently that Gut Microbiata have a role in type1 diabetes because it already been shown that
Gastro Intestinal Microbes through dietaryexposure serve as direct inducer/regulators ofthe immune system through alteration of the gutmicrobiata.
Finally, considering all the pathways of thepathogenesis of type 1 diabetes, a comment canbe made that Type 1 Diabetes is a collection ofdifferent disease processes united by a commonoutcome i.e. destruction of β cells.
Clinical Presentation:
Presentation of type 1 diabetes occurs maximumat the age group of 5-7 years or at puberty.[19]
surprisingly enough; the autumn and winter arethe peak season for the diagnosis of type 1diabetes.[20]
Most of the patients (about 85%) will havesymptoms of Polyuria, Polydipsia, Polyphagiaand weakness which will make them consult aPhysician and are diagnosed after urine (showingpositive for glucose and sometimes for ketonealso) and high plasma glucose (much higher than
the diagnostic criteria of Fasting Plasma glucoseof 126mg/dl and a post prandial value of200mg/dl. A low serum C-Peptide and positiveIslet Cell Antibody is of diagnostic help. Mostof them are frank in clinical presentation. About15% cases are first diagnosed at Emergency asDiabetic Ketoacidosis (DKA) when they comewith altered sensorium. Dehydration is the mostimportant clinical sign in these cases whichalerts a physician.Management:Management of DKA has been simplified with
Natural History of Type 1 Diabetes
β-Cellmass 100%
Putativetrigger Cellular autoimmunity
Circulating autoantibdies (ICA, GAD65,ICA512A, IAA)
Loss of first-phaseinsulin response (IVGTT)
Abnormal OGTT
Geneticpredisposition
Clinicalonset only10% ofb-cellsremainInsulitis
β-Cell injuryβ-Cellinsufficiency Diabetes
TimeEisenbarth GS. N Engl J Med 1986; 314:1360-8
46

correction of dehydration, correction ofhypokalaemia, Low dose Insulin therapytreatment of precipitating factor (if any) andgeneral care of the patient with monitoring ofvital signs and glucose. Mortality in DKA hasbeen reduced to a great extent.
The ultimate therapeutic goal in the managementof type 1 diabetics is the preservation of theresidual β cells as much as possible because ithas been found that after diagnosis some of thepatients still retain endogenous insulin secretion.However the objective of treatment should bethe metabolic stabilization aiming to prevent thedevelopment of diabetic complications likeHypoglycemia, Retinopathy, Neuropathy,Nephropathy and acute complications likehypoglycemia and Diabetic KetoAcidosis.
Insulin and only Insulin is still being consideredas the first line of therapy for type 1 diabetes,
supported by diet and exercise (life styleintervention), diabetes education and continuousmonitoring. Since its discovery in 1922, theresearchers have introduced a number ofmodified and more developed form of insulinin the pharma industry like, from Bovine toPorcine Insulin, Soluble to Long Acting thenHuman Recombinant Insulin, followed byPremixture of Rapid and Long Acting and finallythe Basal and Bolus Insulin Analogue, but stillthere is no substitute drug so far other thanInsulin.Ideally a type 1 diabetes patient is being managedwith a Multi Drug Injection regimen consistingof a long acting Basal Analogue at night andRapid Acting Insulin before meals, the so calledBASAL-BOLUS therapy. Also some patientsare treated with Insulin Infusion pump withContinuous Glucose Monitoring system but thisis quite expensive.
Plasma Insulin Concentration of a Type 1 Diabetes Patient receiving BASAL-BOLUS therapyduring 24 Hours of the day.
BASAL/BOLUSBASAL/BOLUS
Breakfast Lunch Dinner
Glargine
Plas
ma
insu
lin
4:00 8:00 12:00 16:00 20:00 24:00 4:00 8:00Time
47

Plasma Insulin Concentration of a Type 1 Diabetes Patient receiving NPH and REGULARInsulin therapy during 24 Hours of the day.
The aims of insulin therapy are: to provideadequate metabolic control, prevention ofcomplications of disease and therapy, to promotenormal growth and development and improvingquality of life with a lot of flexibility. Duringmanagement of a type 1 patient, the cliniciansusually face the following challenges of theadverse effects of insulin.
a) Hypoglycemia caused by insulin overdose,insufficient calorie intake due to missedmeals, improper meal contents, delayedmeal intake and alcohol consumption.
b) Hypokalemia : Insulin draws K+ into cellwith glucose
c) Lypodystrophy at injection site
d) Weight gain
e) Injection complications.
Hypoglycemia
For both patients as well as the clinicians,frequent hypoglycemia is the most challengingcomplication in type1cases. Here, theresponsibility of the clinicians and/or diabeticeducators/Nurses is to give a complete trainingto the patients regarding handling ofhypoglycemia and the duty of the patient is tofollow the same in accurate way. The trainingincludes proper awareness about the definition,causes, signs and symptoms and particularlyabout nocturnal hypoglycemia. They should alsoknow how to treat themselves with sugar, snackscandies etc. and how to prevent it using properinjection and dietary plan in correct time. Alsothe closed friends, family members and schoolmanagement should be notified about theprobable occurrence of hypoglycemic attack atany time of the day.
NPH AND REGULARNPH AND REGULAR
Breakfast Lunch Dinner
Plas
ma
insu
lin (u
U/m
l)
R
N
R
N
75
50
25
4:00 8:00 12:00 16:00 20:00 24:00 4:00 8:00
Time
48

People often confuse that during sick days, theinsulin injection either could be restricted orcancelled because diet consumption and physicalexercise in those days become limited or stopped.This is absolutely a wrong idea. Insulin shouldnot be omitted in such case, and proper fluidand/or solid food planning is absolutely necessaryin consultation with the attending dietitian andthe clinician also should be approached for theadvice of correct insulin regimen.
Besides insulin therapy, life style interventionincluding proper diet and regular physical exerciseplays a key role in the glycemic control of a type1 patient.
Diet:
The diet of a diabetic should be planned inconsultation with an experienced dietitian. Thetotal daily calorie requirement of a person variesaccording to age, sex, BMI and physical activity.An ideal diet plan should be regular with calorieexchange options, 50-60% of the required energyshould be obtained from complex carbohydratesevenly distributed throughout the day preferablyin 2 meals and 3 snacks. Low salt, low saturatedfat and high fiber diet plan is always encouraged.
Exercise:
Exercise is one of the most important measuresto control the hyperglycemia because it decreasesthe insulin requirement in diabetic subjects byincreasing both sensitivity of muscle cells toinsulin and glucose utilization. On the other hand,over exercise may cause hypoglycemia inunprepared diabetics and also may worsen preexisting Proliferative Diabetic Retinopathy(PDR).
Once the control has been achieved, it isnecessary to maintain such status and this canbe maintained only by constant monitoring whichcan be done easily by good compliance (regularchecking records), regular blood glucose check,and HbA1c check at 3 months interval, yearlyeye, lipid profile renal function and cardiaccheck up.Despite all efforts in improvement of themanagement, the type 1 diabetics die in manyparts of the world because of inaccessibility toinsulin due to poverty. In Mozambique, the lifeexpectancy of type 1 diabetic is nearly sevenmonths after diagnosis.[21] in our country alsothe picture is not different, as the patients cannotpurchase insulin regularly.The most important part of treatment of type1 Diabetes is education of the patients andthe family members.Prevention:Identification and screening of individuals withincreased genetic risk to develop type 1 diabetes,vaccination with insulin/GAD antibodies andimmune suppression technique with Anti CD3antibody may be considered as primary andsecondary preventive measure for type 1 diabetesbut the methods are under experiment.[22-24]
Cure:Islet cell transplantation is being considered asa curative process but it still remains anexperimental procedure.[25] Also the stem celltherapy are now being considered but has severalcomplications like maintaining the cell lineculture, immune rejection, teratoma formationetc.[26-28] Also the ethical issue in this point is aquestion.
49

References:
1. Todd JA. Etiology of type 1 diabetes. Immunity 2010;32: 457-62.
2. Bluestone JA, Herold K, Eisenberth G. Genetics,pathogenesis and clinical interventions in type 1diabetes. Nature 2010; 464: 1293-1300.
3. Maahs DM, West NA, Lawrence JM, Mayer-Devis EJ.Epidemiology of type 1 diabetes. Endocrinol MetabClin North Am 2010; 39: 481-97.
4. Whiting DR, Guariguta I, Well C, Shaw J. IDF DiabetesAtlas: Global estimates of the prevalence of diabetesfor 2011 and 2030. Diabetes Res Clin Pract 2011; 94:311-21.
5. Patterson CC, Dahlquist GG, Gyurus E, Green A, SolteszG; EURODIAB Study Group. Incidence trends forchildhood type 1 diabetes in Europe during 1989-2003and predicted new cases 20052020: a multicentreprospective registration study. Lancet 2009; 373:2027-33.
6. Mark A Atkinson, George S Eisenbath, Aaron WMichels. Type 1 diabetes. Lancet 2014; 383: 69-82.
7. Podar T, Solntsev A, Karvonen M, et al. Increasingincidence of childhood – onset type 1 diabetes in threeBaltic countries and Finland 1983-98. Diabetologia2001; 44 (suppl 3): 17-20.
8. Ehahalt S, Dietz K, Willasch AM, Neu A.Epidemiological perspectiveson type 1 diabetes inchildhood and adolescence in Germany: 20 years ofthe Baden-Wurttemberg Diabetes Incidence Registree(DIARY). Diabetes care 2010; 33:338-40.
9. Berhan Y, Waernbaum I, Lind T, Mollsten A, DahlquistG. Thirty years of prospective nationwide incidence ofchildhood type 1 diabetes: the accelerating increase bytime tends to level off in Sweden. Diabetes 2011; 60:577-81.
10. Eisenberth GS. Update in type 1 diabetes. J ClinEndocrinol Metab 2007; 92: 2403-07.
11. Gianani R, Campbell-Thompson M, Sarkar SA, et al.Dimorphic Histopathology of long standing childhoodonset diabetes. Diabetologia 2010; 53: 690-98.
12. Hattersley A, Bruining J, Shield J, Njolstad P, DonaghueKC. The diagnosis and management of monogenicdiabetes in childrenand adolescents. Pediatr Diabetes2009; 10 (suppl 12): 33-42.
13. Gregg BE, Moore PC, Demozay D et al. Formationof a human â cell population within pancreatic isletsis set early in life. J Clin Endocrinol Metab 2012; 97:3197-206.
14. Keenan HA, Sun JK, Levine J et al. Residual Insulinproduction and pancreatic β cell turnover after 50 yearsof diabetes: Joslin Medalist Study. Diabetes 2010; 59:2846-53.
15. Noble JA, Valdes AM, Varney MD, et al. HLA classI and genetic susceptibility to type 1 diabetes: resultsfrom the type 1 Diabetes Genetics Consortium. Diabetes2010; 59: 2972-79.
16. Ziegler AG, Nepom GT. Prediction and pathogenesisin type 1 diabetes. Immunity 2010; 32: 468-78.
17. Concannon P, Rich SS, Nepom GT. Genetics of typeIA Diabetes. N. Engl J Med 2009; 360: 1646-54.
18. Erlich H, Valdes AM, Noble J et al. HLA DR-DQHaplotypes and genotypes and type 1 diabetes risk:analysis of the type 1 diabetes genetics consortiumfamilies. Diabetes 2008; 57: 1084-92.
19. Harjutsalo V, Sjoberg I, Tuomilehto J. Time trends inthe incidence of type 1 diabetes in the Finish children:a cohort study. Lancet 2008; 371: 1777-82.
20. Moltchanova EV, Schreir N, Lammi N, Karvonen M.Seasonal variation of diagnosis of type 1 diabetesmellitus in children worldwide. Diabet Med 2009; 26:673-78.
21. Beran D, Yudkin JS, de Courten M. Access to care forpatients with insulin requiring diabetes in developingcountries: case studies of Mozambique and Zambia.Diabetes Care 2005; 28: 2136-40.
22. Bach JF. Anti CD3 Antibodies for type 1 diabetesbeyond expectations. Lancet 2011; 378: 459-60.
23. Ludvigasson J, Krisky D, Casas R et al. GAD 65antigen therapy in recently diagnosed type 1 diabetesmellitus. N Engl J Med 2012; 366: 433-42.
50

24. Wherrett DK, Bundy B, Becker DJ, et al. Antigen basedtherapy with Glutamic Acid Decarboxylase (GAD)vaccine in patients with recent onset type 1 diabetes:a randomized double blind trial. Lancet 2011; 378: 319-27.
25. Ryan EA, Paty BW, Senior PA, et al. Five year followup after clinical is let transplantation. Diabetes 2005;54: 2060-69.
26. Voltarelli JC, Couri CE, Stracieri AB, et al. Autologousnonmyeloablative hematopoietic stem cell
transplantation in newly diagnosed type 1 diabetesmellitus. JAMA 2007; 297: 1568-76.
27. Couri CE, Oliveira MC, Stracieri AB, et al. C-peptidelevels and insulin independence following autologousnonmyeloablative hematopoietic stem celltransplantation in newly diagnosed type 1 diabetesmellitus. JAMA 2009; 301: 1573-79.
28. Herold KC, Bluestone JA. Type 1 diabetesimmunotherapy: is the glass half empty or half full?Sci Transi Med 2011; 3: 95fs1.
51

52
Case Report
Think Beyond SepsisDr. N. Mukherjee1, Dr. S. Guha2, Dr. S. Basu3, Dr. D. K. Mukherjee4
1,2,3,4Dept. of Pead., RKMSP, VIMS
Background:
Severe Combined Immunodeficiency (SCID) isa rare form of primary immunodeficiencycharacterized by absence of T cell functioningand affected child usually present with severelife threatening infection.
Case Characteristics:
We herein report a case of SCID who presentedwith recurrent fever and failure to thrive.
Observation:
There was Persistent lymphopenia whichprompted us to think about immunodeficiencysyndrome.
Intervention:
The child was diagnosed as a case of SCID(T-/B+/NK+). After confirmation of diagnosis,Bone marrow transplantation was planned butpatients parents refused treatment andunfortunately the child expired at the age of oneyear.
Introduction:
Severe Combined Immunodeficiency israre form of Primary Immunodeficiency thatleads to severe life threatening infection andusually has a fatal outcome. SCID is rare withincidence of about 1 in 5,00,000[1]. We hereinreport a 6 month old female infant withT-/B+/NK+ SCID.
Case Report:
A 6 month old female infant was admitted in our
hospital last year (October 2014) with historyof moderate grade fever and cough for 20 days.She had repeated episodes of fever for last 3months with documented weight loss. She wasthe second issue of non consanguineous marriage(the elder brother aged 5yrs was apparently well)immunized till date and had normal development.On examination she was having grade IIImalnutrition and anemia. On systemicexamination there was bilateral scatteredcrepitation in chest and hepatosplenomegaly.Initial fever work up showed anemia (Hb 8.7gm/dl), Total leukocyte Count 6,600: N80, L10,M4, E6, B0), raised acute phase reactant, CRP(C reactive protein) 12, ESR (erythrocytesedimentation rate) 50. Chest X Ray showedbilateral non specific patchy opacities.Ultrasonography of abdomen showedenlargement of liver and spleen. Echo-cardiographic screening was normal. Blood andUrine culture were sterile. Infective serologywork up including hepatitis profile and HIVstatus were negative. Other investigations (LiverFunction Test / Serum electrolyte / CerebroSpinal Fluid study) were within normal limit.In view of possible chest infection, she wasinitially treated with i.v antibiotics (Ceftriaxone)along with other supportive management. Buteven after treatment for 48 hours, she showedno sign of clinical response and fever spikeswere still persisting. CXR did not show muchresolution. A repeat blood picture showed similartrend. (Hb 8.6 gm/dl, Total Leukocyte Count

53
15,500: N84, L8, M6, E2, B0). Antibiotics werehiked up to meropenem and vancomycin and arepeat blood culture was sent. Gastric lavage didnot show any acid fast bacilli and, Mantoux testwas negative (there was no family history oftuberculosis). But this time blood culture showedgrowth of Candida lipolytica and intravenousfluconazole was added (according to thesensitivity pattern). Unfortunately fever spikescontinued. At this point, a decision was taken tostart Anti Tubercular Drug (ATD). But even after3 weeks of ATD the infant continued to be febrile.A bone marrow study was contemplated, butparents were not willing for an invasiveprocedure.
A regular blood count monitoring showedpersistent lymhopenia.
TLC* (25/10/14): 15,500 (N84,L8,M6,E2,B0)
TLC* (27/10/14): 12,100 (N88,L8,M1,E3,B0)
TLC*(03/11/14): 13,900 (N79,L15,M5,E1,B0)
TLC *(05/11/14): 14,400 (N93,L4,M2,E1,B0)
*TLC= Total Leukocyte Count.
So we had a 6 month infant with recurrent fever,poor weight gain, unusual growth in blood culture,poor response to standard antibiotics/antifungal and persistent lymphopenia. As HIV status wasnegative the next possibility was a primaryimmune deficiency. We did immunoglobulinprofile, which showed:
IgG : 33 (300-900 mg%)
IgA : 07 (15-70)
IgM : <11 (40-160)
Flow cytometry showed-
CD4+ : 3.05 (41.4)
CD8+ : 21.61 (29.75)
These shows a diminished B cell (lowimmunoglobulin) and Tcell (very low CD4count) function.
All these findings favor the possible diagnosisof Primary Immuno Deficiency. And as both T& B cell function are affected so early in lifethe commonest possibility was SCID. We gavethe child a dose of immunoglobulin, to whichthe child responded for the time being.She wasalso put on pneumocystis carni prophylaxis.
Immunophenotyping, geneproduct study wereconducted:
CD 3+ (T cell Marker) : 0.2 (50-77%)
CD 19+ (B cell Marker) : 18.9 (13-55%)
CD 56/16 (NK cell Marker) : 55.2 (2-13%)
IL-7R Alpha (A Gene product) : ABSENT
All these signifies mutation of 5p13 gene, whichprovides the genetic basis of the diseaseT-/B+/NK+ SCID and finally she was diagnosedas a case of SEVERE COMBINEDIMMUNODEFICIENCY.
In spite of repeated counseling regarding thedisease process and need for bone marrowtransplantation, parents were not willing for thesame. Unfortunately child was very sick totravel, but the father kept us informed of hercondition. She continued to be on PCP antifungalprophylaxis, ATD was stopped after 6 months.Unfortunetly she died of pneumonia at the ageof one year.
Discussion:
SCID was reported in 1950 by Swiss pediatricianGlanzmann and Riniker[2]. It has been rarelyreported in India.
SCID is the most severe form of PID. It ischaracterized by abnormal T cell and B cell

54
function. It usually present within first few monthsof life and the affected child frequentlysuccumbed to severe life threatening infectionby 2 years of life if not treated properly by Bonemarrow transplantation or enzyme replacement.
Several types of SCID have been identified andclinically classified as T-/B+ or T-/B- SCIDdepending on the affection of B cell, T cell andits subtypes[3]. X linked SCID is most commonform accounting for 50-60% of cases.
A diagnosis of SCID is a medical emergency. Ahigh degree of suspicion is essential to suspectSCID. The pointers are recurrent infection(patients are susceptible to a host of viral, fungal,infection including Pneumocystis carini, failureto thrive, thymic hypoplasia with small poorly
developed lymphnodes and tonsil, lymphopenia(<1500/cu .m.m), low CD3+ T ce l l(<500/cu.m.m) and hypogammaglobulinemia.[4]
The immediate concern is to bring anyintercurrent infection under control and to ensureadequate nutrition. IVIG may be used to boostthe immune response.[5] The only curativetherapy is bone marrow transplantation.
Conclussion:
The aim of reporting this case is to highlightthat a simple blood count can be an eye openerof a severe life threatening disease. In factbefore ordering a battery of sophisticatedinvestigation it is always desirable to interpreta CBC (complete blood count) and co relate itclinically.
References:
1. Stephan JL,Vlekova V, Le Deist F et al. Severecombined immunodeficiency: a retrospective single-centre study of presentation and outcome in 117 cases.J Pediatr 1993; 123: 564-72.
2. G l a n z m a n n E . R i n i k e r P. E s s e n t i e l l elymphocytophthise: Ein neues Krankheitsbild aus derSauglingspathologie. Ann Paediatr 1950; 175: 1-32.
3. Rosen FS. Severe combined immunodeficiency: Apediatric emergency. J Pediatr 1997; 130: 324-25.
4. Buckley RH, Schiff RI, Schiff SE, Market L, WilliamsLW, Harville TO et al. Human severe combinedimmunodeficiency. J Pediatr 1997; 130: 378-387.
5. Fasano MB. Risks and benefits of intravenousimmunoglobulin treatment in children. Curr OpinPediatr 1995; 7: 688-694.
+ Acknowledgement : Genetic analysis andimmunophenotyping studies were done by PGIMERChandigarh, Department of paediatric Rheumatologyand immunology.

55
Case Report
started at the age of 20 on the back and thenprogressed to involve the face and arms. Therewere history of mild itching, occasional pustulesand abscess formation. There was no history ofsimilar complaints in the family. On examinationthere were multiple dilated follicular openingsmajority of them filled with keratin plugs,diffusely involving the face, chest, back, andarms. On the back, multiple scars were seenalong with comedones [Figure-1], [Figure-2],[Figure-3]. Palms, soles and mucous membraneswere spared. No skeletal, ocular or centralnervous system abnormalities were found. Aclinical diagnosis of nevus comedonicus wasmade. Complete blood count, urine analysis,routine blood biochemistry, and chest X-raywere unremarkable. Skin biopsy from the backshowed deep, wide invagination of acanthoticepidermis, filled with concentric lamella ofkeratin. Hair shaft was seen in the lower portionof the invagination with rudimentary sebaceousgland opening into it, confirming the diagnosisof nevus comedonicus [Figure-4]. [ 7 ]
Interfollicular epidermis was normal. We treatedthe patient with topical retinoic acid (0.025%)and oral isotretinoin 20 mg for 2 months. Pustularlesions subsided, but not much improvementwas noted in other lesions.
Discussion:
NC was first described in 1895 by Kofmann [8]
Abstract:
Nevus comedonicus (NC) is an uncommonhamartoma of the pilosebaceous unit resultingin numerous dilated, keratin-filled comedones.Most cases of nevus comedonicus occurunilaterally on the face, neck and chest, extensiveand bilateral lesions are very rare.[1] We reporthere an unusual case of bilaterally symmetricalnon-linear nevus comedonicus on face and body.
Key Words:
Nevus comedonicus, non linear, extensive.
Introduction:
Nevus comedonicus is an uncommon skinabnormality characterized by an aggregation ofdilated follicular orifices filled with keratinousmaterial. Nevus comedonicus is occasionallycomplicated with other conditions includingcataracts, skeletal defects, central nervous systemabnormalities or other extra-cutaneous diseases(nevus comedonicus syndrome (NCS)). Theprevalence of NC has been estimated from 1 in45,000 to 1 in 100,000, with no gender or racialpreference [2 ,3]. Single cases of delayeddevelopment of NC and NCS at later age havebeen reported [4-6].
Case report:
A 41-year-old businessman presented withextensive comedones for 21 years. The lesions
Bilateral & Extensive Nevus ComedonicusDr. Heena Parmar1, Dr. Jayanta Kr. Das2, Dr. Asok Gangopadhyay3
1MBBS, DVD (Corresponding Author), Affiliation: Medical Officer, Dept. of Dermatology, RKMSP, VIMS2MD (Dermatology & Venereology), Affiliation: Prof., Dept. of Dermatology, RKMSP, VIMS3MD (Dermatology & Venereology), Affiliation: Prof. & Head, Dept. of Dermatology, RKMSP, VIMS

who suggested the term ‘comedo nevus’. Thelesion usually manifests at birth or by the age of15 years or rarely as late as middle age with noparticular sex predilection.[9] NC is thought torepresent growth dysregulation affecting themesodermal portion of the pilosebaceous unit.The epithelial-lined invaginations, incapable offorming mature terminal hairs and sebaceousglands, accumulate a soft cornified ostial productresulting in a comedo-like plug. In 1998, FGFR2mutations were detected in a nevus comedonicusand not in the adjacent normal skin, providing
evidence for genetic mosaicism[10]. Thedifferential diagnoses in our case werecomedonal acne, familial diffuse comedones,and familial dyskeratotic comedones. Incomedonal acne, the pilosebaceous units arecomplete whereas those in NC are poorly formed.In the familial diffuse comedones the comedo-like lesions appear progressively and in a diffusebilateral distribution with an autosomal dominantinheritance. In familial dyskeratotic comedones,the comedones are less extensive anddemonstrate dyskeratosis histologically.
Figure 1 : Multiple dilated follicular openingfilled with comedones in face.
Figure 2 : Multiple comedones and scar in theback.
56

References:
1. Fritsch P, Wittels W. A case of bilateral naevuscomedonicus. A contribution on histogenesis.Hautarzt 1971;22:409-12
2. Nabai H, Mehregan AH. Nevus comedonicus. ActaDerm Venereol. 1973;53:71–74.
3. Happle R. The group of epidermal nevus syndromesPart I. Well defined phenotypes. J Am Acad Dermatol.2010;63:1–22. doi: 10.1016/j.jaad.2010.01.017.
4. Engber PB. The nevus comedonicus syndrome: a casereport with emphasis on associated internalmanifestations. Int J Dermatol. 1978;17:745–749.
5. Patrizi A, Neri I, Fiorentini C, Marzaduri S. Nevuscomedonicus syndrome: a new pediatric case. PediatrDermatol. 1998;15:304–306. doi: 10.1046/j.1525-1470.1998.1998015304.x.
6. Pavithra S, Pai H, Mallya H, Pai GS. Nevuscomedonicus syndrome. Indian J Dermatol.2011;56:771–772. doi: 10.4103/0019-5154.91853.
7. Tchernev G, Ananiev J, Semkova K, DourmishevLA, Schönlebe J, Wollina U. Nevus Comedonicus:An Updated Review. Dermatol Ther (Heidelb) 2013;3: 33–40.
8. Kofmann S, Von EF, Seltener. Localization andverbreitung of comedones. Arch Dermatol Syphilis1895;32:177-8.
9. Kuruvila M, Kumaresan M. Extensive nevuscomedonicus. Indian J Dermatol 2007;52:210-2.
10. Munro CS, Wilkie AO: Epidermal mosaicismproducing localised acne: somatic mutation in FGFR2.Lancet 1998; 352:704-705.
Figure 3 : Comedones in shoulder and neck. Figure 4 : Deep invagination of acanthoticepidermis, filled with keratin, hair shaft in thelower portion of the invagination with sebaceousgland opening into it. (H&E 40X).
57

Abstract:
Introduction:
An osteochondroma or exostosis is a benign bonetumour consisting of a bony outgrowth coveredby a cartilage cap that affects mostly the longbones mainly the distal femur, proximal tibiaand proximal humerus. Involvement of iliac crestby solitary osteochondromas is a relativelyuncommon condition.
Case Presentation:
The present report represents a case ofsymptomatic giant osteochondroma of right iliaccrest causing gait abnormality and mechanicaldiscomfort in certain postures.
Intervention:
After clinical examinations, radiologicalinvestigations and FNAC done, the patient wasadmitted in hospital and complete surgicalexcision of the tumour was done.
Outcome:
The patient's symptoms gradually resolved aftergross total tumour removal.
Conclusions:
Benign solitary large osteochondroma can besymptomatic and surgery results in completerelief of symptoms as demonstrated in this case.
Keywords:
Osteochondroma, iliac crest, benign bone tumour.
Giantsolitary Osteochondroma of Iliac Crest - A Case ReportDr. G. Basu1, Dr. P. Pal2, Dr. S. Biswas3, Dr. J. Ali4, Dr. G. Chatterjee5
1Prof.; 2Asst. Prof.; 3, 4, 5 PGTDept. of Orthopedic Surgery, VIMS, RKMSP, Kolkata
Introduction:Osteochondroma is the most common benignbone tumor.[1] These tumours are outgrowths ofgrowth plate and are made up of both bone andcartilage. They generally occur in long bonesof the appendicular skeleton and are mostcommonly seen around the knee. [ 2 ,3 ]
Osteochondromas grow during childhoodthrough adolescence, but usually growing endswhen the epiphyseal plates close.[2,4] They aretypically described in patients younger than 20year-old and extensive osteochondroma growthinto adulthood is rarely reported.[4,5] In an adult,growth of an osteochondroma suggests thediagnosis of malignant transformation to achondrosarcoma.[4,6] Most osteochondromas areasymptomatic, but they can cause mechanicalsymptoms depending on their location and size.The treatment of choice for symptomaticosteochondroma is surgical removal of solitarylesion or partial excision of the outgrowth.[7] Inthis study we describe the clinical andradiological findings and surgical treatment ofa giant solitary osteochondroma arising fromiliac crest which is relatively a rare site ofinvolvement.[8,9]
Case Presentation:History:A 41 year old housewife presented in orthopaedicOPD with complaints of pain in her right iliaccrest region with gait abnormalty and mechanicaldiscomfort while squatting, turning posture in
Case Report
58

bed. There was a bony mass of approximately12 cm x 10 cm size at right iliac crest whichgradually developed over last 20 years. She hadno other comorbidities.Workups:
Plain radiographs of pelvis revealed a huge mass(11cm x7 cm) arising from right iliac crest andFNAC suggested low grade chondroidneoplasia.Chest x-ray showed no signs of metastasis.Complete hemogram, ESR, PT/INR, FBS/PPBS,Na+, and K+, urea, creatinine, viral profile andECG were done after admitting the patient forsurgical excision of the mass. Symptoms andfurther investigations confirmed the tumour tobe a benign one.
Figure 1: Pre-operativex-ray AP view of pelvisshowing the tumour arising from iliac crest.
Figure 2 : Pre-operative x-ray lateral view ofthe right pelvis.
Intra-operative procedure:
After spinal anaesthesia and proper dressingdraping in supine position an oblique 15 cmincision was given over the right iliac crestandexposure done up to acartilaginous cappedcauliflower like giant mass arisi0ng from theouter table of the iliac crest. Due to the hugesize of the mass it was removed in piece meals.The outer table of the iliac crest was clearedafter complete removal of the mass. Inner tableof the crest was intact. Tissue was sent for biopsy.Wound was closed in layers after properhaemostasis.
Figure 3 : Patient in supine position on OT tablewith the huge iliac mass.
Figure 4 : 15 cm long curved incision over themass over right iliac crest.
59

Figure 5: Exposure of the cauliflower likecartilage capped mass.
Figure 6 : Complete removal of the tumour inpieces.
Post-operative workups:
Patient was shifted to general orthopaedic wardafter surgery. On post op day 1 she was allowedto walk and her gait was better than before. After48 hr. of the operation dressing was done andthe wound was healthy and dry. Patient wasdischarged on the 4th post op day and advisedto continue full weight bearing.
Follow up:
Patient was reviewed after 7 days in OPD and
stitches were removed. HPE report confirmedit to be an osteochondroma. Check x-ray showedclear right iliac crest and the patients gait waspain free.
Figure 7 : Post-operative x-ray of pelvis.
Discussion:
Osteochondromas are rather developmentallesions than true neoplasms and they may occursolitary or as multiple lesions, associated withthe syndrome multiple hereditary exostoses.[2]
Recent research has revealed that multipleosteochondromas is an autosomal dominantinherited disease and germ line mutations inEXT1 and EXT2 genes located on chromosomes8 and 11 have been associated with the causeof this disease.[10] Osteochondroma is seen inthe 2% to 3% of the general population andrepresents approximately 36% to 41% of thebenign bone tumours.[11,12] The long bones ofthe lower extremities are most common sites[9,2,13]
the knee (40%)[8,13,14] followed by the humerus(10%-20%)[8,9,13] are more frequently involved.Other more unusual locations include the smallbones of the hands and feet (10%), scapula (4%),pelvis (5%), and cranial base and jaw[8, 9, 13-15];the spine is affected in 1.3% to 4.1% of cases.
60

Osteochondromas are usually asymptomatic, andare seen incidentally on radiography.[4] The mostcommon symptom is a nontender, painlesscosmetic deformity secondary to the slowlyenlarging exophytic mass. Additionalcomplications that cause symptoms includeosseous deformity, fracture, vascular-nervecompression, neurologic sequelae, bursaformation, and malignant transformation.[4,11]
Malignant transformation is seen in less than 1%to 2% of patients of solitary osteochondroma[3,16]
and in 5%-25% of patients with multiplehereditary exostoses.[3,4,17] Clinical featuressuspicious for malignant transformation comprisenew onset of pain in a previously stable lesion,rapid or new growth, growth after skeletalmaturity, and/or large lesions.[3,18] These lesionsare usually a low-grade chondrosarcoma or lessoften a secondary osteosarcoma.[19,20]
Although radiography is often diagnostic alone,other imaging modalities may be necessary forsurgical planning and to exclude sarcomatousdegeneration. The lesion is composed of nativecortical and medullary bone protruding from andcontinuous with the underlying bone and theyappear as sessile or pedunculated.[2,3]
Ultrasonography can be used in the measurementof the hyaline cartilage cap thickness.[21, 22] Bonescanning is directly correlated with the degreeof enchondral bone formation.[23,24] Radionuclideuptake is usually more prominent in youngpatient. In older patients, it may not demonstrateany uptake. In addition, it has not been usefulforevaluating malignant transformation.[3]
MR imaging is the best radiologic imaging
method evaluating hyaline cartilage cap. It alsoimportant for visualizing the effect of the lesionon surrounding structures and shows corticaland medullary continuity between the parentbone and osteochondroma.
Multiplanar reconstruction and three-dimensionalimaging features of CT give importantinformation of these lesions.Murpheyetal[2]
believed that very thin sections available withCT are often superior to MR imaging, especiallyin complex areas of anatomy, in osteochondromacases. Mineralization in the cartilage cap allowsa correct CT measurement. However, it can bevery difficult to correctly measure the thicknessof a totally nonmineralized cartilage cap becauseit cannot be easily differentiated fromsurrounding muscle or bursa. Cartilage capthickness greater than 1 to 2 cm in adults and 2to 3 cm in growing children suggests malignanttransformation.[2, 3, 25]
The treatment of osteochondromas isconservative or surgical (excision). Stable, smallasymptomatic lesions can be treatedconservatively. If the lesion is large and causesdiscomfort in daily activity or exhibits signs ofmalignant transformation should be treatedsurgically. A marginal resection is adequate andshows a low rate of recurrence. Any remainingcartilage cap may result in recurrence, especiallyin growing lesions.[2]
Conclusion:
Benign osteochondromas can representsymptomatic growth in skeletally mature patientswithout malignant transformation and surgicalexcision gives complete symptomatic relief.
61

References:1. Sekharappa V, Amritanand R, Krishnan V, David KS
(February 2014). “Symptomatic solitay osteochondromaof the subaxial cervical spine in a 52-year-old patient.”Asian Spine J8(1) : 84-88. doi: 10.4184/asj. 2014.8.1.84.PMC 3939376. PMID 24596611.
2. Murphey MD, Choi JJ, Kransdorf MJ, Flemming DJ,Gannon FH: Imaging of osteochondroma: variants andcomplications with radiologic-pathologic correlation.Radiographics 2000, 20:1407-1434.
3. Blitz NM, Lopez KT: Giant solitary osteochondromaof the inferior medial calcaneal tubercle: a case reportand review of the literature. J Foot Ankle Surg 2008,47:206-212.
4. Nogier A, De Pinieux G, Hottya G, Anract P: Casereports: enlargement of a calcaneal osteochondromaafter skeletal maturity.Clin Orthop Relat Res 2006, 447:260-266.
5. Greger G, Catanzariti AR: Osteochondroma: reviewof the literature and case report. J Foot Surg 1992,31:298-300.
6. Garrison RC, Unni KK, McLeod RA, Pritchard DJ,Dahl in DC: Chondrosarcoma ar i s ing inosteochondroma. Cancer 1982, 49:1890-1897.
7. Bottner F, Rodl R, Kordish I, Winklemann W, GoshegerG, Lindner N. Surgical treatment of symptomaticosteochondroma. A three- to eight-year follow-up study.J Bone Joint Surg Br. 2003; 85(8):1161-1165.
8. Giudici MA, Moser RP Jr, Kransdorf MJ. Cartilaginousbone tumors. RadiolClin North Am. 1993; 31(2) :237-259.
9. Scarborough MT, Moreau G. Benign cartilage tumors.OrthopClin North Am. 1996; 27(3):583-589.
10. Zhang, F; Liang J, Guo X, Zhang Y, Wen Y, Li Q,Zhang Z, Ma W, Dai L, Liu X, Yang L, Wang J. (29August 2013). "Exome sequencing and functionalanalysis identifies a novel mutation in EXT1 gene thatcauses multiple osteochondromas.". PLOS ONE 8 (8).Retrieved 25 March 2014.
11. Karasick D, Schweitzer ME, Eschelman DJ:Symptomatic osteochondromas: imaging features. AJRAm J Roentgenol 1997, 168:1507-1512.
12. Griffiths HJ, Thompson RC Jr, Galloway HR, EversonLI, Suh JS: Bursitis in association with solitaryosteochondromas presenting as mass lesions. SkeletalRadiol 1991, 20:513-516.
13. Resnick D, Kyriakos M, Greenway GD.Osteochondroma. In: Resnick D, ed. Diagnosis of Boneand Joint Disorders. 3rd ed. Vol 5. Philadelphia, PA:W.B. Saunders; 1995:3725-3746.
14. Unni KK. Chondrosarcoma (primary, secondary,dedifferentiated, and clear-cell). In: Unni KK, ed.Dahlin’s Bone Tumors: General Aspects and Data on11,087 Cases. 5th ed. Springfield, IL: Thomas;1996:71-108.
15. Villanueva J, González A, Cornejo M, Núñez C,Encina S. Osteochondroma of the coronoid process.Med Oral Patol Oral Cir Bucal. 2006;11(3):E289-291.
16. Mehta M, White LM, Knapp T, Kandel RA, WunderJS, Bell RS: MR imaging of symptomaticosteochondromas with pathological correlation.Skeletal Radiol 1998, 27:427-433.
17. Blanton SH, Hogue D, Wagner M, Wells D, YoungID, Hecht JT: Hereditary multiple exostoses:confirmation of linkage to chromosomes 8 and 11.AmJ Med Genet 1996, 62:150-159.
18. Malik R, Kapoor N, Malik R: Transformation ofs o l i t a r y o s t e o c h o n d r o m a c a l c a n e u m t ochondrosarcoma-a case report.Indian J PatholMicrobiol2004, 47:42-43.
19. Van Lerberghe E, Van Damme B, Van Holsbeeck M,Burssens A, Hoogmartens M: Case report 626:osteosarcoma arising in a solitary osteochondroma ofthe femur. Skeletal Radiol 1990, 19:594-597.
20. Nojima T, Yamashiro K, Fujita M, Isu K, UbayamaY, Yamawaki S: A case of osteosarcoma arising in asolitary osteochondroma. Acta Orthop Scand 1991,62:290-292.
21. Malghem J, Vande Berg B, Noel H, Maldague B:B e n i g n o s t e o c h o n d r o m a s a n dexostoticchondrosarcomas: evaluation of cartilage capthickness by ultrasound. Skeletal Radiol 1992, 21 :33-37.
22. Hudson TM, Spring field DS, Spanier SS, EnnekingWF, Hamlin DJ: Benign exostoses andexostoticchondrosarcomas: evaluation of cartilagethickness by CT. Radiology 1984, 152:595-599.
23. Glassman SB, Delbeke D: Nuclear medicine case ofthe day: hereditary multiple exostoses. AJR Am JRoentgenol 1992, 158:1384.
24. Kobayashi H, Kotoura Y, Hosono M, Sakahara H,Hosono M, Yao ZS, Tsuboyama T, Yamamuro T, EndoK, Konishi J: Diagnostic value of Tc-99m (V) DMSAfor chondrogenictumors with positive Tc-99m HMDPuptake on bone scintigraphy. ClinNucl Med 1995,20:361-364.
25. Woertler K, Lindner N, Gosheger G, BrinkschmidtC, Heindel W: Osteochondroma: MR imaging oftumor-related complications. Eur Radiol 2000, 10:832-840.
62

Lingual Thyroid constitutes 90% of ectopic thyroid found in clinical practice.A pinkish or reddish round swelling found at the base of the tongue, a developmental defect dueto non-migration of thyroid tissue to its normal site in front of neck.There may be subclinical or overt hypothyroidism associated with it.Diagnosis is confirmed by a Tc99 Thyroid scan showing active thyroid tissue in the base of thetongue region.The lingual swelling disappears in most of the cases after thyroid suppression with L-thyroxin.The treatment should be lifelong. Swelling reappears if thyroxin treatment is discontinued.Rarely, if the swelling is large and of long duration, may cause dysphagia and respiratory distressand may necessitate surgical intervention.Very rarely it may be malignant.
Lingual Thyroid
63
Pictorial CME
Courtesy :Dr. Debasish Maji
Prof., Dept. of Gen. Medicine, RKMSP, VIMS

The editorial board of the Journal of the Vivekananda Institute ofMedical Sciences, Ramakrishna Mission Seva Pratishthan,
expresses deep sorrow at the passing away of
DR. ALFRED CHARLES WOODWARDof the Department of Surgery (Cardiothoracic Surgery Unit) on
7th May 2015, and it shares the burden of sorrow with the bereavedfamily and offers heart-felt condolences.
The members of the board remembers with respectful gratitude thededicated and selfless service of DR. WOODWARD to this
Pratishthan during his association with it starting on 01-01-2006when he first joined as a Non-Resident Senior
Medical Officer in the Department of Surgery. Later,from 01-07-2007 he was appointed as an Hony. Dy. Visiting Surgeon.
From 01-01-2009, he became an Associate Professor ofSurgery (Cardiothoracic Surgery Unit) and was promoted as
Professor w.e.f. 15-12-2010 and continued as such tillthe last day of his life.
The members whole-heartedly prays to the Almightyfor the eternal peace of the departed soul.
64
Obituary