
Journal of Immunological Methods - Sebia · disease has progressed to the extent that Bence Jones...
13
Research paper Development of a highly-sensitive multi-plex assay using monoclonal antibodies for the simultaneous measurement of kappa and lambda immunoglobulin free light chains in serum and urine John P. Campbell, Mark Cobbold, Yanyun Wang, Margaret Goodall, Sarah L. Bonney, Anita Chamba, Jane Birtwistle, Timothy Plant, Zaheer Afzal, Roy Jefferis, Mark T. Drayson ⁎ Clinical Immunology Service, School of Immunity and Infection, College of Medical and Dental Sciences, University of Birmingham, Birmingham B15 2TT, United Kingdom article info abstract Article history: Received 21 July 2012 Received in revised form 28 January 2013 Accepted 28 January 2013 Available online 4 February 2013 Monoclonal κ and λ immunoglobulin free light chain (FLC) paraproteins in serum and urine are important markers in the diagnosis and monitoring of B cell dyscrasias. Current nephelometric and turbidimetric methods that use sheep polyclonal antisera to quantify serum FLC have a number of well-observed limitations. In this report, we describe an improved method using specific mouse anti-human FLC monoclonal antibodies (mAbs). Anti-κ and anti-λ FLC mAbs were, separately, covalently coupled to polystyrene Xmap® beads and assayed, simultaneously, in a multi-plex format by Luminex® (mAb assay). The mAbs displayed no cross-reactivity to bound LC, the alternate LC type, or other human proteins and had improved sensitivity and specificity over immunofixation electrophoresis (IFE) and Freelite™. The assay gives good linearity and sensitivity (b 1 mg/L), and the competitive inhibition format gave a broad calibration curve up to 437.5 mg/L and prevented anomalous results for samples in antigen excess i.e. high FLC levels. The mAbs displayed good concordance with Freelite™ for the quantitation of normal polyclonal FLC in plasma from healthy donors (n = 249). The mAb assay identified all monoclonal FLC in serum from consecutive patient samples (n = 1000; 50.1% with monoclonal paraprotein by serum IFE), and all FLC in a large cohort of urine samples tested for Bence Jones proteins (n = 13090; 22.8% with monoclonal κ, 9.0% with monoclonal λ, and 0.8% with poly LC detected by urine IFE). Importantly this shows that the mAbs are at least close to the ideal of detecting FLC from all patients and neoplastic plasma cell clones. Given the overall effectiveness of the anti-FLC mAbs, further clinical validation is now warranted on serial samples from a range of patients with B cell disorders. Use of these mAbs on other assay platforms should also be investigated. © 2013 Elsevier B.V. All rights reserved. Keywords: Multiple myeloma Serum free light chains Bence Jones proteins Plasma cell dyscrasias 1. Introduction The total of body plasma cells secretes about 1 g per day of kappa and lambda immunoglobulin free light chains (FLCs) into the extracellular fluids. These FLCs are cleared from the blood by glomerular filtration with a half-life of 2 to 6h(Waldmann et al., 1972). A neoplastic clone of plasma cells must secrete up to 20 g of FLC per day to saturate FLC absorption in the proximal renal tubules of healthy kidneys and thus become detectable in urine (Drayson, 2012). Accordingly it would be preferable to detect and quantitate FLC in blood not urine but this is difficult because serum levels of FLC are mg/L compared to the one thousand- fold higher level of LC bound to whole immunoglobulin. Antibodies for routine clinical quantitation of serum FLC must have specificity for epitopes that are exposed on FLC and hidden on LC bound in whole immunoglobulin; further these antibodies must detect FLC from all patients and neoplastic plasma cell clones. Journal of Immunological Methods 391 (2013) 1–13 ⁎ Corresponding author. E-mail address: [email protected] (M.T. Drayson). 0022-1759/$ – see front matter © 2013 Elsevier B.V. All rights reserved. http://dx.doi.org/10.1016/j.jim.2013.01.014 Contents lists available at SciVerse ScienceDirect Journal of Immunological Methods journal homepage: www.elsevier.com/locate/jim
-
Upload
nguyenliem -
Category
Documents
-
view
212 -
download
0
Transcript of Journal of Immunological Methods - Sebia · disease has progressed to the extent that Bence Jones...

Journal of Immunological Methods 391 (2013) 1–13
Contents lists available at SciVerse ScienceDirect
Journal of Immunological Methods
j ourna l homepage: www.e lsev ie r .com/ locate / j im
Research paper
Development of a highly-sensitive multi-plex assay using monoclonalantibodies for the simultaneous measurement of kappa and lambdaimmunoglobulin free light chains in serum and urine
John P. Campbell, Mark Cobbold, YanyunWang, Margaret Goodall, Sarah L. Bonney, Anita Chamba,Jane Birtwistle, Timothy Plant, Zaheer Afzal, Roy Jefferis, Mark T. Drayson⁎Clinical Immunology Service, School of Immunity and Infection, College of Medical and Dental Sciences, University of Birmingham, Birmingham B15 2TT, United Kingdom
a r t i c l e i n f o
⁎ Corresponding author.E-mail address: [email protected] (M.T. Dra
0022-1759/$ – see front matter © 2013 Elsevier B.V. Ahttp://dx.doi.org/10.1016/j.jim.2013.01.014
a b s t r a c t
Article history:Received 21 July 2012Received in revised form 28 January 2013Accepted 28 January 2013Available online 4 February 2013
Monoclonal κ and λ immunoglobulin free light chain (FLC) paraproteins in serum and urineare important markers in the diagnosis and monitoring of B cell dyscrasias. Currentnephelometric and turbidimetric methods that use sheep polyclonal antisera to quantifyserum FLC have a number of well-observed limitations. In this report, we describe an improvedmethod using specific mouse anti-human FLC monoclonal antibodies (mAbs). Anti-κ andanti-λ FLC mAbs were, separately, covalently coupled to polystyrene Xmap® beads andassayed, simultaneously, in a multi-plex format by Luminex® (mAb assay). The mAbsdisplayed no cross-reactivity to bound LC, the alternate LC type, or other human proteins andhad improved sensitivity and specificity over immunofixation electrophoresis (IFE) andFreelite™. The assay gives good linearity and sensitivity (b1 mg/L), and the competitiveinhibition format gave a broad calibration curve up to 437.5 mg/L and prevented anomalousresults for samples in antigen excess i.e. high FLC levels. The mAbs displayed good concordancewith Freelite™ for the quantitation of normal polyclonal FLC in plasma from healthy donors(n = 249). The mAb assay identified all monoclonal FLC in serum from consecutive patientsamples (n = 1000; 50.1% with monoclonal paraprotein by serum IFE), and all FLC in a largecohort of urine samples tested for Bence Jones proteins (n = 13090; 22.8% with monoclonal κ,9.0% with monoclonal λ, and 0.8% with poly LC detected by urine IFE). Importantly this showsthat the mAbs are at least close to the ideal of detecting FLC from all patients and neoplasticplasma cell clones. Given the overall effectiveness of the anti-FLC mAbs, further clinicalvalidation is now warranted on serial samples from a range of patients with B cell disorders.Use of these mAbs on other assay platforms should also be investigated.
© 2013 Elsevier B.V. All rights reserved.
Keywords:Multiple myelomaSerum free light chainsBence Jones proteinsPlasma cell dyscrasias
1. Introduction
The total of body plasma cells secretes about 1 g per dayof kappa and lambda immunoglobulin free light chains(FLCs) into the extracellular fluids. These FLCs are clearedfrom the blood by glomerular filtration with a half-life of 2 to6 h (Waldmann et al., 1972). A neoplastic clone of plasmacells must secrete up to 20 g of FLC per day to saturate
yson).
ll rights reserved.
FLC absorption in the proximal renal tubules of healthykidneys and thus become detectable in urine (Drayson,2012). Accordingly it would be preferable to detect andquantitate FLC in blood not urine but this is difficult becauseserum levels of FLC are mg/L compared to the one thousand-fold higher level of LC bound to whole immunoglobulin.Antibodies for routine clinical quantitation of serum FLCmusthave specificity for epitopes that are exposed on FLC andhidden on LC bound in whole immunoglobulin; further theseantibodies must detect FLC from all patients and neoplasticplasma cell clones.

2 J.P. Campbell et al. / Journal of Immunological Methods 391 (2013) 1–13
Currently there is only one source of FDA approved serumFLC assays (Freelite™, the Binding Site Ltd., UK) (Bradwell et al.,2001). These immunoassays employ purified specific sheeppolyclonal antisera adsorbed to render them specific for κand λ FLCs, respectively, that are latex-enhanced for use inturbidimetric and nephelometric immunoassays. For the firsttime it has been possible to routinely measure serum FLCsfrom an array of patient groups that includes oligosecretorymyeloma (Drayson et al., 2001), light chain only myeloma(Bradwell et al., 2003), light chain amyloidosis (Lachmannet al., 2003), monoclonal gammopathy of unknown signifi-cance (MGUS) (Rajkumar et al., 2004), healthy individuals(Katzmann et al., 2002), and others (Drayson, 2012). Dualmeasurement of serum κ and λ FLC levels has also highlightedthe importance of the κ:λ ratio in the diagnosis andmonitoringof B cell malignancies. The κ:λ ratio represents a sensitivebalance between the two light chain types, whereby over-production of one type by a malignant B cell clone leads to aperturbation of the normal κ:λ reference range (Freelite™ κ:λratio = 0.26–1.65 (Katzmann et al., 2002)). It is now possibleto identify patients with a perturbed serum κ:λ ratio beforedisease has progressed to the extent that Bence Jones (BJ)protein appears in urine. The serum FLC ratio facilitatesdiagnosis and monitoring of oligosecretory myeloma andlight chain amyloid where serum and urine immunofixationis negative, enables earlier diagnosis of active light chainonly disease, reducing the risk of acute kidney damage(Hutchison et al., 2008) and gives prognostic information inall B cell dyscrasias and in healthy individuals (Dispenzieriet al., 2012).
These clinically significant developments arewell establishedand international guidelines recommend the use of Freelite™ indiagnosis and management of a wide range of plasma celldyscrasias (Dispenzieri et al., 2009). However, this first gener-ation of serum FLC assays has technical limitations. A separatetest for each κ and λ FLC measurement is required, introducinginter-test error and reducing the reliability of the κ:λ ratio resultobtained. This variability is compounded further by the batch-to-batch differences observed in the polyclonal antisera pro-duced from individual sheep (Tate et al., 2007, 2009). In clinicalpractise, it is important to detect both the elevation of one FLCtype by secretion of malignant FLC and the reduction in levels ofthe alternate FLC by immunoparesis. Thus assays need toquantitate FLC levels ranging from 1 mg/L to >1000 mg/L.The latex-enhanced antisera have a calibration range of 3.7–56.2 mg/L for κ FLC and 5.6–74.8 mg/L for λ FLC, and areunreliable at the lower end. This can lead to an abnormal κ:λratio in healthy individuals and apparently significant changes inratio between sequential samples from myeloma patients whoare in fact still in remission. This problem is highlighted by ‘gaps’above and below the working calibration range of the assay(Bradwell, 2008). The limited calibration range also requires thatsamples with high FLC be diluted several times. The assay isprone to antigen-excess (or “hook effect”) which can causefalse negative diagnoses in patients with grossly elevated FLCand false positive evidence of disease progression (Daval et al.,2007; Levinson, 2010a; Murata et al., 2010). Monoclonal FLCparaproteins tested on Freelite™ have been shown to be non-linear (Tate et al., 2007) meaning that dilutions could lead toinaccurate FLC quantitation. The polyclonal antisera in the assayare targeted against polyclonal FLC, as opposed to monoclonal
FLC, potentiating the claim that the Freelite™ sensitivity toparaprotein levels slightly outside the normal reference range isnegatively affected (Levinson, 2010b). Further, there are reportsthat the antisera are cross-reactive with bound κ and λ LC(Davern et al., 2008) leading to excessively high FLC results notrepresentative of absolute FLC levels. A second generation ofserum FLC tests is needed to overcome these problems. Ifmonoclonal antibodies (mAbs) could be produced that specif-ically target human κ and λ FLCs, then they would provide along term solution to the problems of the current polyclonalFreelite™ assay.
Development of FLC specific mAbs is difficult and compli-cated by the paucity of constant domain epitopes available forFLC recognition; which can be further reduced by polymerisa-tion of FLC, particularly FLC λ, thus reducing the number ofpotential binding sites (Abraham et al., 2002; Bergen et al.,2004; Davern et al., 2008). Production of mAbs specific for FLChas been described previously (Abe et al., 1993, 1998; Nakanoand Nagata, 2003; Davern et al., 2008) and these groups havedemonstrated mAb specificity for epitopes that are exposed onFLC and hidden on LC bound in whole immunoglobulin.However these groups have either found that their mAbs didnot detect FLC from all neoplastic plasma cell clones tested orhave not tested sufficient clones to be confident that the mAbswould detect the FLC from at least 95% of neoplastic clones.Recently another group reported anti-FLC mAbs (te Velthuiset al., 2011; Hoedemakers et al., 2012) again, specificity with atleast 95% of neoplastic FLC clones appears unlikely, especiallyfor λ FLC (Drayson and Carr-Smith, 2012; Hutchison et al.,2012).
In the present study, we describe the development andinitial validation of two anti-κ FLC and two anti-λ FLC mAbsin a competitive-inhibition multi-plex Luminex® assay (mAbassay). Whilst it is important that the new assay overcomesthe problems with existing commercial assays, initial clinicalvalidation must also demonstrate that the mAbs provide: (1)similar quantitation of polyclonal FLC from healthy donors tothe Freelite™ assay; (2) appropriate sensitivity to reliablyquantify low levels of FLC representative of immunosuppres-sion or immunoparesis; and (3) by testing a large number ofserum and urine samples it shows that the mAbs are at leastclose to the ideal of detecting FLC from all patients andneoplastic cell clones.
2. Materials and methods
2.1. Ethical approval
Ethical approval for development and validation of theFLC assay using residual, end-of-diagnostic use of patientserum and urine was granted by the Life and HealthSciences Ethical Review Committee of the University ofBirmingham, UK. Financial support for the study wasprovided by the Clinical Immunology Service, University ofBirmingham, UK.
2.2. Preparation of anti-FLC mAbs
Anti-FLC mAbs were prepared using standard methods(Galfre and Milstein, 1981). Briefly, BALB/c mice wereimmunised with κ or λ FLC purified from human urine

3J.P. Campbell et al. / Journal of Immunological Methods 391 (2013) 1–13
containing BJ Protein or immunoglobulin fragments. Spleensfrom immunised mice were dispersed into single cell suspen-sions, mixed with immortal mouse plasmacytoma cells (NSI,NSO) and fusions of cells facilitated with polyethylene glycol(PEG). The cell mixture was plated out in 96 well plates withselection being facilitated with hypoxanthine, thymidine, andmethotrexate. Supernatants fromwells containing clones wereassayed for production of antibodies specific for κ or λ FLC.Anti-FLC mAbs were selected based on reactivity with a largepanel of κ or λ FLC antigens containing a variety of variableand constant regions, and shown to be negative for alternateFLC, light chains bound to immunoglobulins of all classesand subclasses, albumin and other selected human serumproteins. Initial assays were performed in haemagglutinationand haemagglutination inhibition assays where sheep redblood cells were coupled to purified FLC from individualpatients (Ling et al., 1977). Ascites cells were adaptedto in vitro culture, and were expanded in a mini-permbioreactor. Bioreactor supernatants (MiniPerm, Sarstedt)containing anti-FLC mAbs were purified using protein G orSpA chromatography (GE Healthcare). Purified mAb collec-tions were diluted 1/100 and quantified by spectropho-tometry (Eppendorf) at 280 nm for protein concentration,with 1.43 extinction coefficient (Hay et al., 2002). Initially,anti-FLC mAbs were selected based on reactivity with allκ or λ FLC antigens in a panel of different BJ proteins,and minimal cross-reactivity to a panel of purified wholeimmunoglobulins. Specificity was established by covalentlycoupling mAbs to Luminex® Xmap® beads (Bio-Rad, UK)and quantifying polyclonal light chains from dithiothreitoltreated immunoglobulin infusate (Gammagard Liquid), whichwas then reduced and/or acetylated and separated on a G100column in the presence of proprionic acid, and quantified usingFreelite™. In addition, specificity was established on theLuminex® against: (a) a panel of serum samples from patientswith elevated polyclonal light chains and myeloma; and, (b) apanel of urine samples containingBJ proteins. From this process,two anti-κ (BUCIS 01 and BUCIS 04) and two anti-λ (BUCIS 03and BUCIS 09) FLC mAbs were chosen for further developmentand initial validation in the mAb assay (Serascience, UK).
2.3. Preparation of calibrator material
Individual urines containing a high level of BJ proteinwere centrifuged and 0.2 μm filtered. Purity assessmentwas conducted by SDS Page and those identified as showinga single band of monomeric FLC and/or single band of dimericFLC, indicating that there were no other proteins visible, weredialysed against deionised water with several changes ofwater. Each preparation was passed over activated charcoal,concentrated by vacuum dialysis, and freeze-dried on avacuum dryer and protein stored at 4 °C. Calibrator materialwas made by combining four sources of purified BJ λ proteinand five sources of BJ κ protein. 105 mg of each FLC pro-tein was dissolved in 15 mL saline, overnight at 4 °C. Thesupernatants were 0.2 μm filtered before measuring theconcentration by spectrophotometry at 280 Å at a dilutionof 1/100 and extinction coefficient of 11.8 (Hay et al., 2002).Equal amounts of each BJ κ or λ protein were combined andthe volumes of the two preparations were adjusted withsterile PBS to a concentration of 7 mg/mL. Sodium azide was
added from a 0.2 μm filtered preparation of 9.9% w/v indeionised water to give a final concentration of 0.099%. Thepreparations were aliquoted into 1 mL volume and storedat −80 °C.
2.4. Biotinylation of immunoglobulin free light chains
For the purposes of a competitive inhibition assay,individual κ and λ FLC mixes were biotinylated for laterbinding to streptavidin-PE in the assay phase, as follows.Purified κ and λ FLC calibrator materials were separatelyincubated with biotinamidohexanoyl-6-aminohexanoic acid,N-hydroxysuccinimide ester in dimethyl sulfoxide overnight(all Sigma Aldrich). Biotinylated light chains were thenseparated using NAP™ 5 Columns (Sephadex G-25 DNAgrade; GE Healthcare), eluted in PBS, and the concentrationof the eluate was measured by spectrophotometry. After theaddition of 0.099% sodium azide, biotinylated light chainswere stored at 4 °C, until required.
2.5. Luminex® bead—mAb couplings
Prior to assaying, each of the anti-κ FLC and anti-λFLC mAbs was covalently coupled to four different 5.5 μmpolystyrene Xmap® beads (Bio-Rad UK) using a two stepcarbodiimide reaction protocol. Specifically, the differentbead regions used were #27 (BUCIS 01), #28 (BUCIS 04),#29 (BUCIS 03), and #30 (BUCIS 09). After sonication andvortexing, beads were incubated with N-hydroxysuccinimide(NHS) and 1-ethyl-3-(3-dimethylaminopropyl) carbodiimidehydrochloride (EDC) for 30 min in activation buffer (0.1 MPBS, pH 6.2). Following two wash procedures, the bead pelletwas incubated for 3 h with the relevant mAbs (100 μL at1 mg/mL) on a rotor, in the dark, at room temperature.Beads were then washed twice, and finally, the pellet wasresuspended in blocking/storage buffer (0.1 M PBS, 0.05%Tween20, 1% BSA, 0.05% NaN3, pH 7.2). The beads wereenumerated using a haemocytometer to ensure consistencybetween conjugations. Labelled beads were stored in blocking/storage buffer in the dark at 4 °C until required in the assay; thebeads were found to be stable for at least 6 months in theseconditions (data not shown).
The efficiency of mAb conjugation to each beadset wasdetermined in a one-step assay by incubating each beadsetwith goat anti-mouse IgG labelled with phycoerythrin (PE;Southern Biotech, USA), and subsequent measurement byLuminex®. The effectiveness of each mAb-bead complex atdetecting κ and λ FLCs was tested in a two-step assay by (1)incubating beads with biotinylated purified κ and λ FLCs, and(2) incubation with streptavidin-PE (Invitrogen, UK), andsubsequent measurement by Luminex®. A minimum medianfluorescent intensity (mfi) was set at >10,000 mfi units formAb conjugation to beads and >5000 mfi units for detectionof κ and λ FLCs, as this provided calibration curves withthe most sustained linearity, and, hence, more reliable andreproducible results on patient samples.
2.6. mAb assay for measurement of κ and λ FLCs
Human κ and λ FLCs were measured in a multi-plexcompetitive inhibition format. 40 μl of biotinylated FLC

4 J.P. Campbell et al. / Journal of Immunological Methods 391 (2013) 1–13
diluted 1 in 400 in FLC buffer (PBS, 12.5% 2 M Tris, 1% BSA,0.099% NaN3, 0.05% Tween20) was added to each well in a1.2 μm MV Multiscreen (Millipore, UK) 96-well filter plate,followed by 40 μl of each sample, calibrators or controls, andthen incubated for 30 min with mAb coupled beads. Eachsample was diluted 1 in 5 in assay buffer (PBS, 1% BSA, 0.05%NaN3) prior to addition to the filter plate. A seven-pointcalibration curve with a five parameter logistical curve fittingwas used (BioPlex Manager 6.0, BioRad UK). The calibrationmaterial was generated by mixing an equal amount of thestock κ and λ FLC material, and then diluting this 1 in 8 in FLCbuffer to give the starting calibration point (437.5 mg/L). Thetop calibrator was then serially diluted 4-fold in FLC bufferto 0.1 mg/L, in duplicate. In-house quality controls wereused on all assay plates to monitor assay performance andreproducibility. Following incubation for 30 min, filter plateswere washed three times using assay buffer and aspiratedusing a manifold pump. 50 μl streptavidin-PE (diluted 1 in500 in assay buffer) was added to all wells and incubated for30 min. After further washing, plates were analysed on aLuminex® 100 system (Luminex Corp., USA). A minimum of100 beads per bead region, per well of the filter plate, werecounted on the Luminex®. Samples exhibiting a high FLCconcentration above the initialworking range of the calibrationcurve at a 1 in 5 dilution, were repeated at a 1 in 100 dilutionin assay buffer, to avoid extrapolation and ensure reliable
1
10
100
1000
10000
100000
0.01 0.1 1 10 100 1000 10000
mF
I
FLC (mg/L)
BUCIS 01
BUCIS 04
BUCIS 03
BUCIS 09
Fig. 1. Representative calibration curves showing the median fluorescenintensity (mFI) and FLC concentration (mg/L) generated by the mAb assayfor each anti-κ FLC mAb (BUCIS 01 and BUCIS 04) and each anti-λ FLC mAb(BUCIS 03 and BUCIS 09). These representative curves included a calibrationcoefficient that was applied to each mAb, as described in Section 2.7. Brieflythe process of applying a calibration coefficient began by conducting aninitial method comparison between each anti-FLC mAb and Freelite™ on249 healthy donor plasma samples, to investigate whether each anti-FLCmAbs provided a similar quantitation of polyclonal FLC. From this process, iwas clear that each anti-κ FLC mAb provided different results for polyclonaFLC, and each provided different results to Freelite™; the same was found foreach anti-λ FLC mAb. Hence, it was necessary to use different calibrationcoefficients for each mAb to provide similar quantitation of polyclonal FLCsto Freelite™. Therefore, a calibration coefficient was applied to the calibratormaterial (mix of monoclonal FLC from the urine of myeloma patients) resultsobtained by spectrophotometry for κ FLC (437.5 mg/L) andλ FLC (437.5 mg/L)and these were: BUCIS 01 = 0.731X, BUCIS 04 = 3.086X, BUCIS 03 = 0.869XBUCIS 09 = 1.600X (where X is equal to the spectrophotometry result).
t
,
tl
,,
quantitation of samples on the linear sectors of the standardcurves (see Fig. 1 for representative calibration curves).
2.7. Assignment of a calibration coefficient to the mAb assay
To establish if each anti-κ FLC mAb provided a similarquantitation of polyclonal κ FLC, and each anti-λ FLC mAbprovided a similar quantitation of polyclonal λ FLC, an initialmethod comparison of each mAb was conducted using 249donor plasma samples from the UK NHSBT. From this process,it became clear that each anti-κ FLC mAb provided differentresults for polyclonal FLC, and subsequent analyses found thateach provided different results to Freelite™; the same wasfound for each anti-λ FLCmAb (data not shown). Hence, it wasnecessary to use different calibration coefficients for each mAbto provide similar quantitation of polyclonal FLCs to each other,and to Freelite™. Final calibration coefficients were derived bya method comparison (Krouwer et al., 2010) to the Freelite™assay for polyclonal FLC (Katzmann et al., 2002). Calibrationtraceability to Freelite™ was preferred because there is norecognised international standard for FLC, and to ensure thatthe guidelines issued by the International Working Group onMultiple Myeloma (Dispenzieri et al., 2009) are transferable tothemAb assay, as discussed elsewhere (te Velthuis et al., 2011).Accordingly, a calibration coefficient was applied to the cal-ibratormaterial result obtained by spectrophotometry for κ FLC(437.5 mg/L) and λ FLC (437.5 mg/L). For each anti-FLC mAb,the following calibration coefficients were applied to thecalibrator material: BUCIS 01 = 0.731X, BUCIS 04 = 3.086X,BUCIS 03 = 0.869X, BUCIS 09 = 1.600X; where X is equal tothe calibrator result by spectrophotometry. Representativecalibration curves are displayed in Fig. 1.
2.8. Assay dynamics
Assay limit of detection was measured by spiking a poolof normal plasma samples with no more than 20% volume ofpurified BJ κ or λ protein from patient urine. These spikedsamples were serially diluted 1 in 4 in assay buffer andmeasured on the mAb assay. Serial dilutions were replicatedfive times within the same plate, and the limit of detectionfor each mAb was then assessed. The limit of detection foreach mAb was determined by selecting the lowest concen-tration detected by the mAb assay above the blank wellcontaining only assay buffer (no BJ protein).
Assay linearitywas assessed by serially diluting three serumsamples containing elevated levels of monoclonal κ FLC andthree samples containing elevated levels of monoclonal λ FLC,two-fold in assay buffer. These six sampleswere serially dilutednine times with three replicates of each dilution conductedwithin the same plate. Linearity of the mAb assay was thenassessed on the ten sample dilutions. Because competitiveinhibition assays are inherently non-linear, a strategy fordemonstrating linearity was conducted by comparing theexpected results against the acquired results from the serialdilutions.
Assay batch-to-batch variability was assessed by analysingfifty serum samples with varying FLC levels once, on separateassay days, using three consecutive batches of anti-FLC mAbs,calibrators and other appropriate assay reagents.

5J.P. Campbell et al. / Journal of Immunological Methods 391 (2013) 1–13
Assay imprecision was estimated by calculating the intra-assay coefficient of variation percentage (CV%) and the inter-assay CV%. For these tests, pools of samples with low, mediumand high levels of κ and λ FLCs were used. All samples wereanalysed in duplicate, every morning, for ten working consec-utive days, and all tests were conducted in accordancewith theClinical and Laboratory Standards Institute (CLSI) guidelineEP5-A2 (Tholen et al., 2004).
The susceptibility of the mAb assay to interference wasmeasured by adding knownquantities of interference agents toa pool of National Health Service Blood and Transplant Service(NHSBT) plasma samples containing normal κ (11.12 mg/L)and λ (7.62 mg/L) FLC levels. Individual aliquots of theplasma pool were spiked with purified IgG-κ (3.5 g/L), IgG-λ(3.6 g/L), IgA-κ (1.5 g/L), IgA-λ (3.2 g/L), IgM-κ (6.5 g/L),IgM-λ (3.7 g/L), haemoglobin (4 g/L), bilirubin (0.2 g/L), cho-lesterol (2 g/L), triglyceride (5 g/L), as well as κ FLC (2 g/L) or λFLC (2 g/L). Interference testing was conducted in accordancewith CLSI guidelines EP7-A2 (McEnroe et al., 2005).
For all tests on assay dynamics, except mAb limit ofdetection, the maximal value obtained from each anti-κ FLCmAb (BUCIS 01 or BUCIS 04) was used as the final κ result,and the same approach was used for each anti-λ FLC mAb(BUCIS 03 and BUCIS 09) for λ FLC results.
2.9. Reference values
250 plasma samples obtained from healthy randomdonors (NHSBT UK) were measured using the Freelite™ andmAb assays; results obtained by all four anti-FLC mAbs wereused for these analyses. All samples were first screened forparaproteins by routine serum immunofixation electropho-resis (IFE). Results were presented as the 95% referencepopulations, as well as the 100% reference range, so asto allow a comparison to the Freelite™ assay (Katzmannet al., 2002). To generate the 95% reference results, extremeoutliers three times the size of the inter-quartile range wereremoved. Due to a positively skewed distribution after outlierremoval, results were ranked by z-scores to identify thecentral 95% intervals.
2.10. Clinical specificity on patient serum samples andurine samples
1000 consecutive serum samples received by the ClinicalImmunology Service (CIS) for routine clinical measurementof κ and λ FLCs (on Freelite™) were analysed simultaneouslyon the mAb assay. This exercise served three purposes: toestablish the specificity of each mAb at detecting FLC levels inpatients with a wide range of disease conditions; to make acomparison with Freelite™; and to serve as a preliminaryassessment of the mAb assay in a clinical setting. 209 sam-ples were from patients enrolled in myeloma trials. Of the791 non-trial patient samples, 292 had a known serumparaprotein, 106 had no paraprotein, and no admissiondiagnosis was available for the remaining 393 samples. Inaddition, 289 samples had a matched urine sample and 711samples had no matched urine. Samples were collectedchronologically throughout July and August 2011 as theyarrived at the Clinical Immunology Service, and inclusioncriteria required the sample volume be greater than 500 μL; no
other inclusion/exclusion criteria were set. Results generatedby each mAb were compared to the results obtained byFreelite™. Experimenters were blind to the original Freelite™result and patient diagnosis. Any discrepant results betweenFreelite™ and the mAb assay were repeated on both platformsto exclude the possibility of user/instrument error. A discrep-ancywas defined as any samplewith an abnormal κ:λ FLC ratioon one assay but not the other, or, an elevated FLC concentra-tion outside the normal 95% reference range on one assay butnot the other (see Fig. 2 for reference ranges). To exclude thepossibility that anti-FLC mAbs ‘missed’ any monoclonal FLC,any discrepant samples were further investigated by routineserum IFE analysis, IFE and mAb assay analysis of urine, andpatient history, if available.
The specificity of the anti-FLC mAbs at measuringFLC levels and ability to detect FLC from all patients wasfurther tested in a large cohort of urine samples. An initialcomparison was made between the mAb assay and com-mercially available radial immunodiffusion assays (RID; theBinding Site, UK). Correlations between the two assays weregood (results not shown) and a further comparison wasmade between the mAb assay and densitometric scanning ofprotein electrophoresis, regarded as the “gold standard” inurine FLC paraprotein quantitation. Individual concentratedurine (30× concentrated; Zeba) was analysed by densitometryaccording to the manufacturer's instructions (Interlab, Italy),total protein (Total Protein Gen.2, Roche) was estimated on aRoche Hitachi Analyser, and for comparison, FLCs were alsoanalysed on themAb assay. Results demonstrated that themAbassay correlated well with densitometry (representative datain Fig. 3). Given the success of themAb assay at detecting FLC inurine, the clinical utility of the mAb assay was then assessed in13,090 unconcentrated urine samples sent to the laboratory forroutine FLC analysis between April 2008 and Nov 2010. Allsamples were also analysed by urine IFE (the gold standard forpresence of LC in urine) to assess the specificity of the mAbassay, and to ensure that the mAb assay detected all FLCparaproteins. All samples were analysed as they arrived in thelaboratory. After initial routine analyses, samples were storedat −20 °C. 2995 samples (22.8%) had monoclonal κ, 1180samples (9.0%) had monoclonal λ, and 105 samples (0.8%) hadpoly LC, as detected by IFE. 12,242 of these samples were frompatients who had a known immunoglobulin paraprotein inserum by IFE (93.5%), 641 samples had no paraprotein inmatched serum, and 207 had no serum IFE diagnosis or noserum available. 3806 samples were received from patientsenrolled in myeloma trials and the remaining 9284 sampleswere non-trial samples. Because two anti-κ FLC and two anti-λFLC mAbs were used in each test, the maximal concentrationdetected by each anti-κ (BUCIS 01 or BUCIS 04) and each anti-λmAb (BUCIS 03 or BUCIS 09) was chosen as the final urineFLC result. As a means of determining the specificity of themAb assay in urine, any results that were immunofixationpositive and mAb assay negative (recorded clinically asb10 mg/L), were classed as discrepant. To ensure thateach of the anti-FLC mAbs targeted all FLC epitopes, alldiscrepant samples were re-tested on the mAb assayand by urine IFE. If a discrepancy remained, a full urineIFE was conducted to exclude the presence of wholeparaprotein because initial IFE used anti-sera against LCfree and bound. Further investigation of matched serum
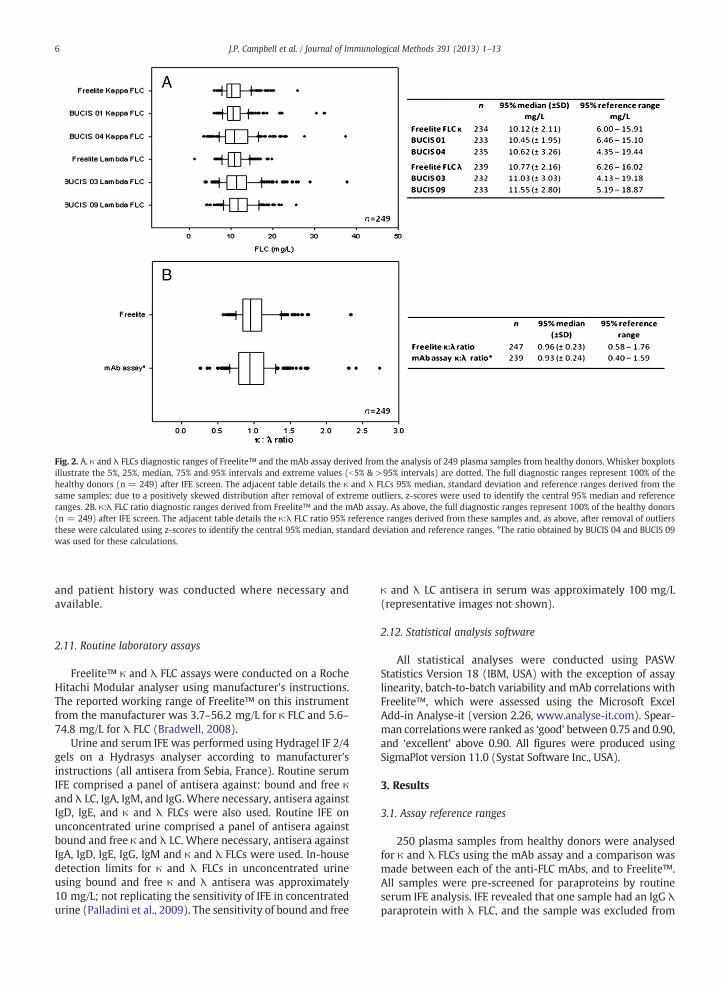
Fig. 2. A. κ and λ FLCs diagnostic ranges of Freelite™ and the mAb assay derived from the analysis of 249 plasma samples from healthy donors. Whisker boxplotsillustrate the 5%, 25%, median, 75% and 95% intervals and extreme values (b5% & >95% intervals) are dotted. The full diagnostic ranges represent 100% of thehealthy donors (n = 249) after IFE screen. The adjacent table details the κ and λ FLCs 95% median, standard deviation and reference ranges derived from thesame samples; due to a positively skewed distribution after removal of extreme outliers, z-scores were used to identify the central 95% median and referenceranges. 2B. κ:λ FLC ratio diagnostic ranges derived from Freelite™ and the mAb assay. As above, the full diagnostic ranges represent 100% of the healthy donors(n = 249) after IFE screen. The adjacent table details the κ:λ FLC ratio 95% reference ranges derived from these samples and, as above, after removal of outliersthese were calculated using z-scores to identify the central 95% median, standard deviation and reference ranges. *The ratio obtained by BUCIS 04 and BUCIS 09was used for these calculations.
6 J.P. Campbell et al. / Journal of Immunological Methods 391 (2013) 1–13
and patient history was conducted where necessary andavailable.
2.11. Routine laboratory assays
Freelite™ κ and λ FLC assays were conducted on a RocheHitachi Modular analyser using manufacturer's instructions.The reported working range of Freelite™ on this instrumentfrom the manufacturer was 3.7–56.2 mg/L for κ FLC and 5.6–74.8 mg/L for λ FLC (Bradwell, 2008).
Urine and serum IFE was performed using Hydragel IF 2/4gels on a Hydrasys analyser according to manufacturer'sinstructions (all antisera from Sebia, France). Routine serumIFE comprised a panel of antisera against: bound and free κand λ LC, IgA, IgM, and IgG. Where necessary, antisera againstIgD, IgE, and κ and λ FLCs were also used. Routine IFE onunconcentrated urine comprised a panel of antisera againstbound and free κ and λ LC. Where necessary, antisera againstIgA, IgD, IgE, IgG, IgM and κ and λ FLCs were used. In-housedetection limits for κ and λ FLCs in unconcentrated urineusing bound and free κ and λ antisera was approximately10 mg/L; not replicating the sensitivity of IFE in concentratedurine (Palladini et al., 2009). The sensitivity of bound and free
κ and λ LC antisera in serum was approximately 100 mg/L(representative images not shown).
2.12. Statistical analysis software
All statistical analyses were conducted using PASWStatistics Version 18 (IBM, USA) with the exception of assaylinearity, batch-to-batch variability and mAb correlations withFreelite™, which were assessed using the Microsoft ExcelAdd-in Analyse-it (version 2.26, www.analyse-it.com). Spear-man correlationswere ranked as ‘good’ between 0.75 and 0.90,and ‘excellent’ above 0.90. All figures were produced usingSigmaPlot version 11.0 (Systat Software Inc., USA).
3. Results
3.1. Assay reference ranges
250 plasma samples from healthy donors were analysedfor κ and λ FLCs using the mAb assay and a comparison wasmade between each of the anti-FLC mAbs, and to Freelite™.All samples were pre-screened for paraproteins by routineserum IFE analysis. IFE revealed that one sample had an IgG λparaprotein with λ FLC, and the sample was excluded from

FLC
mAb assay (g/L)0.1 1 10 100 1000
Sca
nnin
g ur
ine
prot
ein
elec
trop
hore
sis
(g/L
)
0.1
1
10
100
1000
R2 = 0.85895% C.I.
FLC
mAb assay (g/L)0.1 1 10 100 1000
Sca
nnin
g ur
ine
prot
ein
elec
trop
hore
sis
(g/L
)
0.1
1
10
100
1000
R2 = 0.80195% C.I.
κ
λ
Fig. 3. Representative data from 12 concentrated urines containing κ FLCparaproteins (top) and 9 concentrated urines containing λ FLC paraproteins(bottom), quantitated on the mAb assay and by densitometric scanningof urine protein electrophoresis. For each sample on the mAb assay, themaximum value obtained by either BUCIS 01 or BUCIS 04 was used forthe for κ FLC result, and the maximum value obtained by either BUCIS 03or BUCIS 09 was used for the λ FLC result. Linear regression (R2) and 95%confidence intervals are displayed in each figure.
7J.P. Campbell et al. / Journal of Immunological Methods 391 (2013) 1–13
further analyses; both the mAb assay and Freelite™ assaysidentified elevated λ FLC and an abnormal κ:λ FLC ratio inthis sample. This finding accords with expected prevalence ofMGUS in the general population (Kyle et al., 2006). Referenceranges for each anti-FLC mAb were similar to Freelite™ forthe remaining 249 samples (Fig. 2). The two anti-κmAbs alsohad similar reference ranges to each other, with BUCIS 04having a slightly broader reference range than BUCIS 01(BUCIS 01: 6.46–15.10 mg/L; BUCIS 04: 4.35–19.44 mg/L).The two anti-λmAbs were also similar, with BUCIS 03 havinga slightly broader reference range than BUCIS 09 (BUCIS 03:4.13–19.18 mg/L; BUCIS 09: 5.19–18.87 mg/L). In terms ofthe κ:λ ratio, the mAb assay had a similar range to Freelite™(mAb assay: 0.40–1.59; Freelite™: 0.58–1.76).
3.2. Assay specificity — serum samples
1000 consecutive serum samples, selected as they arrivedin the CIS for routine serum FLC analysis, were analysed usingthe mAb assay and Freelite™ (Fig. 4). Overall, each anti-FLCmAb showed good or excellent Spearman correlations withFreelite™: anti-κ BUCIS 01 (R2 = 0.79, 95% CI 0.76–0.81),anti-κ BUCIS 04 (R2 = 0.92, 95% CI 0.91–0.93), anti-λ BUCIS03 (R2 = 0.87, 95% CI 0.85–0.88) and anti-λ BUCIS 09 (R2 =0.85, 95% CI 0.84–0.87). Compared to each other, BUCIS 01and BUCIS 04 mAbs provided a good correlation for κ FLC(R2 = 0.78, 95% CI 0.76–0.80) and BUCIS 03 and BUCIS 09mAbs provided an excellent correlation for λ FLC (R2 = 0.97,95% CI 0.97–0.98). In terms of the κ:λ ratio (Fig. 5), bothFreelite™ and the mAb assay demonstrated a good correla-tion (R2 = 0.85, 95% CI 0.83–0.86).
Individual results from each assay were then comparedto identify any discrepancies between the mAb assay andFreelite™. For this initial clinical validation of the mAb assay,the mean κ FLC results generated by BUCIS 01 and BUCIS 04mAbs were used, and the λ FLC results obtained by BUCIS 03and BUCIS 09 mAbs were used. From this process, 61discrepancies were identified (6.1% of total samples tested),of which there were 41 discrepant κ FLC results and 20discrepant λ FLC results. Further investigations on thesediscrepant samples revealed that elevated levels of FLC, or anelevated FLC ratio, on the Freelite™ assay was not supportedby the mAb assay or serum IFE, and may have reflectedcross-reactivity on the Freelite™ assay with whole immuno-globulin paraprotein or hindrance from the Freelite ‘gaps’(see Fig. 6); for detailed assessment, see supplementaryresults. Results from the mAb assay were supported by serumIFE, as well as investigations onmatched urine and analysis ofpatient history, where available. In summary, results indi-cated that all serum samples with abnormal FLC levels, or anabnormal κ:λ ratio, were detected by the mAb assay from1000 consecutive serum samples. Further investigationsrevealed that both anti-κ FLC mAbs (BUCIS 01 and BUCIS04) were diagnostically similar, and either could be used toindicate a sample containing an abnormal κ FLC level.Similarly, both anti-λ FLC mAbs (BUCIS 03 and BUCIS 09)were diagnostically similar, and either could be used toindicate a sample containing an abnormal λ FLC level.
3.3. Assay specificity — urine samples
Results from 13,090 urine samples analysed routinely bythe CIS on the mAb assay and on urine IFE were compared toassess the specificity and sensitivity of the mAbs at detectingFLC in urine. Urine IFE was conducted using antisera against κand λ LCs that did not distinguish between free and boundLC. Of the 13,090 urines, 12,242 samples were from patientswho had a known serum paraprotein, 641 samples had noparaprotein present, and 207 had an unknown admissiondiagnosis. After initial comparisons between the mAb assayand IFE, 199 discrepancies were identified (1.52% of allsamples tested). 143 of these samples had polyclonal LC byIFE but b10 mg/L of the relevant FLC on the mAb assay. Theother 56 samples had monoclonal LC present in the urine, butb10 mg/L of the relevant FLC on the mAb assay. Thesesamples were re-tested on the mAb assay to exclude the

BUCIS 01 κ FLC (mg/L) 10
-110
010
110
210
310
410
5
Fre
elite
κ F
LC (
mg/
L)
10-1
100
101
102
103
104
105
High ratioNormal ratioLow ratio
High ratioNormal ratioLow ratio
High ratioNormal ratioLow ratio
High ratioNormal ratioLow ratio
High ratioNormal ratioLow ratio
High ratioNormal ratioLow ratio
Fre
elite
κ F
LC (
mg/
L)
10-1
100
101
102
103
104
105
BUCIS 04 κ FLC (mg/L) 10
-110
010
110
210
310
410
5
BUCIS 04 κ FLC (mg/L) 10
-110
010
110
210
310
410
5
BU
CIS
01
k F
LC (
mg/
L)B
UC
IS 0
3 λ
FLC
(m
g/L)
10-1
100
101
102
103
104
105F
reel
ite λ
FLC
(m
g/L)
10-1
100
101
102
103
104
105
BUCIS 03 λ FLC (mg/L) 10
-110
010
110
210
310
410
5
BUCIS 09 λ FLC (mg/L) 10
-110
010
110
210
310
410
5
BUCIS 09 λ FLC (mg/L) 10
-110
010
110
210
310
410
5
Fre
elite
λ F
LC (
mg/
L)
10-1
100
101
102
103
104
105
10-1
100
101
102
103
104
105
Fig. 4. 1000 consecutive routine clinical serum samples analysed for κ and λ FLCs on the mAb assay and Freelite™. Results comparing the anti-κ FLC mAbs(BUCIS 01 and BUCIS 04) and Freelite™ κ FLC are located at the top, and located at the bottom are the results obtained by the anti-λ FLC mAbs (BUCIS 03 andBUCIS 09) and Freelite™ λ FLC. In each of the figures above, the results were trichotomised into groups based on whether the sample had a high, normal or lowκ:λ FLC ratio. For these assessments, the κ:λ FLC ratio was generated by the results obtained by BUCIS 04 and BUCIS 09 and the ratio boundaries were set using the95% reference ranges from Fig. 2. Lines on each figure represent the 95% reference ranges for each of the anti-FLC mAbs and Freelite™, also derived from the 95%reference ranges in Fig. 2.
8 J.P. Campbell et al. / Journal of Immunological Methods 391 (2013) 1–13
possibility of user error, and all samples were re-analysed byfull IFE analysis to distinguish between FLC and LC bound towhole immunoglobulin. Results from this process revealedthat all samples with FLC detected by IFE were also detectedby the mAb assay. Complementary analyses of matchedserums and patient history also supported these findings. Insummary, the mAbs detected FLC in all 2995 urine samplescontaining monoclonal κ FLC and all 1180 urine samplescontaining monoclonal λ FLC, as detected by IFE specificfor FLC.
3.4. Assay dynamics
Assay imprecision, or CV%, was measured in pools of serumsampleswith low,mediumand high κ orλ FLC levels. For κ FLC,at 8.00 mg/L, 16.85 mg/L, and 238.94 mg/L, the intra-assayCV% was 4.46%, 4.69%, and 4.85%, respectively; and the inter-assay CV% was 6.45%, 6.50%, and 5.31%, respectively. For λ FLC,at 7.27 mg/L, 10.38 mg/L, and 91.13 mg/L, the intra-assay CV%was 5.69%, 4.86%, and 2.84%, respectively; and the inter-assayCV% was 9.19%, 7.99%, and 6.96%, respectively.
Assay batch-to-batch variability was assessed by analysing50 serum samples with varying FLC levels (κ range 3.42–329.88 mg/L; λ range 1.09–130.51 mg/L) and the results are
displayed in Fig. 7. All sampleswere analysed once, on separateassay days, using three consecutive batches of anti-FLC mAbs,calibrators and other appropriate assay reagents. Passing andBablok regression analysis gave slopes between 0.93–1.01 for κFLC and 0.86–1.05 for λ FLC. Spearman correlation coefficientsfor κ FLC were ≥0.99 and for λ FLC were ≥0.96.
Representative assay linearity results are displayed inFig. 8. Serum samples containing high levels of either κ(581.36, 416.37, and 256.97 mg/L) or λ (485.04, 379.41and370.56 mg/L) FLC paraproteins were serially diluted in assaybuffer. Results indicated that assay linearity was maintainedon the monoclonal κ FLC samples between 7.61 mg/L and568.01 mg/L, 1.94 mg/L and 410.36 mg/L, and, 6.32 mg/L and260.78 mg/L, respectively. For the λmonoclonal FLC samples,linearity was maintained between 1.38 mg/L and 476.1 mg/L,1.78 mg/L and 361.72 mg/L, and, 4.45 mg/L and 381.62 mg/L,respectively. For κ FLC, below 10 mg/L nomore than 1.45 mg/Lnon-linearity was found, and above 10 mg/L no more than16.37% non-linearity was observed. For λ FLC, below 10 mg/Lno more than 2.03 mg/L non-linearity was found, and above10 mg/L no more than 19.0% non-linearity was found.
The assay limit of detection for each mAb was assessed bymeasuring each against a κ or λ BJ protein, firstly mixed withnormal serum, and then serially diluted in assay buffer. Limit

mAb assay κ:λ FLC ratio
-6 -5 -4 -3 -2 -1 0 1 2 3 4 5 6
Fre
elite
κ :λ
FLC
rat
io
10
-5
-4
-3
-2
-1
0
1
2
3
4
5
6
R2 = 0.830Prediction Intervals
10-6 10-5 10-4 10-3 10-2 10-1 100 101 102 103 104 105 10610-6
10-5
10-4
10-3
10-2
10-1
100
101
102
103
104
105
106
Fig. 5. Illustrated are the κ:λ FLC ratio results from 1000 consecutive routine clinical serum samples analysed on Freelite™ and the mAb assay. For the mAb assayresults, for each sample, the κ:λ FLC ratio was generated by using the κ FLC result obtained by BUCIS 04 and the λ FLC result obtained by BUCIS 09. Linearregression (R2) and prediction intervals are displayed as dashed and dotted lines. Intact lines represent the reference ranges for each assay derived from theanalysis 249 plasma samples from healthy donors.
9J.P. Campbell et al. / Journal of Immunological Methods 391 (2013) 1–13
of detection for BUCIS 01 was 0.63 mg/L, BUCIS 04 was0.86 mg/L, BUCIS 03 was 0.72 mg/L, and BUCIS 09 was0.52 mg/L.
Assay interference tests showed minimal assay cross-reactivity to alternate κ or λ FLC or intact immunoglobulins,bilirubin, haemoglobin, cholesterol or triglyceride (Fig. 9,in supplementary data). Results demonstrated that no morethan a median 2.7 mg/L change was observed for the anti-κFLC mAbs, and no more than a median 3.7 mg/L change forthe anti-λ FLC mAbs.
4. Discussion
This study describes the development of four mouseanti-human κ:λ FLC mAbs and their initial validation in amulti-plex Luminex® immunoassay. Each of the anti-FLCmAbs exhibited: excellent sensitivity (b1 mg/L); low batchvariation; sustained assay linearity; specificity and minimalcross-reactivity to bound LC, or alternate FLC isotype. Each ofthe mAbs provided good quantitative concordance with theFreelite™ assay in the measurement of polyclonal FLC inplasma from 249 healthy donors, and FLC levels in serumfrom 1000 consecutive samples. Specificity and sensitivitywere further illustrated in the measurement of FLC in 13,090urine samples tested for BJ proteins. In this set of urinesamples the mAbs detected FLC in all 2995 samples containingmonoclonal κ FLC and all 1180 samples containingmonoclonalλ FLC, as detected by IFE. This is important because previouslydescribedmAbs against FLC have not been shown to detect FLC
from substantially all neoplastic plasma cell clones (Abe et al.,1993, 1998; Nakano and Nagata, 2003; Davern et al., 2008;te Velthuis et al., 2011; Hoedemakers et al., 2012); many of themAbs that we have produced against FLC do not bind FLC fromup to a quarter of individual myeloma patients. The extent ofFLC structural diversity is reflected in the LC gene structure.Thus, the κ immunoglobulin gene family contains 81 geneslocated on chromosome 2, of which, at least 40 functionalgenes are responsible for V region variability, giving rise toat least 4 major V region types (Vκ1, Vκ2, Vκ3, and Vκ4)(Sitnikova and Nei, 1998; Davern et al., 2008). Further, thereare 5 genes responsible for encoding the J region, and 1constant region gene expressing 1 of 3 allotypic forms (κm1,κm2, κm3) (Sitnikova andNei, 1998; Davern et al., 2008; Jefferisand Lefranc, 2009). Theλ immunoglobulin gene family appearsto support more diversity, in that there are at least 40functional genes responsible for V region variability that resultsin at least 5 major V region types (Vλ1, Vλ2, Vλ3, Vλ6, andVλ8). Further, there are at least 5 genes responsible forencoding the J region, and up to 7 genes for the C region thatgives rise to at least 3 C region isotypes (Cλ1, Cλ2/3, Cλ7)(Solomon andWeiss, 1995;Davern et al., 2008). FLC diversity isextended by somatic mutations in the encoding genes andpost-translational modifications of FLC. Given this multiplicityof human FLC structures, it is not surprising that it is difficult toproduce mAbs that would detect the FLC from substantially allpatients and neoplastic plasma cell clones. To be clinicallyreliable any new assay for FLC should be tested against a largenumber of serum and urine samples to show that themAbs are

Freelite κ FLC (mg/L)10-1 100 10 1 10 2 103 104 105
Fre
elite
λ F
LC (
mg/
L)
10 -1
10 0
10 1
10 2
10 3
10 4
10 5
High ratioNormal ratioLow ratio
mAb assay κ FLC (mg/L)
mA
b as
say
λ F
LC (
mg/
L)
High ratioNormal ratioLow ratio
10-1 100 10 1 10 2 103 104 10510 -1
10 0
10 1
10 2
10 3
10 4
10 5
Fig. 6. κ and λ FLC levels in 1000 consecutive routine clinical serum samples analysed on the Freelite™ assay (top), with the so-called ‘gaps’ in Freelite™ quantitation ofFLC clearly visible (Bradwell, 2008). Illustrated, bottom, are results from the same consecutive samples generated by the mAb assay using the BUCIS 04 (anti-κ FLC)and BUCIS 09 (anti-λ FLC) mAbs. No quantitative ‘gaps’ were observed in the results generated by these mAbs, or the other BUCIS 01 and BUCIS 03 anti-FLC mAbs(not illustrated). In both figures above, the results were trichotomised into groups based onwhether the sample had a high, normal or low κ:λ FLC ratio generated byBUCIS 04 and BUCIS 09; for this calculation, the ratio limits were determined using the BUCIS 04 and BUCIS 09 95% reference ranges in Fig. 2.
10 J.P. Campbell et al. / Journal of Immunological Methods 391 (2013) 1–13

k FLC Batch 1 (mg/L)1 10 100 1000
κ F
LC B
atch
es 2
-3 (
mg/
L)
1
10
100
1000
Batch 1 vs Batch 2Batch 1 vs Batch 3
λ FLC batch 1 (mg/L)1 10 100 1000
λ F
LC b
atch
es 2
-3 (
mg/
L)
1
10
100
1000
Batch 1 vs Batch 2Batch 1 vs Batch 3
Fig. 7. Batch-to-batch variation from three independent lots of anti-FLC κmAbs(top) and λ mAbs (bottom) and other assay materials, when measuring 50serum samples containing varying levels of FLC.
Concentration %0 20 40 60 80 100
κ F
LC (
mg/
L)
0
100
200
300
400
500
λ F
LC (
mg/
L)
0
100
200
300
400
500
Concentration %0 20 40 60 80 100
Fig. 8. Linearity examples of serial dilutions of serum containing either a κFLC paraprotein (top) or λ FLC paraprotein (bottom); samples were seriallydiluted 2-fold in assay buffer. In each figure, comparative linear (predicted)values are represented by a dashed line and the acquired (non-linear)titrations are represented by a black continuous line.
11J.P. Campbell et al. / Journal of Immunological Methods 391 (2013) 1–13
at least close to the ideal of detecting FLC from all patients andneoplastic plasma cell clones.
In plasma samples containing normal polyclonal FLC,obtained from healthy donors, each of the mAbs providedsimilar quantitation of absolute FLC levels. These sampleswere obtained from UK blood donors, which include personsup to the age of 65 years. It is likely that some of these donorshad MGUS, and indeed, one donor found to have an abnormalFLC ratio detected by both the mAb assay and Freelite™, hada 30 g/L IgG λ paraprotein. Similarly, we cannot excludethe possibility that some donors had a degree of renalimpairment. For both polyclonal and monoclonal λ FLC in athousand consecutive serum samples, the two anti-λ FLCmAbs exhibited excellent correlations with each other, anddisplayed good clinical concordance with Freelite™. Thediversity in FLC repertoire may explain the more divergentcorrelations demonstrated in this study between the mAbassay and Freelite™ for highly elevated monoclonal λ FLC
paraproteins (see Fig. 4). Similarly, the two anti-κ FLC mAbsdisplayed good clinical concordance with each other; therewere some quantitative differences in samples with mono-clonal FLC but each mAb identified an abnormal level ofthe relevant FLC, as well as an abnormal κ:λ FLC ratio in eachof these samples. In addition, each mAb displayed goodconcordance with Freelite™.
The development of precise anti-FLC mAbs, as shown inthis study, enables diversification away from existing assayplatforms and may lead to improvements in FLC assay design.Current commercial tests, using turbidimetric and nephelo-metric formats (Bradwell et al., 2001) have a number of wellobserved limitations. Firstly, these systems are reliant ona separate test for each κ and λ FLC measurement. Thisintroduces inter-test variability and reduces the precision ofthe κ:λ ratio. Simultaneous measurement of both κ and λFLCs in our assay removes some of this inter-test variabilityand should thus provide a more reliable measure of the κ:λratio. To our knowledge, this is the first assay to adopt thisconfiguration. From a practical perspective this format is alsobeneficial as a single test because it is more time and resourceefficient, and the sample volume required (b10 μL) is muchlower than typical turbidimetric and nephelometric re-quirements, thus preserving stock sample volume. A second

12 J.P. Campbell et al. / Journal of Immunological Methods 391 (2013) 1–13
problem with the format of existing serum FLC tests isknown as antigen excess or a ‘hook-effect’ and has beendocumented elsewhere (Daval et al., 2007; Levinson, 2010a).This phenomenon occurs when high levels of FLC analyteexceed the number of available antibody binding sites thusreducing or eliminating FLC-antibody aggregates, resulting in afalse-negative signal output. Use of a competitive inhibitionformat in our assay overcomes this problem and such animprovement is likely to improve the reliability of patientdiagnosis and monitoring. Indeed, we found no instanceswhere the mAbs ‘missed’ elevated FLC above 100 mg/L(sensitivity of serum IFE), indicating that there were noinstances of antigen excess using the mAb assay in serum orin the large numbers of urine samples tested. Our assay alsoprovides a larger dynamic range, better sensitivity, andavoidance of ‘gaps’ seen in the current serum FLC assay inFigs. 4 and 6, and discussed elsewhere (Bradwell, 2008).
In conclusion, we have developed a new method ofmeasuring urine and serum FLC using anti-κ and anti-λ FLCmAbs. This method offers improved sensitivity and reliabilityover existing methods that rely on sheep polyclonal antisera.Further, the mAbs used in this study demonstrated excellentspecificity and identified FLC in 13,090 urine samples testedfor the presence of BJ proteins, normal and abnormal FLClevels in 1000 consecutive serums samples, and normal levelsof polyclonal FLC from healthy donors. This analysis servedas an initial clinical assessment of the mAbs, and given theeffective specificity displayed, further assessment of patientswith known multiple myeloma, light chain only myeloma,non-secretory myeloma and other FLC-relevant disorders isnow warranted. Utilisation of these mAbs in other assayplatforms should also be investigated.
Supplementary data to this article can be found online athttp://dx.doi.org/10.1016/j.jim.2013.01.014.
References
Abe, M., Goto, T., Kennel, S.J., Wolfenbarger, D., Macy, S.D., Weiss, D.T.,Solomon, A., 1993. Production and immunodiagnostic applicationsof antihuman light chain monoclonal antibodies. Am. J. Clin. Pathol.100, 67.
Abe, M., Goto, T., Kosaka, M., Wolfenbarger, D., Weiss, D.T., Solomon, A.,1998. Differences in kappa to lambda (kappa:lambda) ratios of serumand urinary free light chains. Clin. Exp. Immunol. 111, 457.
Abraham, R.S., Charlesworth, M.C., Owen, B.A., Benson, L.M., Katzmann, J.A.,Reeder, C.B., Kyle, R.A., 2002. Trimolecular complexes of lambda lightchain dimers in serum of a patient with multiple myeloma. Clin. Chem.48, 1805.
Bergen III, H.R., Abraham, R.S., Johnson, K.L., Bradwell, A.R., Naylor, S., 2004.Characterization of amyloidogenic immunoglobulin light chains directlyfrom serum by on-line immunoaffinity isolation. Biomed. Chromatogr.18, 191.
Bradwell, A.R., 2008. Serum Free Light Chain Analysis (Plus Hevylite).Binding Site, Birmingham (www.wikilite.com).
Bradwell, A.R., Carr-Smith, H.D., Mead, G.P., Tang, L.X., Showell, P.J., Drayson,M.T., Drew, R., 2001. Highly sensitive, automated immunoassay forimmunoglobulin free light chains in serum and urine. Clin. Chem. 47,673.
Bradwell, A.R., Carr-Smith, H.D., Mead, G.P., Harvey, T.C., Drayson, M.T., 2003.Serum test for assessment of patients with Bence Jones myeloma. Lancet361, 489.
Daval, S., Tridon, A., Mazeron, N., Ristori, J.M., Evrard, B., 2007. Risk of antigenexcess in serum free light chain measurements. Clin. Chem. 53, 1985.
Davern, S., Tang, L.X., Williams, T.K., Macy, S.D., Wall, J.S., Weiss, D.T.,Solomon, A., 2008. Immunodiagnostic capabilities of anti-free immuno-globulin light chain monoclonal antibodies. Am. J. Clin. Pathol. 130, 702.
Dispenzieri, A., Kyle, R., Merlini, G., Miguel, J.S., Ludwig, H., Hajek, R., Palumbo,A., Jagannath, S., Blade, J., Lonial, S., Dimopoulos, M., Comenzo, R., Einsele,
H., Barlogie, B., Anderson, K., Gertz, M., Harousseau, J.L., Attal, M., Tosi, P.,Sonneveld, P., Boccadoro, M., Morgan, G., Richardson, P., Sezer, O., Mateos,M.V., Cavo, M., Joshua, D., Turesson, I., Chen, W., Shimizu, K., Powles, R.,Rajkumar, S.V., Durie, B.G., 2009. International Myeloma Working Groupguidelines for serum-free light chain analysis in multiple myeloma andrelated disorders. Leukemia 23, 215.
Dispenzieri, A., Katzmann, J.A., Kyle, R.A., Larson, D.R., Therneau, T.M., Colby,C.L., Clark, R.J., Mead, G.P., Kumar, S., Melton III, L.J., Rajkumar, S.V., 2012.Use of nonclonal serum immunoglobulin free light chains to predictoverall survival in the general population. Mayo Clin. Proc. 87, 517.
Drayson, M.T., 2012. Using single protein biomarkers to predict health anddisease in diverse patient populations: a new role for assessment ofimmunoglobulin free light chains. Mayo Clin. Proc. 87, 505.
Drayson, M., Carr-Smith, H., 2012. Clinical comparison of new monoclonalantibody-based nephelometric assays for free light chain kappa andlambda to polyclonal antibody-based assays and immunofixationelectrophoresis. Clin. Chem. Lab. Med. 50, 587.
Drayson, M., Tang, L.X., Drew, R., Mead, G.P., Carr-Smith, H., Bradwell, A.R.,2001. Serum free light-chainmeasurements for identifying andmonitoringpatients with nonsecretory multiple myeloma. Blood 97, 2900.
Galfre, G., Milstein, C., 1981. Preparation of monoclonal antibodies: strategiesand procedures. Methods Enzymol. 73, 3.
Hay, F.C., Westwood, O.M.R., Nelson, P.N., Hudson, L., 2002. Practical Immunol-ogy. Blackwell Science, Oxford.
Hoedemakers, R.M., Pruijt, J.F., Hol, S., Teunissen, E., Martens, H., Stam, P.,Melsert, R., Te Velthuis, H., 2012. Clinical comparison of new monoclonalantibody-based nephelometric assays for free light chain kappa andlambda to polyclonal antibody-based assays and immunofixation electro-phoresis. Clin. Chem. Lab. Med. 50, 489.
Hutchison, C.A., Plant, T., Drayson, M., Cockwell, P., Kountouri, M., Basnayake,K., Harding, S., Bradwell, A.R., Mead, G., 2008. Serum free light chainmeasurement aids the diagnosis of myeloma in patients with severerenal failure. BMC Nephrol. 9, 11.
Hutchison, C.A., Cockwell, P., Cook, M., 2012. Diagnostic accuracy ofmonoclonal antibody based serum immunoglobulin free light chainimmunoassays in myeloma cast nephropathy. BMC Clin. Pathol. 12, 12.
Jefferis, R., Lefranc, M.P., 2009. Human immunoglobulin allotypes: possibleimplications for immunogenicity. MAbs 1, 332.
Katzmann, J.A., Clark, R.J., Abraham, R.S., Bryant, S., Lymp, J.F., Bradwell, A.R.,Kyle, R.A., 2002. Serum reference intervals and diagnostic ranges for freekappa and free lambda immunoglobulin light chains: relative sensitivityfor detection of monoclonal light chains. Clin. Chem. 48, 1437.
Krouwer, J.S., Tholen, D.W., Garber, C.C., Goldschmidt, H., Kroll, M.H., Linnet, K.,Meier, K., Robinowitz, M., Kennedy, J.W., 2010. Method Comparison andBias Estimation Using Patient Samples; Approved Guideline — SecondEdition, 2nd edition. CLSI, Wayne, Pa (Vol.).
Kyle, R.A., Therneau, T.M., Rajkumar, S.V., Larson, D.R., Plevak, M.F., Offord,J.R., Dispenzieri, A., Katzmann, J.A., Melton III, L.J., 2006. Prevalence ofmonoclonal gammopathy of undetermined significance. N. Engl. J. Med.354, 1362.
Lachmann, H.J., Gallimore, R., Gillmore, J.D., Carr-Smith, H.D., Bradwell, A.R.,Pepys, M.B., Hawkins, P.N., 2003. Outcome in systemic AL amyloidosis inrelation to changes in concentration of circulating free immunoglobulinlight chains following chemotherapy. Br. J. Haematol. 122, 78.
Levinson, S.S., 2010a. Hook effect with lambda free light chain in serum freelight chain assay. Clin. Chim. Acta 411, 1834.
Levinson, S.S., 2010b. Polyclonal free light chain of Ig may interfere withinterpretation of monoclonal free light chain kappa/lambda ratio. Ann.Clin. Lab. Sci. 40, 348.
Ling, N.R., Bishop, S., Jefferis, 1977. Use of antibody-coated red cells for thesensitive detection of antigen and in rosette tests for cells bearingsurface immunoglobulins. J. Immunol. Methods 15, 279.
McEnroe, R.J., Burritt, M.F., Powers, D.M., Rheinheimer, D.W., Wallace, B.H.,2005. Interference Testing in Clinical Chemistry; Approved Guideline,Second edition. CLSI, Wayne, Pa.
Murata, K., Clark, R.J., Lockington, K.S., Tostrud, L.J., Greipp, P.R., Katzmann,J.A., 2010. Sharply increased serum free light-chain concentrations aftertreatment for multiple myeloma. Clin. Chem. 56, 16.
Nakano, T., Nagata, A., 2003. ELISAs for free light chains of human immuno-globulins usingmonoclonal antibodies: comparison of their specificitywithavailable polyclonal antibodies. J. Immunol. Methods 275, 9.
Palladini, G., Russo, P., Bosoni, T., Verga, L., Sarais, G., Lavatelli, F., Nuvolone,M., Obici, L., Casarini, S., Donadei, S., Albertini, R., Righetti, G., Marini,M., Graziani, M.S., Melzi D'Eril, G.V., Moratti, R., Merlini, G., 2009.Identification of amyloidogenic light chains requires the combinationof serum-free light chain assay with immunofixation of serum andurine. Clin. Chem. 55, 499.
Rajkumar, S.V., Kyle, R.A., Therneau, T.M., Clark, R.J., Bradwell, A.R., MeltonIII, L.J., Larson, D.R., Plevak, M.F., Katzmann, J.A., 2004. Presence ofmonoclonal free light chains in the serum predicts risk of progression

13J.P. Campbell et al. / Journal of Immunological Methods 391 (2013) 1–13
in monoclonal gammopathy of undetermined significance. Br. J. Haematol.127, 308.
Sitnikova, T., Nei, M., 1998. Evolution of immunoglobulin kappa chainvariable region genes in vertebrates. Mol. Biol. Evol. 15, 50.
Solomon, A., Weiss, D.T., 1995. Structural and functional properties of humanlambda-light-chain variable-region subgroups. Clin. Diagn. Lab. Immunol.2, 387.
Tate, J.R., Mollee, P., Dimeski, G., Carter, A.C., Gill, D., 2007. Analyticalperformance of serum free light-chain assay during monitoring ofpatients with monoclonal light-chain diseases. Clin. Chim. Acta 376, 30.
Tate, J.R., Bazeley, S., Sykes, S., Mollee, P., 2009. Quantitative serum free lightchain assay—analytical issues. Clin. Biochem. Rev. 30, 131.
te Velthuis, H., Knop, I., Stam, P., van den Broek, M., Bos, H.K., Hol, S.,Teunissen, E., Fischedick, K.S., Althaus, H., Schmidt, B., Wagner, C.,Melsert, R., 2011. N latex FLC — new monoclonal high-performanceassays for the determination of free light chain kappa and lambda. Clin.Chem. Lab. Med. 49, 1323.
Tholen, D.W., Kallner, A., Kennedy, J.W., Krouwer, J.S., Meier, K., 2004.Evaluation of Precision Performance of Quantitative MeasurementMethods: Approved Guideline. CLSI, Wayne, Pa.
Waldmann, T.A., Strober, W., Mogielnicki, R.P., 1972. The renal handling oflowmolecular weight proteins. II. Disorders of serum protein catabolismin patients with tubular proteinuria, the nephrotic syndrome, or uremia.J. Clin. Invest. 51, 2162.