Journal of Experimental Psychology: Animal...
27
Journal of Experimental Psychology: Animal Behavior Processes VOL. 7, No. 3 JULY 1981 A Model of Detection and Decision Processes During Matching to Sample by Pigeons: Performance With 88 Different Wavelengths in Delayed and Simultaneous Matching Tasks Anthony A. Wright and Stephen F. Sands University of Texas Health Science Center at Houston Graduate School of Biomedical Sciences and Department of Ophthalmology Separate groups of pigeons matched wavelength stimuli in three-key delayed and simultaneous matching-to-sample tasks in which samples and comparisons could be viewed only when the birds positioned themselves directly in front of the keys. The birds' positioning movements indicated that they frequently chose a com- parison without ever seeing its alternative. These observational data were used to generate a theory of matching behavior based on the discriminability of the stimuli and decision processes (Markov) governing choice responding. "Match" criteria are proposed whereby comparison stimuli are accepted as matches to the sample if they meet these criteria. Comparisons not meeting these criteria are rejected as matches and produce observational switches to the alternative com- parison where the decision process is repeated. Match criteria were shown to be manipulable and were made stricter by requiring the pigeons to make more difficult discriminations and thereby notice more subtle hue differences. Tests with two nonmatching comparison stimuli demonstrated that in unusual situa- tions in which the mismatch is great, the pigeons relaxed their criteria during the trial. Matching to sample is one of a number Maki, Riley, & Leith, 1976; Roberts & of conditional discrimination procedures Grant, 1978), and color perception (Wright widely used in the study of short-term mem- & Gumming, 1971). Its popularity stems in ory (e.g., D'Amato, 1973; Etkin, 1972; part from its procedural simplicity. Pigeons, Grant & Roberts, 1976; Maki, Moe, & Bier- for example, peck a sample stimulus and ley, 1977; Roberts, 1972; Roberts & Grant, then must choose between two comparison 1976; Shimp & Moffltt, 1977; Zentall, stimuli. If they peck the one that matches 1973), attention (e.g., Maki & Leith, 1973; the sample stimulus, then they typically are rewarded. Pigeons readily learn in this task, but they do not learn any general matching This research was supported by National Eye Insti- concept (Farthing & Opuda, 1974; Cum- tute Grant EY 01256 and National Science Foundation m i n g, Berryman, & Cohen, 1965). This is Grant BNS 78-97253 to A^ A. Wright. We thank Judy somewhat surpr isi n g ( since they do readily Cornish for her superb technical assistance in conduct- r , ° . .i ^- ing the experiments, and P. J.Urcuioli and H.C.San- J orm general concepts in Other settings tiago for their thoughtful comments on the manuscript. (Herrnstein, Loveland, & Cable, 1976; Lu- Stephen F. Sands is now at the University of Texas, bow, 1974; Malott & Siddall, 1972; Morgan, E1 ,T aso ' r • u , J u u Fitch > Holman, & Lea, 1976; Pietrewicz Requests for reprints should be sent to Anthony A. e -i/ n -\ \c\i-i D««I s t A \ni\-o Wright, Sensory Sciences Center, P.O. Box 20708, * ^"^'J 97 . 75 ? ™}* & ^ ande [. 1971 ! £• Room 7.238, University of Texas Health Science Center Siegel & Honig, 1970). Thus, what are the at Houston, Houston, Texas 77025. strategies that pigeons use in the matching Copyright 1981 by the American Psychological Association, Inc. 0097-7403/81/0703-019IS00.75 191
Transcript of Journal of Experimental Psychology: Animal...

Journal of Experimental Psychology:Animal Behavior Processes
VOL. 7, No. 3 JULY 1981
A Model of Detection and Decision ProcessesDuring Matching to Sample by Pigeons:
Performance With 88 Different Wavelengthsin Delayed and Simultaneous Matching Tasks
Anthony A. Wright and Stephen F. SandsUniversity of Texas Health Science Center at Houston
Graduate School of Biomedical Sciences and Department of Ophthalmology
Separate groups of pigeons matched wavelength stimuli in three-key delayed andsimultaneous matching-to-sample tasks in which samples and comparisons couldbe viewed only when the birds positioned themselves directly in front of the keys.The birds' positioning movements indicated that they frequently chose a com-parison without ever seeing its alternative. These observational data were usedto generate a theory of matching behavior based on the discriminability of thestimuli and decision processes (Markov) governing choice responding. "Match"criteria are proposed whereby comparison stimuli are accepted as matches to thesample if they meet these criteria. Comparisons not meeting these criteria arerejected as matches and produce observational switches to the alternative com-parison where the decision process is repeated. Match criteria were shown to bemanipulable and were made stricter by requiring the pigeons to make moredifficult discriminations and thereby notice more subtle hue differences. Testswith two nonmatching comparison stimuli demonstrated that in unusual situa-tions in which the mismatch is great, the pigeons relaxed their criteria duringthe trial.
Matching to sample is one of a number Maki, Riley, & Leith, 1976; Roberts &of conditional discrimination procedures Grant, 1978), and color perception (Wrightwidely used in the study of short-term mem- & Gumming, 1971). Its popularity stems inory (e.g., D'Amato, 1973; Etkin, 1972; part from its procedural simplicity. Pigeons,Grant & Roberts, 1976; Maki, Moe, & Bier- for example, peck a sample stimulus andley, 1977; Roberts, 1972; Roberts & Grant, then must choose between two comparison1976; Shimp & Moffltt, 1977; Zentall, stimuli. If they peck the one that matches1973), attention (e.g., Maki & Leith, 1973; the sample stimulus, then they typically are
rewarded. Pigeons readily learn in this task,but they do not learn any general matching
This research was supported by National Eye Insti- concept (Farthing & Opuda, 1974; Cum-tute Grant EY 01256 and National Science Foundation ming, Berryman, & Cohen, 1965). This isGrant BNS 78-97253 to A^ A. Wright. We thank Judy somewhat surprising( since they do readilyCornish for her superb technical assistance in conduct- r , ° . .i ^-ing the experiments, and P. J.Urcuioli and H.C.San- Jorm general concepts in Other settingstiago for their thoughtful comments on the manuscript. (Herrnstein, Loveland, & Cable, 1976; Lu-
Stephen F. Sands is now at the University of Texas, bow, 1974; Malott & Siddall, 1972; Morgan,E1,Taso' r • u ,J u u Fitch> Holman, & Lea, 1976; PietrewiczRequests for reprints should be sent to Anthony A. e -i/n-\ \c\i-i D««I s t A \ni\-oWright, Sensory Sciences Center, P.O. Box 20708, * ^" '̂J97.75 ?™}* & ^ande[. 1971! £•Room 7.238, University of Texas Health Science Center Siegel & Honig, 1970). Thus, what are theat Houston, Houston, Texas 77025. strategies that pigeons use in the matching
Copyright 1981 by the American Psychological Association, Inc. 0097-7403/81/0703-019IS00.75
191

192 ANTHONY A. WRIGHT AND STEPHEN F. SANDS
task, and how do they account for the lackof a matching concept?
Premack (1978) contended that pigeonsrespond preferentially to certain absolutestimulus characteristics; they always choosethe familiar comparison stimulus instead ofthe novel one irrespective of the sample stim-ulus. Carter and Eckerman (1975), on theother hand, contended that pigeons respondto the sample-comparison relation and onlyspecific "if . . . then . . . " relations arelearned. Gumming et al. (1965) previouslyhad made a proposal similar to that of Carterand Eckerman, but they hypothesized theadded feature that pigeons coded the samplestimulus and chose comparison stimuli onthe basis of code-comparison relations,transfer failure resulting from the pigeons'inability to code the sample stimulus.
Parallels can be drawn between attemptsto explain strategies involved in matching tosample (MTS) and those to explain transfereffects from rats trained in single choice-point mazes. There are obvious task simi-larities. The rat moves to the choice pointin the T- or Y- maze and must choose whichway to travel. In MTS, the pigeon mustchoose between the comparison stimuli.There has been a great deal more theorizingabout strategies of rats in mazes than ofpigeons in matching-to-sample tasks. Sev-eral such theories that have been successfulin explaining much of the behavior of ratsin mazes (including the overlearning reversaleffect) may be collectively considered as re-sponse-selection theories (e.g., Hall, 1973;Mandler, 1966; Reid, 1953; S. Siegel, 1969;Spence, 1960; Tolman, 1938). The stimuliare presented to the subject at the same time,but response-selection theories consider thesimultaneous discrimination to be a pair ofsuccessive discriminations. The rat viewsStimulus 1 and selects a right-turning re-sponse or a left-turning one. Such theoriesare strongly supported by the vicarious trial-and-error (VTE) behavior emitted by therats: "They tended to enter one arm of themaze and retrace if confronted with S— inthat arm. During overtraining, this behaviorwas gradually eliminated and replaced bychoice-point scanning behavior" (Mandler,1968, p. 110). More direct evidence that ratsconfronted with such discriminations will
break down the simultaneous discriminationinto several successive discriminations comesfrom a clever series of transfer experimentsfrom simultaneous to successive discrimi-nations (Pullen & Turney, 1977) and byexperiments in which rats had to "peek"under hinged doors to see the individualstimuli (S. Siegel, 1969). The response-se-lection approach allows the results to bemodeled by Markov processes which mayreveal the underlying strategies used by thesubjects to perform the task (Atkinson,1960; Bower, 1959, 1962; Estes, 1960;Spence, 1960; Still, 1976).
There are no logical reasons why pigeonsmatching stimuli in Skinner boxes cannot besimilarly characterized. But there are somepractical reasons that make this character-ization difficult. Pigeons move their heads(and consequently their eyes) so rapidly thatthe VTE analogue (visually orienting towardone comparison stimulus and then towardthe other one) may occur in a fraction of asecond. Roberts and Grant (1978) neverthe-less suggested a response-selection charac-terization of pigeons matching to sample inorder to model results from multiple-sampleMTS experiments: "The model assumes thatupon presentation of the comparison stimuli,a pigeon will sample one stimulus first. If theE [elicited peck] process operates and/or theM [memory] process yields a match re-sponse, the pigeon will peck the key. Shouldthe E process fail to operate and the M pro-cess yield a nonmatch response, the alter-native key will be pecked automatically" (p.80). They did not, however, observe theirsubjects or record any VTE. Roberts andGrant's model shares some features with theone developed in this article: The pigeonsobserve the stimuli individually and selecta response (match/nonmatch) on the basisof its absolute appearance.
Much of the data to be presented in thisarticle are observations of the pigeons asthey perform the MTS task. The wavelengthstimuli were controlled precisely and wererecessed behind the pecking keys so that thepigeons' orientations toward the stimuli (andVTE) could be observed and recorded. Themodel is a response-selection model (basi-cally a random-walk-with-absorbing-bar-riers model, similar in many respects to

MODEL OF MATCHING TO SAMPLE 193
Bower's, 1959, Model B), coupled with adecision-process model (similar to signal-de-tection-theory models) for determining andexplaining changes in transition state prob-abilities. This latter feature allows, amongother things, the separation of transitionstate changes arising from criteria changesas distinct from those arising from detect-ability changes.
Experiment 1
Experiment 1 examined performance ofpigeons on a delayed-matching task andtheir orientations toward the individual stim-uli. The sequence of their orientations andcomparison stimulus choices reveals someimportant aspects about their strategies usedin performing delayed matching to sample(DMTS).
MethodSubjects. The subjects were three 9-yr-old White
Carneaux pigeons from the Palmetto Pigeon Plant inSumter, South Carolina. They were maintained on a14:10 hr lights-on/lights-off cycle, with water and gritcontinuously available. Daily experimental sessions wereconducted 5 days each week, provided that the pigeonswere 77%-83% of their free-feeding weights; individualhopper times in the behavioral task were adjusted tomaintain their weights. They had extensive matchingexperience prior to the collection of data for this ex-periment, at least 700 daily sessions with the 88 differentwavelengths and the particular delay intervals used inthis experiment.
Apparatus. A diagram of the optical apparatus isshown in Figure 1. There were three light paths, one foreach of the three stimulus displays behind each of thethree pecking keys. The single light source was a 150-W xenon arc lamp. Wavelengths of light were producedby three Bausch and Lomb high-intensity monochro-mators, with entrance and exit slits selected to produce5-nm bandpasses at half-peak intensity. The intensitiesof the three light paths were separately controlled bypairs of circular neutral-density filters. The circular neu-tral-density filters and monochromators were positionedby precision stepping motors via gear-train mechanismsdesigned and constructed "in-house." Positioning reli-ability far exceeded the sensitivity of our calibrationequipment which can resolve angstrom wavelength dif-ferences and .001 log-unit density differences. The entireoptical system was housed in integral, rigidly supportedaluminum tubes and boxes which maintained a light-tight, dust-free, and aligned system over years of use.
The three light paths projected into the experimentalchamber via aluminum tubes which terminated 42.8 mmbehind color-clear glass paddles mounted on BRS/LVENo. 1348 pigeon pecking keys. The center path madea detour over the top of the right one via four mirrorsin an inverted U-shaped tube assembly. The stimuli
projected upon ground-glass screens, which were mountedin the end of each light tube, constructed of two piecesof ground glass with the ground surfaces placed to-gether. An image of the grating projected upon theseground-glass screens, and its size (2.68 mm wide X15.88 mm high), were precisely defined by using thethin metal plates from dismantled Bausch and Lomb"Entrance B" slits.
The experimental chamber consisted of a double com-partmental box, separable at the stimulus panel to fa-cilitate cleaning and calibration of stimuli wavelengthsand intensities. The subject's portion was 609 X 381 X487 mm, and it was coated with white pigmented fi-berglass (including the stimulus panel) and sanded toa matte finish. The three color-clear glass pecking keyswere spaced 51 mm apart and 254 mm from the cham-ber floor. They required a force of approximately .15N through a distance of approximately 2 mm for ac-tuation. A grain hopper was centrally located 127 mmbelow the center pecking key. A house light, centeredin the ceiling of the subject's portion produced a lu-minance of approximately 2.16 cd/m2 from the chamberwalls from a General Electric No. 1156 bulb. The houselight was turned on only during intertrial intervals.
Stimulus wavelengths were calibrated with the useof an Edgerton, Germeshausen, and Grier (EG & G)560 spectroradiometer positioned in front of each lightpath with the ground-glass screens and apertures re-moved. Because only selected wavelengths were used(Wright, 1978, Table 1), the spectroradiometer was setto a desired wavelength, and the monochromator wasthen stepped to produce this wavelength. Variability ofwavelength reproducibility was a small fraction of anangstrom (angstrom = .1 nm).
The stimulus intensities were calibrated with an EG& G 580 radiometer which was positioned at the endof a light tube with the ground-glass screens and ap-ertures in place. For each wavelength to be used in theexperiment, the desired radiometer reading was com-puted, taking into account the sensitivity of the radi-ometer and the photometric sensitivity of the pigeon(Blough, 1957). The neutral density wedge was thenrotated until this desired reading was obtained. Eachneutral density wedge step produced approximately.0025 log-unit change in neutral density, and so the de-sired intensity values could be produced and duplicatedwith an accuracy far exceeding the behavioral measuresfrom which they were derived. These step numbers forthe neutral density wedge positions were stored as pairswith their adjoining monochromator step numbers sothat the computer could position each monochromatorand density wedge unit as a pair.
The experimental dependencies, contingencies, stim-ulus control, data collection, and data analyses wereautomatically accomplished with a Hewlett-Packard2100 minicomputer with a Diablo fixed disk system.
• Procedure. The basic procedure was a standard de-layed matching-to-sample paradigm. A trial began withthe offset of the chamber light and the display of acenter-key sample stimulus behind the clear-glass cen-ter-key pecking paddle. An 8-sec fixed-interval observ-ing response requirement (ORR) was timed duringwhich center-key pecks were ineffective. The first peckafter this ORR terminated the center-key sample stimrulus and initiated a delay period of 5 sec for Pigeons

194 ANTHONY A. WRIGHT AND STEPHEN F. SANDS
Figure 1. Diagram of optical system to produce three vertical bars of monochromatic light whosewavelength and intensity are separately controlled. (LS = xenon arc light source; HG = heat absorbingglass; L = lens; M = mirror; S = shutter; Mono = monochromator; DW = density wedge; B = baffle;SA = stimulus aperture; PK = pecking key; SP = stimulus panel. The solid outline of a pigeon is inits typical position in relation to the stimulus panel. The dotted outline of a pigeon is in its atypicalposition and is one that is the minimum distance from the stimulus panel to view all three stimulisimultaneously.)
P4946 and P5144, and 6.4 sec for Pigeon P4263. Fol-lowing the delay interval, the two comparison stimuliwere displayed, one behind each of the two side peckingkeys. A single response on either of the clear-glass sidepecking keys terminated the trial and turned on thehouse light during the 6-sec intertrial interval. The houselight was on only during intertrial intervals; its functionwas to maintain the subjects' state of light adaptationas well as to encourage differentiation between delayintervals and intertrial intervals.
Two types of trials were intermixed each session:training trials and test trials. On the 176 training trials,one side stimulus matched the center sample stimulus,and a response on the pecking key (in front of thismatching side stimulus) was counted as a correct re-sponse. Correct responses were reinforced with accessto mixed grain 30% of the time. Incorrect responses werenever reinforced; they produced the 6-sec intertrial in-terval. The stimuli used on training trials were selectedfrom 88 different wavelengths between S46 nm and 660nm. The wavelengths were chosen to represent equalhue-discriminability steps for the pigeon (Wright, 1972,1974) and are the first 88 values of a pigeon's equalhue-discriminability scale (Table 1 in Wright, 1978).Each of these 88 stimuli appeared twice as the samplestimulus during the experimental session, and thematching comparison stimulus appeared once as theright side stimulus and once as the left side stimulus.The nonmatching (incorrect) comparison stimulus wasalways 44 discrimination steps (57 nm on the average)removed from the sample stimulus.
There were 72 test trials interspersed among the 176regular training trials (total of 248 trials); in these trialsneither side (comparison) stimulus matched the centersample stimulus, and reinforcement was unavailable.These test-trial comparison stimuli spectrally bracketedthe sample stimulus, one to a shorter wavelength andone to a longer wavelength, and they were equally sep-
arated from the sample in hue distance. There werethree different types of test trials (see Table 1): one inwhich the hue difference between the sample and com-parison stimuli was large (44 steps), one in which it wasmoderate (22 steps), and one in which it was small (11steps). The wavelength difference for the small spacingamounted to as little as 8 nm in the spectral area around600 nm where the pigeons' hue discrimination is keen
Table 1Test-Trial-Stimulus Identification Numberin Hue-Discrimination Steps and Wavelength(in nm)
Center samplestimulus
Side comparisonstimuli
Test set No. Wavelength No. Wavelength
Small huedifference
Moderate huedifference
Large huedifference
22
44
66
22
44
66
44
616.1
599.5
576.7
616.1
599.5
576.7
599.5
113333555577
14422664488
188
630.1607.5607.5590.7590.7538.3
660.1599.5616.1576.7599.5546.2
660.1546.2

MODEL OF MATCHING TO SAMPLE 195
to as much as 23 nm in the far red where its hue dis-crimination is comparatively poor. Collectively, thenumbers of test trials with small-moderate-large huedifferences were equal at 24 for each test set. Four testsessions were conducted, but the results were so similarthat only two were conducted in subsequent experi-ments, and results from only the first two in this ex-periment were used in the analysis.
The subjects' behavior during the task was observedthrough a closed-circuit infra-red TV camera system.A special false door to the subjects' portion of the ex-perimental chamber was constructed to accommodatean infrared source and an infrared TV camera. Infraredwas necessary because the trials were conducted in"darkness." It is well known that pigeons (like humans)are not sensitive to infrared wavelengths and were thusunable to see the infrared light. Movements of the pi-geons in relation to the three stimuli were recorded oneach trial by an observer and were matched to the sub-ject's computer-recorded performance. The pigeons'orientation movements were easily recordable in thisparticular setting. Figure 1 shows that from their normalposition in front of the stimulus panel, they could observeonly one stimulus at a time and had to move in frontof the key opening to see the stimulus behind it. Theydid not stand back from the stimulus panel and observethe stimuli from a single position as shown by the dashedoutline of the pigeon in Figure 1.
Reliability of the recording procedure was assessedby videotaping a session and scoring the session sepa-rately by four observers. Three independent observersagreed 99% (mean) with the experimenter. All record-ings for these experiments were made "blind" by theexperimenter, as there was no way to tell during theobservations what stimuli were being shown to the pi-geons.
Results
Performance by the three pigeons is shownin Figure 2. Performance on the trainingtrials (176 per session) is shown in the lefttwo panels, and performance on the testtrials (72 per session) is shown in the rightthree panels. The sum of the histograms forcorrect choices on training trials equals thetotal percentage correct and shows that thiswas an easy discrimination for the pigeons.The individual histograms represent the pro-portion of total training trials on which thepigeons made different numbers of obser-vation switches from one side stimulus to theother before pecking a side key and termi-nating the trial. Hence, a zero switch meansthat it pecked the first side key observed.One switch means that it observed one sidestimulus then switched over, observed andpecked the other side stimulus. Two switchesmeans that the pigeon observed one sidestimulus, switched over and observed (but
did not peck) the other side stimulus andthen switched back, reobserved and peckedthe first observed side stimulus, and so on.These data are compiled without regard towhether the left or the right stimulus wasfirst observed. Performance in the differentswitch categories between the two test ses-sions was highly correlated (r = .95), whichwas also typical of the other experiments.
The pigeons observed one particular sidestimulus (either right or left) first on eachtrial: On 99% of the trials Pigeons P4263and P5144 observed the left side stimulusfirst, and on 99% of the trials Pigeon P4946observed the right side stimulus first. Fur-thermore, they pecked this first observed sidekey on slightly more than half of the trials(64%-70%>. Consequently, they never ob-served the alternative comparison stimuluson trials in which they made these first ob-served choices. On most of the remainingtrials, they pecked the alternative side keyafter switching from the first observed sidekey. Most errors (93%) occurred to the firstobserved comparison stimulus. Even aftercorrecting for opportunity, the mean errorrate was 12.8% on the first observation and2.8% thereafter, a statistically significantdifference, t(2) = 19.5, p < .01. This is in-teresting because when more time has elapsed(when the pigeon switches to the alternativecomparison) the error rate is less. A simplemodel of forgetting with time (e.g., Brown,1958) would predict the opposite result.
Test trial results reveal some facets ofmatching performance that are not revealedby the training trial data. It is important tokeep in mind, however, that test trials areanomalous matching trials, and their use-fulness may be to exaggerate certain ten-dencies of normal matching performance.Test trials appeared infrequently, and train-ing trial performance with and without testtrials did not differ.
On small-hue-difference test trials, bothcomparison stimuli mismatched the sampleby 11 hue-discrimination steps, which wasonly 25% of the hue difference between thesample and nonmatching comparison ontraining trials. The three pigeons pecked thefirst observed side-key comparison stimulus96% of the time. Thus, these small hue dif-ferences almost always generated an ac-

196 ANTHONY A. WRIGHT AND STEPHEN F. SANDS
Training Trials Test Trials
1.00
.80
.60
.40
.20
•s '80 ~
£ .60 -
I -40 -
£ .20 -
.80 -
.60 -
.40 -
.20 -
.00 -
Correct Incorrect
Hue Difference Between Nonmatchlng ComparisonStimuli and Sample Stimulus
Small Moderate Large
II
P4263
P4946
P5144
Ll
1 Mil
L0 1 2 3 0 1 2 3 0 1 2 3 0 1 2 3 0 1 2 3 4 5 6
Switches In Observation of Comparison Stimuli Before Choice ResponseFigure 2. Results from an easy discrimination in a delayed matching-to-sample task (Experiment 1)plotted as the proportion of trials on which the pigeons made different numbers of switches between thecomparison stimuli before choosing (pecking) one of them and terminating the trial. (On training trials,the switch proportions for correct and incorrect choices sum to 1.00. On test trials, the comparison stimulido not match the sample stimulus and are equally spaced from it. The switch proportions are separatelycomputed for each of the three categories.)
ceptable match to the pigeons on the firstobservation.
On moderate-hue-difference test trials,both comparison stimuli mismatched thesample by 22 hue-discrimination steps, andthe pigeons switched more than they did with
small hue differences, t(2) = 43, p < .001.These comparison stimuli were less of anacceptable match than the ones of small huedifference. Choices of the first observed com-parison stimulus (0 switch) decreased from95% to 72% on the average. Choices of the
MODEL OF MATCHING TO SAMPLE 197
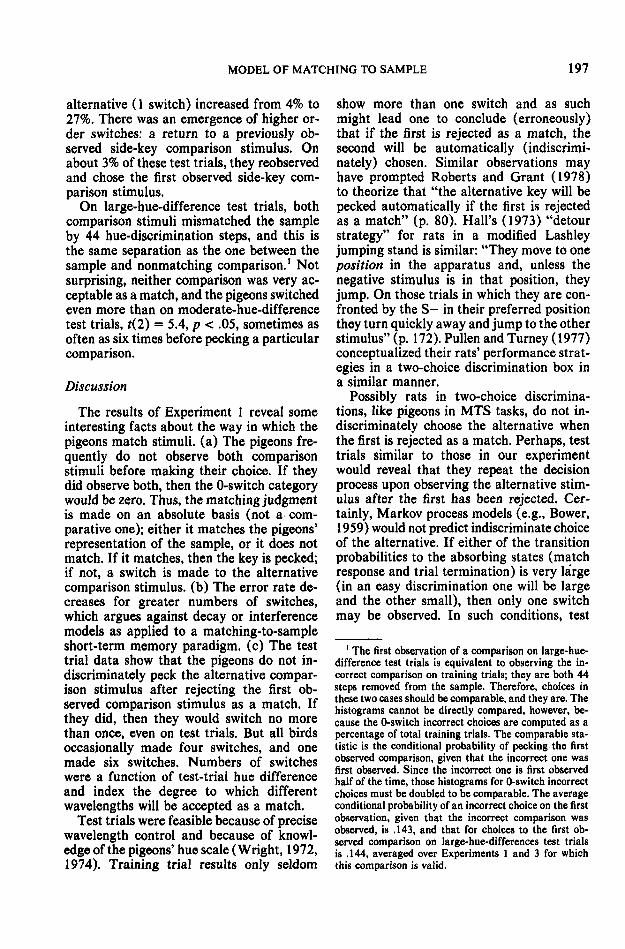
alternative (1 switch) increased from 4% to27%. There was an emergence of higher or-der switches: a return to a previously ob-served side-key comparison stimulus. Onabout 3% of these test trials, they reobservedand chose the first observed side-key com-parison stimulus.
On large-hue-difference test trials, bothcomparison stimuli mismatched the sampleby 44 hue-discrimination steps, and this isthe same separation as the one between thesample and nonmatching comparison.1 Notsurprising, neither comparison was very ac-ceptable as a match, and the pigeons switchedeven more than on moderate-hue-differencetest trials, t(2) = 5.4, p < .05, sometimes asoften as six times before pecking a particularcomparison.
Discussion
The results of Experiment 1 reveal someinteresting facts about the way in which thepigeons match stimuli, (a) The pigeons fre-quently do not observe both comparisonstimuli before making their choice. If theydid observe both, then the 0-switch categorywould be zero. Thus, the matching judgmentis made on an absolute basis (not a com-parative one); either it matches the pigeons'representation of the sample, or it does notmatch. If it matches, then the key is pecked;if not, a switch is made to the alternativecomparison stimulus, (b) The error rate de-creases for greater numbers of switches,which argues against decay or interferencemodels as applied to a matching-to-sampleshort-term memory paradigm, (c) The testtrial data show that the pigeons do not in-discriminately peck the alternative compar-ison stimulus after rejecting the first ob-served comparison stimulus as a match. Ifthey did, then they would switch no morethan once, even on test trials. But all birdsoccasionally made four switches, and onemade six switches. Numbers of switcheswere a function of test-trial hue differenceand index the degree to which differentwavelengths will be accepted as a match.
Test trials were feasible because of precisewavelength control and because of knowl-edge of the pigeons' hue scale (Wright, 1972,1974). Training trial results only seldom
show more than one switch and as suchmight lead one to conclude (erroneously)that if the first is rejected as a match, thesecond will be automatically (indiscrimi-nately) chosen. Similar observations mayhave prompted Roberts and Grant (1978)to theorize that "the alternative key will bepecked automatically if the first is rejectedas a match" (p. 80). Hall's (1973) "detourstrategy" for rats in a modified Lashleyjumping stand is similar: "They move to oneposition in the apparatus and, unless thenegative stimulus is in that position, theyjump. On those trials in which they are con-fronted by the S- in their preferred positionthey turn quickly away and jump to the otherstimulus" (p. 172). Pullen and Turney (1977)conceptualized their rats' performance strat-egies in a two-choice discrimination box ina similar manner.
Possibly rats in two-choice discrimina-tions, like pigeons in MTS tasks, do not in-discriminately choose the alternative whenthe first is rejected as a match. Perhaps, testtrials similar to those in our experimentwould reveal that they repeat the decisionprocess upon observing the alternative stim-ulus after the first has been rejected. Cer-tainly, Markov process models (e.g., Bower,1959) would not predict indiscriminate choiceof the alternative. If either of the transitionprobabilities to the absorbing states (matchresponse and trial termination) is very la'rge(in an easy discrimination one will be largeand the other small), then only one switchmay be observed. In such conditions, test
1 The first observation of a comparison on large-hue-difference test trials is equivalent to observing the in-correct comparison on training trials; they are both 44steps removed from the sample. Therefore, choices inthese two cases should be comparable, and they are. Thehistograms cannot be directly compared, however, be-cause the 0-switch incorrect choices are computed as apercentage of total training trials. The comparable sta-tistic is the conditional probability of pecking' the firstobserved comparison, given that the incorrect one wasfirst observed, Since the incorrect one is first observedhalf of the time, those histograms for 0-switch incorrectchoices must be doubled to be comparable. The averageconditional probability of an incorrect choice on the firstobservation, given that the incorrect comparison wasobserved, is .143, and that for choices to the first ob-served comparison on large-hue-differences test trialsis .144, averaged over Experiments 1 and 3 for whichthis comparison is valid.

198 ANTHONY A. WRIGHT AND STEPHEN F. SANDS
trials may be necessary to reveal the actualswitching strategy. There may be other waysto change the transition probabilities in or-der to further test the switching strategies.Consider what would happen if the discrim-ination used in Experiment 1 was made moredifficult. The pigeons could no longer attendto gross hue differences and would have todiscriminate find shades of hue in order tocorrectly match and obtain reward. Thus,their criterion for accepting a stimulus as amatch might become stricter, with the con-sequence that they would be less likely tomake the transition to a match response andwould make more switches. To this end, thesame pigeons were tested under a more dif-ficult discrimination in Experiment 2.
Experiment 2
The stimuli used for training in Experi-ment 2 were considerably more difficult todiscriminate than those in Experiment 1.The purpose of training on this more difficultdiscrimination was to determine whether thepigeons' match criteria would become stricterand result in more switches between com-parison stimuli.
Method
Subjects. The subjects were the same three WhiteCartieaux pigeons used in Experiment 1; they weremaintained under the same conditions as in Experi-ment 1.
Apparatus. The apparatus was the same as in Ex-periment 1.
Procedure. The three pigeons in this experimentwere given extensive retraining on the more difficultdiscrimination before being tested. The training andtesting conditions for Experiment 2 were identical tothose in Experiment 1 except that on training trials theincorrect comparison stimulus was separated from thesample stimulus (and the correct comparison stimulus)by only 25 hue-discrimination steps. This amounted toan average wavelength separation of 32 nm, whereas ithad been 57 nm in the easier discrimination.
The subjects were trained to make this more difficultdiscrimination by gradually decreasing the hue differ-ence between the incorrect and correct comparison stim-uli. This was done on an individual basis for each pigeon,and it was done slowly enough to maintain as high ac-curacy as possible (approximately 80% correct). Allpreliminary training sessions were 176 trials. The num-bers of sessions on this more difficult discriminationbefore testing were 12 for Pigeon P4263, 13 for PigeonP4946, and 29 for Pigeon P5144. At least six of thesesessions were devoted to training at the final hue dif-
ference of 25 discrimination steps before testing. Eachpigeon performed to a criterion of 80% correct or betteron the session prior to testing. At least three retrainingsessions separated the two test sessions.
Results
The results are shown in Figure 3. Train-ing trial performance, although not the dataof major interest, shows that there is a slightincrease (66% vs. 62%) to choose the firstobserved comparison stimulus and a slightincrease to make more reobservations (2 and3 switches). As in Experiment 1, PigeonsP4263 and P5144 each observed the leftcomparison first on 99% of the trials, andPigeon P4946 observed the right comparisonfirst on 99% of the trials. As in the easierdiscrimination, error rates to the first com-parison were proportionally high.
The most important results from this ex-periment are the test trial results. Generallyspeaking, a comparison of Figures 2 and 3reveals that the 0-switch category (responsesto the first observed comparison) decreasesand the others increase. A paired comparisontest revealed significantly more switching inthe difficult than in the easy discrimination,
18.2, />« .001.
Discussion
Results of Experiment 2 provide furtherevidence that pigeons do not indiscrimi-nately peck the alternative when a match tothe first observed comparison has been re-jected. Some "match" rule is applied to thesecond observed comparison stimulus andpossibly to all reobservations (two or moreswitches) as well. The results also indicatethat this match rule can be manipulated bychanging the discrimination difficulty. Thepigeons were stricter about what they wouldaccept as a match (in order to correctly per-form on training trials), and this strictnessresulted in more switching on test trials thanin Experiment 1. Although not shown here,these trends to more switching were shownto be reversible when the discrimination wasmade easy once again. This manipulabilityof their match acceptance argues for matchcriteria delimiting a hue range. A compar-ison stimulus which produces a stimulus ef-fect within this range will be accepted as a

MODEL OF MATCHING TO SAMPLE 199
Training Trials Test Trial!
1.00 -i
.80-
.60 -
.40 -
.20 -
Correct Incorrect
.80 -
.60 -
.40 -
.20 -
.00 -
Hue Difference Between Nonmatchlng ComparisonStimuli and Sample Stimulus
Small Moderate Large
|[P4263
I II llll
P4946
IPS144
1 IL1
L Mil1 2 3 0 1 2 3 0 1 2 3 0 1 2 3 4 0 1 2 3 4 S 6 7
Switches In Observation of Comparison Stimuli Before Choice Response
Figure 3. Results from a difficult discrimination in a delayed matching-to-sample task (Experiment 2)plotted as the proportion of trials on which the pigeons made different numbers of switches between thecomparison stimuli before choosing (pecking) one of them and terminating the trial. (On training trials,the switch proportions for correct and incorrect choices sum to 1.00. On test trials, the comparison stimulido not match the sample stimulus and are equally spaced from it. The switch proportions are separatelycomputed for each of the three categories,)
match. If such a match rule is uniformlyapplied to all comparison observations andreobservations, then the results can be mod-eled by a Markov process rule. A generalmodel for these results is considered aftersome additional experiments on the pro-cesses involved in simultaneous matching tosample. The purpose of extending this anal-ysis to simultaneous matching is to deter-mine how the presence of the sample duringa matching trial will influence the pigeons'matching strategies and the manipulabilityof their match criteria.
Experiment 3
The training and test stimuli used in Ex-periment 1 were used in Experiment 3 to test
the matching strategies of a different groupof pigeons for which the sample stimulus waspresent throughout the matching trial: si-multaneous matching to sample (SMTS).
MethodSubjects. The subjects were four 15-yr old White
Carneaux pigeons from the Palmetto Pigeon Plant inSumter, South Carolina. Their weights and living con-ditions were the same as those for the subjects in Ex-periments 1 and 2. They had extensive prior experiencein the simultaneous matching task, a minimum of 750daily sessions with training trials composed from the 88different wavelengths used in this experiment.
Apparatus. The apparatus was the same as in Ex-periments 1 and 2.
Procedure. The training and testing conditions wereidentical to those of Experiment 1 except that the ob-serving-response requirement was 4 instead of 8 sec andthe first center-key peck following the expiration of the

200 ANTHONY A. WRIGHT AND STEPHEN F. SANDS
observing-response requirement displayed the two com-parison side-key stimuli while leaving the sample stim-ulus displayed. Thus, all three stimuli, the two com-parison stimuli and the sample stimulus, were displayedsimultaneously during the choice period.
Results
Results of Experiment 3 are shown in Fig-ure 4. On training trials, the pigeons chosethe first observed stimulus 55% of the time(sum of correct and incorrect 0-switch cat-egories), somewhat less of a tendency tochoose the first observed comparison thantheir delayed matching counterparts. Veryfew errors were made. Pigeons P285 andP378 observed the left comparison first 97%and 93% of the time, respectively. PigeonsP255 and P381 observed the right compar-ison first 98% and 99% of the time, respec-tively.
Test trial performance for these simulta-neous matching pigeons was very similar tothe performance for the delayed-matchingpigeons in Experiment 1. On small-hue-dif-ference test trials (11 hue-discriminationsteps), they pecked the first observed com-parison stimulus 91% of the time. On mod-erate-hue-difference test trials (22 discrim-ination steps), the amount of comparisonstimulus switching increased significantly,f(3) = 5.99, p < .01. This trend continued;there was significantly more switching onlarger than on moderate-hue-difference testtrials, *(3) = 6.47, p < .01.
One difference between simultaneous anddelayed matching is that in the simultaneousmatching task, pigeons can reobserve thesample stimulus at any time during the trial.Figure 5 shows the extent to which they dpmake these sample reobservations. Each pi-geon was scored as having made a samplereobservation if it pecked the center key ormade an air peck directly in front of thecenter key. Such a scoring system is prob-ably a conservative estimate of sample reob-servations, because sample responses are notnecessarily made when the pigeon sees thestimulus. The delayed matching pigeonsnever made such responses toward the darkcenter key, so it seems safe to assume thatthey are under control of the sample stim-ulus.
Sample reobservations are plotted as a
function of the opportunity to make them(Anger, 1956). Pigeons only rarely make asmany as six switches in a single trial, butwhen they do (opportunity), do they makea sample reobservation? If six switches weremade on a particular trial, then there are,of course, six opportunities to make samplereobservations; all of these opportunities areincorporated into the appropriate histogramsin Figure 5. Figure 5 shows that their like-lihood of making sample responses decreasesas the number of switches increases for bothtraining and test trials. In addition, the pi-geons almost always switched to the alter-native comparison stimulus after a samplereobservation; they rarely returned to thesame comparison stimulus.
Discussion
One of the important results from thisexperiment is that simultaneous-matchingpigeons seem to employ the same basic strat-egies as delayed-matching pigeons: They ob-served the stimuli individually; they orientedto a preferred side; they switched back andforth between the comparison stimuli on testtrials, and the amount of switching was afunction of the degree of mismatch betweenthe sample and the test comparisons.
The simultaneous matching (SMTS) pi-geons switched more than their delayedmatching (DMTS) counterparts on moder-ate- and large-hue-difference test trials, F(l,5) = 1.66,/> > .10; F(l, 5) - 20.3, p « .001;F(l, 5) = 10.6, p « .001 for small-, moder-ate-, and large-hue-difference test trials, re-spectively. This suggests that the same huedifferences were less likely to meet thematch criteria of the SMTS pigeons thanthose of the DMTS pigeons. It is interestingthat the SMTS pigeons review the sampleabout two thirds of the time on the firstswitch. This reviewing behavior may indi-cate why these pigeons switch more thanDMTS pigeons and may account for fasterSMTS matching acquisition than DMTSmatching acquisition. Does this largeramount of switching mean stricter criteria,better detectability, or both for the SMTSpigeons as opposed to the DMTS pigeons?An attempt to answer this question with theaid of a model is made in General Discus-

MODEL OF MATCHING TO SAMPLE
Training Trials Teat Trials
201
Hue Difference Between Nonmitohlng ComparisonStlmulue
1.00-1
.60'
.40
.20
.80
.60
Correct Incorrect Smell
.80
.60
.80 -
.40-
.00 -J
hP255
"
Stimuli and SimpleModerate Urge
III ..III
1
•
III.II.....
ll...
,.l.
..ll
.ll.l.
Switches In Observation of Comparison Stimuli Before Choice Response
Figure 4. Results from an easy discrimination in a simultaneous matching-to-sample task (Experiment3) plotted as the proportion of trials on which the pigeons made different numbers of switches betweenthe comparison stimuli before choosing (pecking) one of them and terminating the trial. (On trainingtrials, the switch proportions for correct and incorrect choices sum to 1 .00. On test trials, the comparisonstimuli do not match the sample stimulus and are equally spaced from it. The switch proportions areseparately computed for each of the three categories.)
sion, but first we present results that showthat match criteria are manipulable in SMTSas in DMTS.
Experiment 4The purpose of Experiment 4 was to de-
termine whether or not a more difficult dis-crimination for the simultaneous matchingpigeons would produce changes similar tothose observed for the delayed matching pi-geons in the more difficult discrimination.
MethodSubjects. The subjects, their maintenance, and their
environment were the same as in Experiment 3.
Apparatus. The apparatus was the same as it waspreviously.
Procedure. The procedure was the same as it wasin Experiment 3, a simultaneous matching-to-sampletask, except that the pigeons were trained and tested ona more difficult discrimination in Experiment 4 than inExperiment 3. For all four pigeons, the training-trialhue difference was abruptly reduced from 44 discrim-ination steps to 30 discrimination steps without any ap-parent performance changes, and then it was graduallyreduced (on an individual basis) to a hue difference of20 discrimination steps (or 26 nm on the average). Ahue difference of 20 discrimination steps was a discrim-ination at which all subjects met the 80% criterion per-formance before testing, but it was still a comparativelydifficult discrimination so that it would likely affect theirmatch criteria. The numbers of 176 training-trial pretest
202 ANTHONY A. WRIGHT AND STEPHEN F. SANDS
lOO-i
20-
Tnlning Trials Tail TrliliHue Difference Between Nonmilchlng Comparison
Stimuli and Simple Stimulus
Correct Incorrect Small Large
1 2 3 1 2 3 1 2 3 1 2 3 4 5 1 2 3 4 5 6 7
Switches In Observation of Comparison Stimuli Before Choice Rasponso
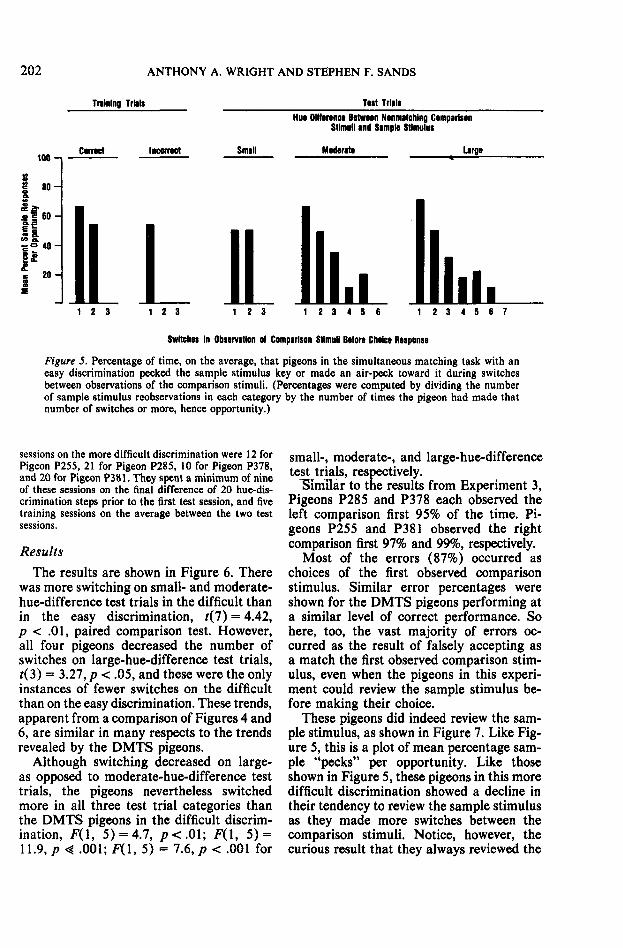
Figure 5. Percentage of time, on the average, that pigeons in the simultaneous matching task with aneasy discrimination pecked the sample stimulus key or made an air-peck toward it during switchesbetween observations of the comparison stimuli. (Percentages were computed by dividing the numberof sample stimulus reobservations in each category by the number of times the pigeon had made thatnumber of switches or more, hence opportunity.)
sessions on the more difficult discrimination were 12 forPigeon P255, 21 for Pigeon P285, 10 for Pigeon P378,and 20 for Pigeon P381. They spent a minimum of nineof these sessions on the final difference of 20 hue-dis-crimination steps prior to the first test session, and fivetraining sessions on the average between the two testsessions.
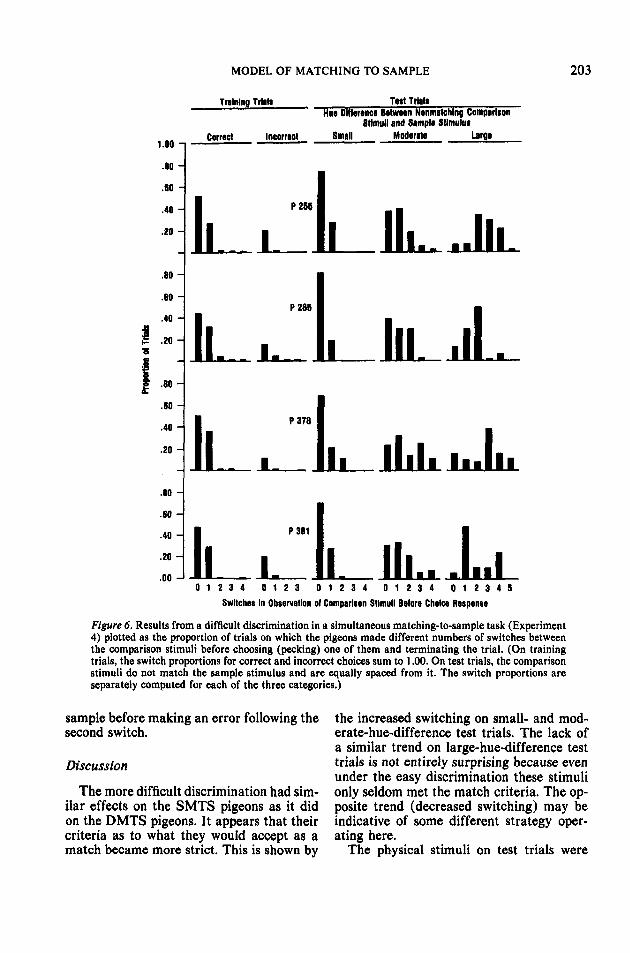
ResultsThe results are shown in Figure 6. There
was more switching on small- and moderate-hue-difference test trials in the difficult thanin the easy discrimination, t(7) = 4.42,p < .01, paired comparison test. However,all four pigeons decreased the number ofswitches on large-hue-difference test trials,j(3) = 3.27, p < .05, and these were the onlyinstances of fewer switches on the difficultthan on the easy discrimination. These trends,apparent from a comparison of Figures 4 and6, are similar in many respects to the trendsrevealed by the DMTS pigeons.
Although switching decreased on large-as opposed to moderate-hue-difference testtrials, the pigeons nevertheless switchedmore in all three test trial categories thanthe DMTS pigeons in the difficult discrim-ination, F(l, 5) = 4.7, /><.01; F(l, 5) =11.9, p « .001; F(l, 5) = 7.6, p < .001 for
small-, moderate-, and large-hue-differencetest trials, respectively.
ISimflar to the results from Experiment 3,Pigeons P285 and P378 each observed theleft comparison first 95% of the time. Pi-geons P255 and P381 observed the rightcomparison first 97% and 99%, respectively.
Most of the errors (87%) occurred aschoices of the first observed comparisonstimulus. Similar error percentages wereshown for the DMTS pigeons performing ata similar level of correct performance. Sohere, too, the vast majority of errors oc-curred as the result of falsely accepting asa match the first observed comparison stim-ulus, even when the pigeons in this experi-ment could review the sample stimulus be-fore making their choice.
These pigeons did indeed review the sam-ple stimulus, as shown in Figure 7. Like Fig-ure 5, this is a plot of mean percentage sam-ple "pecks" per opportunity. Like thoseshown in Figure 5, these pigeons in this moredifficult discrimination showed a decline intheir tendency to review the sample stimulusas they made more switches between thecomparison stimuli. Notice, however, thecurious result that they always reviewed the
MODEL OF MATCHING TO SAMPLE 203
Training Trl«li Tail Triali
1.00 -
.80-
.60 -
.40 -
.20 -
.80 -
.60 -
.40 -
.20 -
.60 -
.40 -
.20 -
.60 -
.40 -
.20 -
.00 -
Cornet Incorrect
Hue Difference Bitwatn Nonmatchlng ComparltonStimuli and Sampla Stlmulua
Small Moderate Large
P255
llP285
P37B
lllll ll.lll
kP381
JMl0 1 2 3 4 0 1 2 3 0 1 2 3 4 0 1 2 3 4 0 1 2 3 4 5
Switches In Observation of Comparison Stimuli Before Choice Responae
Figure 6. Results from a difficult discrimination in a simultaneous matching-to-sample task (Experiment4) plotted as the proportion of trials on which the pigeons made different numbers of switches betweenthe comparison stimuli before choosing (pecking) one of them and terminating the trial. (On trainingtrials, the switch proportions for correct and incorrect choices sum to 1.00. On test trials, the comparisonstimuli do not match the sample stimulus and are equally spaced from it. The switch proportions areseparately computed for each of the three categories.)
sample before making an error following thesecond switch.
Discussion
The more difficult discrimination had sim-ilar effects on the SMTS pigeons as it didon the DMTS pigeons. It appears that theircriteria as to what they would accept as amatch became more strict. This is shown by
the increased switching on small- and mod-erate-hue-difference test trials. The lack ofa similar trend on large-hue-difference testtrials is not entirely surprising because evenunder the easy discrimination these stimulionly seldom met the match criteria. The op-posite trend (decreased switching) may beindicative of some different strategy oper-ating here.
The physical stimuli on test trials were

204 ANTHONY A. WRIGHT AND STEPHEN F. SANDS
100 -i
Tralnlng Trials Test Trials
Correct
Hue Difference Between Nonmatchlng ComparisonStimuli and Sample Stimulus
Small Moderate Large
1111 2 3 4 5 1 2 3 1 2 1 2 3 4 1 2 3 4 5
Switches In Observation of Comparison Stimuli Before Choice Response
Figure 7. Percentage of time, on the average, that pigeons in the simultaneous matching task with adifficult discrimination pecked the sample stimulus key or made an air-peck toward it during switchesbetween observations of the comparison stimuli. Percentages were computed by dividing the number ofsample stimulus reobservations in each category by the number of times the pigeon had made thatnumber of switches or more, hence opportunity.)
identical in Experiments 3 and 4; the onlydifference was that the pigeons had to makea more difficult discrimination on trainingtrials. Thus, performance changes to thesestimuli probably were criteria changes. Itseems that the pigeons enter each choiceperiod of a trial with criteria for acceptingstimuli as a match and that the stimuli arerejected if they do not meet these criteria.If the training-trial discrimination is diffi-cult, then the pigeons have to attend to smallhue differences in order to avoid acceptinga stimulus as a match which actually doesnot match the sample stimulus. If their cri-teria are not strict enough and almost anystimulus first observed qualifies as a match,then they will have a very strong positionpreference (they observe one side first) andwill be very close to chance performance.These important findings about the way inwhich the pigeons performed the matchingtask combine to form the basis of a modelthat can be cast into mathematical terms.This model is the topic of General Discus-sion.
General DiscussionTheoretical Considerations
These experiments allow the pigeons'matching performance to be conceptualizedin the following way. The pigeon, followingits observation of the sample stimulus, ori-ents either to the right or the left and ob-
serves that side-key comparison stimulus. Italmost always orients in the same direction.If the comparison is judged to match thesample, then it pecks it. If not, it switchesto the alternative comparison and repeats thedecision process. How it makes the matchdecision can be conceptualized by a criterioncut-off on a stimulus-effects scale of hue. Ifthe comparison hue is to the sample side ofthe cut-off, then it will be accepted as amatch. The strictness or laxness of this cri-terion is determined, in part, by the discrim-ination difficulty.
These decision processes and the variablesinvolved are diagrammed in Figure 8 interms much like those employed in signaldetection theory. Each physical wavelengthstimulus produces a psychological effect ofhue which varies somewhat from trial to trialbecause the state of the subject is always inconstant fluctuation. From many trials thesehue effects form a distribution that may benormal in form, like those shown in Figure8. Probability density is a measure of theexpected frequency for the various stimuluseffects elicited by a particular wavelength.The matching (left) and nonmatching (right)distributions overlap, and the degree towhich these distributions overlap is a mea-sure of the subject's ability to discriminatethe stimuli. If they are very close together,then they are similar in hue; if they are dis-tant, then they are different in hue. The

MODEL OF MATCHING TO SAMPLE 205
Dlitrlbutlon of StimulusEtlBcti from theMatching Compirlion
Distribution of StimulusEffects from the
matching Comparison
Correctly Rejectsas Match-Correct Negative
Scale of Stimulus Effects
Figure 8. Top panel: Hypothetical distributions of thestimulus effects (hue) for correct and incorrect com-parison stimuli. Middle panel: Stimuli producing effectsto the left of the criterion line are accepted as matches;those producing effects to the right are rejected asmatches. (The portion of the matching comparison dis-tribution to the left of the criterion specifies that hitrate; that to the right, the false-negative rate.) Lowerpanel: The portion of the nonmatching comparison dis-tribution to the left of the criterion specifies the falsealarm rate; that to the right the correct-negative rate.
match criterion is a critical value of hue andis represented in Figure 8 as a vertical line;any stimulus that produces a hue effect tothe right of the line is rejected as a match,and any one to the left is accepted as amatch. The relative areas of each distribu-tion, cut by the criterion line, represent theprobability that the pigeons will makematch/reject decisions for that particularwavelength. The middle panel shows the pro-portions of correct decisions; the lower panelshows the proportions of incorrect decisions.By inspecting this diagram, one can workout the effect of making the discriminationmore difficult. The right-hand distributionwould by definition move to the left, andsince the criterion would not immediatelymove, the false-alarm rate would be greater.Thus, the pigeons would more often acceptas a match the incorrect comparison stim-ulus. After some training, the criterion wouldmove to minimize false alarms. As the cri-terion moves to the left, the false-negativerate would increase, but false negatives do
not produce matching errors directly, onlyswitching errors. There is a reasonable chancethat the pigeons would switch back andeventually be correct on that same trial.
Assumptions
Distributions of stimulus effects. It isassumed that each physical stimulus (wave-length) in this experiment produces a psy-chological effect (hue) which varies some-what with each presentation to form adistribution. These distributions are shownto be normal in form, but normality is nota crucial assumption (Egan, 1975). The re-levant stimulus-effects scale is hue becausewavelengths of monochromatic light areused. The wavelengths were selected to beequal hue distances (Wright, 1972, 1974,1978). Equal hue distances add credibilityto the assumption of symmetrical match cri-teria.
Match criteria. It is assumed that pi-geons adopt match criteria, which are crit-ical values of hue. Because the incorrectcomparison may be longer or shorter inwavelength than the sample wavelength,there are usually two match criteria, one foreach possibility. The two criteria lines areassumed to be symmetrical with respect tothe stimulus-effects distribution of the sam-ple stimulus and matching comparison stim-ulus. This symmetry assumption is reason-able because the incorrect comparisonpossibilities are equal hue distances from thesample. This is not a critical, but only a sim-plifying, assumption; any asymmetry (ifproperly documented) could be depicted asdifferent proportional areas.
Individual stimulus observations. Thestimuli are individually observed. Switchesin observation are made between the com-parison stimuli, not between the sample andone comparison which might be possible (butdid not occur) in SMTS. These are not reallyassumptions but rather are conclusions fromobserving the pigeons in the experiments.However, they may be assumptions for ex-tending the model to other MTS results.
Decision-process repetition. The first ob-served comparison is evaluated according tothe particular match criteria selected forthat trial. If a match is rejected, the second

206 ANTHONY A. WRIGHT AND STEPHEN F. SANDS
comparison is evaluated, a possible returnto the first, and so on, until a match is made.On normal matching trials (e.g., trainingtrials), the same match criteria are appliedon each observation. This is the Markov as-sumption of path independence, unchangingprobabilities no matter how many (or few)switches are made. A corollary is that thereis no forgetting. However, on trials in whichboth comparisons grossly mismatch the sam-ple (e.g., some test trials), it is assumed thatthe pigeons may relax their match criteriaand apply these new probabilities in theMarkovian fashion, as before, until a matchis achieved.
The Model
The model is quite simple and straight-forward, and it involves only a little algebra.Given proportions for correctly and incor-rectly making the match response (hits andfalse alarms, respectively), one can computethe probabilities that the pigeon will termi-nate the trial after any number of switches,and whether it will be correct or incorrect.Figure 9 is an example of the computing for-mulas for correct and incorrect performanceas a function of observation switches fortrials containing a green sample stimulusand a red incorrect comparison. Computa-tions would be the same for red sample trialsif all the g's were changes to r's and viceversa. Different shadings identify the sepa-rate areas of these distributions delimited bythe criteria lines. These areas are identifiedby a capital letter and a small letter. Thecapital letter refers to the typical humancolor name applied to the stimulus, e.g., red(R), and the small letter refers to the mo-mentary color or hue perceived. Thus, Rrmeans a red stimulus perceived as red, Rgmeans a red stimulus perceived as green, Grmeans a green stimulus perceived as red, Ggmeans a green stimulus perceived as green,and Gb means a green stimulus perceivedas blue. The two comparison stimuli in thisexample are green and red, but the bluestimulus-effects distribution is shown (dashedcurve) because it appears on other trials anda match criterion is adopted with regard toit. When the sample is observed, there is noway to tell which incorrect one (red or blue)will be used. Presumably the subject must
be prepared for either, and Roitblat (1980)found evidence that preparation is made dur-ing the sample observation or slightly there-after.
The probabilities of being correct and in-correct for zero to three switches are shownin the table in Figure 9. The factor 1/2means that there is a 50/50 chance of firstobserving the correct green comparison (in-stead of the incorrect red one). The condi-tional probability of a trial termination aftera particular number of switches is the rowsum (the correct plus incorrect rate) for thatnumber of switches. The overall correct rate(or incorrect rate) is the appropriate col-umn sum.
The probability that this first observedgreen comparison will be accepted as amatch is Gg. The probability that the pigeonwill make one switch and be correct (1/2RrGg) is the probability that the incorrectcomparison will be first observed (1/2),times the probability (Rr) that it will be cor-rectly rejected as match, times the proba-bility (Gg) that the other comparison (green)will be accepted as a match. One more ex-ample will be considered which is the prob-ability of an error after three switches: 1/2(Gr + Gb) X Rr X (Gr + Gb) X Rg. Thepigeon first observes the (correct) greencomparison, but incorrectly rejects it as amatch with a probability (Gr + Gb). It thenobserves the red comparison on the otherside and correctly rejects it as a match witha probability (Rr). It next reobserves thecorrect green comparison, but once againrejects it as a match with probability(Gr + Gb). It then switches back to the redcomparison, and this time perceives it asgreen and incorrectly accepts it as a matchwith a probability (Rg). There are similarequations for even more switches than shownin Figure 9. Theoretically any number ofswitches is possible, but the probabilitiesquickly become small in most cases. As thenumber of switches approaches infinity, forexample, the probability of being correct,P(C), on a green sample trial with an in-correct red comparison will converge on:P(C) green
= ( l /2)Gg/[ l - (Gr + Gb)Rr]
+ (1/2) RrGg/[l- (Gr + Gb)Rr],where the first term of the sum is for even-

MODEL OF MATCHING TO SAMPLE 207
Distribution of StimulusEffects from the
Alternative (Blue)Incorrect Comparison
Distribution from theCorrect (Green) Comparison
Stimulus Effects Scale of Hue
Distribution of StimulusEffects from the Incorrect
(Red) ComparisonRr
Gr
Observation Switches
0123
Correct Rate
VzGgVzRrxGg
V2(Gr + Gb)xRrxGg1/2Rrx(Gr + Gb)xRrxGg
Incorrect Rate
V2RgVz(Gr+Gb)xRg
V2Rrx(Gr + Gb)xRgV2(Gr+Gb)xRrx(Gr+Gb)xRg
Figure 9. Hypothetical distributions of stimulus effects from the comparison stimuli. (The letters areabbreviations for the human color names: red, green, and blue. Capital letters refer to the stimulithemselves, whereas the lowercase letters refer to the psychological perception of the stimuli. Capitaland lowercase dyads refer to particular portions of each distribution delimited by the criteria lines. Thedashed distribution is for the stimulus effects of the blue comparison, which was not actually presentduring the trial but which frequently is present on other trials with the same green sample stimulus.)
numbered switches with the green compar-ison first observed and the second term ofthe sum is for odd-numbered switches withthe red comparison first observed. The twoseries are of the form a + ar + ar1. . . ar"and will converge on a/( 1 - r) as n —> oo(Taylor, 1959, p. 462), where r = (Gr + Gb)Rr, and a = 1/2 Gg for one series and 1/2RrGg for the other series.
This is a Markov process model of theform, random walk with absorbing barriers(see Atkinson, Bower, & Crothers, 1965;Bower, 1959, particularly Model B; Spence,1960; Still, 1976). In random-walk-modelterms, comparison stimulus observations areintermediary states between the sample ob-servation and the comparison choice (ab-sorbing barrier). The transition probabilityfrom a sample observation state to compar-ison observation state is close to unity for thepreferred side (some pigeons have a rightpreference and others a left one). Observa-tion switches occur between the side stimuli.Although the SMTS pigeons reobserved the
sample regularly between switches, theyrarely returned to the same side before ob-serving the comparison on the alternativeside. Atkinson et al. (1965, p. 184) criticizedthe general usefulness of random-walk mod-els because of their lack of what they called"representation" theory, i.e., representingthe states and transition probabilities interms of the experimental procedures andthe behavior of the subjects. The model de-veloped in this article, however, is closelytied to observations of the pigeons' move-ments, the contingencies of the experimentalsetting, and the psychophysics of the detec-tions required.
The Model and Training TrialPerformance in the DelayedMatching Task
Distributions of stimulus effects, shownin the figures to follow, represent the collec-tive distributions of stimulus effects for the88 different wavelengths used as sample and

208 ANTHONY A. WRIGHT AND STEPHEN F. SANDS
comparison stimuli. This is a reasonable rep-resentation because the distribution for eachstimulus is probably identical on a hue scaleof stimulus effects, and the two possible in-correct stimuli on each trial were selectedaccording to the pigeon's hue disciminability(Wright, 1972, 1974, 1978,) to be the samehue distance from the sample stimulus, andthe same distance for all of the 88 differentsample stimuli.
The individual results for the three pi-geons in the delayed matching task were sim-ilar to one another and therefore were av-eraged across subjects. The parameters, hits(e.g., Gg) and correct negatives (e.g., Rr)were estimated from the average correct rateon zero and one observation switch, respec-tively. Other parameters are easily com-puted from these two values. The Gg param-eter fixes the criteria lines relative to thecorrect comparison distribution, and the Rrparameter fixes the incorrect comparisondistributions relative to the criteria lines.The results of these parameter estimationsfor the easy and difficult DMTS discrimi-nations are shown in the left-and right-handpanels of Figure 10, respectively. Only oneincorrect comparison is presented on eachtraining trial. The other possible incorrectcomparison distribution is included in the
figure because its presence makes clearerwhy there should be the left-hand criterionline. The model accounts for both sets, ofdata quite well. The obtained-predicted cor-respondence for correct performance is verygood, but admittedly some of this good cor-respondence results from the parameter es-timation method. Correspondence for incor-rect performance is also very good, and thiscorrespondence has not been forced by theparameter estimation method. Table 2 showsthe results of Kolmogorov-Smirnov goodnessof fit tests on the cumulative trial termina-tion probability, conditional upon an incor-rect response. In both tests, the simple Mar-kov process model fits very well.
There are three major outcomes revealedby this modeling of the DMTS data whichhighlight some of the strengths of this theorycombining signal detection theory (SDT)with a random-walk model: (a) The DMTSstrategy was Markovian. (b) As the discrim-ination was made more difficult, the twodistributions moved closer to one another.In SDT parlance, d' (a measure of distancebetween the distribution means) decreased,(c) As the discrimination was made moredifficult, the criteria lines moved closer toone another (the right-hand panel of Figure10 shows this graphically), showing that the
, og Easy DlierMnitlonDHMMIM ol SIMM EltKtl /"'"Hen" trtitll
/ OlitillmlUn from tin/ Comet Cwnplrlion
DMnWin H StlmuRii ElfictiInn IM Innrrict Cmiporiton
0 1 2 0 1 2 0 1 2 3 0
Switches In Observation ol Comparison Stimuli Biloro Correct/Incorrect Cnoloo Rnpoim
Figure 10. Average performance and model predictions for the pigeons in the delayed matching-to-sample task in Experiment 1 with an easy discrimination and in Experiment 2 with a difficult discrim-ination. (The match criteria were placed symmetrically with regard to the distribution of stimulus effectsfor the correct comparison in order to fit the choice proportion for the 0-switch category on correct trials.The distributions of stimulus effects for the correct and incorrect comparisons were then positionedrelative to the criteria lines in order to fit the correct choice proportion for the 1-switch category.)

MODEL OF MATCHING TO SAMPLE 209
Table 2Goodness of Fit Tests (Kolmogorov-Smirnov)for the Cumulative Conditional Probabilitiesof Being Incorrect in Delayed Matching
Difficult Easy
Switches Obtained Predicted Obtained Predicted
0123
rfmw
p
.845
.9611.001.00
.872 .941
.926 1.000
.962*1.00
.038>.90
.960*1.000
.019>.90
Note. Sample size was 180 for the easy discriminationand 275 for the difficult discrimination. The asteriskdenotes maximum difference (</max) between predictedand obtained.
model also indicates that the pigeons usedstricter match criteria in the difficult dis-crimination than in the easy discrimination.
The Model and Test, Trial Performance inthe Delayed Matching Task
Test trials are unusual trials from thestandpoint of a matching rule. They are"impossible" trials in the sense that there isno physical match provided and no rewardavailable. A more exact understanding of thepigeons' matching rules (strategies) may berevealed by pushing the rules to their limitsthrough test trials, even though the strate-gies themselves may break down at somepoint.
Test trial results were modeled by makingthe reasonable assumption that the pigeonsenter each test trial employing the samematch criteria used on that session's trainingtrials. The sample stimulus cannot itself in-dicate a test trial; all test-trial sample stimuliwere also used twice as training-trial samplestimuli. Even the first observed comparisonwill probably not be revealing; large-hue-difference test-trial comparisons mismatchthe sample by the same hue distance (44steps) as the incorrect training-trial com-parison in the easy discrimination.
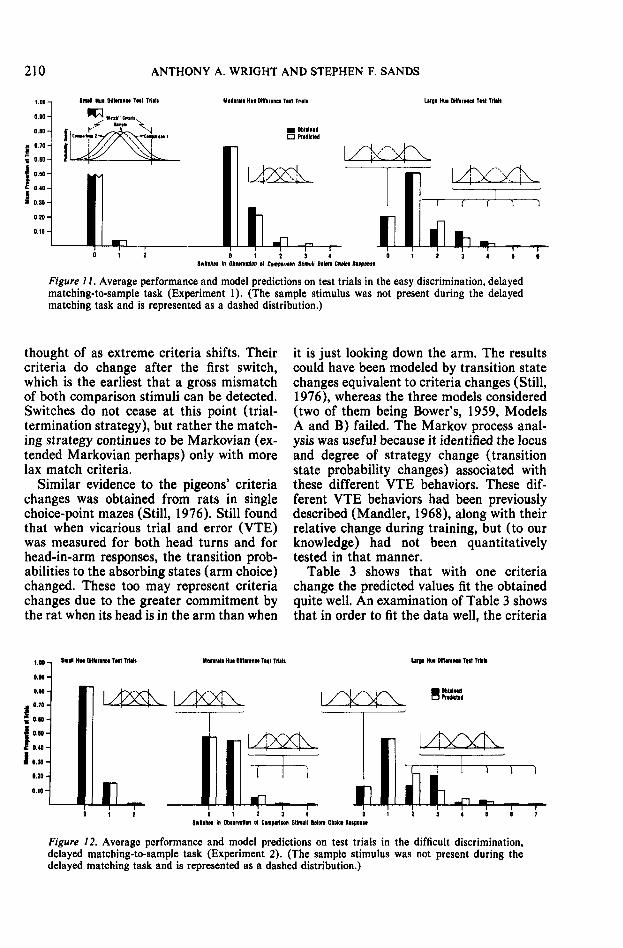
Modeling of the average DMTS test trialperformance is shown in Figures 11 and 12.Sample stimulus-effects distributions are in-dicated by dashed lines because the samplewas removed before the pigeons made theircomparison choices. The comparison stimuli
distributions were positioned relative to thematch criteria by estimating the probabilityof test comparison choices from the obtained0-switch proportion; for example, on mod-erate-hue-difference test trials (Figure 11)the 0-switch proportion is .697. Seventy per-cent of the distribution is placed between thecriteria lines. The predicted 1-switch pro-portion is the probability of a match rejec-tion on the first comparison observation(1.000 - .697) times the probability of anacceptance on the second comparison obser-vation (.697), or .303 X .697 = .211.
The model accounts well for small-hue-difference test-trial results using the samecriteria as those employed on training trials.Table 3 (bottom) shows the cumulativetrial-termination probabilities for successiveswitch classes on small-hue-difference testtrials. The predicted values in neither casedeviate significantly from those obtained.However, on large-hue-difference test trials,and in one instance (difficult discrimination)on moderate-hue-difference test trials, themodel values using training-trial criteria aresignificantly different (p -^ .0001) from theobtained values. These instances, in whichthe predicted and obtained differ, represent,it will be argued, changes in the subjects'match criteria.
Criteria changes are intuitively reason-able. The pigeons, faced with an unsolvableproblem in which both comparison stimuligrossly mismatch the sample, may be mak-ing a compromise between accuracy and ef-fort. If there were no compromise (criteriashifts), then in the difficult discriminationon large-hue-difference test trials we wouldhave expected one occurrence of 21 or moreswitches and, of course, more occurrencesof slightly fewer numbers of switches. Thiswould have been an extremely effortful andtime-consuming process. The largest numberof switches observed was only seven. Fromthe strictly quantitative standpoint, a dis-crimination change (moving the distribu-tions closer) could have accomplished themodeling, but this is not intuitively reason-able because the stimuli did not change.Likewise, the pigeons do not seem to changetheir basic Markovian rule and, for example,terminate the trial to get out of the test sit-uation. However, such strategies could be
210 ANTHONY A. WRIGHT AND STEPHEN F. SANDS
1.00-
0.00
0,60
0.50 -
0.40 -
0.3,-0,20-
0.10-
Smill HIH Dffltrinci T«t Trlilt MUlllle Hill Dlfllrinet Till TiMi
• OmilmdO PiMieHd
Lirgi Kin OHInilKI Till Trim
0 1 2 3 4 0S»IMn In Obiinitttm il Compiriun Stimuli Oifrn Crutci Hiipinn
/ / . Average performance and model predictions on test trials in the easy discrimination, delayedmatching-to-sample task (Experiment 1). (The sample stimulus was not present during the delayedmatching task and is represented as a dashed distribution.)
thought of as extreme criteria shifts. Theircriteria do change after the first switch,which is the earliest that a gross mismatchof both comparison stimuli can be detected.Switches do not cease at this point (trial-termination strategy), but rather the match-ing strategy continues to be Markovian (ex-tended Markovian perhaps) only with morelax match criteria.
Similar evidence to the pigeons' criteriachanges was obtained from rats in singlechoice-point mazes (Still, 1976). Still foundthat when vicarious trial and error (VTE)was measured for both head turns and forhead-in-arm responses, the transition prob-abilities to the absorbing states (arm choice)changed. These too may represent criteriachanges due to the greater commitment bythe rat when its head is in the arm than when
it is just looking down the arm. The resultscould have been modeled by transition statechanges equivalent to criteria changes (Still,1976), whereas the three models considered(two of them being Bower's, 1959, ModelsA and B) failed. The Markov process anal-ysis was useful because it identified the locusand degree of strategy change (transitionstate probability changes) associated withthese different VTE behaviors. These dif-ferent VTE behaviors had been previouslydescribed (Mandler, 1968), along with theirrelative change during training, but (to ourknowledge) had not been quantitativelytested in that manner.
Table 3 shows that with one criteriachange the predicted values fit the obtainedquite well. An examination of Table 3 showsthat in order to fit the data well, the criteria
g _ Sun Hill Offliruti Tut Trim Mrtintt Hue Olflmnn Tut null Urgi Hill DKIirno Till Trllll
0 1 2 3 4 0S«ltc».l In Obiirvillon il Cimplrllin Stimuli Irtm Chttt Rlipon.i
Figure 12. Average performance and model predictions on test trials in the difficult discrimination,delayed matching-to-sample task (Experiment 2). (The sample stimulus was not present during thedelayed matching task and is represented as a dashed distribution.)
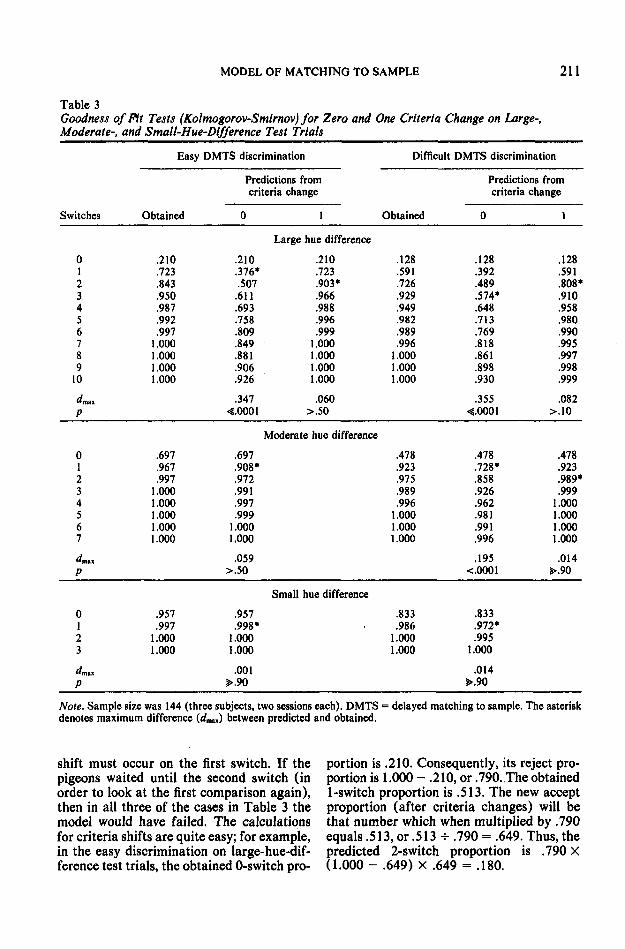
MODEL OF MATCHING TO SAMPLE 211
Table 3Goodness of Pit Tests (Kolmogorov-Smirnov) for Zero and One Criteria Change on Large-,Moderate-, and Small-Hue-Difference Test Trials
Switches
Easy DMTS discrimination
Obtained
Predictions fromcriteria change
0 1
Difficult DMTS discrimination
Predictions fromcriteria change
Obtained
.957
.9971.0001.000
Large hue difference
0123456789
10
<*max
P
.210
.723
.843
.950
.987
.992
.9971.0001.0001.0001.000
.210
.376*.507
.611
.693
.758
.809
.849,881.906.926
.3474.0001
.210
.723
.903*
.966
.988
.996
.9991.0001.0001.0001.000
.060>.50
.128
.591
.726
.929
.949
.982
.989
.9961.0001.0001.000
.128
.392
.489
.574*
.648
.713
.769
.818
.861
.898
.930
.3554.0001
.128
.591
.808*
.910
.958
.980
.990
.995
.997
.998
.999
.082>.10
Moderate hue difference
01234567
"max
P
.697
.967
.9971.0001.0001.0001.0001.000
.697
.908*
.972
.991
.997
.9991.0001.000
.059>.50
.478
.923
.975
.989
.9961.0001.0001.000
.478
.728*
.858
.926
.962
.981
.991
.996
.195<.0001
.478
.923
.989*
.9991.0001.0001.0001.000
.014J..90
Small hue difference
.957
.998*1.0001.000
.001
.833
.9861.0001.000
.833
.972*
.9951.000
.014
Note. Sample size was 144 (three subjects, two sessions each). DMTS = delayed matching to sample. The asteriskdenotes maximum difference (rfmM) between predicted and obtained.
shift must occur on the first switch. If thepigeons waited until the second switch (inorder to look at the first comparison again),then in all three of the cases in Table 3 themodel would have failed. The calculationsfor criteria shifts are quite easy; for example,in the easy discrimination on large-hue-dif-ference test trials, the obtained 0-switch pro-
portion is .210. Consequently, its reject pro-portion is 1.000 - .210, or .790. The obtained1-switch proportion is .513. The new acceptproportion (after criteria changes) will bethat number which when multiplied by .790equals .513, or .513 -r .790 = .649. Thus, thepredicted 2-switch proportion is .790 X(1.000- .649) X .649 = .180.

212 ANTHONY A. WRIGHT AND STEPHEN F. SANDS
Figures 11 and 12 show that the distri-butions are close together on small-hue-dif-ferent test trials and progressively pull apartfor moderate- and large-hue-difference testtrials. These distribution changes, which oc-cur in a manner that is expected from thepsychophysics of the experiment, are impor-tant for the validity of the model. It is in-teresting that in the difficult discriminationthe criteria changes were greater for thelarge-hue-difference than for moderate-hue-difference test trials. In the easy discrimi-nation, there was no criteria change on mod-erate-hue-difference test trials; this possiblymeans that these mismatches were not asgross in the context of the differences im-portant on training trials. Taken together,these results may mean that criteria changeis a graded process and that it has a thresh-old for elicitation.
The Model and Test Trial Performance inthe Simultaneous Task
The four pigeons in the simultaneousmatching task had the sample stimulus pres-ent throughout the matching trial, and thesample stimulus-effects distribution is shownby a solid line rather than a dashed one. Themodel predictions and the performance ofthe pigeons in both the easy and difficultdiscriminations are shown in Figure 13. Sim-ilar to the DMTS modeling, the model pa-rameters were chosen by using the samematch criteria that the pigeons had em-ployed on training trials, and then the matchacceptance parameter (and, consequently,the relative position of the two comparisondistributions) was estimated from the 0-switch performance.
There are many similarities to the mod-eling of DMTS performance: (a) The dis-tributions of stimulus effects are close to-gether for small-hue-difference test trialsand progressively separate as the hue dif-ference increases, (b) The pigeons adoptedstricter criteria in the difficult discriminationthan they did in the easy discrimination, (c)A shift to more lax criteria was made onmoderate- and large-hue-difference testtrials.
The shift to more lax criteria was madein two steps, however, rather than a single
one as in DMTS. Figure 13 shows that onlarge-hue-difference test trials "there is a pro-gressive increase in the obtained frequencyfrom the 0-switch through 2-switch catego-ries, and a progressive decline thereafter. Bycontrast, the random-walk model predictsonly a progressive decline; the 0-switch cat-egory should be most numerous. Each switchadds to the probability expression (see Fig-ure 9) a multiplicative term that is less than1.0. Specifically, the frequency of switchesshould be geometrically distributed (Atkin-son et al. 1965, p. 160).
Table 4 shows that on small-hue-differ-ence test trials there are no criteria changes.The pigeons persist with their original Mar-kov probabilities (the ones used on trainingtrials), and the fit is very good.
On moderate- and large-hue-differencetest trials, however, the predicted and ob-tained values greatly differ when there is nocriteria change. They relinquish their orig-inal probabilities and relax their match cri-teria. Otherwise, it would have been an ar-duous process indeed; we would haveexpected to have observed at least one trialwith 35 or more switches out of the numberof trials observed. The moderate-hue-differ-ence test-trial results are fit well (p > .80)by one criteria change, but large-hue-differ-ence ones are not similarly well fit (p <£.001). Two criteria changes are required tofit these latter cases, and even then the fitis not very good in the difficult discrimina-tion. It should be remembered when evalu-ating the effects of these test trials on thisMTS model that they are anomalous match-ing trials. They may serve to highlight cer-tain normal matching processes, but theymay also introduce new processes of whichcriteria shifts may be an example. Pigeonsmay be in substantial conflict with theiradopted strategies when faced with grossmismatches in both comparison stimuli. Un-like their DMTS counterparts for which thesample has been removed, SMTS pigeonscan recheck the sample. Figures 5 and 7show that they do recheck the sample duringtheir first and second switches. However,they also recheck the sample on small-hue-difference test trials, almost as much as onlarger ones, but they do not relax their matchcriteria. They stick to their original Markov
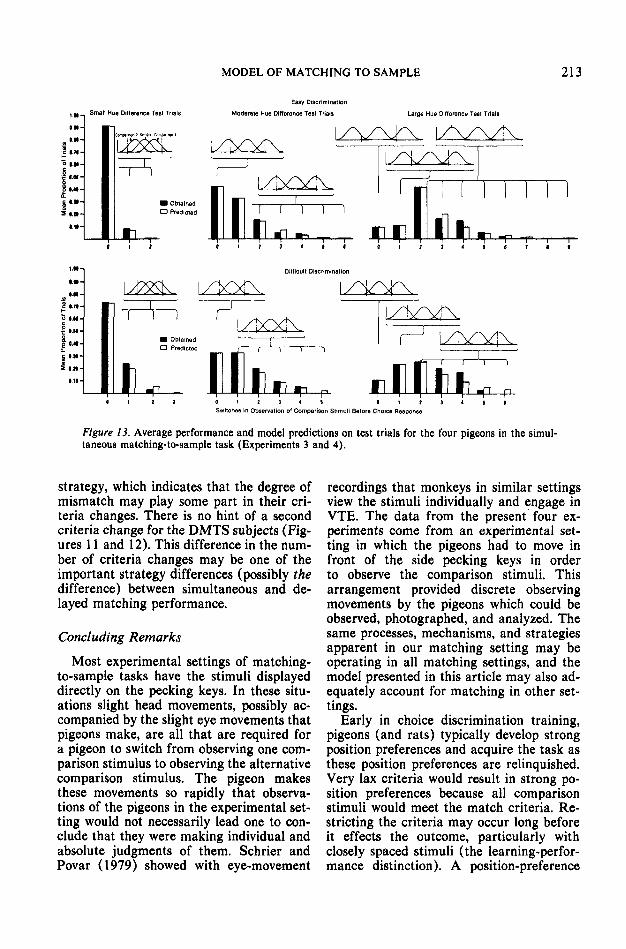
MODEL OF MATCHING TO SAMPLE 213
l.M -.
O.N-
Sma" Hue Difference Test Trials
Easy Discrimination
Moderate Hue Difference Test Trials Large Hue Difference Test Trials
Mea
n P
roportio
n o
f T
rials
i ;
» * i
£ ; i ; i
ypSSK~1 1
[ i i• Obtad Pred
1-,.
Difficult Discrimination
i i>/lwf\
Switches in Observation of Comparison Stimuli Before Choice Response
Figure 13. Average performance and model predictions on test trials for the four pigeons in the simul-taneous matching-to-sample task (Experiments 3 and 4).
strategy, which indicates that the degree ofmismatch may play some part in their cri-teria changes. There is no hint of a secondcriteria change for the DMTS subjects (Fig-ures 11 and 12). This difference in the num-ber of criteria changes may be one of theimportant strategy differences (possibly thedifference) between simultaneous and de-layed matching performance.
Concluding Remarks
Most experimental settings of matching-to-sample tasks have the stimuli displayeddirectly on the pecking keys. In these situ-ations slight head movements, possibly ac-companied by the slight eye movements thatpigeons make, are all that are required fora pigeon to switch from observing one com-parison stimulus to observing the alternativecomparison stimulus. The pigeon makesthese movements so rapidly that observa-tions of the pigeons in the experimental set-ting would not necessarily lead one to con-clude that they were making individual andabsolute judgments of them. Schrier andPovar (1979) showed with eye-movement
recordings that monkeys in similar settingsview the stimuli individually and engage inVTE. The data from the present four ex-periments come from an experimental set-ting in which the pigeons had to move infront of the side pecking keys in orderto observe the comparison stimuli. Thisarrangement provided discrete observingmovements by the pigeons which could beobserved, photographed, and analyzed. Thesame processes, mechanisms, and strategiesapparent in our matching setting may beoperating in all matching settings, and themodel presented in this article may also ad-equately account for matching in other set-tings.
Early in choice discrimination training,pigeons (and rats) typically develop strongposition preferences and acquire the task asthese position preferences are relinquished.Very lax criteria would result in strong po-sition preferences because all comparisonstimuli would meet the match criteria. Re-stricting the criteria may occur long beforeit effects the outcome, particularly withclosely spaced stimuli (the learning-perfor-mance distinction). A position-preference

214 ANTHONY A. WRIGHT AND STEPHEN F. SANDS
Table 4Goodness of Fit Tests (Kolmogorov-Smirnov) for Zero, One, and Two Criteria Changeson Large-, Moderate-, and Small-Hue-Difference Test Trials
Easy SMTS discrimination
Predictions fromcriteria changes
Difficult SMTS discrimination
Predictions fromcriteria changes
Switches Obtained Obtained
Large hue difference
0123456789
10
</m.x
P
.095
.205
.620
.780
.923
.976
.994
.9971.0001.0001.000
.095
.181
.259
.329
.393*
.451
.503
.550
.593
.632
.667
.530<0001
.095
.205
.302
.387
.462*
.528
.586
.637
.681
.720
.754
.461«.0001
.095
.205
.620
.818*
.913
.958
.980
.990
.995
.997
.998
.038>.90
.105
.340
.593
.796
.966
.000
.000
.000
.000
.000
.000
.105
.199
.283
.358
.425*
.485
.538
.586
.629
.667
.702
.541<0001
.105
.340
.513
.641
.735*
.804
.855
.893
.921
.941
.956
.231<0001
.105
.340
.593
.749
.845*
.904
.940
.963
.977
.986
.991
.121>.005
Moderate hue difference
01234567
(/max
P
.420
.745
.898
.947
.988
.9981.001.00
.420
.660
.800*
.882
.930
.958
.974
.983
.098=.05
.420
.745
.888
.960*
.978
.990
.995
.997
.013>.90
.324
.648
.852
.9481.0001.0001.0001.000
.324
.543
.691*
.791
.859
.905
.936
.957
.161=.0001
.324
.648
.817
.905
.951*
.975
.988
.995
.049>.80
Small hue difference
01234
</max
P
.910
.9931.0001.0001.000
.910
.992*
.9991.0001.000
.001S>.90
.729
.9691.0001.0001.000
.729
.927*
.981
.9961.000
.042>.90
Note. Sample size was 192 (four subjects, two sessions each). SMTS = simultaneous matching to sample. Theasterisk denotes maximum difference (rfmas) between predicted and obtained.
shift from, say, the right to the left side keymay result from a tightening of the criteriafor the first observed comparison stimulusand from a loosening of the criteria for thesecond observed comparison stimulus. Pi-geons in a simultaneous matching task mayhave an advantage over their delayed coun-
terparts because they can better minimizefalse alarms (errors) by relaxing the matchcriteria twice instead of once. A small initialperformance advantage might feed backupon itself to foster a more rapid adjustmentto appropriate criteria values and producethe large performance difference observed.

MODEL OF MATCHING TO SAMPLE 215
Our experience with matching researchwith pigeons is that any change or disruptionin the task, chamber, or stimuli will causean increase in position preference and a con-comitant performance decrement. This po-sition preference is likely the result of achange to more lax criteria. Novel stimulican have the same result. Thus, attempts todiscover evidence for a generalized matchingconcept may fail. The pigeon upon seeingthe novel sample stimulus may adopt matchcriteria that do not sufficiently minimizefalse alarms, and consequently it will choosecomparison stimuli that do not match thesample stimulus. This theoretical scheme in-corporates the coding hypothesis of Gum-ming et al. (1965) if the concept of a codeis translated into "appropriate match crite-ria." Pigeons might require experience andpractice with novel stimuli in order to adoptappropriate match criteria and accuratelymatch. They may initially employ criteriaappropriate only for the old familiar stimuliand thus choose the familiar comparison in-stead of the correct novel comparison, a re-sult supporting Premack's (1978) absoluteresponding hypothesis. The appropriate cri-teria are by definition appropriate only fora specific stimulus. Thus, this theoreticalscheme also incorporates the hypothesis ofCarter and Eckerman (1975) by predictingperformance that can be cast into specific"if. . . then . . ." rules. On the other hand,it seems possible that pigeons might be ca-pable of applying sufficiently strict criteriato a completely novel (orthogonal) stimulussuch that only its identity would be chosen.Stated thus, it is a bias problem, not one oflimits on pigeon intelligence or other capa-bilities. The experimental outcomes need tobe made sufficiently rewarding (or punish-ing) so that the consequences of strict cri-teria (reinforcement density vs. switch ef-fort) will be more desirable than thoseresulting from lax criteria.
The model proposed in this article is morethan a mathematical expression to summa-rize performance. It is tied directly to overtmovements and to the discrimination re-quired: Observe a comparison stimulus; if itmeets the match criteria, peck it; if not,switch and repeat the process. This is a sim-ple set of strategies, specified by the model
from which many predictions may be de-rived, which is a departure from current con-ceptualizations of the pigeons' matching-to-sample behavior.
References
Anger, D. The dependence of interresponse times uponthe relative reinforcement of different interresponsetimes. Journal of Experimental Psychology,. 1956,53, 145-161.
Atkinson, R. C. The use of models in experimental psy-chology. Synthese, 1960, 12, 162-171.
Atkinson, R. C., Bower, G. H., & Crothers, E. J. Anintroduction to mathematical learning theory. NewYork: Wiley, 1965.
Blough, D. S. Spectral sensitivity in the pigeon. Journalof the Optical Society of America, 1957, 47, 826-833.
Bower, G. H. Choice point behavior. In R. R. Bush& W. K. Estes (Eds.), Studies in MathematicalLearning Theory. Stanford, Calif.: Stanford Univer-sity Press, 1959.
Bower, G. H. Response strengths and choice probability:A consideration of two combination rules. In E. Na-gel, P. Suppes, & A. Taski (Eds.), Logic, method-ology and philosophy of science: Proceedings of theI960 International Congress. Stanford, Calif.: Stan-ford University Press, 1962.
Brown, J. Some tests of the decay theory of immediatememory. Quarterly Journal of Experimental Psy-chology, 1958, 10, 12-21.
Carter, D. E., & Eckerman, D. A. Symbolic matchingby pigeons: Rate of learning complex discriminations.Science, 1975, 187, 662-664.
Gumming, W. W., Berryman, R., & Cohen, L. R. Ac-quisition and transfer of zero delay matching. Psy-chological Reports, 1965, 17, 435-445.
D'Amato, M. R. Delayed matching and short-termmemory in monkeys. In G. H. Bower (Ed.), The psy-chology of learning and motivation: Advances in re-search and theory (Vol. 7). New York: AcademicPress, 1973.
Egan, J, P. Signal detection theory and ROC analysis.New York: Academic Press, 1975.
Estes, W. K. A random walk model for choice behavior.In K. J. Arrow, S. Karlin, & P. Suppes (Eds.), Math-ematical methods in the social sciences. Stanford,Calif.: Stanford University Press, 1960.
Etkin, M. W. Light produced interference in a delayedmatching task with capuchin monkeys. Learning andMotivation, 1972, 3, 313-324.
Farthing, G. W., & Opuda, M. J. Transfer of matching-to-sample in pigeons. Journal of the ExperimentalAnalysis of Behavior, 1974,27, 199-213.
Grant, D. S., & Roberts, W. A. Sources of retroactiveinhibition in pigeon short-term memory. Journal ofExperimental Psychology: Animal Behavior Pro-cesses, 1976, 2, 1-16.
Hall, G. Overtraining and reversal learning in the rat:Effects of stimulus salience and response strategies.Journal of Comparative and Physiological Psychol-ogy, 1973, 84, 169-175.

216 ANTHONY A. WRIGHT AND STEPHEN F. SANDS
Herrnstein, R. J., Loveland, D. H., & Cable, D. Naturalconcepts in pigeons. Journal of Experimental Psy-chology: Animal Behavior Processes, 1976, 2, 285-302.
Lubow, R. E. Higher-order concept formation in thepigeon. Journal of the Experimental Analysis of Be-havior, 1974, 21, 475-483.
Maki, W. S., Jr., & Leith, C. R. Shared attention inpigeons. Journal of the Experimental Analysis ofBehavior, 1973, 19, 345-349.
Maki, W. S., Jr., Moe, J. C., & Bierley, C. M. Short-term memory for stimuli, responses, and reinforcers.Journal of Experimental Psychology: Animal Be-havior Processes, 1977, 3, 156-177.
Maki, W. S., Jr., Riley, D. A., & Leith, C. R. The roleof test stimuli in matching to compound samples bypigeons. Animal Learning & Behavior, 1976, 4, 13-21.
Malott, R. W., & Siddall, J. W. Acquisition of the peo-ple concept in pigeons. Psychological Reports, 1972,31, 3-13.
Mandler, J. M. Behavior changes during overtrainingand their effects on reversal and transfer. Psycho-nomic Monograph Supplement, 1966, /, 187-202.
Mandler, J. M. Overtraining and the use of positive andnegative stimuli in reversal and transfer. Journal ofComparative and Physiological Psychology, 1968,66, 110-115.
Morgan, M. J. Fitch, M. D., Holman, J. G., & Lea,S. E. G. Pigeons learn the concept of an 'A.' Percep-tion, 1976, 5, 57-66.
Pietrewicz, A. T., & Kamil, A. C. Visual detection ofcryptic prey by blue jays (Cyanocitta cristata). Sci-ence, 1977, 195, 580-582.
Poole, J., & Lander, D. G. The pigeon's concept of pi-geon. Psychonomic Science, 1971, 25, 157-158.
Premack, D. On the abstractness of human concepts:Why it would be difficult to talk to a pigeon. InS. H. Hulse, H. Fowler, & W. K. Honig (Eds.), Cog-nitive processes in animal behavior, Hillsdale, N.J.:Erlbaum, 1978.
Pullen, M. R., & Turney, T. H. Response modes insimultaneous and successive visual discriminations.Animal Learning & Behavior, 1977, 5, 73-77.
Reid, L. S. The development of noncontinuity behaviorthrough continuity learning. Journal of ExperimentalPsychology, 1953, 46, 107-112.
Roberts, W. A. Short-term memory in the pigeon: Ef-fects of repetition and spacing. Journal of Experi-mental Psychology, 1972, 94, 74-83.
Roberts, W. A., & Grant, D. S. Studies of short-termmemory in the pigeon using the delayed matching-to-sample procedure. In D. L. Medin, W. A. Roberts,
& R. T. Davis (Eds.), Processes of animal memory.Hillsdale, N.J.: Erlbaum, 1976.
Roberts, W. A., & Grant D. S. Interaction of sampleand comparison stimuli in delayed matching to samplewith the pigeon. Journal of Experimental Psychol-ogy: Animal Behavior Processes, 1978, 4, 68-82.
Roitblat, H. L. Codes and coding processes in pigeonshort-term memory. Animal Learning & Behavior,1980, 8, 341-351.
Schrier, A. M., & Povar, M. L. Eye movements ofstumptailed monkeys during discrimination learning:VTE revisited. Animal Learning & Behavior, 1979,7, 239-245.
Shimp, C. P., & Moffitt, M. Short-term memory in thepigeon: Delayed-pair comparison procedures andsome results. Journal of the Experimental Analysisof Behavior, 1977, 28, 13-25.
Siegel, R. K., & Honig, W. K. Pigeon concept forma-tion: Successive and simultaneous acquisition. Jour-nal of the Experimental Analysis of Behavior, 1970,13, 385-390.
Siegel, S. Discrimination overtraining and shift behav-ior. In R. M. Gilbert & N. S. Sutherland (Eds.),Animal discrimination learning. London: AcademicPress, 1969.
Spence, K. W. Conceptual models of spatial and non-spatial discrimination learning. In K. W. Spence(Ed.), Behavior theory and learning, EnglewoodCliffs, N.J.: Prentice-Hall, 1960.
Still, A. W. An evaluation of the use of Markov modelsto describe the behaviour of rats at a choice point.Animal Behaviour, 1976, 24, 498-506.
Taylor, A. E. Calculus with analytic geometry. Engle-wood Cliffs, N.J.: Prentice-Hall, 1959.
Tolman, E. C. The determiners of behaviors at a choicepoint. Psychological Review, 1938, 45, 1-41.
Wright, A. A. Psychometric and psychological hue dis-crimination functions for the pigeon. Vision Research,1972, 12, 1447-1464.
Wright, A. A, Psychometric and psychophysical theorywithin a framework of response bias. PsychologicalReview, 1974, 81, 332-347.
Wright, A. A. Construction of equal-hue discrimina-bility scales for the pigeon. Journal of the Experi-mental Analysis of Behavior, 1978, 29, 261-266.
Wright, A. A., & Gumming, W. W. Color-naming func-tions for the pigeon. Journal of the ExperimentalAnalysis of Behavior, 1971, 15, 7-17.
Zentall, T. R. Memory in the pigeon: Retroactive in-hibition in a delayed matching task. Bulletin of thePsychonomic Society, 1973, 1, 126-128.
Received July 11, 1980Revision received February 20, 1981 •

Reproduced with permission of the copyright owner. Further reproduction prohibited without permission.