Journal of Chromatography B - magtivio.com
10
Journal of Chromatography B, 1022 (2016) 173–182 Contents lists available at ScienceDirect Journal of Chromatography B journal homepage: www.elsevier.com/locate/chromb Ferromagnetic particles as a rapid and robust sample preparation for the absolute quantification of seven eicosanoids in human plasma by UHPLC–MS/MS Anna Catharina Suhr ∗,1 , Mathias Bruegel 1 , Barbara Maier, Lesca Miriam Holdt, Alisa Kleinhempel, Daniel Teupser, Stefanie H. Grimm, Michael Vogeser Institute of Laboratory Medicine, Hospital of the Ludwig-Maximilians-University Munich, Marchioninistrasse 15, 81377 Munich, Germany a r t i c l e i n f o Article history: Received 4 September 2015 Received in revised form 24 February 2016 Accepted 19 March 2016 Available online 21 March 2016 Keywords: Magnetic particles Eicosanoids Sample preparation Liquid chromatography Mass spectrometry Validation a b s t r a c t We used ferromagnetic particles as a novel technique to deproteinize plasma samples prior to quantita- tive UHPLC–MS/MS analysis of seven eicosanoids [thromboxane B 2 (TXB 2 ), prostaglandin E 2 (PGE 2 ), PGD 2 , 5-hydroxyeicosatetraenoic acid (5-HETE), 11-HETE, 12-HETE, arachidonic acid (AA)]. A combination of ferromagnetic particle enhanced deproteination and subsequent on-line solid phase extraction (on-line SPE) realized quick and convenient semi-automated sample preparation—in contrast to widely used manual SPE techniques which are rather laborious and therefore impede the investigation of AA metabolism in larger patient cohorts. Method evaluation was performed according to a protocol based on the EMA guideline for bioanalytical method validation, modified for endogenous compounds. Calibrators were prepared in ethanol. The cali- bration curves were found to be linear in a range of 0.1–80 ng mL −1 (TXB 2 , PGE 2 , PGD 2 ), 0.05–40 ng mL −1 (5-HETE, 11-HETE), 0.5–400 ng mL −1 (12-HETE) and 25–9800 ng mL −1 (AA). Regarding all analytes and all quality controls, the resulting precision data (inter-assay 2.6 %–15.5 %; intra-assay 2.5 %–15.1 %, expressed as variation coefficient) as well as the accuracy results (inter-assay 93.3 %–125 %; intra-assay 91.7 %–114 %) were adequate. Further experiments addressing matrix effect, recovery and robustness, yielded also very satisfying results. As a proof of principle, the newly developed LC–MS/MS assay was employed to determine the capacity of AA metabolite release after whole blood stimulation in healthy blood donors. For this purpose, whole blood specimens of 5 healthy blood donors were analyzed at baseline and after a lipopolysaccharide (LPS) induced blood cell activation. In several baseline samples some eicosanoids levels were below the Lower Limit of Quantification. However, in the stimulated samples all chosen eicosanoids (except PGD 2 ) could be quantified. These results, in context with those obtained in validation, demonstrate the applicability of ferro- magnetic particles for the sample preparation for eicosanoids in human plasma. Thus, we conclude that ferromagnetic particle enhanced deproteination is a promising novel tool for sample preparation in LC–MS/MS, which is of particular interest for automation in clinical mass spectrometry, e.g. in order to further address eicosanoid analysis in larger patient cohorts. © 2016 Elsevier B.V. All rights reserved. 1. Introduction In the constantly growing field of metabolomics, the lipidomics section plays an important role, addressing a large group of lipid mediators. Among these mediators are the oxylipins, which include ∗ Corresponding author. E-mail address: [email protected] (A.C. Suhr). 1 Both authors contributed equally to this work. polyunsaturated fatty acids (PUFA) and their various metabolites, also referred to as eicosanoids. These lipid mediators are syn- thesized from arachidonic acid (AA) and other polyunsaturated fatty acids by cyclooxygenases (COXs), lipoxygenases (LOXs) and cytochrome P450 monooxygenases (CYPs), but they might also be generated through the non-enzymatic oxidation of unsaturated fatty acids [1]. Several oxylipins affect processes in health and disease, such as inflammation, coagulation, immune response and smooth muscle cell tonus, with partial opposing effects [2]. Thus, a quantita- http://dx.doi.org/10.1016/j.jchromb.2016.03.022 1570-0232/© 2016 Elsevier B.V. All rights reserved.
Transcript of Journal of Chromatography B - magtivio.com

FtU
AAI
a
ARRAA
KMESLMV
1
sm
h1
Journal of Chromatography B, 1022 (2016) 173–182
Contents lists available at ScienceDirect
Journal of Chromatography B
journa l homepage: www.e lsev ier .com/ locate /chromb
erromagnetic particles as a rapid and robust sample preparation forhe absolute quantification of seven eicosanoids in human plasma byHPLC–MS/MS
nna Catharina Suhr ∗,1, Mathias Bruegel 1, Barbara Maier, Lesca Miriam Holdt,lisa Kleinhempel, Daniel Teupser, Stefanie H. Grimm, Michael Vogeser
nstitute of Laboratory Medicine, Hospital of the Ludwig-Maximilians-University Munich, Marchioninistrasse 15, 81377 Munich, Germany
r t i c l e i n f o
rticle history:eceived 4 September 2015eceived in revised form 24 February 2016ccepted 19 March 2016vailable online 21 March 2016
eywords:agnetic particles
icosanoidsample preparationiquid chromatographyass spectrometry
alidation
a b s t r a c t
We used ferromagnetic particles as a novel technique to deproteinize plasma samples prior to quantita-tive UHPLC–MS/MS analysis of seven eicosanoids [thromboxane B2 (TXB2), prostaglandin E2 (PGE2), PGD2,5-hydroxyeicosatetraenoic acid (5-HETE), 11-HETE, 12-HETE, arachidonic acid (AA)]. A combination offerromagnetic particle enhanced deproteination and subsequent on-line solid phase extraction (on-line SPE)realized quick and convenient semi-automated sample preparation—in contrast to widely used manualSPE techniques which are rather laborious and therefore impede the investigation of AA metabolism inlarger patient cohorts.
Method evaluation was performed according to a protocol based on the EMA guideline for bioanalyticalmethod validation, modified for endogenous compounds. Calibrators were prepared in ethanol. The cali-bration curves were found to be linear in a range of 0.1–80 ng mL−1 (TXB2, PGE2, PGD2), 0.05–40 ng mL−1
(5-HETE, 11-HETE), 0.5–400 ng mL−1 (12-HETE) and 25–9800 ng mL−1 (AA). Regarding all analytes and allquality controls, the resulting precision data (inter-assay 2.6 %–15.5 %; intra-assay 2.5 %–15.1 %, expressedas variation coefficient) as well as the accuracy results (inter-assay 93.3 %–125 %; intra-assay 91.7 %–114%) were adequate. Further experiments addressing matrix effect, recovery and robustness, yielded alsovery satisfying results.
As a proof of principle, the newly developed LC–MS/MS assay was employed to determine the capacityof AA metabolite release after whole blood stimulation in healthy blood donors. For this purpose, wholeblood specimens of 5 healthy blood donors were analyzed at baseline and after a lipopolysaccharide (LPS)induced blood cell activation. In several baseline samples some eicosanoids levels were below the LowerLimit of Quantification. However, in the stimulated samples all chosen eicosanoids (except PGD2) couldbe quantified.
These results, in context with those obtained in validation, demonstrate the applicability of ferro-magnetic particles for the sample preparation for eicosanoids in human plasma. Thus, we concludethat ferromagnetic particle enhanced deproteination is a promising novel tool for sample preparation inLC–MS/MS, which is of particular interest for automation in clinical mass spectrometry, e.g. in order tofurther address eicosanoid analysis in larger patient cohorts.
© 2016 Elsevier B.V. All rights reserved.
. Introduction
In the constantly growing field of metabolomics, the lipidomicsection plays an important role, addressing a large group of lipidediators. Among these mediators are the oxylipins, which include
∗ Corresponding author.E-mail address: [email protected] (A.C. Suhr).
1 Both authors contributed equally to this work.
ttp://dx.doi.org/10.1016/j.jchromb.2016.03.022570-0232/© 2016 Elsevier B.V. All rights reserved.
polyunsaturated fatty acids (PUFA) and their various metabolites,also referred to as eicosanoids. These lipid mediators are syn-thesized from arachidonic acid (AA) and other polyunsaturatedfatty acids by cyclooxygenases (COXs), lipoxygenases (LOXs) andcytochrome P450 monooxygenases (CYPs), but they might also begenerated through the non-enzymatic oxidation of unsaturated
fatty acids [1].Several oxylipins affect processes in health and disease, such asinflammation, coagulation, immune response and smooth musclecell tonus, with partial opposing effects [2]. Thus, a quantita-
1 atogr. B 1022 (2016) 173–182
tivpmdpdrbiFe
osntagph(Lmrw
adiimieidfitwtf
poPHs(bms
lveasyoliu
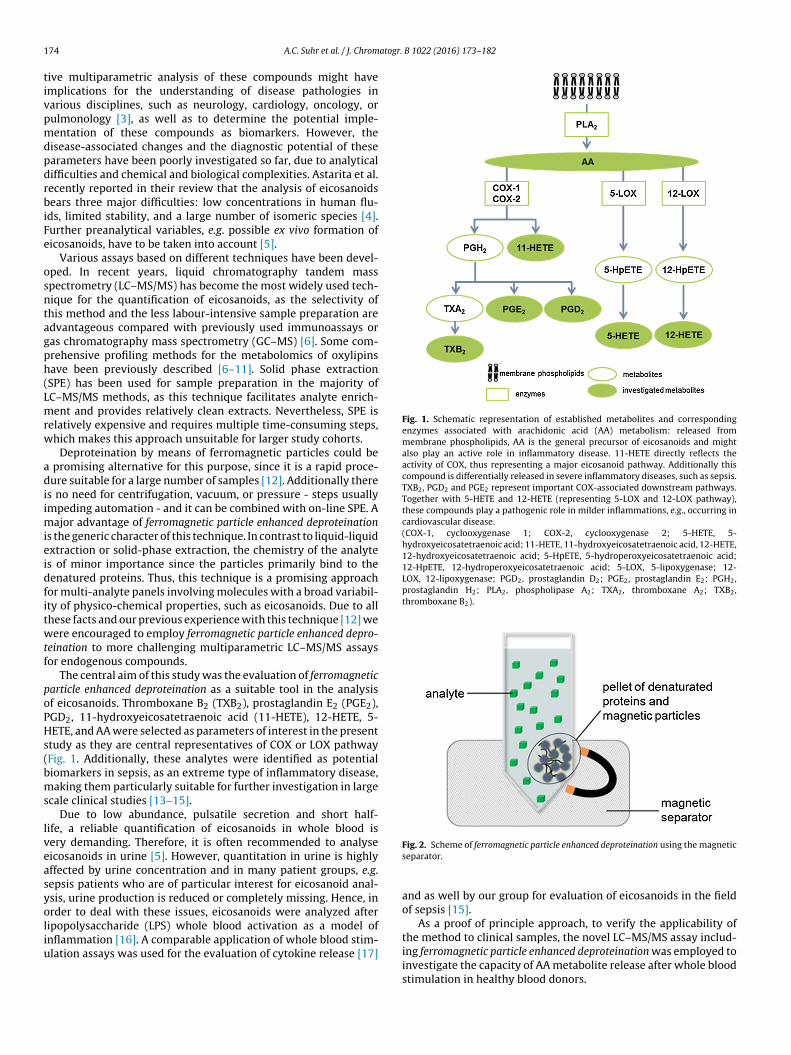
Fig. 1. Schematic representation of established metabolites and correspondingenzymes associated with arachidonic acid (AA) metabolism: released frommembrane phospholipids, AA is the general precursor of eicosanoids and mightalso play an active role in inflammatory disease. 11-HETE directly reflects theactivity of COX, thus representing a major eicosanoid pathway. Additionally thiscompound is differentially released in severe inflammatory diseases, such as sepsis.TXB2, PGD2 and PGE2 represent important COX-associated downstream pathways.Together with 5-HETE and 12-HETE (representing 5-LOX and 12-LOX pathway),these compounds play a pathogenic role in milder inflammations, e.g., occurring incardiovascular disease.(COX-1, cyclooxygenase 1; COX-2, cyclooxygenase 2; 5-HETE, 5-hydroxyeicosatetraenoic acid; 11-HETE, 11-hydroxyeicosatetraenoic acid, 12-HETE,12-hydroxyeicosatetraenoic acid; 5-HpETE, 5-hydroperoxyeicosatetraenoic acid;12-HpETE, 12-hydroperoxyeicosatetraenoic acid; 5-LOX, 5-lipoxygenase; 12-LOX, 12-lipoxygenase; PGD2, prostaglandin D2; PGE2, prostaglandin E2; PGH2,prostaglandin H2; PLA2, phospholipase A2; TXA2, thromboxane A2; TXB2,thromboxane B2).
74 A.C. Suhr et al. / J. Chrom
ive multiparametric analysis of these compounds might havemplications for the understanding of disease pathologies inarious disciplines, such as neurology, cardiology, oncology, orulmonology [3], as well as to determine the potential imple-entation of these compounds as biomarkers. However, the
isease-associated changes and the diagnostic potential of thesearameters have been poorly investigated so far, due to analyticalifficulties and chemical and biological complexities. Astarita et al.ecently reported in their review that the analysis of eicosanoidsears three major difficulties: low concentrations in human flu-
ds, limited stability, and a large number of isomeric species [4].urther preanalytical variables, e.g. possible ex vivo formation oficosanoids, have to be taken into account [5].
Various assays based on different techniques have been devel-ped. In recent years, liquid chromatography tandem masspectrometry (LC–MS/MS) has become the most widely used tech-ique for the quantification of eicosanoids, as the selectivity ofhis method and the less labour-intensive sample preparation aredvantageous compared with previously used immunoassays oras chromatography mass spectrometry (GC–MS) [6]. Some com-rehensive profiling methods for the metabolomics of oxylipinsave been previously described [6–11]. Solid phase extractionSPE) has been used for sample preparation in the majority ofC–MS/MS methods, as this technique facilitates analyte enrich-ent and provides relatively clean extracts. Nevertheless, SPE is
elatively expensive and requires multiple time-consuming steps,hich makes this approach unsuitable for larger study cohorts.
Deproteination by means of ferromagnetic particles could be promising alternative for this purpose, since it is a rapid proce-ure suitable for a large number of samples [12]. Additionally there
s no need for centrifugation, vacuum, or pressure - steps usuallympeding automation - and it can be combined with on-line SPE. A
ajor advantage of ferromagnetic particle enhanced deproteinations the generic character of this technique. In contrast to liquid-liquidxtraction or solid-phase extraction, the chemistry of the analytes of minor importance since the particles primarily bind to theenatured proteins. Thus, this technique is a promising approach
or multi-analyte panels involving molecules with a broad variabil-ty of physico-chemical properties, such as eicosanoids. Due to allhese facts and our previous experience with this technique [12] weere encouraged to employ ferromagnetic particle enhanced depro-
eination to more challenging multiparametric LC–MS/MS assaysor endogenous compounds.
The central aim of this study was the evaluation of ferromagneticarticle enhanced deproteination as a suitable tool in the analysisf eicosanoids. Thromboxane B2 (TXB2), prostaglandin E2 (PGE2),GD2, 11-hydroxyeicosatetraenoic acid (11-HETE), 12-HETE, 5-ETE, and AA were selected as parameters of interest in the present
tudy as they are central representatives of COX or LOX pathwayFig. 1. Additionally, these analytes were identified as potentialiomarkers in sepsis, as an extreme type of inflammatory disease,aking them particularly suitable for further investigation in large
cale clinical studies [13–15].Due to low abundance, pulsatile secretion and short half-
ife, a reliable quantification of eicosanoids in whole blood isery demanding. Therefore, it is often recommended to analyseicosanoids in urine [5]. However, quantitation in urine is highlyffected by urine concentration and in many patient groups, e.g.epsis patients who are of particular interest for eicosanoid anal-sis, urine production is reduced or completely missing. Hence, inrder to deal with these issues, eicosanoids were analyzed after
ipopolysaccharide (LPS) whole blood activation as a model of
nflammation [16]. A comparable application of whole blood stim-lation assays was used for the evaluation of cytokine release [17]Fig. 2. Scheme of ferromagnetic particle enhanced deproteination using the magneticseparator.
and as well by our group for evaluation of eicosanoids in the fieldof sepsis [15].
As a proof of principle approach, to verify the applicability ofthe method to clinical samples, the novel LC–MS/MS assay includ-
ing ferromagnetic particle enhanced deproteination was employed toinvestigate the capacity of AA metabolite release after whole bloodstimulation in healthy blood donors.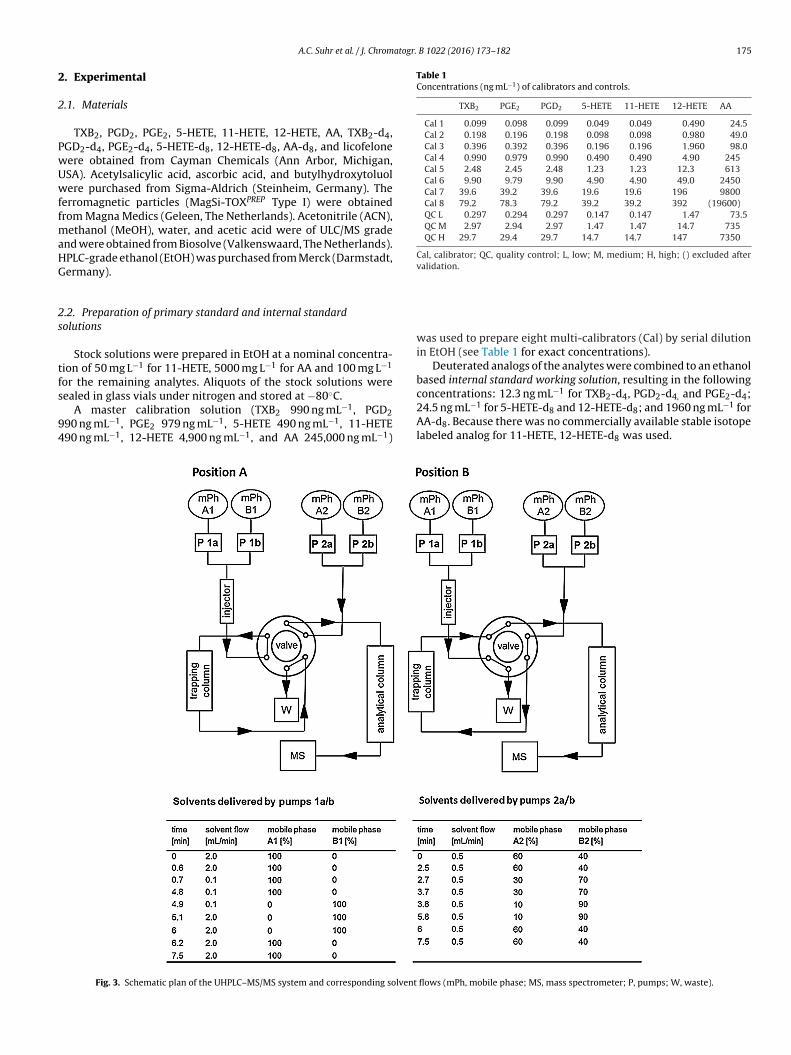
atogr. B 1022 (2016) 173–182 175
2
2
PwUwffmaHG
2s
tfs
94
Table 1Concentrations (ng mL−1) of calibrators and controls.
TXB2 PGE2 PGD2 5-HETE 11-HETE 12-HETE AA
Cal 1 0.099 0.098 0.099 0.049 0.049 0.490 24.5Cal 2 0.198 0.196 0.198 0.098 0.098 0.980 49.0Cal 3 0.396 0.392 0.396 0.196 0.196 1.960 98.0Cal 4 0.990 0.979 0.990 0.490 0.490 4.90 245Cal 5 2.48 2.45 2.48 1.23 1.23 12.3 613Cal 6 9.90 9.79 9.90 4.90 4.90 49.0 2450Cal 7 39.6 39.2 39.6 19.6 19.6 196 9800Cal 8 79.2 78.3 79.2 39.2 39.2 392 (19600)QC L 0.297 0.294 0.297 0.147 0.147 1.47 73.5QC M 2.97 2.94 2.97 1.47 1.47 14.7 735QC H 29.7 29.4 29.7 14.7 14.7 147 7350
Cal, calibrator; QC, quality control; L, low; M, medium; H, high; () excluded aftervalidation.
A.C. Suhr et al. / J. Chrom
. Experimental
.1. Materials
TXB2, PGD2, PGE2, 5-HETE, 11-HETE, 12-HETE, AA, TXB2-d4,GD2-d4, PGE2-d4, 5-HETE-d8, 12-HETE-d8, AA-d8, and licofeloneere obtained from Cayman Chemicals (Ann Arbor, Michigan,SA). Acetylsalicylic acid, ascorbic acid, and butylhydroxytoluolere purchased from Sigma-Aldrich (Steinheim, Germany). The
erromagnetic particles (MagSi-TOXPREP Type I) were obtainedrom Magna Medics (Geleen, The Netherlands). Acetonitrile (ACN),
ethanol (MeOH), water, and acetic acid were of ULC/MS gradend were obtained from Biosolve (Valkenswaard, The Netherlands).PLC-grade ethanol (EtOH) was purchased from Merck (Darmstadt,ermany).
.2. Preparation of primary standard and internal standardolutions
Stock solutions were prepared in EtOH at a nominal concentra-ion of 50 mg L−1 for 11-HETE, 5000 mg L−1 for AA and 100 mg L−1
or the remaining analytes. Aliquots of the stock solutions were
ealed in glass vials under nitrogen and stored at −80◦C.A master calibration solution (TXB2 990 ng mL−1, PGD290 ng mL−1, PGE2 979 ng mL−1, 5-HETE 490 ng mL−1, 11-HETE90 ng mL−1, 12-HETE 4,900 ng mL−1, and AA 245,000 ng mL−1)
Fig. 3. Schematic plan of the UHPLC–MS/MS system and corresponding solvent
was used to prepare eight multi-calibrators (Cal) by serial dilutionin EtOH (see Table 1 for exact concentrations).
Deuterated analogs of the analytes were combined to an ethanolbased internal standard working solution, resulting in the followingconcentrations: 12.3 ng mL−1 for TXB2-d4, PGD2-d4, and PGE2-d4;24.5 ng mL−1 for 5-HETE-d8 and 12-HETE-d8; and 1960 ng mL−1 forAA-d8. Because there was no commercially available stable isotope
labeled analog for 11-HETE, 12-HETE-d8 was used.flows (mPh, mobile phase; MS, mass spectrometer; P, pumps; W, waste).
176 A.C. Suhr et al. / J. Chromatogr. B 1022 (2016) 173–182
F , and o
2
wwc0iDLba
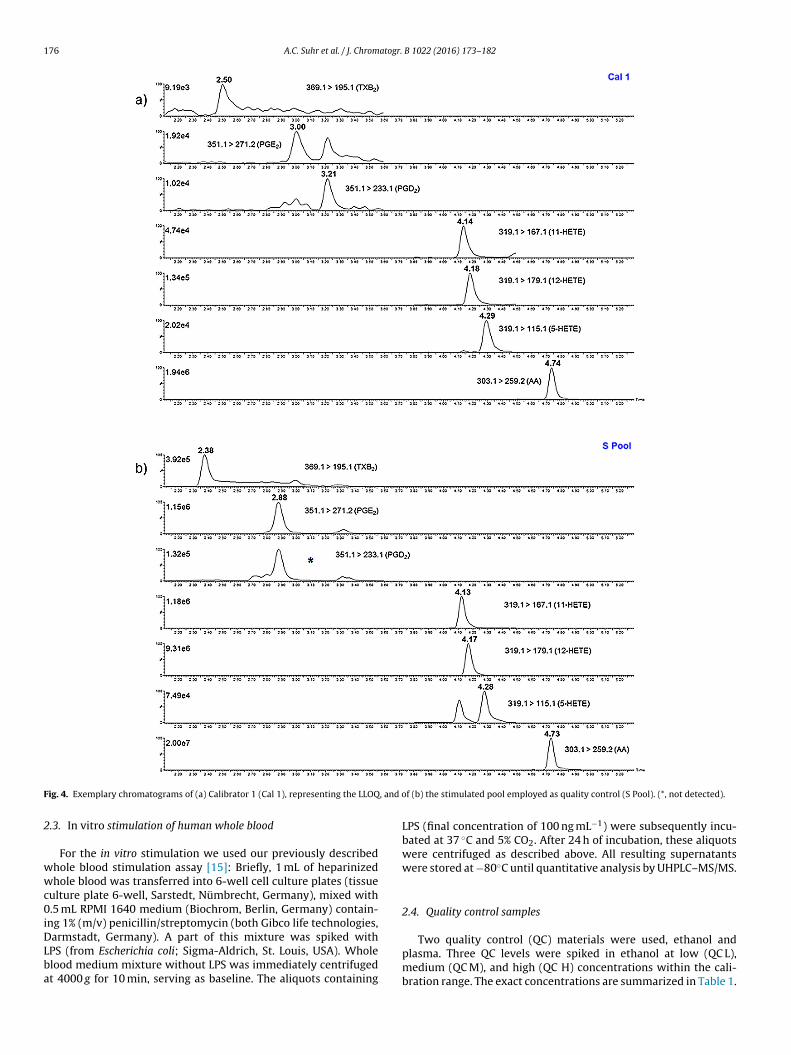
ig. 4. Exemplary chromatograms of (a) Calibrator 1 (Cal 1), representing the LLOQ
.3. In vitro stimulation of human whole blood
For the in vitro stimulation we used our previously describedhole blood stimulation assay [15]: Briefly, 1 mL of heparinizedhole blood was transferred into 6-well cell culture plates (tissue
ulture plate 6-well, Sarstedt, Nümbrecht, Germany), mixed with.5 mL RPMI 1640 medium (Biochrom, Berlin, Germany) contain-
ng 1% (m/v) penicillin/streptomycin (both Gibco life technologies,
armstadt, Germany). A part of this mixture was spiked withPS (from Escherichia coli; Sigma-Aldrich, St. Louis, USA). Wholelood medium mixture without LPS was immediately centrifugedt 4000 g for 10 min, serving as baseline. The aliquots containingf (b) the stimulated pool employed as quality control (S Pool). (*, not detected).
LPS (final concentration of 100 ng mL−1) were subsequently incu-bated at 37 ◦C and 5% CO2. After 24 h of incubation, these aliquotswere centrifuged as described above. All resulting supernatantswere stored at −80◦C until quantitative analysis by UHPLC–MS/MS.
2.4. Quality control samples
Two quality control (QC) materials were used, ethanol andplasma. Three QC levels were spiked in ethanol at low (QC L),medium (QC M), and high (QC H) concentrations within the cali-bration range. The exact concentrations are summarized in Table 1.

atogr.
ffbwe
2
wbssqtpatcMbnfoSs(itCi
2
Acsc
tW1p
aHmaviwlbo5ce
wtwflec
A.C. Suhr et al. / J. Chrom
The second QC type was based on the authentic matrix. There-ore a pool of heparinized whole blood from blood donors was usedor in vitro stimulation as described in Section 2.3. The resultingaseline sample (Baseline Pool, “B Pool”) and the resulting samplehich was stimulated with LPS (Stimulated Pool, “S Pool”) were
ach used as authentic matrix QCs.
.5. Sample preparation
A 100 �L aliquot of the sample (calibrator, QC, Pool, or unknown)as transferred into a 1.5 mL Safe-Lock TubesTM (Eppendorf, Ham-
urg, Germany) and mixed with 25 �L of internal standard workingolution for 5 min on a horizontal shaker. The ferromagnetic beaduspension was re-suspended by vortexing vigorously. Subse-uently, 40 �L of the ferromagnetic bead suspension was addedo the sample, and the tube was vortexed again. To denature theroteins, 300 �L of ACN were added to the sample-bead mixture,nd the tube was vortexed at high speed for at least 10 s to facilitatehe binding of the denatured proteins to the surface of the parti-les. When the tube was placed on the magnetic separator (Magnaedics) the ferromagnetic particles together with the previously
ound proteins were magnetically attracted to the permanent mag-et integrated in this separator forming a pellet at the tube wall
acing the magnet. This is illustrated by Fig. 2. After 1 min, 200 �Lf the resulting supernatant were carefully transferred to a 2.0 mLafe-Lock TubeTM (Eppendorf) without disturbing the pellet. Sub-equently, the obtained supernatant was dried in a heat block40◦C) under a gentle stream of nitrogen. After resolving the residuen 100 �L of MeOH/H2O (50/50, v/v), 85 �L of this mixture wereransferred to a brown glass vial containing a micro-insert (bothhromatographie Handel Müller, Fridolfing, Germany) and placed
nto the autosampler.
.6. UHPLC–MS/MS
The UHPLC–MS/MS system comprised a Xevo TQ-S and ancquity UPLC, including an autosampler, a switching valve, aolumn oven and two pairs of pumps (all Waters, Milford, Mas-achusetts, USA). Mass Lynx V4.1 (Waters) software was used toontrol the system.
Fig. 3 shows a scheme of the entire configuration with therapping column (Oasis HLB Direct Connect 20 �m, 2.1 × 30 mm,
aters), the analytical column (Acquity UPLC BEH Shield RP18.7 �m, 2.1 × 100 mm, Waters) and the two potential switchingositions.
The column oven for the analytical column was maintainedt 55◦C. The mobile phases for the trapping column were A1,2O/MeOH (90/10, v/v) and B1, ACN. For the analytical column, theobile phases were A2, 0.025 % (v/v) acetic acid in H2O (pH∼3.5)
nd B2, ACN/MeOH (75/25, v/v). Details of the gradients are pro-ided in Fig. 3. A total of 20 �L of the sample, prepared as describedn Section 2.5, was injected into the UHPLC system in position A,
here the analytes were retained on the trapping column (on-ine SPE). The valve was switched to position B after 0.7 min, andy back-flushing the trapping column the analytes were elutednto the analytical column for chromatographic separation. After.0 min, the valve was switched back to position A, and botholumns were re-equilibrated. The entire run time, including re-quilibration, was 7.5 min.
Ionization was performed by electrospray in the negative modeith a capillary voltage of −2.0 kV. The cone voltage was 40 V,
he source temperature was 150◦C, the desolvation temperature
as 600◦C, the cone gas flow was 150 L/h, and the desolvation gasow was 1000 L/h. The MS parameters, particularly the collisionnergy (see Table 2), were optimized for all analytes using post-olumn infusion of neat solutions. Multiple reaction monitoringB 1022 (2016) 173–182 177
(MRM) was employed: for each analyte two mass transitions wererecorded, and for each internal standard one mass transition wasrecorded. Detailed information is provided in Table 2. To achievean acceptable dwell time, the MRMs were scheduled.
The quantification method (Waters QuanLynxTM based)included a linear regression with a weighting function of 1/x2 andthe exclusion of the origin. The analytes were quantified via thequotient of the area of the first transition (quantifier) and the areaof the internal standard. The second transition (qualifier) was usedto confirm the retention time of the analyte but did not contributeto the quantification results. The peaks were smoothed using themean smoothing algorithm with two iterations and a smoothingwidth of three.
2.7. Evaluation of analytical performance
We based our evaluation protocol on the Guidelines of bio-analytical method validation of the European Medicines Agency(EMA) [18] and in part, also on the CLSI (Clinical and LaboratoryStandards Institute) guideline (Liquid Chromatography-Mass Spec-trometry Methods; Approved Guideline, CLSI document C62-A) [19].
The ethanol-based controls (QC L, QC M, and QC H) and theplasma pools (B Pool and S Pool) were employed as quality controlsin several experiments, as detailed below.
2.7.1. LinearityAliquots of the eight calibrators were processed as described in
Section 2.5 and injected at the beginning of each batch. The dataanalysis was performed as previously described in Section 2.6, andthe correlation coefficient and the slope of the calibration curveswere monitored during the validation period.
2.7.2. Accuracy and precisionThe accuracy and the precision were assessed with one aliquot of
each QC in five independent series (inter-batch). Correspondingly,for intra-batch accuracy and precision, five aliquots of each QC wereindividually processed and measured in one run. To determine thesole precision of the UHPLC–MS/MS method, multiple injections(n = 5) of one and the same processed aliquot of QC L and of QC Hrespectively were performed.
Since the nominal concentrations of the eicosanoids in thematrix-based controls B Pool and S Pool are not available due tothe unknown endogenous amount of the respective target analytes,only the precision values were accessed for this type of QC.
2.7.3. StabilityThe stability of the eicosanoids in plasma as well as in ethanol
was investigated for up to one month at different storing condi-tions in various container materials, i.e. polypropylene and glass.In detail, 1.5 mL Safe-Lock TubesTM (Eppendorf), MatrixTM 0.5 mLScrewTop Tubes for bio-banking (Thermo Scientific, Waltham,Massachusetts, USA), and 1.5 mL brown glass vials (Chromatogra-phie Handel Müller) were employed to investigate analyte stabilityat −80◦C. For storage at room temperature (+20◦C) comprising lightexposure as well as for storage in the refrigerator (+4◦C) exclusivelythe 1.5 mL Safe-Lock TubesTM (Eppendorf) were used.
Furthermore the stability of the processed samples was exam-ined in the autosampler, e.g., during a night batch at +8◦C. Thepost-preparation stability at +20◦C was also assessed.
Additionally, the stability of the intermediates of the samplepreparation was investigated, using the deproteinated supernatantand the dried extracts, respectively.
2.7.4. Robustness and ruggednessThe dilution integrity was assessed for values inside the calibra-
tion range (S Pool) and for those outside the calibration range, as

178 A.C. Suhr et al. / J. Chromatogr. B 1022 (2016) 173–182
Table 2MS/MS Parameters for the eicosanoids and corresponding internal standards.
Analyte Correspondinginternal standard
Retention time [min] Precursor ion [m/z] Quantifier transition Qualifier transition Dwell time[s]
Product ion [m/z] CE [eV] Product ion [m/z] CE [eV]
TXB2 TXB2-d4 2.53 369.1 195.1 14 169.1 16 0.032PGE2 PGE2-d4 3.03 351.1 271.2 16 315.2 12 0.032PGD2 PGD2-d4 3.23 351.1 233.1 12 271.2 16 0.0325-HETE 5-HETE-d8 4.32 319.1 115.1 14 203.2 16 0.02811-HETE 12-HETE-d8 4.17 319.1 167.1 14 149.1 20 0.02812-HETE 12-HETE-d8 4.20 319.1 179.1 14 208.2 14 0.028AA AA-d8 4.76 303.1 259.2 14 205.2 14 0.080
TXB2-d4 2.51 373.1 173.1 16 0.032PGE2-d4 3.03 355.1 275.2 16 0.032PGD2-d4 3.23 355.1 275.2 16 0.0325-HETE-d8 4.29 327.1 116.1 16 0.02812-HETE-d8 4.18 327.1 184.1 14 0.028
C
retad(oar
lde
alr
pansa
2
rc
fpw(ve
R
M
Awt
M
M
Av
AA-d8 4.75 311.1
E, collision energy.
ecommended in CLSI C62-A [19]. To simulate the latter case, anxtra high ethanol-based control containing more than five timeshe amount of eicosanoids of Cal 8 was prepared. The extra high QCnd the S Pool were processed and analyzed in triplicate withoutilution. Subsequently, the samples were diluted with MeOH/H2O50/50, v/v) before and after sample preparation; i.e., three aliquotsf both QCs were diluted prior to sample preparation; three otherliquots were processed normally as previously described, and theesolved residues were subsequently diluted.
The influence of different column lots was investigated by ana-yzing the same set of calibrators and controls twice on the sameay. For each run a different lot of the analytical column wasmployed.
An injection of MeOH after the highest calibrator was used tossess the carry-over. By injecting the calibrators from highest toowest the influence of potential carry-over on quantification accu-acy was further investigated.
Additionally, the inter-operator variability was tested. For thisurpose, the first operator, performing the evaluation experiments,nd a second operator with no previous experience handling mag-etic particles both prepared the same defined set of controlamples (n = 10) and the results were compared regarding precisionnd accuracy.
.7.5. Matrix effect and recoveryThe experiments described in the following were based on the
ecommendation of CLSI guideline C62-A [19], with slight modifi-ations.
Experiments for the recovery and the matrix effect were per-ormed according to Matuszewski et al. [20] using pre- andost-spiking in seven different lots of plasma. The matrix effectas calculated in consideration of the respective baseline value
cbaseline) of eicosanoids present in each plasma lot. The baselinealues were determined by analyzing unspiked samples (n = 5 forach lot).
ecovery = 100% × cplasma pre/cplasma post (1)
atrix effect = 100% × (cplasma post−cbaseline)/csolvent (2)
ccording to the EMA Guideline on bioanalytical method validation,e also calculated the IS normalised matrix factor (MFnorm) using
he Eqs. (3) and (4):
F = Areamatrix/Areasolvent (3)
Fnorm = MFanalyte/MFIS (4)
s recommended in the guideline, we subsequently calculated theariation coefficient of the MFnorm for each analyte.
267.2 14 0.080
Furthermore, we performed post-column infusion according toBonfiglio et al. [21]. Processed, unspiked plasma samples (contain-ing only the baseline value of eicosanoids) were injected onto thecolumn, while a solution of all analytes and all internal standardswas infused directly into the mass spectrometer via T-tubing usinga syringe pump. The different matrix lots used were either anti-coagulated with heparin or EDTA, respectively.
A matrix mixing experiment referring to the CLSI guideline C62-A was the third part of the matrix effect determination. We mixedthe S Pool with MeOH/H2O (50/50, v/v) in different proportions(25/75, 50/50, 75/25, v/v), e.g., 25 �L of MeOH/H2O mixture and75 �L of S Pool. Based on the previously determined concentrationsof the analytes in undiluted S Pool samples, the theoretical concen-trations resulting from dilution were calculated. After LC–MS/MSanalysis of the dilutions, the determined concentrations of theanalytes were plotted against their respective calculated theoreti-cal concentrations. A linear regression of the plot was performed.Moreover the matrix mixing experiment was repeated with a sec-ond lot of stimulated plasma obtained from a different blood donor.
2.8. In vitro stimulation of specimen from healthy blood donors
As a proof of principle approach this assay was applied to inves-tigate the release capacity of the targeted eicosanoids (TXB2, PGE2,PGD2, 5-HETE, 11-HETE, 12-HETE, AA) in healthy blood donors(n = 5) using the aforementioned whole blood activation model(Section 2.3). Therefore, whole blood of healthy blood donors wasstimulated according to Section 2.3 and subsequently analyzedaccording to Sections 2.5 and 2.6.
3. Results and discussion
3.1. Method development
3.1.1. CalibrationUnfortunately, it was not possible to generate calibrators in the
authentic matrix for two reasons. First, eicosanoid-free plasma wasnot commercially available. Also, several attempts to reduce theendogenous eicosanoid levels using physical approaches, e.g., UVlight, were not successful. A baseline value of relevant height wasinevitable in authentic matrix, at least in the case of AA.
Secondly, we observed that after spiking with a mixture ofthe seven target eicosanoids, the resulting peak areas for PGD2,
5-HETE, 11-HETE, and 12-HETE were markedly higher in plasmacompared to corresponding peak areas in ethanol. The effect couldnot be easily explained, neither by the endogenous level norby different solubilities, since ethanol is one of the optimal sol-
atogr. B 1022 (2016) 173–182 179
vottaietcFtaeppe
(Loen5mcgm
3
Uao
fdosscdsrir4
fineppcousp
apascar
Table 3Results for accuracy and precision.
Sample LLOQ QC L QC M QC H B Pool S Pool
TXB2
Target concentration [ng mL−1] 0.099 0.297 2.97 29.7 (<0.099)* (∼4.90)Accuracy inter-assay [%] 100 104 104 109Accuracy intra-assay [%] 99.4 103 102 105CV inter-assay [%] 19.9 10.4 4.8 4.0 5.2CV intra-assay [%] 11.4 11.2 4.9 3.8 2.5CV injection [%] 9.3 4.2 nd 4.8 nd nd
PGE2
Target concentration [ng mL−1] 0.098 0.294 2.94 29.4 (<0.098)* (∼6.72)Accuracy inter-assay [%] 98.5 108 105 113Accuracy intra-assay [%] 98.7 101 101 104CV inter-assay [%] 8.3 8.5 6.7 6.8 6.7CV intra-assay [%] 8.9 5.2 4.6 5.3 5.2CV injection [%] 6.2 8.0 nd 1.8 nd nd
PGD2
Target concentration [ng mL−1] 0.099 0.297 2.97 29.7 (<0.099)* (<0.099)*Accuracy inter-assay [%] 99.8 101 104 111Accuracy intra-assay [%] 88.9 94.3 95.7 96.8CV inter-assay [%] 8.7 6.1 2.9 5.3CV intra-assay [%] 7.4 7.6 6.3 3.9CV injection [%] 11.4 5.1 nd 1.6 nd nd
5-HETETarget concentration [ng mL−1] 0.049 0.147 1.47 14.7 (∼0.097) (∼0.398)Accuracy inter-assay [%] 101 110 95.6 125Accuracy intra-assay [%] 108 94.0 91.7 97.4CV inter-assay [%] 9.2 12.7 15.2 15.5 18.7 14.6CV intra-assay [%] 7.9 13.1 15.1 9.9 5.5 6.1CV injection [%] 9.5 5.3 nd 1.3 nd nd
11-HETETarget concentration [ng mL−1] 0.049 0.147 1.47 14.7 (<0.049)* (∼1.61)Accuracy inter-assay [%] 95.9 104 95.0 117Accuracy intra-assay [%] 96.3 93.3 92.8 99.1CV inter-assay [%] 5.2 7.0 9.9 12.2 14.6CV intra-assay [%] 11.2 7.3 11.5 5.7 4.6CV injection [%] 3.8 2.6 nd 1.6 nd nd
12-HETETarget concentration [ng mL−1] 0.490 1.47 14.7 147 (∼1.57) (∼50.9)Accuracy inter-assay [%] 99.5 107 107 114Accuracy intra-assay [%] 100 103 102 106CV inter-assay [%] 6.6 5.4 6.0 2.8 5.5 5.8CV intra-assay [%] 3.0 3.0 3.7 2.5 3.9 2.6CV injection [%] 3.3 0.9 nd 2.6 nd nd
AATarget concentration [ng mL−1] 24.5 73.5 735 7350 (∼627) (∼933)Accuracy inter-assay [%] 96.3 119 116 93.3Accuracy intra-assay [%] 98.9 114 111 92.6CV inter-assay [%] 8.7 2.8 2.6 2.7 9.0 3.0CV intra-assay [%] 0.7 4.0 3.4 6.4 3.1 3.0CV injection [%] 0.5 0.6 nd 1.8 nd nd
A.C. Suhr et al. / J. Chrom
ents for eicosanoids [6]. The oxidation of AA to HETEs throughxygen from the surrounding atmosphere was also excluded, ashis effect should also occur in ethanol or water. Consequently,his phenomenon was further investigated in spiking experimentst different concentration levels. Therefore each eicosanoid wasndividually spiked into plasma and ethanol, respectively. Thisxperiment revealed that the sole addition of AA to plasma, ledo increased concentrations of several other metabolites in aoncentration-dependent manner (see Supplementary material,ig. S1). All the other metabolites individually spiked did not affecthe concentrations of other measured eicosanoids included in thessay. Tsikas et al. described in their review the formation oficosanoids during and after blood sampling in whole blood sam-les [5]. However we did not expect this phenomenon to occur inlasma since it is free of platelets and other cells able to produceicosanoids.
In the next step, we investigated the influence of antioxidantsbutylhydroxytoluol, ascorbic acid) and inhibitors of COX and/orOX (acetylsalicylic acid, licofelone) on this distorting formationf eicosanoids induced by the addition of AA to plasma. With thexception of ascorbic acid (at a final concentration of 1%, m/v)o reduction of the formation of PGD2, 11-HETE, 12-HETE, and-HETE caused by AA spiking was observed (see Supplementaryaterial, Fig. S2). Since even high concentrations of ascorbic acid
ould not suppress completely this adverse formation of other tar-et eicosanoids, we decided to prepare the calibrators in a surrogateatrix, i.e. ethanol, to obtain reliable nominal concentrations.
.1.2. Sample preparationThe main aim of high-throughput capability for the
HPLC–MS/MS method focused on a sample preparation involving rapid, effective deproteination step in combination with ann-line SPE procedure involving a trapping column.
During our method development preliminary experiments witherromagnetic particle enhanced deproteination demonstrated repro-ucible results for eicosanoids. Nevertheless, the high percentagef acetonitrile, necessary for protein precipitation, in the resultingupernatant caused a suboptimal peak shape. The dilution of theupernatant with water, a common approach to reduce the organicontent prior to LC–MS/MS analysis, was in our case no optionue to the low biological abundance of eicosanoids. Therefore, theupernatant was evaporated under a stream of nitrogen, and theesidue was resolved in a different solvent. The temperature dur-ng evaporation and the resolving mixture were optimized, withespect to recovery and peak shape: good results were achieved for0◦C and a mixture of 50 % methanol in water.
Although application of on-line SPE has been described in theeld of eicosanoid analysis for about thirty years [22], this tech-ique has been rarely employed for these substances so far. Koreckat al. [23] and Willenberg et al. [24] both used on-line SPE for sam-le preparation, however, either investigated a rather small analyteanel of only two [23] respectively three [24] eicosanoids. Kita et al.ombined on-line SPE with a manually, time and labour intensiveff-line SPE step [25]. Kortz et al. employed a combination of man-al protein precipitation and on-line SPE on a trapping column forample preparation [11]. Unfortunately, this approach was accom-anied with limited recovery rates for some analytes.
A combination of ferromagnetic particle enhanced deproteinationnd on-line SPE seemed a promising alternative to the sam-le preparation techniques described so far for eicosanoids. Thispproach combines a fast sample preparation with clean extracts
uitable for LC–MS/MS analysis and at the same time, the genericharacter allows an application to a broad variety of analytes. Thisssumption was strengthened by our results for matrix effect andecovery for the chosen seven eicosanoids (TXB2, PGE2, PGD2, 5-LLOQ, Lower Limit of Quantification; QC, quality control; L, low; M, medium; H,high; CV, coefficient of variation; (∼x), approximate concentration determined over5 series; nd, not determined; *, below LLOQ.
HETE, 11-HETE, 12-HETE, AA; for further information, see Section3.2.5).
Consequently, we can state that ferromagnetic particle enhanceddeproteination in combination with on-line SPE is a reliable semi-automated sample preparation, that is a time-saving alternative tooff-line SPE in eicosanoid analysis. Additionally, this technique isalso presumed to have less co-precipitation issues, compared tocurrently used protein depletion by centrifugation.
3.1.3. UHPLC–MS/MS methodWe described an UHPLC–MS/MS method for the absolute quan-
tification of seven eicosanoids of particular interest in humanplasma. Other LC–MS/MS methods have included additional ana-lytes, but these methods primarily focus on relative quantification,as typically employed in metabolomics. However, the aim of the

180 A.C. Suhr et al. / J. Chromatogr.
Table 4Results of LC–MS/MS analysis of specimen from 5 healthy blood donors at baselineand after whole blood stimulation (all data are presented in ng mL−1).
Baseline (noincubation, noLPS)
Stimulated (24 hincubation withLPS)
TXB2
Donor 1 <0.10* 4.68Donor 2 <0.10* 10.5Donor 3 <0.10* 5.70Donor 4 <0.10* 5.00Donor 5 <0.10* 4.63
PGE2
Donor 1 <0.10* 0.62Donor 2 <0.10* 10.4Donor 3 <0.10* 1.40Donor 4 <0.10* 2.74Donor 5 <0.10* 5.41
PGD2
Donor 1 <0.10* <0.10*Donor 2 <0.10* <0.10*Donor 3 <0.10* <0.10*Donor 4 <0.10* <0.10*Donor 5 <0.10* <0.10*
5-HETEDonor 1 <0.05* 0.19Donor 2 0.06 0.29Donor 3 <0.05* 0.29Donor 4 0.06 0.50Donor 5 <0.05* 0.32
11-HETEDonor 1 <0.49* 0.81Donor 2 <0.49* 2.94Donor 3 <0.49* 1.27Donor 4 <0.49* 1.31Donor 5 <0.49* 1.66
12-HETEDonor 1 0.66 19.8Donor 2 <0.49* 46.7Donor 3 <0.49* 19.3Donor 4 <0.49* 22.6Donor 5 <0.49* 18.7
AADonor 1 151 417Donor 2 383 787Donor 3 263 568Donor 4 372 770
L
pbiadts
iot[sCcw
ttr
Donor 5 228 839
PS, lipopolysaccharide; *, below Lower Limit of Quantification.
resent study was absolute quantification using a set of eight cali-rators analyzed at the beginning of every batch and a deuterated
nternal standard for every analyte (if commercially available),s recommended in a recently published review [4]. Moreover,euterated internal standards play a crucial role when the calibra-ion matrix is different from the authentic matrix of the unknownamples, as in our method.
As many isomers are present among the eicosanoids, selectivitys an essential aspect for the development of UHPLC–MS/MS meth-ds [26]. Unlike HETEs, which are isomeric but can be discriminatedhrough mass spectrometry due to different fragmentation patterns27], the prostaglandins E2 and D2 have to be chromatographicallyeparated. We separated PGE2 and PGD2 to baseline, as shown foral 1 in Fig. 4a. An exemplary chromatogram for an authentic matrixontrol, the S Pool, is shown in Fig. 4b (unfortunately the PGD2 levelas still below the LLOQ; for further information see below).
Although only 100 �L of plasma were used and throughouthe sample preparation the original eicosanoid level was dilutedo a final concentration of approximately 40% from its origin, weealized an LLOQ of 0.1 ng mL−1 (5.4 fmol on column) for TXB2,
B 1022 (2016) 173–182
of 0.1 ng mL−1 (5.7 fmol on column) for PGD2 and PGE2, and of0.05 ng mL−1 (3.1 fmol on column) for 5-HETE and 11-HETE, respec-tively. Notably, the LLOQs for 12-HETE and AA were not based onthe technical detection limits of this method but were selectedas lower calibration limits based on the biological occurrence ofthese eicosanoids (12-HETE 0.5 ng mL−1 and AA 24.5 ng mL−1), aspreviously reported [7].
Regarding authentic matrix samples, TXB2, PGE2, all HETEs andAA could be quantified in our pool originating from stimulatedwhole blood (S Pool). Levels of 5-HETE, 12-HETE, and AA wereactually high enough to be quantified in the baseline pool origi-nating from whole blood without stimulation (B Pool). For detailedconcentrations see Table 3.
3.2. Evaluation of analytical performance
There is a lack of official guidelines for the validation ofLC–MS/MS methods addressing endogenous compounds, such aseicosanoids. Various approaches to cope with these problems werepublished in recent years [28–30].
The validation protocol for the assay described herein wasdesigned based on the Guidelines of bioanalytical method validationby the EMA [18]. However, this guideline addresses xenobiotics, notendogenous compounds such as eicosanoids. Hence, to generate avalidation protocol suitable for the intended endogenous analytes,we modified the protocol referring to the published recommenda-tions mentioned above.
3.2.1. LinearityOur method was linear (R2 > 0.98 for 5-HETE and AA; R2 > 0.99
for all other analytes) for the whole calibration range (see Table 1).In case of AA, the highest calibrator, Cal 8, was excluded because
the detector response was no longer linear at this concentration.However, the resulting upper limit of quantification (ULOQ) of9800 ng mL−1 (Cal 7) should be sufficient to quantify the majorityof biological samples according to previous studies [7,15].
3.2.2. Accuracy and precisionFor all five controls (QC L, QC M, QC H, B Pool, and S Pool), the
resulting values for accuracy and precision (inter- and intra-assay)were within the limits (±15 %) of the EMA guideline. For 5-HETE, theresults were slightly higher but remained under ±20 %. Regardingthe lower limit of quantification (LLOQ), the results for all analyteswere within the limits of the EMA guideline (±20 %). The detailedvalues for all analytes and QCs are provided in Table 3.
3.2.3. StabilityThe results of the stability experiments showed that the
eicosanoids were stable at −80◦C for at least one month inethanol and plasma. Marked differences (> ±15 %) between Eppen-dorf Safe-Lock TubesTM, Thermo Scientific MatrixTM Tubes (bothpolypropylene), and glassware were not observed. The only excep-tion is 5-HETE in stimulated plasma (S Pool): over four weeksa decrease of approximately 34 % was observed when storedin MatrixTM Tubes (n = 3) [compared with storage in Safe-LockTubesTM (n = 3)]. In further studies, the stability at −80◦C shouldbe investigated over a longer time period.
The data also showed that the analyte concentrations are neitherimpaired after three freeze and thaw cycles (−80◦C), after storagefor three days at +4◦C nor after standing for one hour on the bench(room temperature, light) prior to sample preparation.
The readily processed samples are stable in the described glass
vials for at least 72 h in the autosampler (at +8◦C) and for 13 h atroom temperature.The data obtained from stability experiments using the samplepreparation intermediates suggests that the best point to interrupt

atogr.
–bf
3
opwcms
th
iatHmpN8tc
df
3
apAp
9f(t
7A
ntps(s
gpor(
isca
A.C. Suhr et al. / J. Chrom
if necessary – would be after the deproteination step. Withoutias, the obtained supernatant might be stored in the refrigeratoror up to four hours prior to continuing the sample preparation.
.2.4. Robustness and ruggednessThe dilution experiment, employing the extra high QC (based
n EtOH) and the S Pool, showed good accuracy values for pre-reparation and post-preparation dilution. Based on these findings,e selected post-preparation dilution as standard procedure in
ase an unknown sample having a concentration above the ULOQight occur. This approach provides more reliability, as the internal
tandard is already present, and it is additionally more convenient.Carry over (peak area of the analyte in a blank injection following
he highest calibrator divided by the peak area of the analyte in theighest calibrator) was < 0.05 % for all analytes, except AA (1.2 %).
The EMA calculates a second value: the peak area of a blanknjection following the highest calibrator is divided by the peakrea of the lowest calibrator. Due to the wide calibration ranges ofhis method, this second value was approximately 20–30 % for theETEs and 230 % for AA. If this value exceeds 20 %, the EMA recom-ends arranging the samples based on the concentration (when
ossible) or otherwise to inject a blank after high concentrations.evertheless, the reversed order of the calibrators starting with Cal
(highest calibrator) resulted in a calibration with similar parame-ers and equal quality as the usual curve starting with Cal 1 (lowestalibrator).
The inter-operator variability was within the usual variationetermined through precision experiments. Also, the use of a dif-
erent column lot did not affect the results.
.2.5. Matrix effect and recoveryNotably, the pre-/post-spiking experiments (see Section 2.7.5)
ccording to Matuszewski [20] were performed for AA alone and inarallel for the remaining metabolites to prevent bias through theA induced formation of PGD2, 5-HETE, 11-HETE, and 12-HETE inlasma, as described in Section 3.1.1.
No relevant matrix effect was observed (98 % TXB2, 101 % PGE2,8 % PGD2, 107 % 5-HETE, 102 % 11-HETE, 94 % 12-HETE, and 109 %or AA). The variation coefficient of the IS normalised matrix factorMFnorm) ranged from 1 to 7 %, which is clearly below the limit ofhe EMA (15 %).
Also recovery showed satisfying results: 90 % TXB2, 95% PGE2,4% PGD2, 93 % 5-HETE, 92 % 11-HETE, 91 % 12-HETE, and 93 % forA.
Regarding the post-column infusion of blank plasma samples,o ion suppression or ion enhancement was observed, comparedo a solvent injection. Because eicosanoids are endogenous com-ounds present in every plasma sample, a slight increase in theignal resulting from infusion was observed when endogenous AAhaving relatively high natural abundance) from the blank plasmaample was eluted from the column.
In a third experiment, we employed matrix mixing to investi-ate whether a different amount of matrix influences the accuracy:lotting the determined and calculated theoretical concentrationsf eicosanoids for the different mixing ratios resulted in a linearelationship with good correlation coefficients for both matrix lotsR2 > 0.99).
The theoretical assumed compensation of matrix effects by the
nternal standard can be confirmed by these findings. This compen-ation is very important in LC–MS/MS methods, particularly whenonstructing the calibration curve in a matrix different from theuthentic matrix of the samples.B 1022 (2016) 173–182 181
3.3. In vitro stimulation of specimen from healthy blood donors
As a proof of principle approach our newly developed analyticalLC–MS/MS assay employing ferromagnetic particle enhanced depro-teination was used to investigate the release capacity of the targetedeicosanoids (TXB2, PGE2, PGD2, 5-HETE, 11-HETE, 12-HETE, AA) inhealthy blood donors (n = 5) using the whole blood activation modeldescribed in Section 2.3.
As shown in Table 4, target mediators were not detectable atbaseline, with the exception of AA and for some donors also for 5-HETE and 12-HETE. It is noteworthy that the baseline pool (B Pool)used for validation was characterized by markedly higher endoge-nous levels for 5-HETE and 12-HETE (see also Table 3), comparedto the found baseline concentrations of 5-HETE and 12-HETE in theunstimulated specimens of our five healthy blood donors, whichwere below or only slightly above the respective LLOQ. These obvi-ous differences potentially indicate a broad variability of 5-HETEand 12-HETE at baseline among healthy people. However, furtherstudies are necessary to underpin this assumption.
As expected, LPS whole blood activation resulted in a relevantincrease of eicosanoids (compare Table 4). The intensity of theeicosanoid release markedly differed between the individual blooddonors. As in the S Pool used during validation, PGD2 was unfortu-nately not detected in stimulated samples of the 5 blood donors.
These results show that the newly developed multi-analyteLC–MS/MS assay employing ferromagnetic particle enhanced depro-teination described herein is suitable for analysis of samplesgenerated with the described whole blood activation model.
4. Conclusion
To the best of our knowledge, the herein presented study is thefirst to describe ferromagnetic particle enhanced deproteination incombination with on-line SPE for sample clean-up of eicosanoidsin human plasma samples. This novel approach to semi-automatedsample preparation was found convenient and rugged enablingreliable analyses of demanding analytes in complex biologicalmatrices.
Prospectively, the complete automation of the sample prepa-ration might be possible. Actually, ferromagnetic particle enhanceddeproteination could be performed using a liquid handling systemand also the evaporation step could be integrated with the appro-priate instrumentation. Based on our promising validation data foreicosanoids we are convinced that this innovative approach willfacilitate automation in UHPLC–MS/MS.
Due to its rather generic character and based on our validationresults for eicosanoids as a demanding model group of endogenousanalytes, we believe ferromagnetic particle enhanced deproteinationis a very promising tool for the analysis of a broad variety of targetanalytes, including endogenous analytes as well as xenobiotica.
Acknowledgment
This work was funded by the Hans Fischer Society Munich,Munich, Germany.
Appendix A. Supplementary data
Supplementary data associated with this article can be found,in the online version, at http://dx.doi.org/10.1016/j.jchromb.2016.03.022.
References
[1] J. Ecker, Profiling eicosanoids and phospholipids using LC–MS/MS: principlesand recent applications, J. Sep. Sci. 35 (2012) 1227–1235.
1 atogr.
[
[
[
[
[
[
[
[
[
[
[
[
[
[
[
[
[
[
[
[validation of small-molecule LC–MS/MS biomarker assays, Bioanalysis 1(2009) 1365–1374.
[30] N.C. van de Merbel, Quantitative determination of endogenous compounds in
82 A.C. Suhr et al. / J. Chrom
[2] E. Ricciotti, G.A. FitzGerald, Prostaglandins and inflammation, Arterioscler.Thromb. Vasc. Biol. 31 (2011) 986–1000.
[3] D. Balgoma, A. Checa, D.G. Sar, S. Snowden, C.E. Wheelock, Quantitativemetabolic profiling of lipid mediators, Mol. Nutr. Food Res. 57 (2013)1359–1377.
[4] G. Astarita, A.C. Kendall, E.A. Dennis, A. Nicolaou, Targeted lipidomicstrategies for oxygenated metabolites of polyunsaturated fatty acids, Biochim.Biophys. Acta 1851 (2015) 456–468.
[5] D. Tsikas, A.A. Zoerner, Analysis of eicosanoids by LC–MS/MS and GC–MS/MS:a historical retrospect and a discussion, J. Chromatogr. B Analyt. Technol.Biomed. Life Sci. (2014), http://dx.doi.org/10.1016/j.jchromb.2014.03.017.
[6] Y. Wang, A.M. Armando, O. Quehenberger, C. Yan, E.A. Dennis, Comprehensiveultra-performance liquid chromatographic separation and massspectrometric analysis of eicosanoid metabolites in human samples, J.Chromatogr. A 1359 (2014) 60–69.
[7] D.D. Shinde, K.B. Kim, K.S. Oh, N. Abdalla, K.H. Liu, S.K. Bae, J.H. Shon, H.S. Kim,D.H. Kim, J.G. Shin, LC–MS/MS for the simultaneous analysis of arachidonicacid and 32 related metabolites in human plasma: basal plasmaconcentrations and aspirin-induced changes of eicosanoids, J. Chromatogr. BAnalyt. Technol. Biomed. Life Sci. 911 (2012) 113–121.
[8] J. Yang, K. Schmelzer, K. Georgi, B.D. Hammock, Quantitative profiling methodfor oxylipin metabolome by liquid chromatography electrospray ionizationtandem mass spectrometry, Anal. Chem. 81 (2009) 8085–8093.
[9] X. Zhang, N. Yang, D. Ai, Y. Zhu, Systematic metabolomic analysis ofeicosanoids after omega-3 polyunsaturated Fatty Acid supplementation by ahighly specific liquid chromatography-tandem mass spectrometry-basedmethod, J. Proteome Res. 14 (2015) 1843–1853.
10] Y. Huang, G. Chen, X. Liu, Y. Shao, P. Gao, C. Xin, Z. Cui, X. Zhao, G. Xu, Serummetabolomics study and eicosanoid analysis of childhood atopic dermatitisbased on liquid chromatography-mass spectrometry, J. Proteome Res. 13(2014) 5715–5723.
11] L. Kortz, J. Dorow, S. Becker, J. Thiery, U. Ceglarek, Fast liquidchromatography-quadrupole linear ion trap-mass spectrometry analysis ofpolyunsaturated fatty acids and eicosanoids in human plasma, J. Chromatogr.B Analyt. Technol. Biomed. Life Sci. 927 (2013) 209–213.
12] K. Konig, S.F. Goethel, V.M. Rusu, M. Vogeser, Deproteination of serumsamples for LC–MS/MS analyses by applying magnetic micro-particles, Clin.Biochem. 46 (2013) 652–655.
13] E.M. Smyth, T. Grosser, M. Wang, Y. Yu, G.A. FitzGerald, Prostanoids in healthand disease, J. Lipid Res. 50 (Suppl) (2009) S423–S428.
14] V. Capra, M. Back, S.S. Barbieri, M. Camera, E. Tremoli, G.E. Rovati, Eicosanoidsand their drugs in cardiovascular diseases: focus on atherosclerosis andstroke, Med. Res. Rev. 33 (2013) 364–438.
15] M. Bruegel, U. Ludwig, A. Kleinhempel, S. Petros, L. Kortz, U. Ceglarek, L.M.Holdt, J. Thiery, G.M. Fiedler, Sepsis-associated changes of the arachidonicacid metabolism and their diagnostic potential in septic patients, Crit. Care
Med. 40 (2012) 1478–1486.16] A. Margalit, K.L. Duffin, P.C. Isakson, Rapid quantitation of a large scope ofeicosanoids in two models of inflammation: development of an electrosprayand tandem mass spectrometry method and application to biological studies,Anal. Biochem. 235 (1996) 73–81.
B 1022 (2016) 173–182
17] W. Ertel, J.P. Kremer, J. Kenney, U. Steckholzer, D. Jarrar, O. Trentz, F.W.Schildberg, Downregulation of proinflammatory cytokine release in wholeblood from septic patients, Blood 85 (1995) 1341–1347.
18] E.M. Agency, Guideline on Bioanalytical Method Validation, 2011, http://www.ema.europa.eu/docs/en GB/document library/Scientific guideline/2011/08/WC500109686.pdf, accessed February 2014.
19] CLSI, Liquid Chromatography-Mass-Spectrometry Methods; ApprovedGuideline, CLSI Document C62-A, Clinical and Laboratory Standards Institute,Wayne, PA, 2014.
20] B.K. Matuszewski, M.L. Constanzer, C.M. Chavez-Eng, Strategies for theassessment of matrix effect in quantitative bioanalytical methods based onHPLC–MS/MS, Anal. Chem. 75 (2003) 3019–3030.
21] R. Bonfiglio, R.C. King, T.V. Olah, K. Merkle, The effects of sample preparationmethods on the variability of the electrospray ionization response for modeldrug compounds, Rapid. Commun. Mass Spectrom. 13 (1999) 1175–1185.
22] W.S. Powell, Precolumn extraction and reversed-phase high-pressure liquidchromatography of prostaglandins and leukotrienes, Anal. Biochem. 164(1987) 117–131.
23] M. Korecka, C.M. Clark, V.M. Lee, J.Q. Trojanowski, L.M. Shaw, SimultaneousHPLC–MS-MS quantification of 8-iso-PGF(2alpha) and 8,12-iso-iPF(2alpha) inCSF and brain tissue samples with on-line cleanup, J. Chromatogr. B Analyt.Technol. Biomed. Life Sci. 878 (2010) 2209–2216.
24] I. Willenberg, A.K. Meschede, N.H. Schebb, Determining cyclooxygenase-2activity in three different test systems utilizing online-solid phaseextraction-liquid chromatography-mass spectrometry for parallelquantification of prostaglandin E(2), D(2) and thromboxane B(2), J.Chromatogr. A 1391 (2015) 40–48.
25] Y. Kita, T. Takahashi, N. Uozumi, T. Shimizu, A multiplex quantitation methodfor eicosanoids and platelet-activating factor using column-switchingreversed-phase liquid chromatography-tandem mass spectrometry, Anal.Biochem. 342 (2005) 134–143.
26] L. Kortz, J. Dorow, U. Ceglarek, Liquid chromatography-tandem massspectrometry for the analysis of eicosanoids and related lipids in humanbiological matrices: a review, J. Chromatogr. B Analyt. Technol. Biomed. LifeSci. (2014), http://dx.doi.org/10.1016/j.jchromb.2014.01.046.
27] R.C. Murphy, R.M. Barkley, K. Zemski Berry, J. Hankin, K. Harrison, C. Johnson,J. Krank, A. McAnoy, C. Uhlson, S. Zarini, Electrospray ionization and tandemmass spectrometry of eicosanoids, Anal. Biochem. 346 (2005) 1–42.
28] D. Tsikas, A proposal for comparing methods of quantitative analysis ofendogenous compounds in biological systems by using the relative lowerlimit of quantification (rLLOQ), J. Chromatogr. B Analyt. Technol. Biomed. LifeSci. 877 (2009) 2244–2251.
29] R. Houghton, C. Horro Pita, I. Ward, R. Macarthur, Generic approach to
biological samples using chromatographic techniques, TrAC Trends Anal.Chem. 27 (2008) 924–933.

![Journal of Chromatography A - Univerzita Pardubiceholcapek.upce.cz/reprints/RE_JCA_1259_2012_3_LCMS_review.pdf · in Journal of Chromatography A [1,2] and in other places as well](https://static.fdocuments.net/doc/165x107/5b91820c09d3f277288bdc8a/journal-of-chromatography-a-univerzita-in-journal-of-chromatography-a-12.jpg)