
Journal of Chromatography A · PDF fileJournal of Chromatography A, 1445 (2016) 118–125...
8
Journal of Chromatography A, 1445 (2016) 118–125 Contents lists available at ScienceDirect Journal of Chromatography A jo ur nal ho me pag e: www.elsevier.com/locate/chroma Two-dimensional gas chromatography-online hydrogenation for improved characterization of petrochemical samples H. Potgieter a,∗ , R. Bekker a , A. Govender a , E. Rohwer b a Operations and Analytics Department, Group Technology R&T, Sasolburg 1947, South Africa b Department of Chemistry, University of Pretoria, Hatfield, Pretoria 0002, South Africa a r t i c l e i n f o Article history: Received 11 November 2015 Received in revised form 4 March 2016 Accepted 10 March 2016 Available online 15 March 2016 Keywords: Comprehensive two-dimensional gas chromatography Capillary hydrogenation a b s t r a c t The Fischer-Tropsch (FT) process produces a variety of hydrocarbons over a wide carbon number range and during subsequent product workup a large variety of synthetic fuels and chemicals are produced. The complexity of the product slate obtained from this process is well documented and the high tem- perature FT (HT-FT) process products are spread over gas, oil and water phases. The characterization of these phases is very challenging even when using comprehensive two-dimensional gas chromatogra- phy time-of-flight mass spectrometry (GC × GC-TOFMS). Despite the increase in separation power, peak co-elution still occurs when samples containing isomeric compounds are analysed by comprehensive two dimensional GC. The separation of isomeric compounds with the same double bond equivalents is especially difficult since these compounds elute in a similar position on the GC × GC chromatogram and have identical molecular masses and similar fragmentation patterns in their electron ionization (EI) mass spectra. On-line hydrogenation after GC × GC separation is a possible way to distinguish between these isomeric compounds since the number of rings and alkene double bonds can be determined from the mass spectra of the compounds before and after hydrogenation. This paper describes development of a GC × GC method with post column hydrogenation for the determination of the backbone of cyclic/olefinic struc- tures enabling us to differentiate between classes like dienes and cyclic olefins in complex petrochemical streams. © 2016 Elsevier B.V. All rights reserved. 1. Introduction The complexity of the product slate obtained from the Fischer- Tropsch (FT) process is well documented in literature [1]. A series of catalysed reactions of carbon monoxide and hydrogen pro- duces a variety of hydrocarbons over a wide carbon number range and during subsequent product workup a large variety of syn- thetic fuels and chemicals are produced. Contrary to crude-derived products, these FT products are practically free of sulphur- and nitrogen-containing compounds making them more environmen- tally friendly. The high temperature FT (HT-FT) process products are spread over gas, oil and water phases with only a small amount of wax being formed. These products are rich in highly valuable olefins and oxygenates, which crude oil only contains at trace levels. The characterization of these phases is very important for better understanding, control and optimization of conversion processes. ∗ Corresponding author. E-mail addresses: [email protected], [email protected] (H. Potgieter). The characterization of any one of these phases is very challeng- ing and a typical oil phase sample may contain thousands of compounds. All these components cannot be separated by one- dimensional separation techniques, even when high efficiency capillary columns are used [2]. The introduction of comprehensive two-dimensional gas chromatography (GC × GC) provides several advantages for the analysis of these complex oil samples. The peak capacities are in the order of tens of thousands and peaks are arranged in highly structured contour plots where peaks of a homologous series are positioned along lines on a retention plane. Increased sensitivity of up to 10 fold is also obtained by GC × GC when compared to 1 D GC. This is due to the re-concentration of peaks in the modulator as well as the very fast separation achieved in the second dimension that minimizes peak broadening and effec- tively increases the signal-to-noise ratio [3,4]. The application of GC × GC to the analysis of highly complex petrochemical mixtures has been described by a number of authors [3–9]. However, despite the increase in separation power, peak co- elution still occurs when samples containing isomeric compounds are analysed by comprehensive two dimensional GC. The separa- tion of isomeric compounds with the same double bond equivalents http://dx.doi.org/10.1016/j.chroma.2016.03.024 0021-9673/© 2016 Elsevier B.V. All rights reserved.
Transcript of Journal of Chromatography A · PDF fileJournal of Chromatography A, 1445 (2016) 118–125...
Ti
Ha
b
a
ARRAA
KCcC
1
Todatpntswa
u
(
h0
Journal of Chromatography A, 1445 (2016) 118–125
Contents lists available at ScienceDirect
Journal of Chromatography A
jo ur nal ho me pag e: www.elsev ier .com/ locate /chroma
wo-dimensional gas chromatography-online hydrogenation formproved characterization of petrochemical samples
. Potgietera,∗, R. Bekkera, A. Govendera, E. Rohwerb
Operations and Analytics Department, Group Technology R&T, Sasolburg 1947, South AfricaDepartment of Chemistry, University of Pretoria, Hatfield, Pretoria 0002, South Africa
r t i c l e i n f o
rticle history:eceived 11 November 2015eceived in revised form 4 March 2016ccepted 10 March 2016vailable online 15 March 2016
eywords:omprehensive two-dimensional gashromatographyapillary hydrogenation
a b s t r a c t
The Fischer-Tropsch (FT) process produces a variety of hydrocarbons over a wide carbon number rangeand during subsequent product workup a large variety of synthetic fuels and chemicals are produced.The complexity of the product slate obtained from this process is well documented and the high tem-perature FT (HT-FT) process products are spread over gas, oil and water phases. The characterization ofthese phases is very challenging even when using comprehensive two-dimensional gas chromatogra-phy time-of-flight mass spectrometry (GC × GC-TOFMS). Despite the increase in separation power, peakco-elution still occurs when samples containing isomeric compounds are analysed by comprehensivetwo dimensional GC. The separation of isomeric compounds with the same double bond equivalents isespecially difficult since these compounds elute in a similar position on the GC × GC chromatogram andhave identical molecular masses and similar fragmentation patterns in their electron ionization (EI) massspectra. On-line hydrogenation after GC × GC separation is a possible way to distinguish between these
isomeric compounds since the number of rings and alkene double bonds can be determined from the massspectra of the compounds before and after hydrogenation. This paper describes development of a GC × GCmethod with post column hydrogenation for the determination of the backbone of cyclic/olefinic struc-tures enabling us to differentiate between classes like dienes and cyclic olefins in complex petrochemicalstreams.© 2016 Elsevier B.V. All rights reserved.
. Introduction
The complexity of the product slate obtained from the Fischer-ropsch (FT) process is well documented in literature [1]. A seriesf catalysed reactions of carbon monoxide and hydrogen pro-uces a variety of hydrocarbons over a wide carbon number rangend during subsequent product workup a large variety of syn-hetic fuels and chemicals are produced. Contrary to crude-derivedroducts, these FT products are practically free of sulphur- anditrogen-containing compounds making them more environmen-ally friendly. The high temperature FT (HT-FT) process products arepread over gas, oil and water phases with only a small amount ofax being formed. These products are rich in highly valuable olefins
nd oxygenates, which crude oil only contains at trace levels.The characterization of these phases is very important for better
nderstanding, control and optimization of conversion processes.
∗ Corresponding author.E-mail addresses: [email protected], [email protected]
H. Potgieter).
ttp://dx.doi.org/10.1016/j.chroma.2016.03.024021-9673/© 2016 Elsevier B.V. All rights reserved.
The characterization of any one of these phases is very challeng-ing and a typical oil phase sample may contain thousands ofcompounds. All these components cannot be separated by one-dimensional separation techniques, even when high efficiencycapillary columns are used [2]. The introduction of comprehensivetwo-dimensional gas chromatography (GC × GC) provides severaladvantages for the analysis of these complex oil samples. Thepeak capacities are in the order of tens of thousands and peaksare arranged in highly structured contour plots where peaks of ahomologous series are positioned along lines on a retention plane.Increased sensitivity of up to 10 fold is also obtained by GC × GCwhen compared to 1D GC. This is due to the re-concentration ofpeaks in the modulator as well as the very fast separation achievedin the second dimension that minimizes peak broadening and effec-tively increases the signal-to-noise ratio [3,4].
The application of GC × GC to the analysis of highly complexpetrochemical mixtures has been described by a number of authors
[3–9]. However, despite the increase in separation power, peak co-elution still occurs when samples containing isomeric compoundsare analysed by comprehensive two dimensional GC. The separa-tion of isomeric compounds with the same double bond equivalents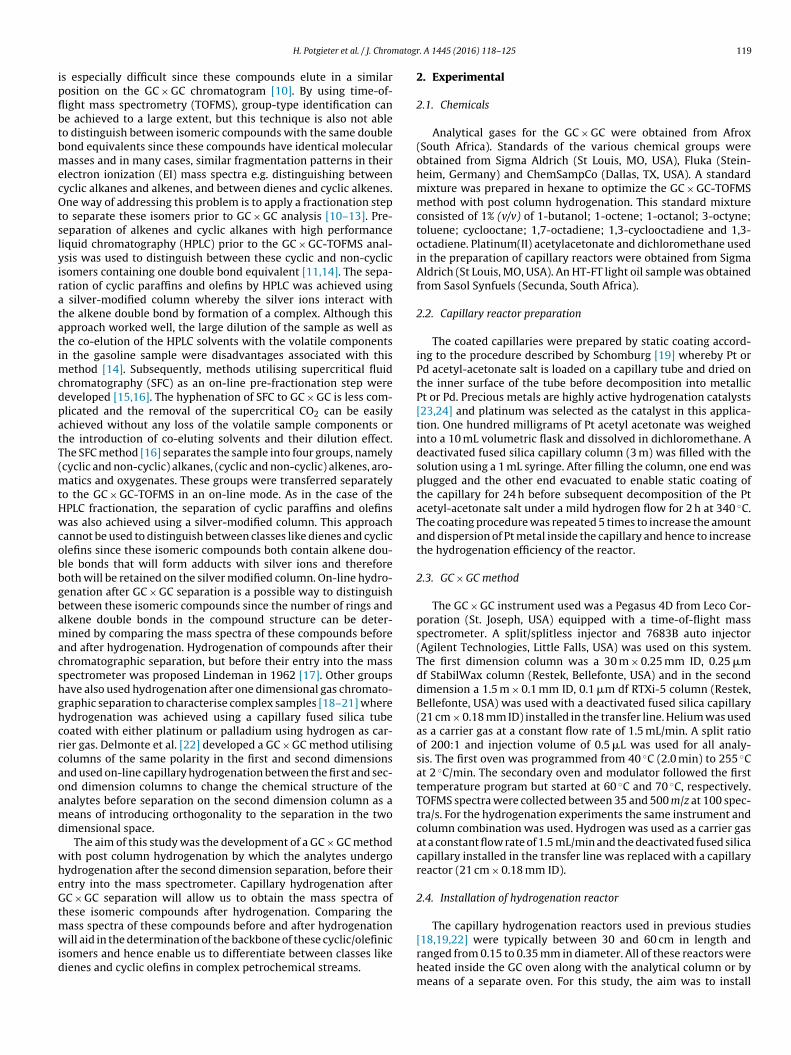
atogr
ipflbtbmecOtslyiratatimcdpatT(mtHwcobbgbamacshghcrcaoamd
wheGtmwid
H. Potgieter et al. / J. Chrom
s especially difficult since these compounds elute in a similarosition on the GC × GC chromatogram [10]. By using time-of-ight mass spectrometry (TOFMS), group-type identification cane achieved to a large extent, but this technique is also not ableo distinguish between isomeric compounds with the same doubleond equivalents since these compounds have identical molecularasses and in many cases, similar fragmentation patterns in their
lectron ionization (EI) mass spectra e.g. distinguishing betweenyclic alkanes and alkenes, and between dienes and cyclic alkenes.ne way of addressing this problem is to apply a fractionation step
o separate these isomers prior to GC × GC analysis [10–13]. Pre-eparation of alkenes and cyclic alkanes with high performanceiquid chromatography (HPLC) prior to the GC × GC-TOFMS anal-sis was used to distinguish between these cyclic and non-cyclicsomers containing one double bond equivalent [11,14]. The sepa-ation of cyclic paraffins and olefins by HPLC was achieved using
silver-modified column whereby the silver ions interact withhe alkene double bond by formation of a complex. Although thispproach worked well, the large dilution of the sample as well ashe co-elution of the HPLC solvents with the volatile componentsn the gasoline sample were disadvantages associated with this
ethod [14]. Subsequently, methods utilising supercritical fluidhromatography (SFC) as an on-line pre-fractionation step wereeveloped [15,16]. The hyphenation of SFC to GC × GC is less com-licated and the removal of the supercritical CO2 can be easilychieved without any loss of the volatile sample components orhe introduction of co-eluting solvents and their dilution effect.he SFC method [16] separates the sample into four groups, namelycyclic and non-cyclic) alkanes, (cyclic and non-cyclic) alkenes, aro-
atics and oxygenates. These groups were transferred separatelyo the GC × GC-TOFMS in an on-line mode. As in the case of thePLC fractionation, the separation of cyclic paraffins and olefinsas also achieved using a silver-modified column. This approach
annot be used to distinguish between classes like dienes and cycliclefins since these isomeric compounds both contain alkene dou-le bonds that will form adducts with silver ions and thereforeoth will be retained on the silver modified column. On-line hydro-enation after GC × GC separation is a possible way to distinguishetween these isomeric compounds since the number of rings andlkene double bonds in the compound structure can be deter-ined by comparing the mass spectra of these compounds before
nd after hydrogenation. Hydrogenation of compounds after theirhromatographic separation, but before their entry into the masspectrometer was proposed Lindeman in 1962 [17]. Other groupsave also used hydrogenation after one dimensional gas chromato-raphic separation to characterise complex samples [18–21] whereydrogenation was achieved using a capillary fused silica tubeoated with either platinum or palladium using hydrogen as car-ier gas. Delmonte et al. [22] developed a GC × GC method utilisingolumns of the same polarity in the first and second dimensionsnd used on-line capillary hydrogenation between the first and sec-nd dimension columns to change the chemical structure of thenalytes before separation on the second dimension column as aeans of introducing orthogonality to the separation in the two
imensional space.The aim of this study was the development of a GC × GC method
ith post column hydrogenation by which the analytes undergoydrogenation after the second dimension separation, before theirntry into the mass spectrometer. Capillary hydrogenation afterC × GC separation will allow us to obtain the mass spectra of
hese isomeric compounds after hydrogenation. Comparing theass spectra of these compounds before and after hydrogenation
ill aid in the determination of the backbone of these cyclic/olefinicsomers and hence enable us to differentiate between classes likeienes and cyclic olefins in complex petrochemical streams.
. A 1445 (2016) 118–125 119
2. Experimental
2.1. Chemicals
Analytical gases for the GC × GC were obtained from Afrox(South Africa). Standards of the various chemical groups wereobtained from Sigma Aldrich (St Louis, MO, USA), Fluka (Stein-heim, Germany) and ChemSampCo (Dallas, TX, USA). A standardmixture was prepared in hexane to optimize the GC × GC-TOFMSmethod with post column hydrogenation. This standard mixtureconsisted of 1% (v/v) of 1-butanol; 1-octene; 1-octanol; 3-octyne;toluene; cyclooctane; 1,7-octadiene; 1,3-cyclooctadiene and 1,3-octadiene. Platinum(II) acetylacetonate and dichloromethane usedin the preparation of capillary reactors were obtained from SigmaAldrich (St Louis, MO, USA). An HT-FT light oil sample was obtainedfrom Sasol Synfuels (Secunda, South Africa).
2.2. Capillary reactor preparation
The coated capillaries were prepared by static coating accord-ing to the procedure described by Schomburg [19] whereby Pt orPd acetyl-acetonate salt is loaded on a capillary tube and dried onthe inner surface of the tube before decomposition into metallicPt or Pd. Precious metals are highly active hydrogenation catalysts[23,24] and platinum was selected as the catalyst in this applica-tion. One hundred milligrams of Pt acetyl acetonate was weighedinto a 10 mL volumetric flask and dissolved in dichloromethane. Adeactivated fused silica capillary column (3 m) was filled with thesolution using a 1 mL syringe. After filling the column, one end wasplugged and the other end evacuated to enable static coating ofthe capillary for 24 h before subsequent decomposition of the Ptacetyl-acetonate salt under a mild hydrogen flow for 2 h at 340 ◦C.The coating procedure was repeated 5 times to increase the amountand dispersion of Pt metal inside the capillary and hence to increasethe hydrogenation efficiency of the reactor.
2.3. GC × GC method
The GC × GC instrument used was a Pegasus 4D from Leco Cor-poration (St. Joseph, USA) equipped with a time-of-flight massspectrometer. A split/splitless injector and 7683B auto injector(Agilent Technologies, Little Falls, USA) was used on this system.The first dimension column was a 30 m × 0.25 mm ID, 0.25 �mdf StabilWax column (Restek, Bellefonte, USA) and in the seconddimension a 1.5 m × 0.1 mm ID, 0.1 �m df RTXi-5 column (Restek,Bellefonte, USA) was used with a deactivated fused silica capillary(21 cm × 0.18 mm ID) installed in the transfer line. Helium was usedas a carrier gas at a constant flow rate of 1.5 mL/min. A split ratioof 200:1 and injection volume of 0.5 �L was used for all analy-sis. The first oven was programmed from 40 ◦C (2.0 min) to 255 ◦Cat 2 ◦C/min. The secondary oven and modulator followed the firsttemperature program but started at 60 ◦C and 70 ◦C, respectively.TOFMS spectra were collected between 35 and 500 m/z at 100 spec-tra/s. For the hydrogenation experiments the same instrument andcolumn combination was used. Hydrogen was used as a carrier gasat a constant flow rate of 1.5 mL/min and the deactivated fused silicacapillary installed in the transfer line was replaced with a capillaryreactor (21 cm × 0.18 mm ID).
2.4. Installation of hydrogenation reactor
The capillary hydrogenation reactors used in previous studies
[18,19,22] were typically between 30 and 60 cm in length andranged from 0.15 to 0.35 mm in diameter. All of these reactors wereheated inside the GC oven along with the analytical column or bymeans of a separate oven. For this study, the aim was to install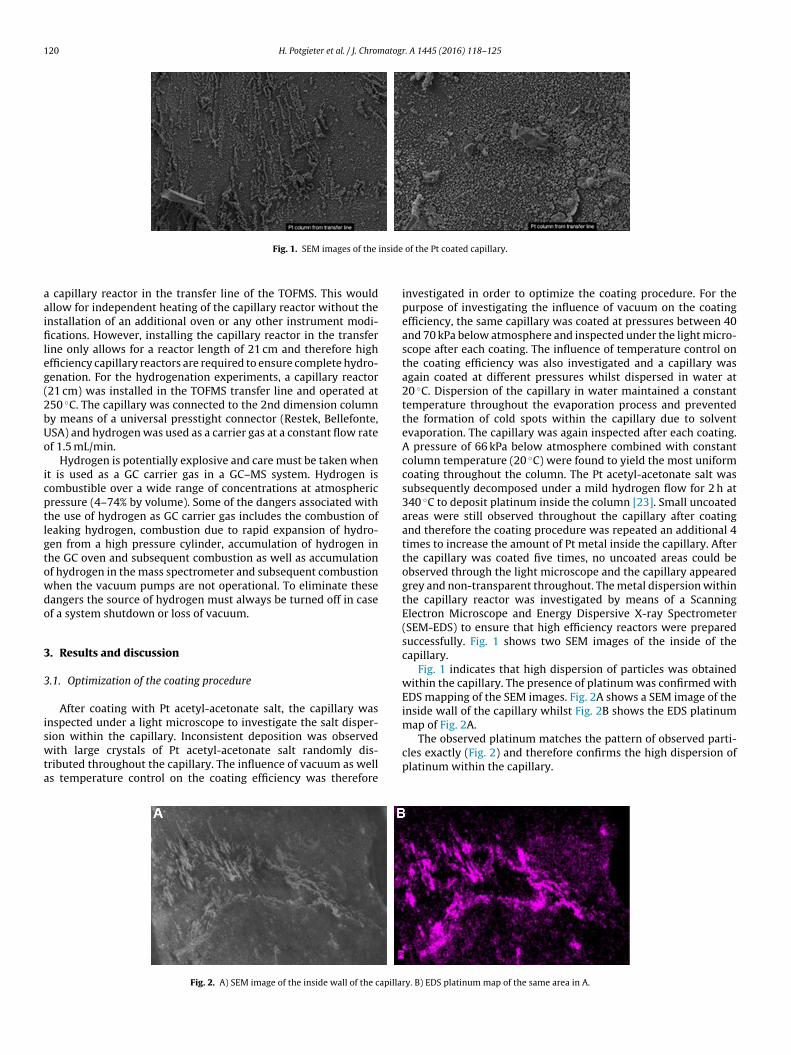
120 H. Potgieter et al. / J. Chromatogr. A 1445 (2016) 118–125
inside
aaifileg(2bUo
icptlgtowdo
3
3
iswta
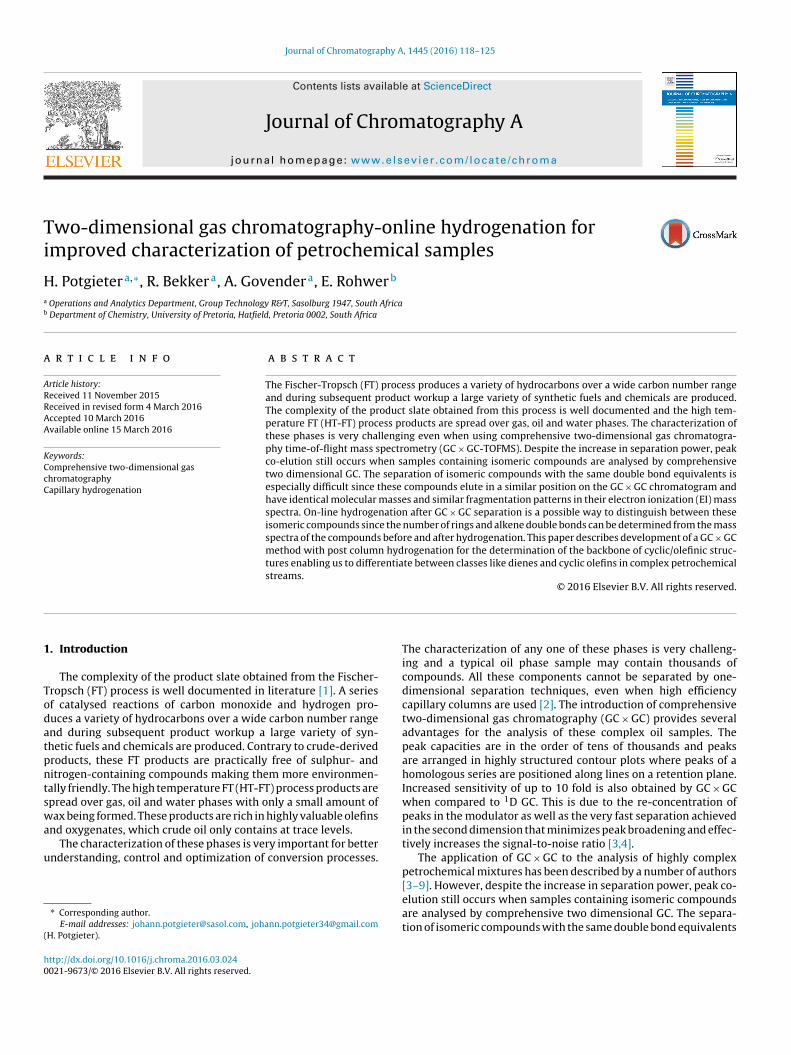
Fig. 1. SEM images of the
capillary reactor in the transfer line of the TOFMS. This wouldllow for independent heating of the capillary reactor without thenstallation of an additional oven or any other instrument modi-cations. However, installing the capillary reactor in the transfer
ine only allows for a reactor length of 21 cm and therefore highfficiency capillary reactors are required to ensure complete hydro-enation. For the hydrogenation experiments, a capillary reactor21 cm) was installed in the TOFMS transfer line and operated at50 ◦C. The capillary was connected to the 2nd dimension columny means of a universal presstight connector (Restek, Bellefonte,SA) and hydrogen was used as a carrier gas at a constant flow ratef 1.5 mL/min.
Hydrogen is potentially explosive and care must be taken whent is used as a GC carrier gas in a GC–MS system. Hydrogen isombustible over a wide range of concentrations at atmosphericressure (4–74% by volume). Some of the dangers associated withhe use of hydrogen as GC carrier gas includes the combustion ofeaking hydrogen, combustion due to rapid expansion of hydro-en from a high pressure cylinder, accumulation of hydrogen inhe GC oven and subsequent combustion as well as accumulationf hydrogen in the mass spectrometer and subsequent combustionhen the vacuum pumps are not operational. To eliminate theseangers the source of hydrogen must always be turned off in casef a system shutdown or loss of vacuum.
. Results and discussion
.1. Optimization of the coating procedure
After coating with Pt acetyl-acetonate salt, the capillary wasnspected under a light microscope to investigate the salt disper-
ion within the capillary. Inconsistent deposition was observedith large crystals of Pt acetyl-acetonate salt randomly dis-ributed throughout the capillary. The influence of vacuum as wells temperature control on the coating efficiency was therefore
Fig. 2. A) SEM image of the inside wall of the capilla
of the Pt coated capillary.
investigated in order to optimize the coating procedure. For thepurpose of investigating the influence of vacuum on the coatingefficiency, the same capillary was coated at pressures between 40and 70 kPa below atmosphere and inspected under the light micro-scope after each coating. The influence of temperature control onthe coating efficiency was also investigated and a capillary wasagain coated at different pressures whilst dispersed in water at20 ◦C. Dispersion of the capillary in water maintained a constanttemperature throughout the evaporation process and preventedthe formation of cold spots within the capillary due to solventevaporation. The capillary was again inspected after each coating.A pressure of 66 kPa below atmosphere combined with constantcolumn temperature (20 ◦C) were found to yield the most uniformcoating throughout the column. The Pt acetyl-acetonate salt wassubsequently decomposed under a mild hydrogen flow for 2 h at340 ◦C to deposit platinum inside the column [23]. Small uncoatedareas were still observed throughout the capillary after coatingand therefore the coating procedure was repeated an additional 4times to increase the amount of Pt metal inside the capillary. Afterthe capillary was coated five times, no uncoated areas could beobserved through the light microscope and the capillary appearedgrey and non-transparent throughout. The metal dispersion withinthe capillary reactor was investigated by means of a ScanningElectron Microscope and Energy Dispersive X-ray Spectrometer(SEM-EDS) to ensure that high efficiency reactors were preparedsuccessfully. Fig. 1 shows two SEM images of the inside of thecapillary.
Fig. 1 indicates that high dispersion of particles was obtainedwithin the capillary. The presence of platinum was confirmed withEDS mapping of the SEM images. Fig. 2A shows a SEM image of theinside wall of the capillary whilst Fig. 2B shows the EDS platinummap of Fig. 2A.
The observed platinum matches the pattern of observed parti-cles exactly (Fig. 2) and therefore confirms the high dispersion ofplatinum within the capillary.
ry. B) EDS platinum map of the same area in A.
H. Potgieter et al. / J. Chromatogr. A 1445 (2016) 118–125 121
ndard
3
ctadGca
ga
Fc
Fig. 3. GC × GC-TOFMS contour plot of the sta
.2. Optimization of capillary reactor diameter
A standard mixture consisting of hydrocarbons with varyingombinations of rings and double bonds were used to optimizehe GC × GC-TOFMS method with post column hydrogenation. Anlkylbenzene and two alcohols were also included in this stan-ard to investigate the hydrogenation severity. Fig. 3 shows theC × GC-TOFMS contour plot of the standard mixture without aapillary reactor installed and the observed molecular masses of
ll the compounds are indicated on the chromatogram.All the compounds within the mixture are well separated andood peak shapes were obtained throughout. Molecular masses forll the compounds were observed in the mass spectra except for
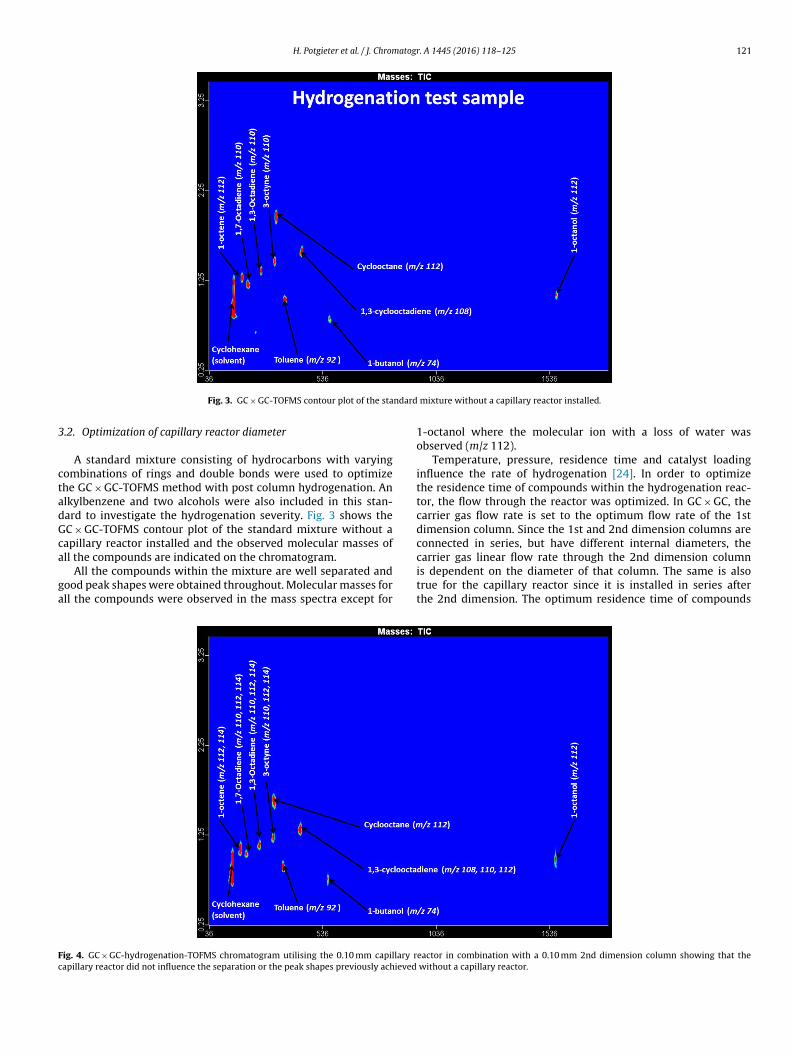
ig. 4. GC × GC-hydrogenation-TOFMS chromatogram utilising the 0.10 mm capillary rapillary reactor did not influence the separation or the peak shapes previously achieved
mixture without a capillary reactor installed.
1-octanol where the molecular ion with a loss of water wasobserved (m/z 112).
Temperature, pressure, residence time and catalyst loadinginfluence the rate of hydrogenation [24]. In order to optimizethe residence time of compounds within the hydrogenation reac-tor, the flow through the reactor was optimized. In GC × GC, thecarrier gas flow rate is set to the optimum flow rate of the 1stdimension column. Since the 1st and 2nd dimension columns areconnected in series, but have different internal diameters, the
carrier gas linear flow rate through the 2nd dimension columnis dependent on the diameter of that column. The same is alsotrue for the capillary reactor since it is installed in series afterthe 2nd dimension. The optimum residence time of compoundseactor in combination with a 0.10 mm 2nd dimension column showing that the without a capillary reactor.
122 H. Potgieter et al. / J. Chromatogr. A 1445 (2016) 118–125
Table 1Mass of platinum deposited in each reactor.
ReactorDiameter (mm)
ReactorVolume (mm2)
Number of coats Mass Platinum(�g)
0.10 1.649 5 560.15 3.711 5 125
wefwsa2o
daetccg
sr
dwfucaaddaim
rfligdtuttpprotTt
umto
g
Table 2Calculated ratios of the un- and fully hydrogenated molecular masses for 1-Octene.
Temp. Molecular Mass Ratio1-Octene112:114(m/z)
150 1:0.95200 1:0.42250 1:0.31
tants, according to the Le Chatelier principle. The free energy was
0.18 5.344 5 1810.18 5.344 2 72
ithin the hydrogenation reactor was optimized by evaluating thextent of hydrogenation achieved using capillary reactors with dif-erent diameters. For the purpose of this study, capillary reactorith diameters of 0.10, 0.15 and 0.18 mm were evaluated. Fig. 4
hows the GC × GC-hydrogenation-TOFMS chromatogram utilising 0.10 mm diameter capillary reactor in series after the 0.10 mmnd dimension column. Once again the observed molecular massesf all the compounds are indicated on the chromatogram.
The use of a capillary reactor after the 2nd dimension columnid not influence the separation or the peak shapes previouslychieved without a capillary reactor (compare Figs. 3 and 4). How-ver, inspection of the mass spectra of all the compounds showedhat only partial hydrogenation was achieved with the 0.10 mmapillary reactor and the molecular masses of the un-hydrogenatedompounds were still observed in the mass spectrum. No hydro-enation was achieved for butanol, octanol and toluene.
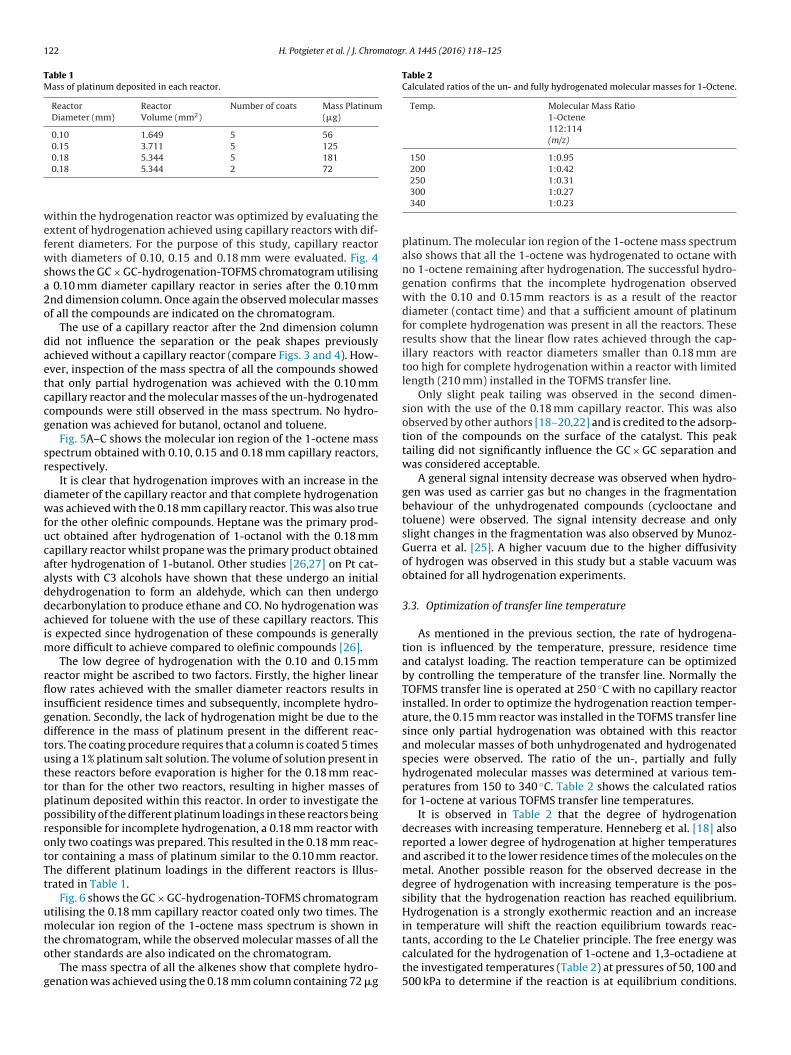
Fig. 5A–C shows the molecular ion region of the 1-octene masspectrum obtained with 0.10, 0.15 and 0.18 mm capillary reactors,espectively.
It is clear that hydrogenation improves with an increase in theiameter of the capillary reactor and that complete hydrogenationas achieved with the 0.18 mm capillary reactor. This was also true
or the other olefinic compounds. Heptane was the primary prod-ct obtained after hydrogenation of 1-octanol with the 0.18 mmapillary reactor whilst propane was the primary product obtainedfter hydrogenation of 1-butanol. Other studies [26,27] on Pt cat-lysts with C3 alcohols have shown that these undergo an initialehydrogenation to form an aldehyde, which can then undergoecarbonylation to produce ethane and CO. No hydrogenation waschieved for toluene with the use of these capillary reactors. Thiss expected since hydrogenation of these compounds is generally
ore difficult to achieve compared to olefinic compounds [26].The low degree of hydrogenation with the 0.10 and 0.15 mm
eactor might be ascribed to two factors. Firstly, the higher linearow rates achieved with the smaller diameter reactors results in
nsufficient residence times and subsequently, incomplete hydro-enation. Secondly, the lack of hydrogenation might be due to theifference in the mass of platinum present in the different reac-ors. The coating procedure requires that a column is coated 5 timessing a 1% platinum salt solution. The volume of solution present inhese reactors before evaporation is higher for the 0.18 mm reac-or than for the other two reactors, resulting in higher masses oflatinum deposited within this reactor. In order to investigate theossibility of the different platinum loadings in these reactors beingesponsible for incomplete hydrogenation, a 0.18 mm reactor withnly two coatings was prepared. This resulted in the 0.18 mm reac-or containing a mass of platinum similar to the 0.10 mm reactor.he different platinum loadings in the different reactors is Illus-rated in Table 1.
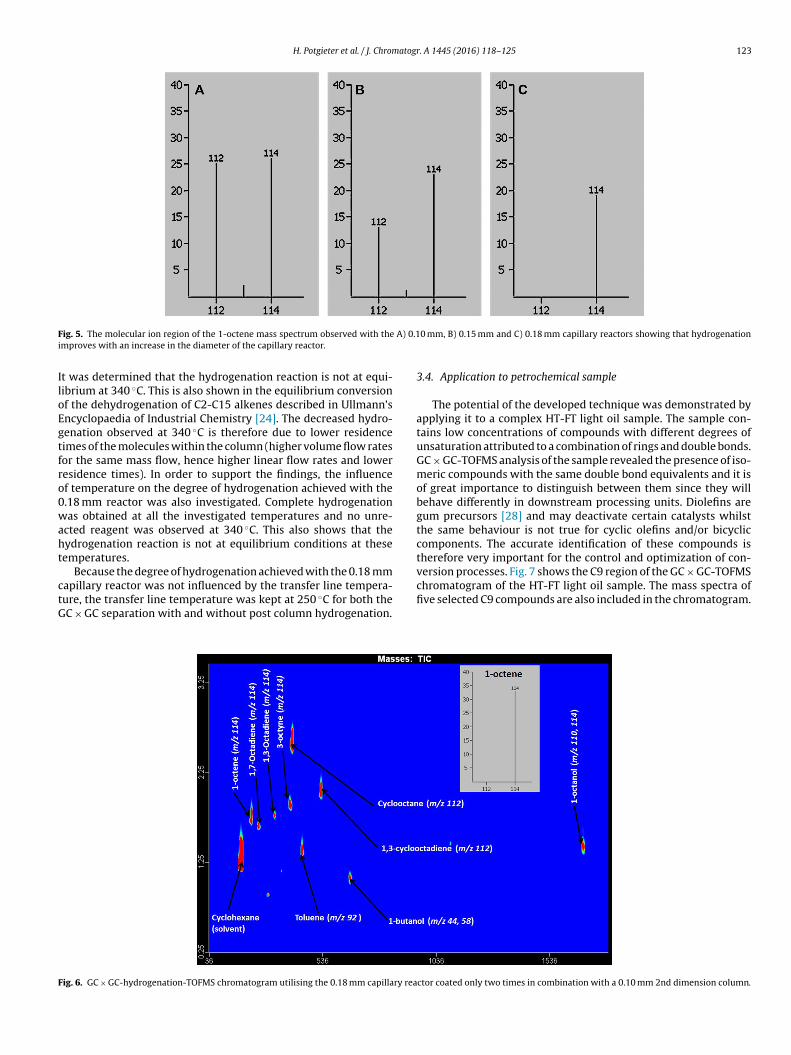
Fig. 6 shows the GC × GC-hydrogenation-TOFMS chromatogramtilising the 0.18 mm capillary reactor coated only two times. Theolecular ion region of the 1-octene mass spectrum is shown in
he chromatogram, while the observed molecular masses of all the
ther standards are also indicated on the chromatogram.The mass spectra of all the alkenes show that complete hydro-enation was achieved using the 0.18 mm column containing 72 �g
300 1:0.27340 1:0.23
platinum. The molecular ion region of the 1-octene mass spectrumalso shows that all the 1-octene was hydrogenated to octane withno 1-octene remaining after hydrogenation. The successful hydro-genation confirms that the incomplete hydrogenation observedwith the 0.10 and 0.15 mm reactors is as a result of the reactordiameter (contact time) and that a sufficient amount of platinumfor complete hydrogenation was present in all the reactors. Theseresults show that the linear flow rates achieved through the cap-illary reactors with reactor diameters smaller than 0.18 mm aretoo high for complete hydrogenation within a reactor with limitedlength (210 mm) installed in the TOFMS transfer line.
Only slight peak tailing was observed in the second dimen-sion with the use of the 0.18 mm capillary reactor. This was alsoobserved by other authors [18–20,22] and is credited to the adsorp-tion of the compounds on the surface of the catalyst. This peaktailing did not significantly influence the GC × GC separation andwas considered acceptable.
A general signal intensity decrease was observed when hydro-gen was used as carrier gas but no changes in the fragmentationbehaviour of the unhydrogenated compounds (cyclooctane andtoluene) were observed. The signal intensity decrease and onlyslight changes in the fragmentation was also observed by Munoz-Guerra et al. [25]. A higher vacuum due to the higher diffusivityof hydrogen was observed in this study but a stable vacuum wasobtained for all hydrogenation experiments.
3.3. Optimization of transfer line temperature
As mentioned in the previous section, the rate of hydrogena-tion is influenced by the temperature, pressure, residence timeand catalyst loading. The reaction temperature can be optimizedby controlling the temperature of the transfer line. Normally theTOFMS transfer line is operated at 250 ◦C with no capillary reactorinstalled. In order to optimize the hydrogenation reaction temper-ature, the 0.15 mm reactor was installed in the TOFMS transfer linesince only partial hydrogenation was obtained with this reactorand molecular masses of both unhydrogenated and hydrogenatedspecies were observed. The ratio of the un-, partially and fullyhydrogenated molecular masses was determined at various tem-peratures from 150 to 340 ◦C. Table 2 shows the calculated ratiosfor 1-octene at various TOFMS transfer line temperatures.
It is observed in Table 2 that the degree of hydrogenationdecreases with increasing temperature. Henneberg et al. [18] alsoreported a lower degree of hydrogenation at higher temperaturesand ascribed it to the lower residence times of the molecules on themetal. Another possible reason for the observed decrease in thedegree of hydrogenation with increasing temperature is the pos-sibility that the hydrogenation reaction has reached equilibrium.Hydrogenation is a strongly exothermic reaction and an increasein temperature will shift the reaction equilibrium towards reac-
calculated for the hydrogenation of 1-octene and 1,3-octadiene atthe investigated temperatures (Table 2) at pressures of 50, 100 and500 kPa to determine if the reaction is at equilibrium conditions.
H. Potgieter et al. / J. Chromatogr. A 1445 (2016) 118–125 123
F A) 0.1i
IloEgtfro0waht
ctG
F
ig. 5. The molecular ion region of the 1-octene mass spectrum observed with themproves with an increase in the diameter of the capillary reactor.
t was determined that the hydrogenation reaction is not at equi-ibrium at 340 ◦C. This is also shown in the equilibrium conversionf the dehydrogenation of C2-C15 alkenes described in Ullmann’sncyclopaedia of Industrial Chemistry [24]. The decreased hydro-enation observed at 340 ◦C is therefore due to lower residenceimes of the molecules within the column (higher volume flow ratesor the same mass flow, hence higher linear flow rates and loweresidence times). In order to support the findings, the influencef temperature on the degree of hydrogenation achieved with the.18 mm reactor was also investigated. Complete hydrogenationas obtained at all the investigated temperatures and no unre-
cted reagent was observed at 340 ◦C. This also shows that theydrogenation reaction is not at equilibrium conditions at theseemperatures.
Because the degree of hydrogenation achieved with the 0.18 mm
apillary reactor was not influenced by the transfer line tempera-ure, the transfer line temperature was kept at 250 ◦C for both theC × GC separation with and without post column hydrogenation.ig. 6. GC × GC-hydrogenation-TOFMS chromatogram utilising the 0.18 mm capillary rea
0 mm, B) 0.15 mm and C) 0.18 mm capillary reactors showing that hydrogenation
3.4. Application to petrochemical sample
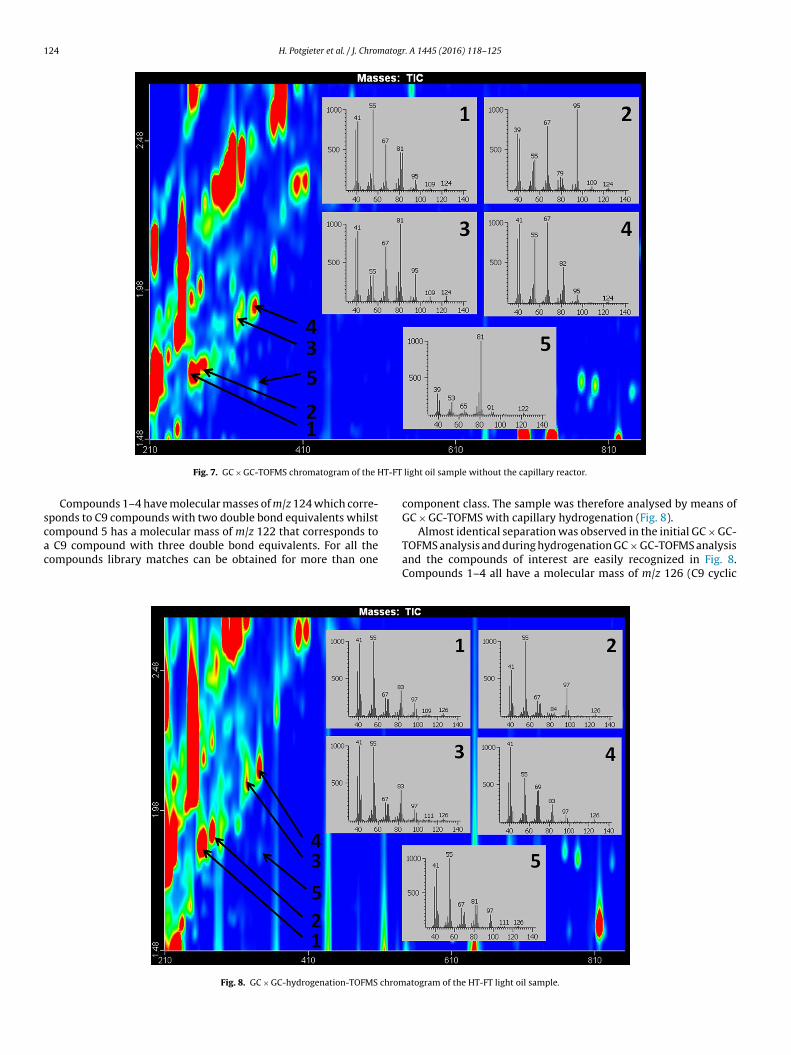
The potential of the developed technique was demonstrated byapplying it to a complex HT-FT light oil sample. The sample con-tains low concentrations of compounds with different degrees ofunsaturation attributed to a combination of rings and double bonds.GC × GC-TOFMS analysis of the sample revealed the presence of iso-meric compounds with the same double bond equivalents and it isof great importance to distinguish between them since they willbehave differently in downstream processing units. Diolefins aregum precursors [28] and may deactivate certain catalysts whilstthe same behaviour is not true for cyclic olefins and/or bicycliccomponents. The accurate identification of these compounds istherefore very important for the control and optimization of con-version processes. Fig. 7 shows the C9 region of the GC × GC-TOFMS
chromatogram of the HT-FT light oil sample. The mass spectra offive selected C9 compounds are also included in the chromatogram.ctor coated only two times in combination with a 0.10 mm 2nd dimension column.
124 H. Potgieter et al. / J. Chromatogr. A 1445 (2016) 118–125
T-FT
scac
Fig. 7. GC × GC-TOFMS chromatogram of the H
Compounds 1–4 have molecular masses of m/z 124 which corre-ponds to C9 compounds with two double bond equivalents whilst
ompound 5 has a molecular mass of m/z 122 that corresponds toC9 compound with three double bond equivalents. For all theompounds library matches can be obtained for more than one
Fig. 8. GC × GC-hydrogenation-TOFMS chrom
light oil sample without the capillary reactor.
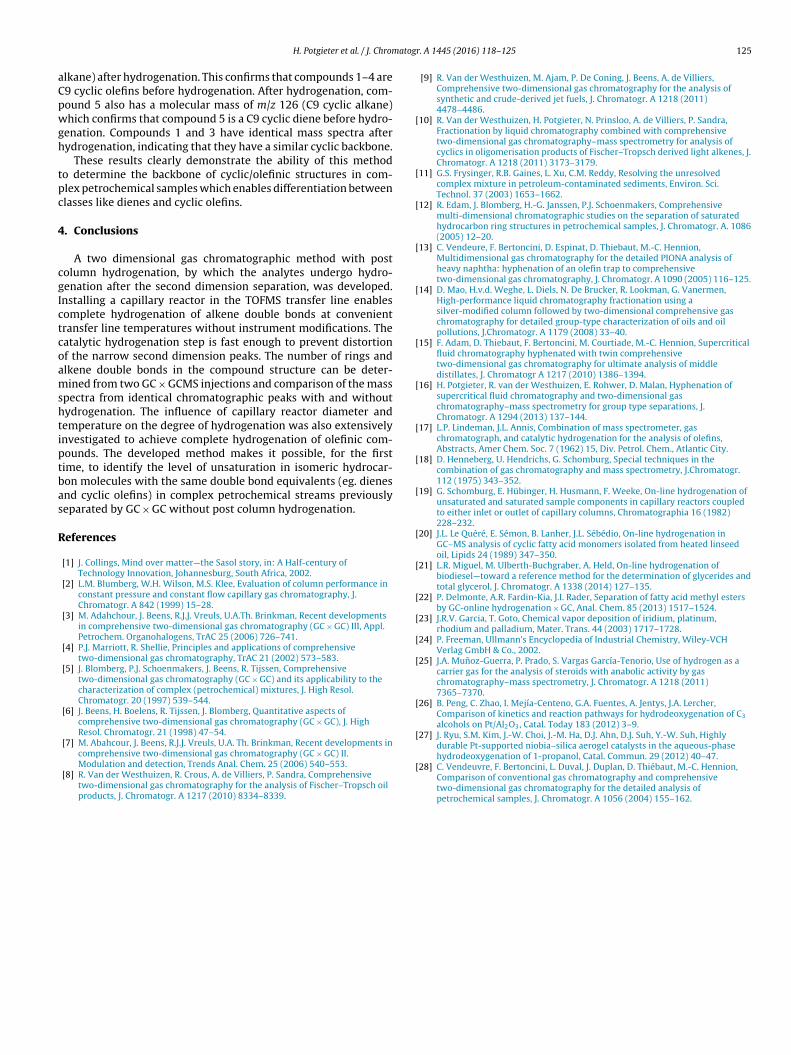
component class. The sample was therefore analysed by means ofGC × GC-TOFMS with capillary hydrogenation (Fig. 8).
Almost identical separation was observed in the initial GC × GC-TOFMS analysis and during hydrogenation GC × GC-TOFMS analysisand the compounds of interest are easily recognized in Fig. 8.Compounds 1–4 all have a molecular mass of m/z 126 (C9 cyclic
atogram of the HT-FT light oil sample.
atogr
aCpwgh
tpc
4
cgIctcoamshtiptbas
R
[
[
[
[
[
[
[
[
[
[
[
[
[
[
[
[
[
[
H. Potgieter et al. / J. Chrom
lkane) after hydrogenation. This confirms that compounds 1–4 are9 cyclic olefins before hydrogenation. After hydrogenation, com-ound 5 also has a molecular mass of m/z 126 (C9 cyclic alkane)hich confirms that compound 5 is a C9 cyclic diene before hydro-
enation. Compounds 1 and 3 have identical mass spectra afterydrogenation, indicating that they have a similar cyclic backbone.
These results clearly demonstrate the ability of this methodo determine the backbone of cyclic/olefinic structures in com-lex petrochemical samples which enables differentiation betweenlasses like dienes and cyclic olefins.
. Conclusions
A two dimensional gas chromatographic method with postolumn hydrogenation, by which the analytes undergo hydro-enation after the second dimension separation, was developed.nstalling a capillary reactor in the TOFMS transfer line enablesomplete hydrogenation of alkene double bonds at convenientransfer line temperatures without instrument modifications. Theatalytic hydrogenation step is fast enough to prevent distortionf the narrow second dimension peaks. The number of rings andlkene double bonds in the compound structure can be deter-ined from two GC × GCMS injections and comparison of the mass
pectra from identical chromatographic peaks with and withoutydrogenation. The influence of capillary reactor diameter andemperature on the degree of hydrogenation was also extensivelynvestigated to achieve complete hydrogenation of olefinic com-ounds. The developed method makes it possible, for the firstime, to identify the level of unsaturation in isomeric hydrocar-on molecules with the same double bond equivalents (eg. dienesnd cyclic olefins) in complex petrochemical streams previouslyeparated by GC × GC without post column hydrogenation.
eferences
[1] J. Collings, Mind over matter—the Sasol story, in: A Half-century ofTechnology Innovation, Johannesburg, South Africa, 2002.
[2] L.M. Blumberg, W.H. Wilson, M.S. Klee, Evaluation of column performance inconstant pressure and constant flow capillary gas chromatography, J.Chromatogr. A 842 (1999) 15–28.
[3] M. Adahchour, J. Beens, R.J.J. Vreuls, U.A.Th. Brinkman, Recent developmentsin comprehensive two-dimensional gas chromatography (GC × GC) III, Appl.Petrochem. Organohalogens, TrAC 25 (2006) 726–741.
[4] P.J. Marriott, R. Shellie, Principles and applications of comprehensivetwo-dimensional gas chromatography, TrAC 21 (2002) 573–583.
[5] J. Blomberg, P.J. Schoenmakers, J. Beens, R. Tijssen, Comprehensivetwo-dimensional gas chromatography (GC × GC) and its applicability to thecharacterization of complex (petrochemical) mixtures, J. High Resol.Chromatogr. 20 (1997) 539–544.
[6] J. Beens, H. Boelens, R. Tijssen, J. Blomberg, Quantitative aspects ofcomprehensive two-dimensional gas chromatography (GC × GC), J. HighResol. Chromatogr. 21 (1998) 47–54.
[7] M. Abahcour, J. Beens, R.J.J. Vreuls, U.A. Th. Brinkman, Recent developments in
comprehensive two-dimensional gas chromatography (GC × GC) II.Modulation and detection, Trends Anal. Chem. 25 (2006) 540–553.[8] R. Van der Westhuizen, R. Crous, A. de Villiers, P. Sandra, Comprehensivetwo-dimensional gas chromatography for the analysis of Fischer–Tropsch oilproducts, J. Chromatogr. A 1217 (2010) 8334–8339.
[
. A 1445 (2016) 118–125 125
[9] R. Van der Westhuizen, M. Ajam, P. De Coning, J. Beens, A. de Villiers,Comprehensive two-dimensional gas chromatography for the analysis ofsynthetic and crude-derived jet fuels, J. Chromatogr. A 1218 (2011)4478–4486.
10] R. Van der Westhuizen, H. Potgieter, N. Prinsloo, A. de Villiers, P. Sandra,Fractionation by liquid chromatography combined with comprehensivetwo-dimensional gas chromatography–mass spectrometry for analysis ofcyclics in oligomerisation products of Fischer–Tropsch derived light alkenes, J.Chromatogr. A 1218 (2011) 3173–3179.
11] G.S. Frysinger, R.B. Gaines, L. Xu, C.M. Reddy, Resolving the unresolvedcomplex mixture in petroleum-contaminated sediments, Environ. Sci.Technol. 37 (2003) 1653–1662.
12] R. Edam, J. Blomberg, H.-G. Janssen, P.J. Schoenmakers, Comprehensivemulti-dimensional chromatographic studies on the separation of saturatedhydrocarbon ring structures in petrochemical samples, J. Chromatogr. A. 1086(2005) 12–20.
13] C. Vendeure, F. Bertoncini, D. Espinat, D. Thiebaut, M.-C. Hennion,Multidimensional gas chromatography for the detailed PIONA analysis ofheavy naphtha: hyphenation of an olefin trap to comprehensivetwo-dimensional gas chromatography, J. Chromatogr. A 1090 (2005) 116–125.
14] D. Mao, H.v.d. Weghe, L. Diels, N. De Brucker, R. Lookman, G. Vanermen,High-performance liquid chromatography fractionation using asilver-modified column followed by two-dimensional comprehensive gaschromatography for detailed group-type characterization of oils and oilpollutions, J.Chromatogr. A 1179 (2008) 33–40.
15] F. Adam, D. Thiebaut, F. Bertoncini, M. Courtiade, M.-C. Hennion, Supercriticalfluid chromatography hyphenated with twin comprehensivetwo-dimensional gas chromatography for ultimate analysis of middledistillates, J. Chromatogr A 1217 (2010) 1386–1394.
16] H. Potgieter, R. van der Westhuizen, E. Rohwer, D. Malan, Hyphenation ofsupercritical fluid chromatography and two-dimensional gaschromatography–mass spectrometry for group type separations, J.Chromatogr. A 1294 (2013) 137–144.
17] L.P. Lindeman, J.L. Annis, Combination of mass spectrometer, gaschromatograph, and catalytic hydrogenation for the analysis of olefins,Abstracts, Amer Chem. Soc. 7 (1962) 15, Div. Petrol. Chem., Atlantic City.
18] D. Henneberg, U. Hendrichs, G. Schomburg, Special techniques in thecombination of gas chromatography and mass spectrometry, J.Chromatogr.112 (1975) 343–352.
19] G. Schomburg, E. Hübinger, H. Husmann, F. Weeke, On-line hydrogenation ofunsaturated and saturated sample components in capillary reactors coupledto either inlet or outlet of capillary columns, Chromatographia 16 (1982)228–232.
20] J.L. Le Quéré, E. Sémon, B. Lanher, J.L. Sébédio, On-line hydrogenation inGC–MS analysis of cyclic fatty acid monomers isolated from heated linseedoil, Lipids 24 (1989) 347–350.
21] L.R. Miguel, M. Ulberth-Buchgraber, A. Held, On-line hydrogenation ofbiodiesel—toward a reference method for the determination of glycerides andtotal glycerol, J. Chromatogr. A 1338 (2014) 127–135.
22] P. Delmonte, A.R. Fardin-Kia, J.I. Rader, Separation of fatty acid methyl estersby GC-online hydrogenation × GC, Anal. Chem. 85 (2013) 1517–1524.
23] J.R.V. Garcia, T. Goto, Chemical vapor deposition of iridium, platinum,rhodium and palladium, Mater. Trans. 44 (2003) 1717–1728.
24] P. Freeman, Ullmann’s Encyclopedia of Industrial Chemistry, Wiley-VCHVerlag GmbH & Co., 2002.
25] J.A. Munoz-Guerra, P. Prado, S. Vargas García-Tenorio, Use of hydrogen as acarrier gas for the analysis of steroids with anabolic activity by gaschromatography–mass spectrometry, J. Chromatogr. A 1218 (2011)7365–7370.
26] B. Peng, C. Zhao, I. Mejía-Centeno, G.A. Fuentes, A. Jentys, J.A. Lercher,Comparison of kinetics and reaction pathways for hydrodeoxygenation of C3
alcohols on Pt/Al2O3, Catal. Today 183 (2012) 3–9.27] J. Ryu, S.M. Kim, J.-W. Choi, J.-M. Ha, D.J. Ahn, D.J. Suh, Y.-W. Suh, Highly
durable Pt-supported niobia–silica aerogel catalysts in the aqueous-phase
hydrodeoxygenation of 1-propanol, Catal. Commun. 29 (2012) 40–47.28] C. Vendeuvre, F. Bertoncini, L. Duval, J. Duplan, D. Thiébaut, M.-C. Hennion,Comparison of conventional gas chromatography and comprehensivetwo-dimensional gas chromatography for the detailed analysis ofpetrochemical samples, J. Chromatogr. A 1056 (2004) 155–162.