
Journal of Chromatography A - Yonsei...
9
Journal of Chromatography A, 1405 (2015) 140–148 Contents lists available at ScienceDirect Journal of Chromatography A jo ur nal ho me pag e: www.elsevier.com/locate/chroma Top-down and bottom-up lipidomic analysis of rabbit lipoproteins under different metabolic conditions using flow field-flow fractionation, nanoflow liquid chromatography and mass spectrometry Seul Kee Byeon a , Jin Yong Kim a , Ju Yong Lee a , Bong Chul Chung b , Hong Seog Seo c , Myeong Hee Moon a,∗ a Department of Chemistry, Yonsei University, Seoul 120-749, Republic of Korea b Future Convergence Research Division, Korea Institute of Science and Technology, Seoul 136-791, Republic of Korea c Cardiovascular Center, Korea University Guro Hospital, Seoul 152-703, Republic of Korea a r t i c l e i n f o Article history: Received 7 March 2015 Received in revised form 11 May 2015 Accepted 23 May 2015 Available online 4 June 2015 Keywords: Top-down lipidomics nLC-ESI-MS/MS Rabbit serum Lipoproteins High cholesterol diet Carrageenan a b s t r a c t This study demonstrated the performances of top-down and bottom-up approaches in lipidomic analysis of lipoproteins from rabbits raised under different metabolic conditions: healthy controls, carrageenan- induced inflammation, dehydration, high cholesterol (HC) diet, and highest cholesterol diet with inflammation (HCI). In the bottom-up approach, the high density lipoproteins (HDL) and the low density lipoproteins (LDL) were size-sorted and collected on a semi-preparative scale using a multiplexed hol- low fiber flow field-flow fractionation (MxHF5), followed by nanoflow liquid chromatography-ESI-MS/MS (nLC-ESI-MS/MS) analysis of the lipids extracted from each lipoprotein fraction. In the top-down method, size-fractionated lipoproteins were directly infused to MS for quantitative analysis of targeted lipids using chip-type asymmetrical flow field-flow fractionation-electrospray ionization-tandem mass spectrometry (cAF4-ESI-MS/MS) in selected reaction monitoring (SRM) mode. The comprehensive bottom-up analysis yielded 122 and 104 lipids from HDL and LDL, respectively. Rabbits within the HC and HCI groups had lipid patterns that contrasted most substantially from those of controls, suggesting that HC diet significantly alters the lipid composition of lipoproteins. Among the identified lipids, 20 lipid species that exhibited large differences (>10-fold) were selected as targets for the top-down quantitative analysis in order to compare the results with those from the bottom-up method. Statistical comparison of the results from the two methods revealed that the results were not significantly different for most of the selected species, except for those species with only small differences in concentration between groups. The current study demonstrated that top-down lipid analysis using cAF4-ESI-MS/MS is a powerful high-speed analytical platform for targeted lipidomic analysis that does not require the extraction of lipids from blood samples. © 2015 Elsevier B.V. All rights reserved. 1. Introduction Lipoproteins are globular complexes present in blood that are composed of lipids with few proteins and are classified into density-dependent subclasses, including high-density lipopro- tein (HDL), low-density lipoprotein (LDL), and very low-density lipoprotein (VLDL) [1]. The major roles of lipoproteins are trans- portation of lipids and cholesterols in the bloodstream and their functions within the human body are related to cellular structure, ∗ Corresponding author. Tel.: +82 2 2123 5634; fax: +82 2 364 7050. E-mail address: [email protected] (M.H. Moon). intercellular signaling, cell proliferation, and apoptosis [2,3]. Since altered metabolism of lipids can often trigger the pathogenesis of metabolic disease [4,5], methods for lipid analysis have become of increasing interest in clinical fields for diagnostic and prognostic applications. Among the various risk factors for metabolic diseases, consumption of an unhealthy diet is a major factor [6]. The various types of unhealthy diet and their influences are discussed below. High cholesterol diets often cause metabolic diseases that lead to obesity and diabetes, and can even lead to the development of cancer [7,8]. Accumulation of carrageenan, a common additive utilized in the food industry to improve taste and keep ingredients from separating, can eventually cause inflammation in the human body, which is a known contributor to serious metabolic diseases http://dx.doi.org/10.1016/j.chroma.2015.05.059 0021-9673/© 2015 Elsevier B.V. All rights reserved.
Transcript of Journal of Chromatography A - Yonsei...

Tufs
SMa
b
c
a
ARRAA
KTnRLHC
1
adtlpf
h0
Journal of Chromatography A, 1405 (2015) 140–148
Contents lists available at ScienceDirect
Journal of Chromatography A
jo ur nal ho me pag e: www.elsev ier .com/ locate /chroma
op-down and bottom-up lipidomic analysis of rabbit lipoproteinsnder different metabolic conditions using flow field-flowractionation, nanoflow liquid chromatography and masspectrometry
eul Kee Byeona, Jin Yong Kima, Ju Yong Leea, Bong Chul Chungb, Hong Seog Seoc,yeong Hee Moona,∗
Department of Chemistry, Yonsei University, Seoul 120-749, Republic of KoreaFuture Convergence Research Division, Korea Institute of Science and Technology, Seoul 136-791, Republic of KoreaCardiovascular Center, Korea University Guro Hospital, Seoul 152-703, Republic of Korea
r t i c l e i n f o
rticle history:eceived 7 March 2015eceived in revised form 11 May 2015ccepted 23 May 2015vailable online 4 June 2015
eywords:op-down lipidomicsLC-ESI-MS/MSabbit serumipoproteinsigh cholesterol dietarrageenan
a b s t r a c t
This study demonstrated the performances of top-down and bottom-up approaches in lipidomic analysisof lipoproteins from rabbits raised under different metabolic conditions: healthy controls, carrageenan-induced inflammation, dehydration, high cholesterol (HC) diet, and highest cholesterol diet withinflammation (HCI). In the bottom-up approach, the high density lipoproteins (HDL) and the low densitylipoproteins (LDL) were size-sorted and collected on a semi-preparative scale using a multiplexed hol-low fiber flow field-flow fractionation (MxHF5), followed by nanoflow liquid chromatography-ESI-MS/MS(nLC-ESI-MS/MS) analysis of the lipids extracted from each lipoprotein fraction. In the top-down method,size-fractionated lipoproteins were directly infused to MS for quantitative analysis of targeted lipids usingchip-type asymmetrical flow field-flow fractionation-electrospray ionization-tandem mass spectrometry(cAF4-ESI-MS/MS) in selected reaction monitoring (SRM) mode. The comprehensive bottom-up analysisyielded 122 and 104 lipids from HDL and LDL, respectively. Rabbits within the HC and HCI groups had lipidpatterns that contrasted most substantially from those of controls, suggesting that HC diet significantlyalters the lipid composition of lipoproteins. Among the identified lipids, 20 lipid species that exhibitedlarge differences (>10-fold) were selected as targets for the top-down quantitative analysis in order to
compare the results with those from the bottom-up method. Statistical comparison of the results fromthe two methods revealed that the results were not significantly different for most of the selected species,except for those species with only small differences in concentration between groups. The current studydemonstrated that top-down lipid analysis using cAF4-ESI-MS/MS is a powerful high-speed analyticalplatform for targeted lipidomic analysis that does not require the extraction of lipids from blood samples.© 2015 Elsevier B.V. All rights reserved.
. Introduction
Lipoproteins are globular complexes present in blood thatre composed of lipids with few proteins and are classified intoensity-dependent subclasses, including high-density lipopro-ein (HDL), low-density lipoprotein (LDL), and very low-density
ipoprotein (VLDL) [1]. The major roles of lipoproteins are trans-ortation of lipids and cholesterols in the bloodstream and theirunctions within the human body are related to cellular structure,∗ Corresponding author. Tel.: +82 2 2123 5634; fax: +82 2 364 7050.E-mail address: [email protected] (M.H. Moon).
ttp://dx.doi.org/10.1016/j.chroma.2015.05.059021-9673/© 2015 Elsevier B.V. All rights reserved.
intercellular signaling, cell proliferation, and apoptosis [2,3]. Sincealtered metabolism of lipids can often trigger the pathogenesis ofmetabolic disease [4,5], methods for lipid analysis have become ofincreasing interest in clinical fields for diagnostic and prognosticapplications. Among the various risk factors for metabolic diseases,consumption of an unhealthy diet is a major factor [6]. The varioustypes of unhealthy diet and their influences are discussed below.High cholesterol diets often cause metabolic diseases that leadto obesity and diabetes, and can even lead to the development
of cancer [7,8]. Accumulation of carrageenan, a common additiveutilized in the food industry to improve taste and keep ingredientsfrom separating, can eventually cause inflammation in the humanbody, which is a known contributor to serious metabolic diseases
atogr. A 1405 (2015) 140–148 141
siocwdsvroi
alamH(fiscRcpiopeadtmMdpiss(lMttsampbdfp
twmddicodiceaf
Fig. 1. Schematic of the top-down and bottom-up approaches for lipoprotein spe-
S.K. Byeon et al. / J. Chrom
uch as heart diseases [9]. Dehydration, caused by insufficientntake of water, promotes low blood pressure and decreases theverall amount of blood in the human body. In extreme cases, itan affect the brain and cause minor or major headaches, alongith diminished memory and impaired nerve function [10]. Sinceecreased levels of HDL and increased levels of LDL, along with aize reduction in LDL, are common signs of an increased risk forarious types of metabolic disease, it is important to study theelative levels of lipoproteins. Therefore, a separate lipid profilingf HDL and LDL is necessary to discover the specific lipid speciesnvolved in the development of metabolic disorders.
Analysis of lipids from lipoproteins has been performed in using bottom-up method, which requires the isolation of differentipoproteins, extraction of lipids from the HDL/LDL fractions, andnalysis of the lipids with sophisticated mass spectrometry (MS)ethods in conjunction with liquid chromatography (LC). WhileDL and LDL can be separated by size exclusion chromatography
SEC), gel electrophoresis, and ultracentrifugation [11–14], floweld-flow fractionation (FlFFF) methods provide robust and highpeed size separation of HDL/LDL in an empty channel without theoncern of sample interaction with the packed bed or gels [15–18].ecently, multiplexed hollow fiber FlFFF (MxHF5) [19] was suc-essfully utilized for size-sorting of HDL and LDL particles fromlasma samples on a semi-preparative scale (∼50 �L plasma per
njection) and quantitative analysis using nanoflow LC-ESI-MS/MSf the extracted phospholipids (PLs) in different lipoproteins waserformed using samples from patients with coronary artery dis-ase (CAD) [20]. Lipid analysis can also be made using a top-downpproach in which plasma or serum lipoproteins can be injectedirectly into electrospray ionization-tandem MS (ESI-MSn) duringhe separation of lipoproteins. Development of a chip-type asym-
etrical FlFFF (or AF4) channel offered an on-line hyphenation withS (cAF4-ESI-MS/MS) to carry out a direct analysis of the lipids in
ifferent lipoproteins [21,22]. Use of miniaturized FlFFF channelrior to ESI-MS offers great advantages such as the on-line desalt-
ng of plasma samples, which can enhance the ionization of lipidpecies, and a high-speed lipid screening capability (∼200 min perample) with the bypass of the time consuming analytical steps∼36 h): isolation of the HDL/LDL fraction and extraction of theipids from each lipoprotein fraction prior to LC–MS/MS analysis.
oreover, lipid extraction from each lipoprotein fraction, an essen-ial step for chromatographic separation, is not necessary in theop-down analysis method. While sophisticated LC–MS/MS analy-is of lipids is a beneficial platform that provides a comprehensivenalysis of lipids, including isomeric forms of lipids, with the mini-ization of ion suppression from highly abundant species, the
re-chromatographic steps limit the throughput, and this oftenecomes a problem when the sample set is large. However, top-own lipidomic analysis by cAF4-ESI-MS/MS offers great potentialor high speed screening of targeted lipids with increased through-ut.
In this study, comprehensive lipid profiling was carried out forhe HDL and LDL fractions of serum samples from New Zealandhite rabbits raised under different metabolic conditions: nor-al diet (control), inflammation induced by injecting carrageenan,
ehydrated diet, high cholesterol (HC) diet, and high cholesteroliet with inflammation (HCI). Changes in the lipid distribution
n rabbit sera under these different metabolic conditions wereharacterized by both the bottom-up and top-down analysis meth-ds: an off-line combination of MxHF5 with nLC-ESI-MS/MS and airect analysis using cAF4-ESI-MS/MS, respectively, as illustrated
n Fig. 1. Initially, qualitative and quantitative lipid profiling was
arried out using pooled serum samples from each of the differ-nt diet groups of rabbits using an off-line combination of MxHFnd nLC-ESI-MS/MS. Then, lipid species showing greater than 10-old differences among the groups were selected and these targetedcific lipid analyses from rabbit serum samples using an on-line cAF4-ESI-MS/MS andan off-line combination of MxHF5 with nLC-ESI-MS/MS.
species were quantified by cAF4-ESI-MS/MS from individual sam-ples using the selected reaction monitoring (SRM) method in orderto confirm the differences and to validate the top-down approachas an alternative high speed screening platform for the analysis oflipids from lipoproteins.
2. Experimental
2.1. Materials and reagents
Bovine serum albumin (BSA), apoferritin, thyroglobulin,carbonic anhydrase (CA), NH4HCO2 and NH4OH as ionizationmodifiers for MS, and methyl-tert-butyl ether (MTBE) for lipidextraction were purchased from Sigma–Aldrich (St. Louis, MO,USA). Serum samples from New Zealand white rabbits raisedunder five different metabolic conditions were obtained fromKorea University Guro Hospital (Seoul, Korea). The first animalgroup consisted of four 12-week-old healthy rabbits, the secondgroup consisted of five rabbits with inflammation induced by hypo-dermic injection with 3 mL of 1% carrageenan solution for 3 weeks,the third group of three rabbits was given 1/3 of the water supplygiven to the other groups to induce a mild dehydration effect, thefourth group of five rabbits was maintained on a high cholesteroldiet, and the last group consisted of six rabbits with inflammationinduced by carrageenan and maintained on a high cholesteroldiet. Serum samples from a healthy human control and a patientwith coronary artery disease (CAD) were obtained under informedconsent from Severance hospital (Seoul, Korea) to allow for acomparison of the concentrations and sizes of lipoproteins withthose of rabbits. The ProteoPrep® Immunoaffinity Albumin & IgGDepletion Kit from Sigma–Aldrich was used to deplete albumin andimmunoglobulin G (IgG) from rabbit serum, as these can interferewith lipoproteins or lipids in UV detection and on-line MS analysis.HPLC grade H2O, CHCl3, CH3CN, C3H7OH, and CH3OH for LC werepurchased from Avantor Performance Materials (Center Valley,PA, USA). Nineteen lipid standards (16:0-lysophosphatidylcholine(LPC), 18:0-lyso phosphatidylethanolamine (LPE), 13:0/13:0-phosphatidylcholine (PC) as an internal standard (IS), 18:0/18:0-PC,18:0/18:0-phosphatidylethanolamine (PE), 18:0-lysophosphatidicacid (LPA), 18:0-lysophosphatidylglycerol (LPG), 18:0-lysophosphatidylserine (LPS), 16:0/16:0-phosphatidic acid (PA),18:0/18:0-phosphatidylglycerol (PG), 15:0/15:0-PG, 16:0/18:1-phosphatidylinositol (PI), 16:0/16:0-phosphatidylserine (PS),(18:1)4-cardiolipin (CL), d18:1/12:0-sphingomyelin (SM), d18:1/16:0-monohexosylceramide (MHC), d18:1/16:0-dihexosyl-
ceramide (DHC), d18:1/14:0-ceramide (Cer), d18:1/22:0-ceramide(Cer), and d18:1/24:0-trihexosylceramide (THC)) used to establishthe run conditions of nLC-ESI-MS/MS were purchased from Avanti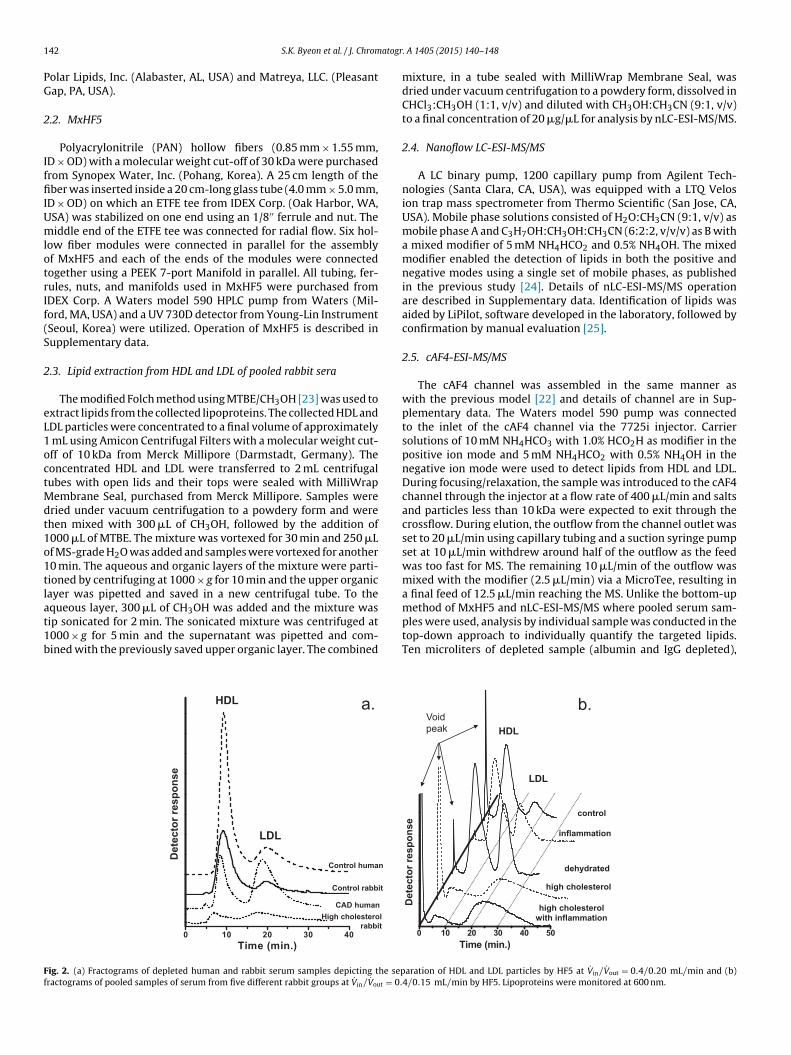
1 atogr
PG
2
IffiIUmlotrIf(S
2
eL1octMdt1o1tlat1b
Ff
42 S.K. Byeon et al. / J. Chrom
olar Lipids, Inc. (Alabaster, AL, USA) and Matreya, LLC. (Pleasantap, PA, USA).
.2. MxHF5
Polyacrylonitrile (PAN) hollow fibers (0.85 mm × 1.55 mm,D × OD) with a molecular weight cut-off of 30 kDa were purchasedrom Synopex Water, Inc. (Pohang, Korea). A 25 cm length of theber was inserted inside a 20 cm-long glass tube (4.0 mm × 5.0 mm,
D × OD) on which an ETFE tee from IDEX Corp. (Oak Harbor, WA,SA) was stabilized on one end using an 1/8′′ ferrule and nut. Theiddle end of the ETFE tee was connected for radial flow. Six hol-
ow fiber modules were connected in parallel for the assemblyf MxHF5 and each of the ends of the modules were connectedogether using a PEEK 7-port Manifold in parallel. All tubing, fer-ules, nuts, and manifolds used in MxHF5 were purchased fromDEX Corp. A Waters model 590 HPLC pump from Waters (Mil-ord, MA, USA) and a UV 730D detector from Young-Lin InstrumentSeoul, Korea) were utilized. Operation of MxHF5 is described inupplementary data.
.3. Lipid extraction from HDL and LDL of pooled rabbit sera
The modified Folch method using MTBE/CH3OH [23] was used toxtract lipids from the collected lipoproteins. The collected HDL andDL particles were concentrated to a final volume of approximately
mL using Amicon Centrifugal Filters with a molecular weight cut-ff of 10 kDa from Merck Millipore (Darmstadt, Germany). Theoncentrated HDL and LDL were transferred to 2 mL centrifugalubes with open lids and their tops were sealed with MilliWrap
embrane Seal, purchased from Merck Millipore. Samples wereried under vacuum centrifugation to a powdery form and werehen mixed with 300 �L of CH3OH, followed by the addition of000 �L of MTBE. The mixture was vortexed for 30 min and 250 �Lf MS-grade H2O was added and samples were vortexed for another0 min. The aqueous and organic layers of the mixture were parti-ioned by centrifuging at 1000 × g for 10 min and the upper organicayer was pipetted and saved in a new centrifugal tube. To the
queous layer, 300 �L of CH3OH was added and the mixture wasip sonicated for 2 min. The sonicated mixture was centrifuged at000 × g for 5 min and the supernatant was pipetted and com-ined with the previously saved upper organic layer. The combined0 10 20 30 40
De
tec
tor
res
po
ns
e
Time (min.)
HDL
LDL
Control human
Control rabbit
CAD human
High cholesterol
rabbit
a.
ig. 2. (a) Fractograms of depleted human and rabbit serum samples depicting the sepractograms of pooled samples of serum from five different rabbit groups at V̇in/V̇out = 0.
. A 1405 (2015) 140–148
mixture, in a tube sealed with MilliWrap Membrane Seal, wasdried under vacuum centrifugation to a powdery form, dissolved inCHCl3:CH3OH (1:1, v/v) and diluted with CH3OH:CH3CN (9:1, v/v)to a final concentration of 20 �g/�L for analysis by nLC-ESI-MS/MS.
2.4. Nanoflow LC-ESI-MS/MS
A LC binary pump, 1200 capillary pump from Agilent Tech-nologies (Santa Clara, CA, USA), was equipped with a LTQ Velosion trap mass spectrometer from Thermo Scientific (San Jose, CA,USA). Mobile phase solutions consisted of H2O:CH3CN (9:1, v/v) asmobile phase A and C3H7OH:CH3OH:CH3CN (6:2:2, v/v/v) as B witha mixed modifier of 5 mM NH4HCO2 and 0.5% NH4OH. The mixedmodifier enabled the detection of lipids in both the positive andnegative modes using a single set of mobile phases, as publishedin the previous study [24]. Details of nLC-ESI-MS/MS operationare described in Supplementary data. Identification of lipids wasaided by LiPilot, software developed in the laboratory, followed byconfirmation by manual evaluation [25].
2.5. cAF4-ESI-MS/MS
The cAF4 channel was assembled in the same manner aswith the previous model [22] and details of channel are in Sup-plementary data. The Waters model 590 pump was connectedto the inlet of the cAF4 channel via the 7725i injector. Carriersolutions of 10 mM NH4HCO3 with 1.0% HCO2H as modifier in thepositive ion mode and 5 mM NH4HCO2 with 0.5% NH4OH in thenegative ion mode were used to detect lipids from HDL and LDL.During focusing/relaxation, the sample was introduced to the cAF4channel through the injector at a flow rate of 400 �L/min and saltsand particles less than 10 kDa were expected to exit through thecrossflow. During elution, the outflow from the channel outlet wasset to 20 �L/min using capillary tubing and a suction syringe pumpset at 10 �L/min withdrew around half of the outflow as the feedwas too fast for MS. The remaining 10 �L/min of the outflow wasmixed with the modifier (2.5 �L/min) via a MicroTee, resulting ina final feed of 12.5 �L/min reaching the MS. Unlike the bottom-up
method of MxHF5 and nLC-ESI-MS/MS where pooled serum sam-ples were used, analysis by individual sample was conducted in thetop-down approach to individually quantify the targeted lipids.Ten microliters of depleted sample (albumin and IgG depleted),0 10 20 30 40 50
De
tec
tor
res
po
ns
e
Time (min. )
control
inflammation
dehydrated
high cholesterol
high cholesterol
with inflammation
HDL
LDL
b.Void
peak
aration of HDL and LDL particles by HF5 at V̇in/V̇out = 0.4/0.20 mL/min and (b)4/0.15 mL/min by HF5. Lipoproteins were monitored at 600 nm.

atogr
aaifsnif
3
apVsFoisctptamt
FT
S.K. Byeon et al. / J. Chrom
long with 500 ng CA as an IS, and 30 �L of depleted sample,long with 2 �g CA, were analyzed in the positive and negativeon modes, respectively. After each run, the channel was washedor 30 min to avoid the sample carry-over phenomenon. The lipidpecies that showed significant differences between the groups byLC-ESI-MS/MS were selected for analysis by top-down FFF-MS
n the SRM mode. The ESI voltage was set to 3.0 kV and in-sourceragmentation of 40 V with a collision energy of 40% was applied.
. Results and discussion
FlFFF separations of HDL and LDL from rabbit sera (controlnd high cholesterol group) and human plasma (control and CADatient) samples are compared in Fig. 2a which was obtained at
˙ in/V̇out = 0.4/0.20 mL/min using a single module of HF5. Eacherum sample was stained with SBB for detection at 600 nm. Inig. 2a, the level of HDL from CAD patient was decreased while thatf LDL was increased along with a reduction in LDL sizes (decreasen retention time), compared to those of healthy human controls, ashown in an earlier report [15]. Compared to the human control, theoncentration of lipoproteins from the rabbit control (same injec-ion volume, 20 �L of depleted plasma) was a lot lower but similarrofiles of the relative level of each lipoprotein and the reten-
ion times of HDL and LDL were observed. The latter supports thessumption that the lipoprotein sizes in rabbit serum are approxi-ately the same as those in human serum. For the CAD patient andhe rabbit with HC, the relative level of HDL was decreased while
ig. 3. Principle component analysis (PCA) plots of all lipids quantified from (a) HDL and (b)he loading plot on the right depicts relatively high distribution of lipids according to the
. A 1405 (2015) 140–148 143
that of LDL was increased, compared to that of each control. As thepeak of LDL from rabbits with HC was observed to be very broad,unlike that of other samples, LDLs under HC conditions can beassumed to exist in a wide range of particle sizes. Details of the elu-tion patterns, obtained at V̇in/V̇out = 0.40/0.15 mL/min, of otherrabbit sera from the five groups of rabbits that were pooled by groupare shown in Fig. 2b. A slightly different flow condition was utilizedin Fig. 2b in order to ensure the complete separation of HDL and LDLand avoid any overlap as much as possible. Fig. S1 in Supplementarydata shows the fractograms of lipoproteins from 20 �L individualserum samples (depleted) and a pooled sample from rabbits withHC by HF5 (single channel), and demonstrates that they all sharesimilar retention times for the lipoproteins whether the samplesare pooled or not. This supports the conclusion that the fractogramspresented in Fig. 2b (all pooled samples) are a good reflection ofthe individual samples. As the retention times of HDL from the con-trol, inflammation, and dehydrated models are similar to each other(8.8 ± 0.4, 9.2 ± 0.4, and 9.0 ± 0.3 min (n = 3) in Fig. 2b, respectively),they share similar sizes of HDL particles. However, the HDL amountof dehydrated models was the highest among all groups. This canbe partially explained by the increased concentration of all lipo-proteins due to the reduced amount of water in the body. A similarresult was observed in the LDL peaks; the retention times of LDL
were detected at 19.5 ± 1.0, 19.0 ± 0.9, and 20.1 ± 0.7 min (n = 3) forcontrol, inflammation, and dehydrated models, respectively. How-ever, the levels of LDL, calculated based on the peak area, weredifferent such that LDL from the inflammation model was increasedLDL from pooled serum samples of the different rabbit groups using nLC-ESI-MS/MS. scores plot on the left.

144 S.K. Byeon et al. / J. Chromatogr. A 1405 (2015) 140–148
Fig. 4. Relative peak area (vs. IS) of lipid species from HDL (underlined and star marked) LDL (bold and star marked) exhibiting more than a 10-fold difference between rabbitg
adodioOsiHgti
pamLtrfasautscdoap(Sola
roups, based on the analysis by nLC-ESI-MS/MS.
bout twofold compared to that of control, while LDL in the dehy-rated model was increased by more than threefold. While the sizesf the lipoprotein particles from both the inflammation and dehy-ration models remained unchanged based on the slight change
n retention times, it would be expected that the increased levelf LDL may play a role in the development of metabolic diseases.n the other hand, a HC (high cholesterol) diet affected both the
ize and the level of lipoproteins in rabbit groups with or withoutnduced inflammation. While the levels of HDL for both the HC andCI groups was significantly lower, those of LDL were increased byreater than three- to fourfold for the HC and HCI groups, respec-ively. It is apparent that the changes in HDL and LDL were morentense when the inflammation effect was combined with HC.
Based on the separation of the single HF5 in Fig. 2b, the lipo-roteins from 100 �L of pooled serum samples were separated for
semi-preparative scale collection of lipoproteins by the MxHF5odules (V̇in/V̇out = 2.4/0.9 mL/min). Lipids from these HDL and
DL fractions were analyzed by nLC-ESI-MS/MS, yielding the iden-ification of a total of 122 and 104 lipid species from HDL and LDL,espectively, as listed in Table S1 in Supplementary data. The datarom each lipid species listed in Table S1 represent the relative peakreas which are the ratios of the measured peak areas of the targetpecies to that of an internal standard (IS, 1 pmol of 13:0/13:0-PC),fter the peak areas from each species were multiplied by the vol-me of the dissolving solvent added to the dried lipids at the end ofhe extraction in order to adjust the lipid concentration. The pos-ible combinations of the three acyl chains of triacylglycerol (TG)onfirmed by CID spectra are listed in Table S2 in Supplementaryata, without information on the exact chain locations. For a briefverview of the statistical difference in the distribution of lipidsmong groups, results of principal component analysis (PCA) werelotted as shown in Fig. 3, based on the relative peak area ratiosvariables) from all five groups of pooled samples (subjects) in Table
1. The scores plots on the left of Fig. 3a and b show five subjectsf groups scattered at different positions and the correspondingoading plots on the right demonstrate the distribution of all 122nd 104 lipids from HDL and LDL, respectively. As components onloading plots reflect the high abundance of variables on the equiv-alent location of scores plot, the clustered points (lipids) on fartherright from the loading plot of Fig. 3a indicate relatively high amountof lipids among controls for HDL. In Fig. 3b, the clustered com-ponents on the loading plot denote HC and HCI groups to showrelatively high abundance of lipids for LDL. During this analysis, sev-eral important findings were obtained. 18:0-LPA and 18:1/18:2-PIderived from LDL were not detected at all in the control, inflam-mation, and dehydrated groups, but appeared in two other groups(HC and HCI) at relatively high concentrations, as their peak arearatios were close to or over 1 (relative to 1 pmol of IS) in TableS1. Also, the results of nLC-ESI-MS/MS support the idea that thelevel of lipoproteins does not represent the overall level of lipids,and consequently suggests that an analysis of lipoprotein specificlipids is required. For example, the overall concentrations of LPCfrom HDL were generally highest in HC group, unlike other species.For PC from HDL, the controls had the highest concentrations, fol-lowed by the inflammation and dehydrated groups which sharedsimilar levels, and the HC and HCI groups. The differences betweenthe HC and HCI groups were considerable with respect to PC levels,but insignificant for LPE, PE, SM, PA, PG, Cer and MHC levels. ForLDL, the HCI group had the highest overall concentrations of mostlipid classes. While many species showed differences in concentra-tion between the different rabbit groups, 7 species (3 PC, 3 TG, 1PS) from HDL and 14 species (2 LPC, 5 PC, 1 LPA, 6 PI) from LDLexhibited significant differences of greater than 10-fold betweenthe groups with the highest and lowest concentrations of the cor-responding species with p-values from t test smaller than 0.01, andthese species are marked in bold in Table S1. These species withsignificant differences were selected for targeted analysis using thetop-down method and are listed in Table 1, which will be describedlater in detail. Also, peak area ratios of these species are plotted inFig. 4 and it clearly illustrates that levels of most lipids from LDL
were much higher in HC or HCI groups than the other three groups.This supports the hypothesis that a HC diet affects the concentra-tions of lipids in LDL more than in HDL, as the 16:0/20:4-PC specieswas increased in the HCI group by approximately 45-fold compared
S.K. Byeon et al. / J. Chromatogr. A 1405 (2015) 140–148 145
Table 1Comparison of quantification of lipids from lipoproteins between nLC-ESI-MS/MS and cAF4-ESI-MS/MS. The relative peak areas ratios from control, inflammation, dehydrated,and HC groups are written in respect to those of HCI for direct comparison.
Class Molecularspecies
m/z Lipo-proteins
Control/HCI Inflammation/HCI Dehydrated/HCI HC/HCI
nLC–MS/MS cAF4-MS/MS nLC–MS/MS cAF4-MS/MS nLC–MS/MS cAF4-MS/MS nLC–MS/MS cAF4-MS/MS
LPC 16:0 496.5 HDL 2.65 ± 0.68 2.30 ± 1.14 1.55 ± 0.23 1.78 ± 0.98 1.06 ± 0.21 1.34 ± 0.67 4.03 ± 1.00 2.67 ± 1.47LDL 0.11 ± 0.02 N.Q. 0.05 ± 0.01 N.Q. 0.08 ± 0.01 N.Q. 0.81 ± 0.18 N.Q.
18:0 524.5 HDL 2.60 ± 0.77 2.43 ± 0.61 2.63 ± 0.38 2.33 ± 0.82 1.77 ± 0.29 2.02 ± 0.50 2.20 ± 0.35 1.61 ± 0.42LDL 0.05 ± 0.01 N.Q. 0.04 ± 0.01 N.Q. 0.05 ± 0.01 N.Q. 1.07 ± 0.21 1.04 ± 0.59
PC 36:5 780.5 HDL 6.46 ± 0.44 10.08 ± 3.20 2.88 ± 0.21 6.35 ± 1.86 4.08 ± 0.19 6.89 ± 2.45 1.50 ± 0.14 1.95 ± 0.74LDL N.D. N.Q. 0.17 ± 0.15 N.Q. 0.24 ± 0.08 0.29 ± 0.08 0.86 ± 0.34 0.98 ± 0.21
36:4 782.5 HDL 6.92 ± 0.44 9.61 ± 2.47 3.85 ± 0.33 4.33 ± 0.58 3.26 ± 0.24 4.18 ± 0.73 1.88 ± 0.15 1.13 ± 0.31LDL 0.02 ± 0.00 N.Q. 0.14 ± 0.02 N.Q. 0.15 ± 0.03 0.31 ± 0.09 0.77 ± 0.07 0.92 ± 0.21
34:1 758.5 HDL 5.74 ± 0.80 6.08 ± 1.73 4.03 ± 0.29 4.65 ± 1.31 3.94 ± 0.40 3.85 ± 1.13 1.30 ± 0.07 1.20 ± 0.29LDL 0.02 ± 0.00 N.Q. 0.11 ± 0.02 N.Q. 0.16 ± 0.05 0.15 ± 0.03 0.77 ± 0.11 0.82 ± 0.20
36:3 784.5 HDL 5.36 ± 0.62 7.88 ± 2.78 2.64 ± 0.36 3.71 ± 0.94 1.98 ± 0.23 2.96 ± 0.67 1.47 ± 0.19 1.17 ± 0.32LDL 0.02 ± 0.00 N.Q. 0.12 ± 0.03 0.16 ± 0.07 0.10 ± 0.03 0.18 ± 0.08 0.73 ± 0.11 0.69 ± 0.21
36:2 786.5 HDL 6.82 ± 0.91 7.11 ± 1.54 3.98 ± 0.43 4.58 ± 1.37 3.39 ± 0.34 3.58 ± 0.77 1.51 ± 0.16 1.16 ± 0.28LDL 0.03 ± 0.01 N.Q. 0.15 ± 0.03 N.Q. 0.15 ± 0.01 0.24 ± 0.06. 0.70 ± 0.06 0.59 ± 0.21
TG 54:7 894.8 HDL 14.33 ± 1.00 11.37 ± 3.09 4.67 ± 0.57 4.22 ± 1.46 3.33 ± 0.87 2.61 ± 0.95 1.33 ± 0.09 1.05 ± 0.33LDL 1.00 ± 0.00 N.Q. 1.00 ± 0.25 N.Q. 1.00 ± 0.00 N.Q. 1.00 ± 0.00 N.Q.
52:4 872.9 HDL 10.53 ± 0.96 13.53 ± 5.17 5.26 ± 0.47 7.58 ± 2.07 6.24 ± 0.57 8.29 ± 2.55 2.06 ± 0.18 1.37 ± 0.35LDL 0.15 ± 0.01 0.66 ± 0.26 0.51 ± 0.11 0.62 ± 0.23 0.51 ± 0.09 0.68 ± 0.24 0.85 ± 0.03 0.81 ± 0.31
PI 18:1, 18:2 859.5 HDL 3.74 ± 0.66 4.43 ± 0.73 3.00 ± 0.64 4.28 ± 1.15 1.70 ± 0.29 3.31 ± 0.57 1.43 ± 0.25 1.46 ± 0.52LDL N.D. N.D. N.D. N.D. N.D. N.D. 0.96 ± 0.07 0.76 ± 0.21
16:0,18:1 835.6 HDL 4.32 ± 0.43 4.00 ± 1.46 3.00 ± 0.64 3.72 ± 1.34 2.03 ± 0.38 3.35 ± 1.33 1.65 ± 0.23 1.40 ± 0.54LDL 0.09 ± 0.01 N.Q. 0.11 ± 0.01 0.20 ± 0.07 0.15 ± 0.01 N.Q. 0.93 ± 0.09 0.95 ± 0.14
18:0,20:4 885.6 HDL 3.97 ± 0.35 3.37 ± 1.03 4.06 ± 0.33 3.97 ± 1.29 7.17 ± 0.51 6.76 ± 3.22 1.66 ± 0.31 1.21 ± 0.44LDL 0.03 ± 0.00 N.Q. 0.14 ± 0.02 0.10 ± 0.03 0.23 ± 0.01 0.29 ± 0.11 0.87 ± 0.08 0.86 ± 0.32
18:0, 18:2 861.6 HDL 6.68 ± 0.83 6.33 ± 1.97 5.01 ± 1.81 5.63 ± 1.68 4.40 ± 0.40 4.76 ± 2.52 1.57 ± 0.40 1.08 ± 0.30LDL 0.05 ± 0.00 N.Q. 0.15 ± 0.02 0.17 ± 0.05 0.17 ± 0.03 0.20 ± 0.05 0.95 ± 0.06 0.86 ± 0.38
18:0,20:3 887.6 HDL 3.86 ± 0.88 N.Q. 5.00 ± 1.76 N.Q. 5.48 ± 1.66 N.Q. 1.43 ± 0.28 N.Q.LDL 0.10 ± 0.01 N.Q. 0.14 ± 0.02 N.Q. 0.18 ± 0.02 N.Q. 0.72 ± 0.07 0.83 ± 0.43
18:0, 18:1 863.6 HDL 4.86 ± 0.85 5.89 ± 0.93 4.00 ± 0.50 5.32 ± 0.75 2.57 ± 0.50 2.88 ± 1.44 1.14 ± 0.11 1.59 ± 0.33LDL 0.10 ± 0.04 N.Q. 0.16 ± 0.03 N.Q. 0.16 ± 0.02 0.54 ± 0.26 0.92 ± 0.12 0.96 ± 0.22
PS 18:0, 18:2 786.5 HDL 18.33 ± 2.97 25.91 ± 9.27 10.00 ± 2.54 13.42 ± 5.12 6.33 ± 0.81 24.96 ± 10.6 2.00 ± 0.25 1.86 ± 1.11LDL N.D. N.D. N.D. N.D. N.D. N.D. 0.94 ± 0.34 0.97 ± 0.24
0.43
wfcats
Hfsscidmft1(ifgPtofasP
LPA 18:0 437.5 HDL 2.30 ± 0.29 1.31 ± 0.97 3.29 ±LDL N.D. N.D. N.D.
ith controls. According to a study that investigated total TG levelsrom participants who were fed diets with either 1400 or 400 mg ofholesterol per day for a month, TG levels increased slightly but nots dramatically as 10-fold [26]. Similar result was observed fromhis study in agreement, in which levels of only 3 TG species wereignificantly altered (> 10-fold) by metabolic factors.
While the 20 lipid species (16:0/20:4-PC selected for bothDL and LDL) in Fig. 4 were selected as target lipid molecules
rom the bottom-up quantitative analysis by nLC-ESI-MS/MS, theame species were quantified again by the top-down lipid analy-is of individual samples using cAF4-ESI-MS/MS. Fig. 5 shows theomparison of the extracted ion fractograms (EIFs) obtained bynjecting individual sample into cAF4-ESI-MS/MS at a flow rate con-ition for cAF4, V̇in/V̇out = 0.40/0.013 in mL/min, using the SRMethod. For instance, the fractograms in Fig. 5a were generated
rom the detection of 34:1-PC which was obtained by extractinghe peak intensity of a specific product ion (m/z 575.6, [M+H-83]+) from the SRM transition of the precursor ion m/z 758.6[M+H]+). In cAF4-ESI-MS/MS, PC species were selectively mon-tored by the SRM transition of [M+H]+ → [M+H-183]+, a typicalragment ion resulting from the loss of a phosphocholine headroup (HPO4(CH2)2N(CH3)3, 183 Da). The data in Fig. 5b is for 36:3-C and was based on the SRM transition of (m/z 784.6 → 601.6). Dueo the detection of PC as a loss of a head group, the chain structuref the PC species from cAF4-ESI-MS/MS analysis was written in the
orm of the total carbon number of acyl chains and double bondss 36:3-PC instead of the R1/R2 forms. Therefore, the summedignals from the possible isomers, such as 18:1/18:2-PC, 18:0/20:3-C, etc., which were not distinguishable in cAF4-ESI-MS/MS2.14 ± 0.62 0.86 ± 0.11 2.15 ± 0.98 1.51 ± 0.22 1.67 ± 0.78N.D. N.D. N.D. 0.87 ± 0.16 N.Q.
are listed in Table 1. However, other lipid species are expressedwith the full chain structures as their quantifier ions enable oneto distinguish chain structures. For the compensation of run-to-run variation in cAF4-ESI-MS/MS, carbonic anhydrase (CA) wasadded to each rabbit sample as an IS (500 ng and 2 �g for posi-tive and negative ion modes, respectively, for each injection) sothat the concentration of each lipid species could be expressed asa relative peak area to that of CA (based on a SRM transition ofm/z 1001.5 ([M+29H]+29) → 983.5 (y+8
69 ) in positive ion mode andof 1318.3 ([M−22H]−22) → 1301.3 (y−12
141 ) in negative ion mode).A lipid standard could not be included to sample as an IS sincethe membrane from cAF4 would not be able to retain it (10 kDaMWCO), while a protein standard like CA (29 kDa) would be eas-ily retained. Although CA exists in human blood plasma, the effectof natural CA in plasma on quantitation can be treated as negli-gible compared to the amount added and its addition as IS holdsno effect on ionization efficiency of lipids, according to a previ-ous report [22]. In Fig. 5, the targeted lipid species detected bycAF4-ESI-MS/MS exhibited distinct differences in concentrationbetween lipoproteins (HDL and LDL) and between the differentrabbit groups. The HC and HCI groups exhibited extremely smallHDL peaks compared to those from the other three groups, whilethey showed much larger and broader peaks of LDL. In particular,the 34:1-PC molecules appeared to be similar in their abundancesin HDLs from control and inflammation groups (Fig. 5a), however,
36:3-PC decreased significantly in the inflammation group com-pared to that of the control sample (Fig. 5b). This demonstrates thefeasibility of top-down lipidomic analysis with cAF4-ESI-MS/MSusing SRM to distinguish and quantify lipids that exist in different
146 S.K. Byeon et al. / J. Chromatogr. A 1405 (2015) 140–148
a. 34:1-PC b. 36:3-PC
control
inflammation
dehydrated
HC
HCI
HDL
LDL
0 10 20 30 40
Time (min.)
MS
In
ten
sit
y
0 10 20 30 40
Time (min.)
F 8.6 →r
clneralsoanc[pc8aiop
Fa
ig. 5. Extracted ion fractograms (EIFs) from SRM transition of (a) 34:1-PC (of m/z 75abbit groups.
oncentrations. Results from the quantification of the 20 selectedipids by cAF4-ESI-MS/MS were compared with those obtained byLC-ESI-MS/MS (listed in Table S1). In order to overcome differ-nces in the measured values between the two analytical methods,esults were normalized by calculating the ratio of the peak area of
species to that of the HCI group as a normalization reference, asisted in Table 1. Since the HCI group contained most of the lipidpecies that were selected for the quantitative comparison whilether rabbit groups did not, data from the HCI group was utilizeds a reference to compare the relative amounts obtained betweenLC-ESI-MS/MS and cAF4-ESI-MS/MS. Quantified ions of other lipidlasses were as follows: [M+NH4]+ → [M+NH4-RCOONH4]+ for TGs,M−H]− → [M−H-RCOOH]− for PIs, of which the product ions wereroduced from the loss of an acyl chain in the form of ammoniumarboxylate or carboxylic acid, respectively, and [M−H]− → [M−H-7]− for PSs, in which 87 amu was from serine (C3H5NO2). Theverage peak area ratio of each species with respect to HCI group
s plotted in Fig. 6, with filled symbols for the LC–MS results andpen symbols for the cAF4-MS results. For instance, the averageeak area ratios of 34:1-PC from HDL with respect to the HCIig. 6. Comparison of peak area ratios of lipids species from HDL and LDL, with respect to thnd cAF4-ESI-MS/MS methods.
575.6) and (b) 36:3-PC (m/z 784.6 → 601.6) by cAF4-ESI-MS/MS for the five different
group were 5.74 ± 0.80 vs. 6.08 ± 1.73 (nLC-ESI-MS/MS vs. cAF4-ESI-MS/MS methods) for the control, 4.03 ± 0.29 vs. 4.65 ± 1.31 forthe inflammation group, 3.94 ± 0.40 and 3.85 ± 1.13 for the dehy-drated group, and 1.30 ± 0.07 (nLC-ESI-MS/MS) and 1.20 ± 0.29 forthe HC group. The lipid species plotted in Fig. 6 are those found inFig. 4 and show relatively large differences in comparison to theHCI group. Analyses of these species demonstrated that the nLC-ESI-MS/MS and cAF4-ESI-MS/MS results were similar. Paired t-testto compare individual differences between the two methods wascarried out for the selected species and the resulting p-values arelisted in Table S3 in Supplementary data. As the values are mostlyhigher than 0.05, the two methods are not significantly different atthe 95% confidence level for most of the selected species, except fora few with less than a fivefold of difference with respect to the HCIgroup. These exceptions found with a few species may originatefrom spectral congestion when the different lipids were simulta-neously introduced to MS in the form of lipoprotein particles by
cAF4-ESI-MS/MS, and in part from relatively poor ionization due tothe introduction of the aqueous carrier solution of cAF4 to MS. Eventhough a stream of CH3CN with ionization modifiers was mixedose of the corresponding species from the HCI group, determined by nLC-ESI-MS/MS

atogr
waitascfe
4
saawcoclisftomstabtstwoptEreiosNhehrsbspiw“s
A
D(P2
[
[
[
[
[
[
[
[
[
[
[
[
[
S.K. Byeon et al. / J. Chrom
ith the cAF4 effluent on-line prior to ESI, a considerable amount ofqueous solvent lowers the ionization efficiency compared to thenjection with organic solvents to ESI when nLC was used. Thesewo effects have a significant influence on the quantitation of lowbundant lipid species by cAF4-ESI-MS/MS. Nonetheless, the lipidpecies shown in Fig. 6 support the conclusion that the top-downAF4-ESI-MS/MS method can be utilized as an alternative platformor targeted lipidomic analysis once the target species are wellstablished.
. Conclusion
In this study, lipidomic analysis of lipoproteins from rabbiterum samples were carried out to elucidate the lipid speciesffected by different metabolic conditions using both bottom-upnd top-down approaches. As expected, the PLs of rabbits variedith their metabolic conditions, and the HC and HCI groups (high
holesterol-treated groups) showed the most contrasting amountf PLs when compared to those of healthy controls. The overalloncentrations of lipids from HDL were highest in controls andowest in HC-treated groups, while those from LDL were highestn both of the HC-treated groups and lowest in controls. This studyhows that a HC diet causes profile of most PLs and TGs to differrom those of healthy controls far more seriously than inflamma-ion or dehydration. Also, multiple factors, such as consumptionf a HC diet combined with inflammation, are found to be evenore threatening than a HC diet alone. Of the 122 and 104 lipid
pecies identified by nLC-ESI-MS/MS from HDL and LDL, respec-ively, from pooled serum samples of rabbits, 7 species from HDLnd 14 species from LDL showed greater than a 10-fold differenceetween the groups with the lowest and highest concentration ofhese corresponding species (p-values less than 0.01). Among thesepecies, 16:0/20:4-PC was the only species that exhibited greaterhan a 10-fold difference in both HDL and LDL between the groups,hile the remaining 19 species showed significant differences in
nly HDL or LDL. This indicates that lipids in different classes of lipo-roteins are differentially affected by metabolic conditions. Whenhey were quantified again from individual samples using cAF4-SI-MS/MS as a top-down direct analysis method, the quantitativeesults for the selected lipids from both methods were statisticallyquivalent for most of the selected species, with a few technical lim-tations. The latter may originate from a relatively poor ionizationf lipids due to the use of an aqueous solution for cAF4 and pos-ible spectral congestion during the direct injection of lipoprotein.onetheless, the top-down approach has the advantage of being aigh-speed screening method for targeted lipids. For instance, lipidxtraction of lipoprotein fractions from MxHF5 requires more thanalf a day of effort prior to nLC-ESI-MS/MS, while only 30 min wereequired for the depletion of highly abundant proteins from a bloodample for cAF4-ESI-MS/MS. When a large set of samples needs toe run, analysis by cAF4-ESI-MS/MS can be done in substantiallyhorter analysis time with simple preparation. As nLC-ESI-MS/MSrovides a comprehensive and untargeted analysis of lipid species,
t can serve as a primary platform to “scan” the lipidome of sampleshile the top-down platform of cAF4-ESI-MS/MS can be utilized to
spot” the targeted species during a high-speed screen from a largeet of samples.
cknowledgements
This study was supported by the Bio & Medical Technology
evelopment Program through the National Research FoundationNRF) of Korea funded by the Ministry of Science, ICT & Futurelanning (NRF-2013M3A9B6046413), and in part by a grant NRF-015R1A2A1A01004677.
[
. A 1405 (2015) 140–148 147
Appendix A. Supplementary data
Supplementary data associated with this article can be found, inthe online version, at http://dx.doi.org/10.1016/j.chroma.2015.05.059
References
[1] R.E. Pitas, R.W. Mahley, Analysis of tissue lipoproteins, in: C.A. Converse, E.R.Skinner (Eds.), Lipoprotein Analysis: A Practical Approach, Oxford UniversityPress, Oxford, 1992, pp. 215–242.
[2] J.F.H.M. Brouwers, E.A.A.M. Vernooij, A.G.M. Tielens, L.M.G. Van Golde, Rapidseparation and identification of phosphatidylethanolamine molecular species,J. Lipid Res. 40 (1999) 164–169.
[3] M.M. Wright, A.G. Howe, V. Zaremberg, Cell membranes and apoptosis: role ofcardiolipin, phosphatidylcholine, and anticancer lipid analogues, Biochem. CellBiol. 82 (2004) 18–26.
[4] L.M. Shaw, H. Vanderstichele, M. Knapik-Czajka, C.M. Clark, P.S. Aisen, R.C.Peterson, K. Blennow, H. Soares, A. Simon, P. Lewczuk, R. Dean, E. Siemers, W.Potter, V.M.Y. Lee, J.Q. Trojanowski, Cerebrospinal fluid biomarker signature inAlzheimer’s disease neuroimaging initiative subjects, Ann. Neurol. 65 (2009)403–413.
[5] K. Blennow, H. Hampel, M. Weiner, H. Zetterberg, Cerebrospinal fluid andplasma biomarkers in Alzheimer disease, Nat. Rev. Neurol. 6 (2010) 131–144.
[6] S.C. Sanderson, J. Waller, M.J. Jarvis, S.E. Humphries, J. Wardle, Public awarenessof genetic influence on chronic disease risk: are genetic and lifestyle causalbeliefs compatible? Patient Educ. Couns. 74 (2009) 221–227.
[7] P.W.F. Wilson, R.B.D. D’Agostino, D. Levy, A.M. Belanger, H. Silbershatz, W.B.Kannel, Prediction of coronary heart disease using risk factor categories, Circu-lation 97 (1998) 1837–1847.
[8] A.M. Mondul, S.J. Weinstein, J. Virtamo, D. Albanes, Serum 25-hydroxyvitaminD and risk of breast cancer: results of a large population-based case-controlstudy in Mexican women, Cancer Causes Control 22 (2011) 1545–1552.
[9] A. Hoffmeister, D. Rothenbacher, U. Bäzner, M. Fröhlich, H. Brenner, V. Hom-bach, W. Koenig, Role of novel markers of inflammation in patients with stablecoronary heart disease, Am. J. Cardiol. 87 (2001) 262–266.
10] J.M. Dickson, H.M. Weavers, N. Mitchell, E.M. Winter, I.D. Wilkinson, E.J.R. VanBeek, J.M. Wild, P.D. Griffiths, The effects of dehydration on brain volume –preliminary results, Int. J. Sports Med. 26 (2005) 481–485.
11] P. Wiesner, K. Leidl, A. Boettcher, G. Schmitz, G.J. Liebisch, Lipid profiling ofFPLC-separated lipoprotein fractions by electrospray ionization tandem massspectrometry, Lipid Res. 50 (2009) 574–585.
12] R.M. Krauss, D.J. Burke, Identification of multiple subclasses of plasma lowdensity lipoproteins in normal humans, J. Lipid Res. 23 (1982) 97–104.
13] S.B. Alabakovska, B.B. Todorova, D.D. Labudovic, K.N. Tosheska, Gradient gelelectrophoretic separation of LDL and HDL subclasses on BioRad Mini ProteanII and size phenotyping in healthy Macedonians, Clin. Chim. Acta 317 (2002)119–123.
14] B.A. Griffin, M.J. Caslake, B. Yip, G.W. Tait, C.J. Packard, J. Shepherd, Rapid iso-lation of low density lipoprotein (LDL) subfractions from plasma by densitygradient ultracentrifugation, Atherosclerosis 83 (1990) 59–67.
15] I. Park, K.J. Paeng, Y. Yoon, J.H. Song, M.H. Moon, Separation and selectivedetection of lipoprotein particles of patients with coronary artery diseaseby frit-inlet asymmetrical flow field-flow fractionation, J. Chromatogr. B 780(2002) 415–422.
16] D.C. Rambaldi, A. Zattoni, S. Casolari, P. Reschiglian, D. Roessner, C. Johann, Ananalytical method for size and shape characterization of blood lipoproteins,Clin. Chem. 53 (2007) 2026–2029.
17] D.C. Rambaldi, P. Reschiglian, A. Zattoni, D. Roessner, C. Johann, Enzymaticdetermination of cholesterol and triglycerides in serum lipoprotein profiles byasymmetrical flow field-flow fractionation with on-line, dual detection, Anal.Chim. Acta 654 (2009) 64–70.
18] J.Y. Ahn, K.H. Kim, J.Y. Lee, P.S. Williams, M.H. Moon, Effect of asymmetri-cal flow field-flow fractionation channel geometry on separation efficiency,J. Chromatogr. A 1217 (2010) 3876–3880.
19] J.Y. Lee, K.H. Kim, M.H. Moon, Evaluation of multiplexed hollow fiber flow field-flow fractionation for semi-preparative purposes, J. Chromatogr. A 1216 (2009)6539–6542.
20] S.K. Byeon, J.Y. Lee, S. Lim, D. Choi, M.H. Moon, Discovery of candidate phospho-lipid biomarkers in human lipoproteins with coronary artery disease by flowfield-flow fractionation and nanoflow liquid chromatography–tandem massspectrometry, J. Chromatogr. A 1270 (2012) 246–253.
21] K.H. Kim, J.Y. Lee, S. Lim, M.H. Moon, Top-down lipidomic analysis ofhuman lipoproteins by chip-type asymmetrical flow field-flow fractionation-electrospray ionization-tandem mass spectrometry, J. Chromatogr. A 1280(2013) 92–97.
22] I. Yang, K.H. Kim, J.Y. Lee, M.H. Moon, On-line asymmetrical flow field-flow fractionation-electrospray ionization-tandem mass spectrometry with
selected reaction monitoring for quantitative analysis of phospholipids inplasma lipoproteins, J. Chromatogr. A 1324 (2014) 224–230.23] S.K. Byeon, J.Y. Lee, M.H. Moon, Optimized extraction of phospholipidsand lysophospholipids for nanoflow liquid chromatography-electrosprayionization-tandem mass spectrometry, Analyst 137 (2012) 451–458.

1 atogr
[
[
48 S.K. Byeon et al. / J. Chrom
24] D.Y. Bang, S. Lim, M.H. Moon, Effect of ionization modifiers on the simultaneous
analysis of all classes of phospholipids by nanoflow liquid chromatogra-phy/tandem mass spectrometry in negative ion mode, J. Chromatogr. A 1240(2012) 69–76.25] S. Lim, S.K. Byeon, J.Y. Lee, M.H. Moon, Computational approach to the structuralidentification of phospholipids using raw mass spectra from nanoflow liquid
[
. A 1405 (2015) 140–148
chromatography-electrospray ionization-tandem mass spectrometry, J. Mass
Spectrom. 47 (2012) 1004–1014.26] E. Flaim, L.F. Ferreri, F.W. Thye, J.E. Hill, S.J. Ritchy, Plasma lipid and lipopro-tein cholesterol concentrations in adult males consuming normal and highcholesterol diets under controlled conditions, Am. J. Clin. Nutr. (34) (1981)1103–1108.