
Jorgen Randers
11
J Randers 1 J Randers 1 HANDELSHØYSKOLEN BI Should we use regulation or the market to solve the climate problem? Jorgen Randers Professor emeritus Climate strategy BI Norwegian Business SchoolI Club of Rome Berlin, 11. november 2016
-
Upload
andreas-huber -
Category
Presentations & Public Speaking
-
view
327 -
download
0
Transcript of Jorgen Randers
HANDELSHØYSKOLEN BI
J Randers 1J Randers 1
HANDELSHØYSKOLEN BI
Should we useregulation or the market
to solve the climate problem?Jorgen Randers
Professor emeritusClimate strategy
BI Norwegian Business SchoolI
Club of RomeBerlin, 11. november 2016
HANDELSHØYSKOLEN BI
J Randers 2
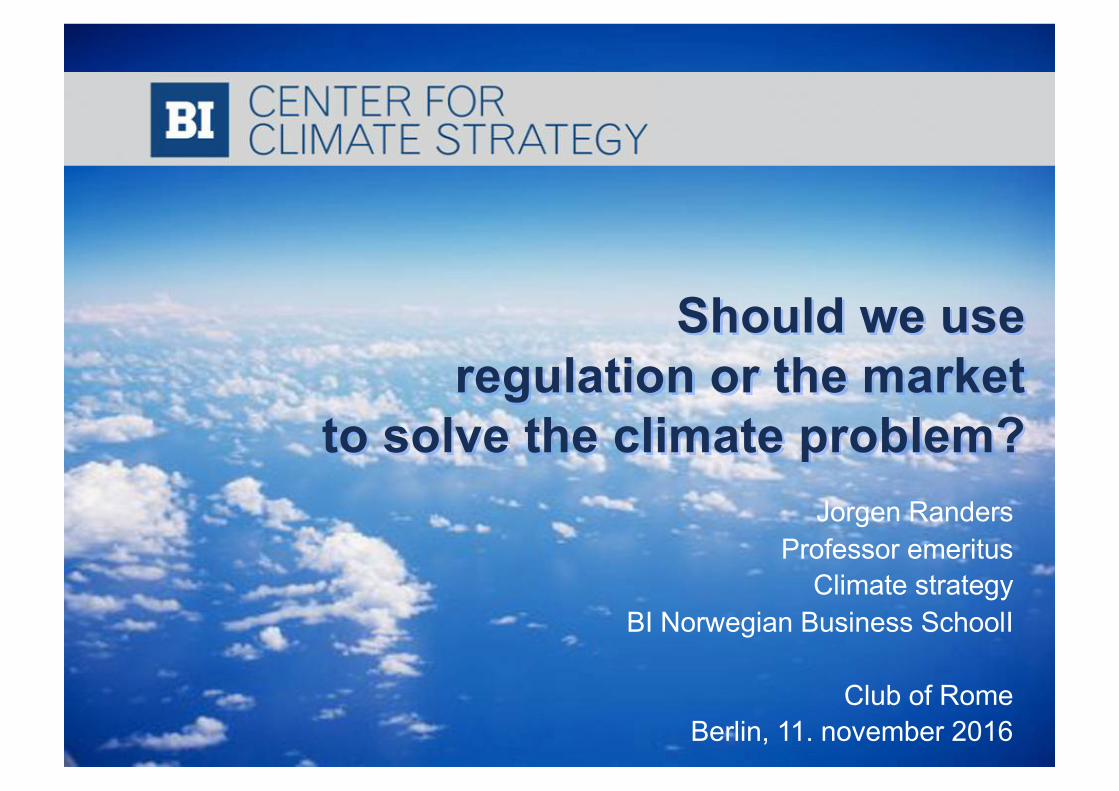
Most GHG is CO2 from energy production
Source: IEA, CO2 emissions from fuel combustion.. Highlights
HANDELSHØYSKOLEN BI
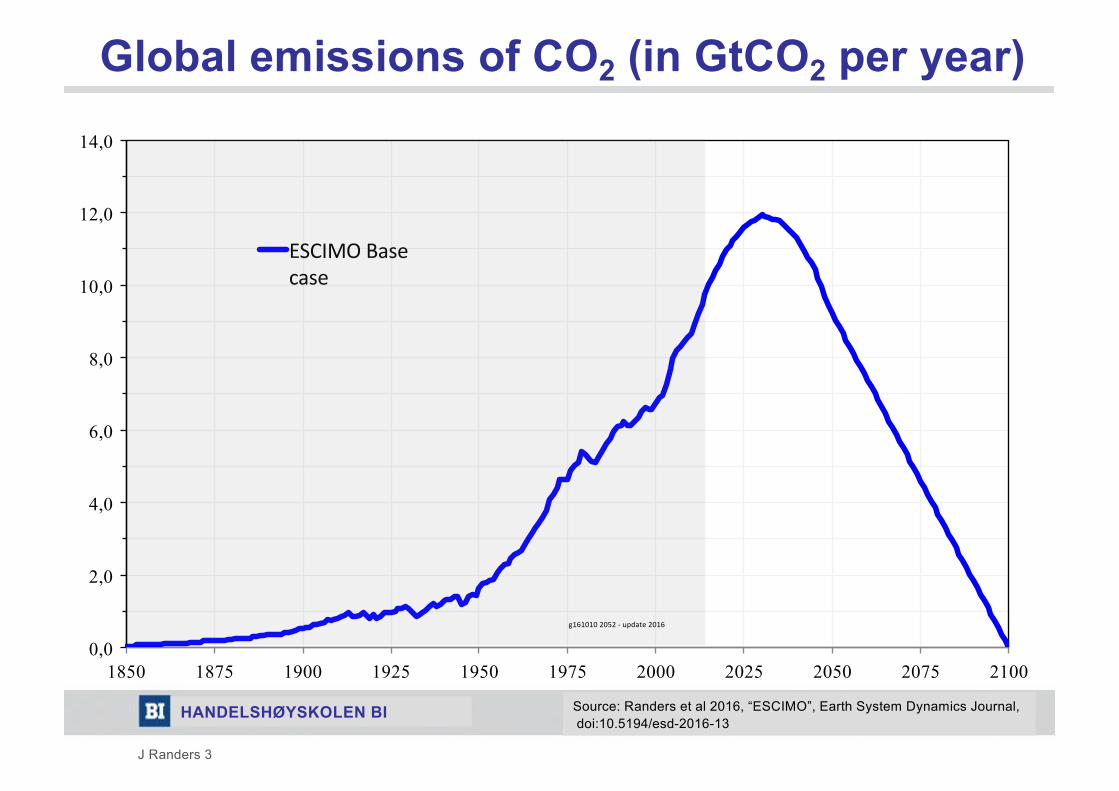
J Randers 3
Global emissions of CO2 (in GtCO2 per year)
Source: Randers et al 2016, “ESCIMO”, Earth System Dynamics Journal,doi:10.5194/esd-2016-13
0,0
2,0
4,0
6,0
8,0
10,0
12,0
14,0
1850 1875 1900 1925 1950 1975 2000 2025 2050 2075 2100
ESCIMOBasecase
g1610102052- update2016
HANDELSHØYSKOLEN BI
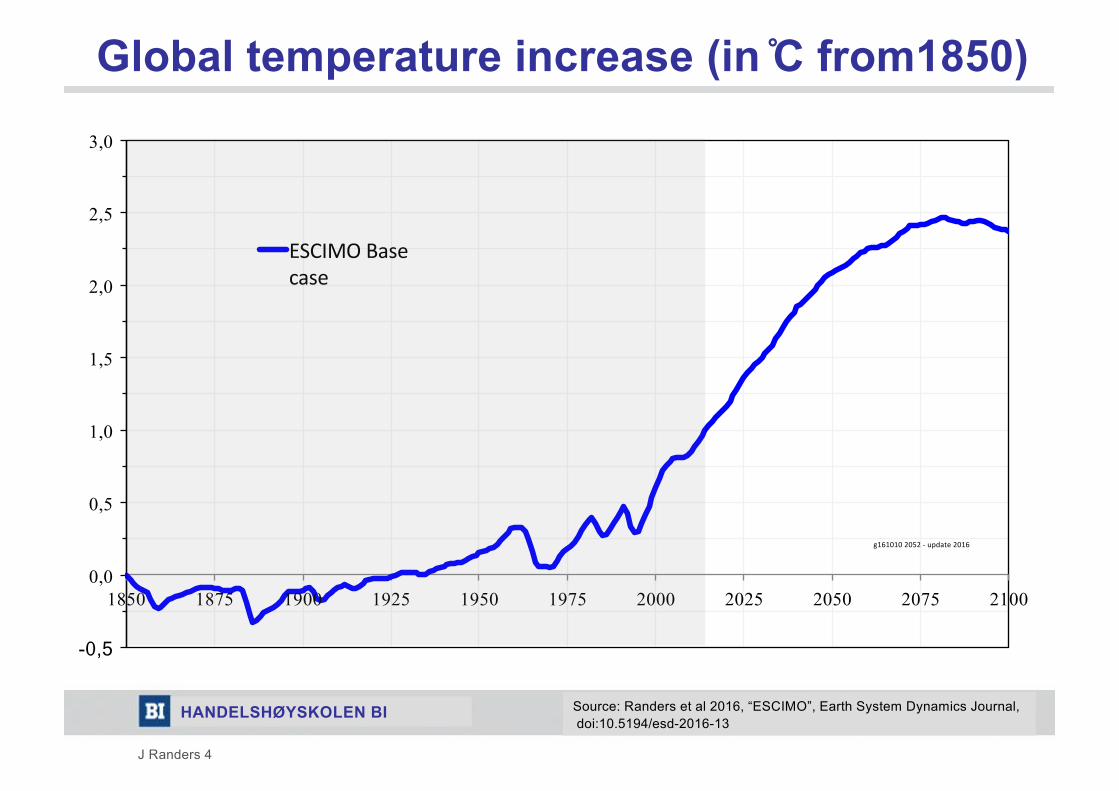
J Randers 4
Global temperature increase (in ̊C from1850)
Source: Randers et al 2016, “ESCIMO”, Earth System Dynamics Journal,doi:10.5194/esd-2016-13
-0,5
0,0
0,5
1,0
1,5
2,0
2,5
3,0
1850 1875 1900 1925 1950 1975 2000 2025 2050 2075 2100
ESCIMOBasecase
g1610102052- update2016
HANDELSHØYSKOLEN BI
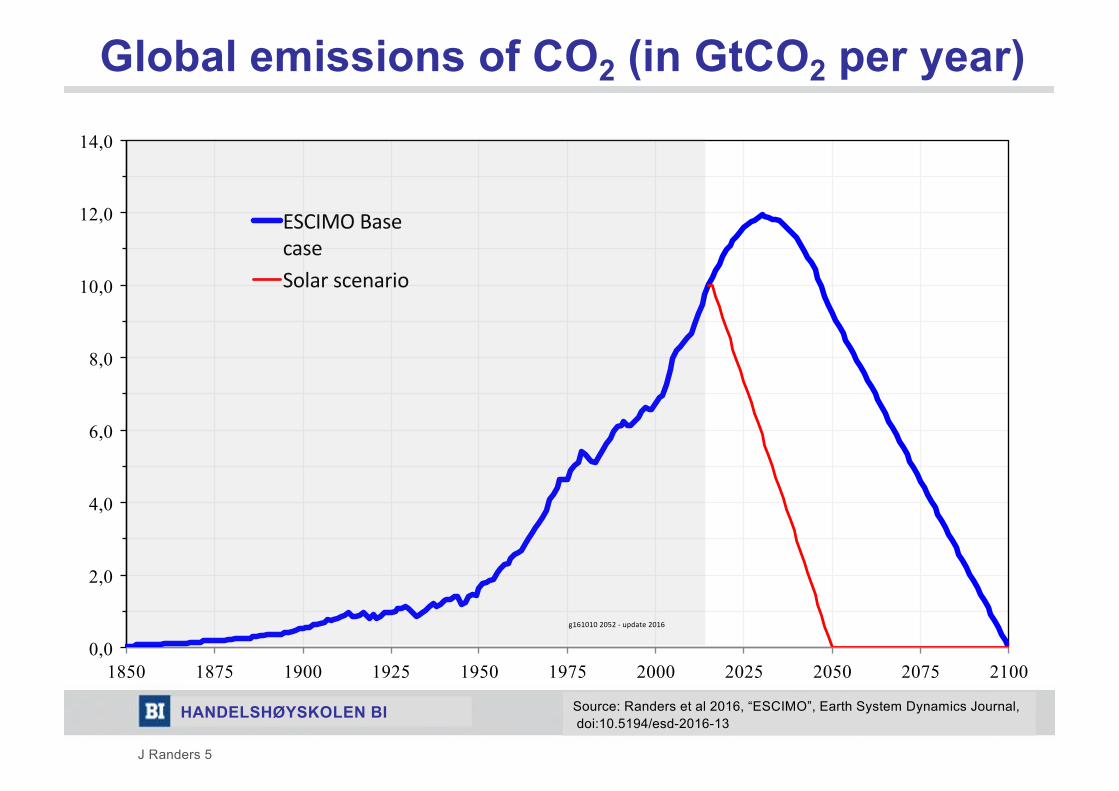
J Randers 5
Source: Randers et al 2016, “ESCIMO”, Earth System Dynamics Journal,doi:10.5194/esd-2016-13
0,0
2,0
4,0
6,0
8,0
10,0
12,0
14,0
1850 1875 1900 1925 1950 1975 2000 2025 2050 2075 2100
ESCIMOBasecaseSolarscenario
g1610102052- update2016
Global emissions of CO2 (in GtCO2 per year)
HANDELSHØYSKOLEN BI
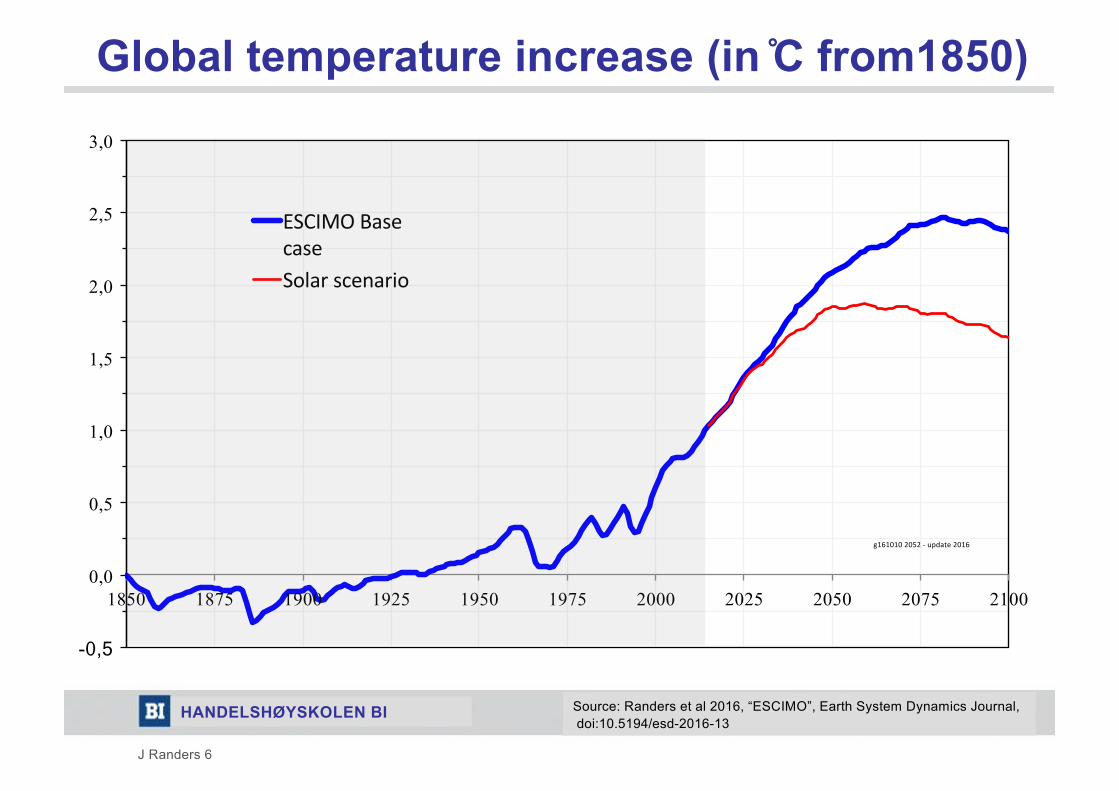
J Randers 6
Source: Randers et al 2016, “ESCIMO”, Earth System Dynamics Journal,doi:10.5194/esd-2016-13
-0,5
0,0
0,5
1,0
1,5
2,0
2,5
3,0
1850 1875 1900 1925 1950 1975 2000 2025 2050 2075 2100
ESCIMOBasecaseSolarscenario
g1610102052- update2016
Global temperature increase (in ̊C from1850)
HANDELSHØYSKOLEN BI
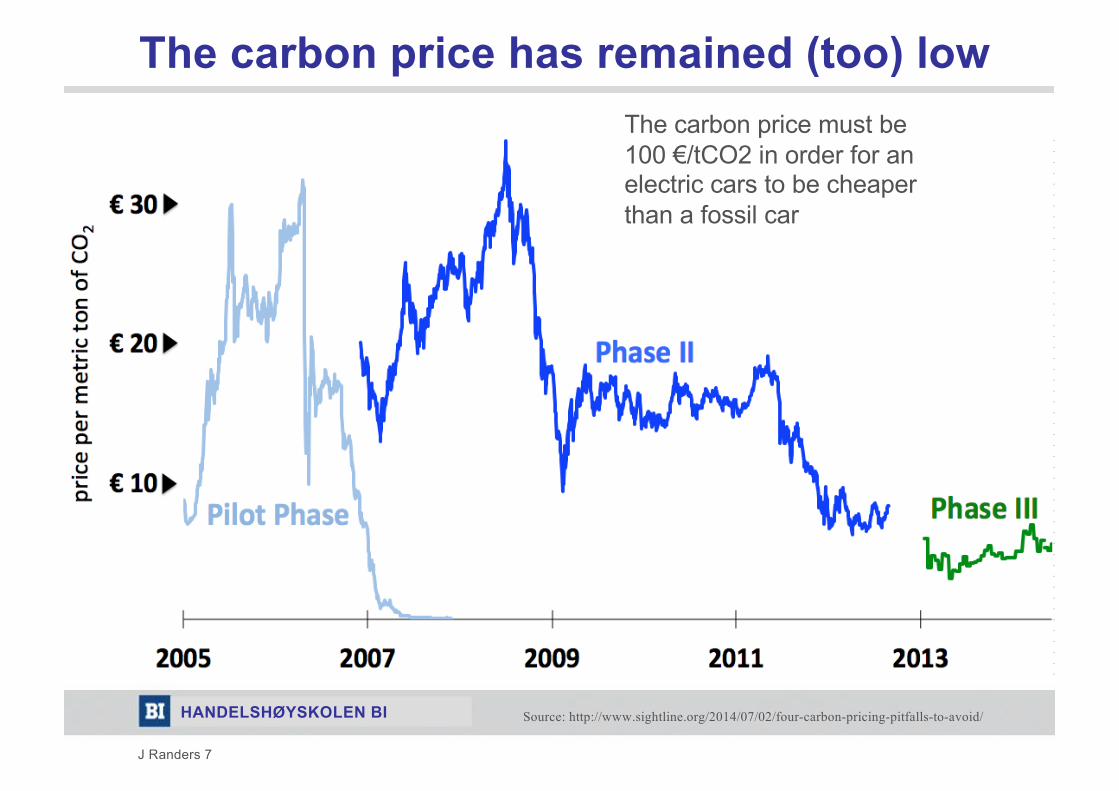
J Randers 7
The carbon price has remained (too) low
Source: http://www.sightline.org/2014/07/02/four-carbon-pricing-pitfalls-to-avoid/
The carbon price must be 100 €/tCO2 in order for an electric cars to be cheaper than a fossil car
HANDELSHØYSKOLEN BI
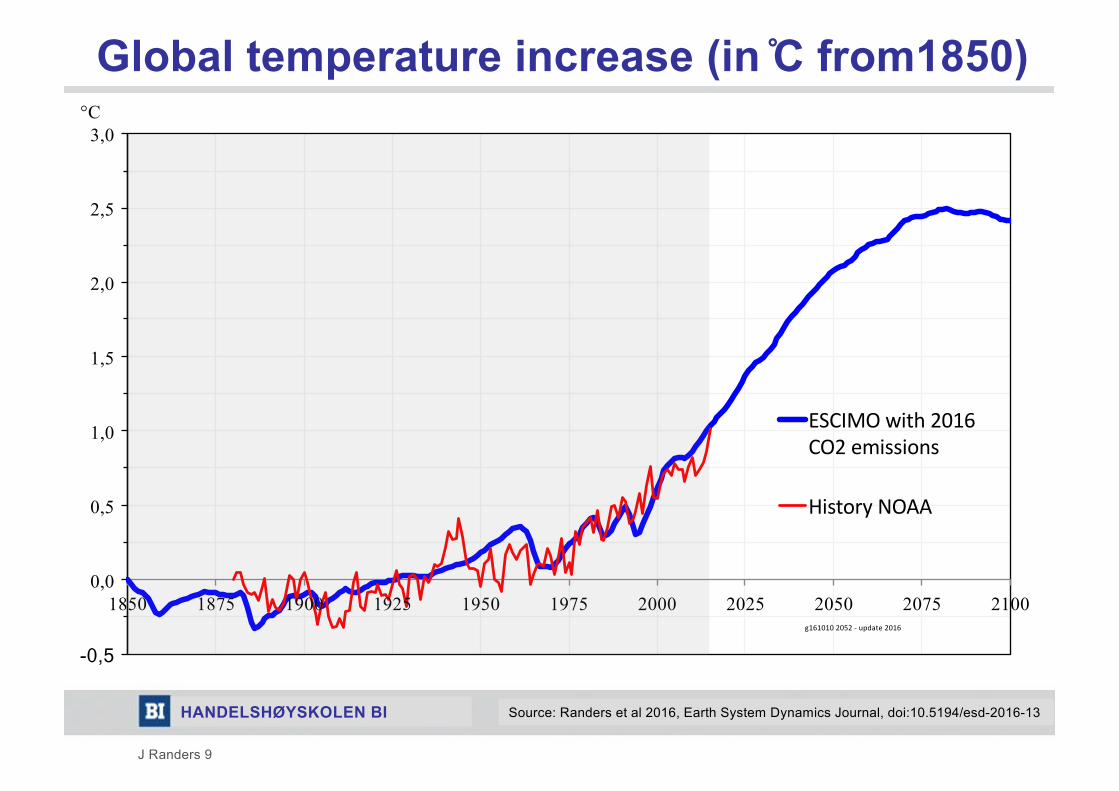
J Randers 9
Source: Randers et al 2016, Earth System Dynamics Journal, doi:10.5194/esd-2016-13
-0,5
0,0
0,5
1,0
1,5
2,0
2,5
3,0
1850 1875 1900 1925 1950 1975 2000 2025 2050 2075 2100
ESCIMOwith2016CO2emissions
HistoryNOAA
°C
g1610102052- update2016
Global temperature increase (in ̊C from1850)
HANDELSHØYSKOLEN BI
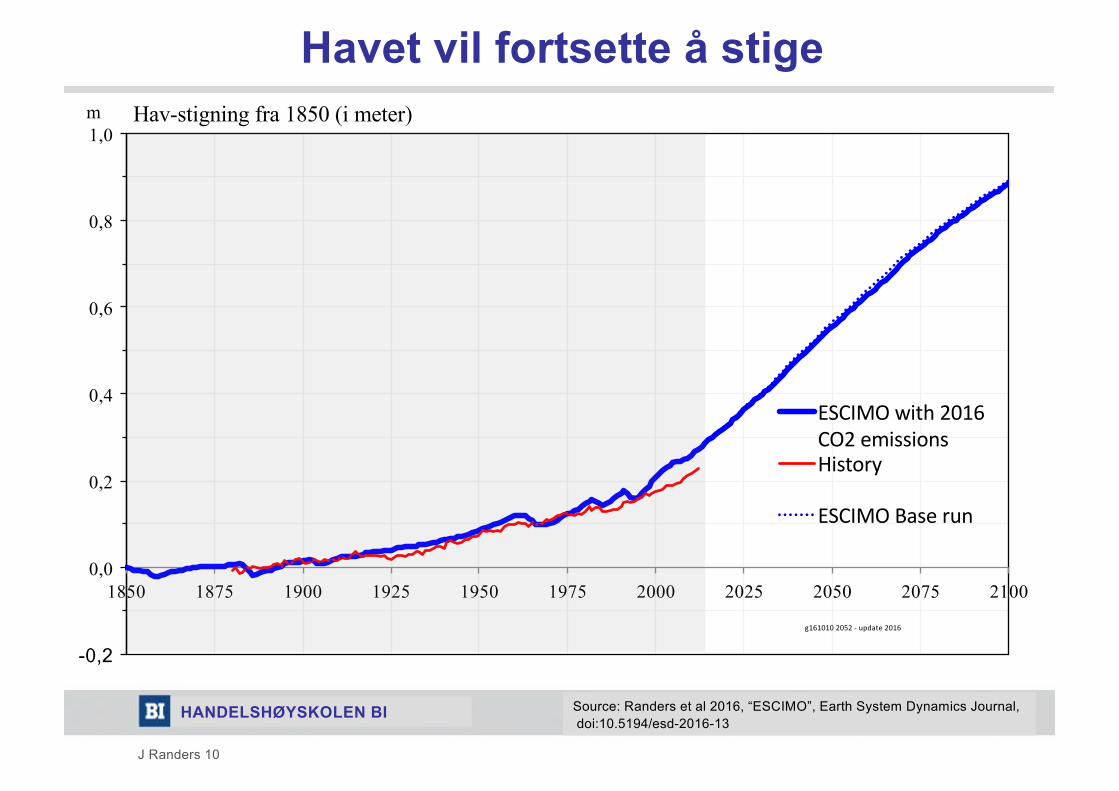
J Randers 10
Havet vil fortsette å stige
-0,2
0,0
0,2
0,4
0,6
0,8
1,0
1850 1875 1900 1925 1950 1975 2000 2025 2050 2075 2100
ESCIMOwith2016CO2emissionsHistory
ESCIMOBaserun
m
g1610102052- update2016
Hav-stigning fra 1850 (i meter)
Source: Randers et al 2016, “ESCIMO”, Earth System Dynamics Journal,doi:10.5194/esd-2016-13
HANDELSHØYSKOLEN BI
J Randers 11
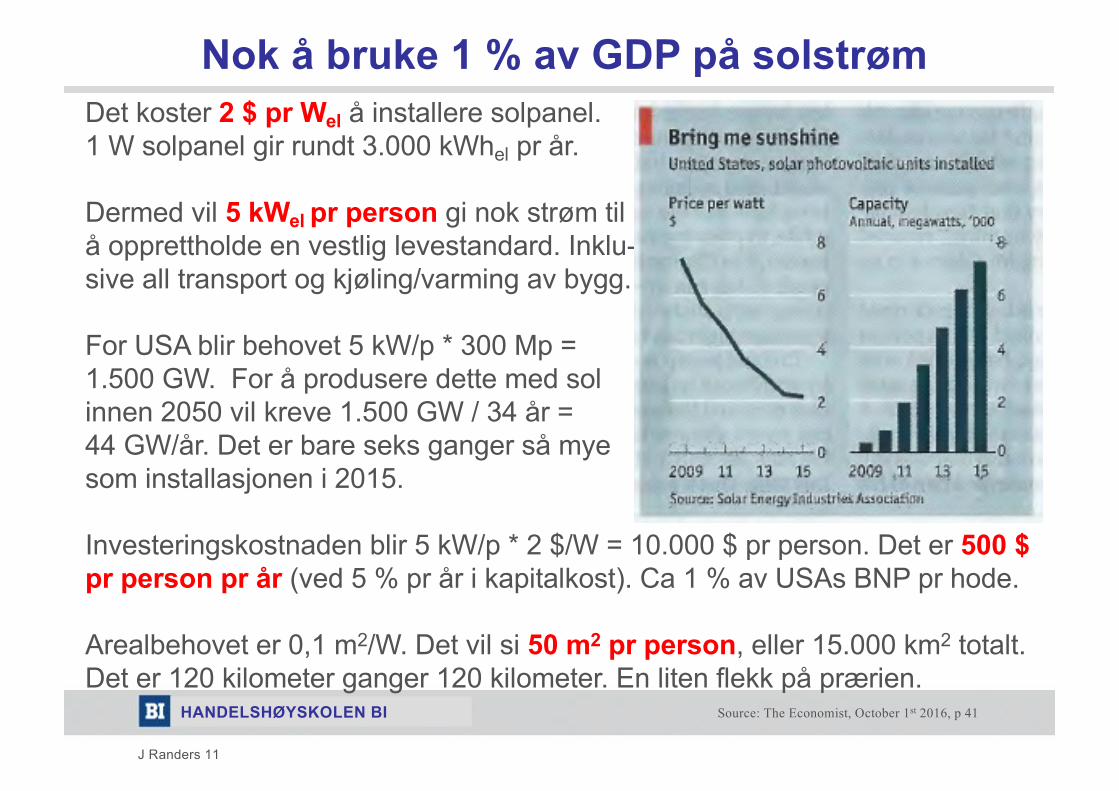
Nok å bruke 1 % av GDP på solstrøm
Source: The Economist, October 1st 2016, p 41
Det koster 2 $ pr Wel å installere solpanel.1 W solpanel gir rundt 3.000 kWhel pr år.
Dermed vil 5 kWel pr person gi nok strøm tilå opprettholde en vestlig levestandard. Inklu-sive all transport og kjøling/varming av bygg.
For USA blir behovet 5 kW/p * 300 Mp = 1.500 GW. For å produsere dette med sol innen 2050 vil kreve 1.500 GW / 34 år = 44 GW/år. Det er bare seks ganger så mye som installasjonen i 2015.
Investeringskostnaden blir 5 kW/p * 2 $/W = 10.000 $ pr person. Det er 500 $ pr person pr år (ved 5 % pr år i kapitalkost). Ca 1 % av USAs BNP pr hode.
Arealbehovet er 0,1 m2/W. Det vil si 50 m2 pr person, eller 15.000 km2 totalt.Det er 120 kilometer ganger 120 kilometer. En liten flekk på prærien.