
Joint Announcement Effects on Share Price
60
BUSM36 Master Thesis Spring 2009 Joint Announcement Effects on Share Price - A Study on Nordic Stock Exchanges Advisor: Maria Gårdängen Authors: PrapinyaPruksananonda NingXia Timmy Akesson
Transcript of Joint Announcement Effects on Share Price

BUSM36 Master Thesis Spring 2009
Joint Announcement Effects
on Share Price - A Study on Nordic Stock Exchanges
Advisor:
Maria Gårdängen
Authors:
PrapinyaPruksananonda
NingXia
Timmy Akesson

Joint Announcement Effect on Stock Price – A Study on Nordic Stock Exchanges
- 2 -
ABSTRACT
The objective of this thesis is to investigate to what extent the information content in
the joint dividend and earnings announcement affect share price reactions in the
NASDAQ OMX Nordic Stock Exchange. Further, this study examines the financial
performance of the companies in subsequent period to the announcement. OLS
regression models from market-based and accounting data combined with analyzing
of financial figures is used to arrive at the result. The study concludes that the joint
dividend and earnings announcement has diminutive effect on the share price.
Moreover, the relation between announcement and future financial performance is
inconclusive for OMXN on the period of 2006 to 2008.

Title: Seminar Date: Course: Program: Authors: Advisor: Key words: Purpose: Methodology: Theoretical Perspectives: Empirical Foundations: Conclusions:
Joint Announcement Effect on Stock Price – A Study on Nordic Stock Exchanges 2009-06-03 BUSM 36 Master Thesis in Business Administration (15 ECTS) M.Sc. of Corporate and Financial Management Prapinya Pruksananonda Ning Xia Timmy Akesson Maria Gårdängen Dividend, Stock Returns, Cumulative Abnormal Return, Signaling theory, Information asymmetry, Behavioral of dividend, Financial performance, Efficient market hypothesis (EMH) The purpose of this study is to investigate the joint dividend and earnings announcement affect to share price and subsequent financial performance in the OMXN during 2006 and 2008. The entire study is based on a hypothetical-deductive approach. Cross-sectional regression models are applied to arrive at the result. The theoretical perspective is derived from the ongoing debate regarding the information content of dividend. Based on the regression results on the relationships between the dividend and earnings announcement towards stock and financial performance of Large Cap and Mid Cap listed companies on OMXN The result supports the original theory from Miller & Modigliani (1961) around dividend irrelevancy proposition that a change in dividend policy does not affect share price. The findings of the regressions on the post announcement financial ratio growth were statistically insignificant.

TABLE OF CONTENTS
I. INTRODUCTION ................................................................................. - 3 -
1.1 Background .......................................................................................... - 3 -
1.2 Problem Discussion .............................................................................. - 4 -
1.3 Stock Market ........................................................................................ - 5 -
1.3.1 NASDAQ OMX Nordic Stock Exchange (OMXN) .................... - 5 -
1.3.2 Comparison with Other Major Stock Markets ............................. - 6 -
1.4 Purpose ................................................................................................ - 7 -
1.5 Delimitation ......................................................................................... - 7 -
1.6 Thesis Outline ...................................................................................... - 7 -
1.7 Audience .............................................................................................. - 8 -
II. THEORETICAL FRAMEWORK ........................................................ - 9 -
2.1 Theories ............................................................................................... - 9 -
2.1.1 Behavioral of Dividend ................................................................. - 9 -
2.1.2 Dividend Growth Model ............................................................. - 10 -
2.1.3 Dividend Irrelevancy Proposition ................................................ - 11 -
2.1.4 Efficient Market Hypothesis (EMH)............................................ - 12 -
2.2 Empirical Findings of Previous Researches ........................................ - 13 -
III. METHODOLOGY AND DATA ......................................................... - 18 -
3.1 Hypothesis ......................................................................................... - 18 -
3.2 Research Approach ............................................................................ - 20 -
3.3 Research Method ................................................................................ - 20 -
3.3.1 Data Collection ........................................................................ - 20 -
3.3.2 The Sample & Excluded Observations ..................................... - 21 -
3.4 Cross-Sectional Regression Method ................................................... - 22 -

Joint Announcement Effect on Stock Price – A Study on Nordic Stock Exchanges
- 2 -
3.4.1 Regression Models ................................................................... - 31 -
3.5 Research Concerns ............................................................................. - 32 -
3.5.1 Validity .................................................................................... - 32 -
3.5.2 Reliability & Replicability........................................................ - 33 -
IV. EMPIRICAL FINDINGS AND ANALYSIS ...................................... - 35 -
4.1 Empirical Findings ............................................................................. - 35 -
4.1.1 Descriptive Statistics ................................................................ - 35 -
4.1.2 Regression Results ................................................................... - 37 -
4.2 Analysis ............................................................................................. - 45 -
V. CONCLUSION AND PROPOSAL FOR FURTHER RESEARCH.. - 50 -
5.1 Conclusion ......................................................................................... - 50 -
5.2 Further Research ................................................................................ - 51 -
REFERENCES ................................................................................................... - 52 -

Joint Announcement Effect on Stock Price – A Study on Nordic Stock Exchanges
- 3 -
I. INTRODUCTION
This introduction chapter provides a prologue into the subject by supplying background information, underlying research problem as well as an overview of the stock markets. Furthermore, delimitations, disposition of the thesis and target audience are presented.
1.1 Background
Since summer 2007, the financial crisis has started to show its effect to the global
economy. Later in 2008, the falls of major US financial institutes such as Bear Stearns
and Lehman Brothers magnified the lack of confidence in the financial system. Stock
indexes and prices worldwide moved extensively downward. On 9th March, 2009,
Dow Jones Industrial Average was as low as 6,440.08, the lowest point in the last
decade. Again on the same date, NASDAQ also reached 1265.52, the bottom price
during the last five years (Yahoo! Finance 2009). This downturn had a huge impact
on shareholders’ wealth which could either be created through capital gains or
dividends (Copeland et al. 2005). As the current global economic recession is
impacting companies’ performance, the managements’ dilemma in maintaining
dividend policy has become more severe. The announcement of financial figures for
companies is analyzed by the investors to evaluate the value of the company hence
the shareholders' reactions to those announcements would be of importance. It is an
interesting aspect to see how management choose to treat net profit as it can either be
distributed to the investors, as return on their investments, or kept as retained earnings
for sustainable growth (Copeland et al. 2005). The fact that managers have better
access to information as well as better understanding regarding the company’s current
and future performance implies that management’s choice of balancing the firm’s
growth and relationships with investors would convey information of managers’
confidence in the firm (Ross 1977).
Joint Announcement Effect on Stock Price – A Study on Nordic Stock Exchanges
- 4 -
Can the dividend and earnings announcement reveal any content that would create
any additional value to the shareholders?
1.2 Problem Discussion
Since the release of Miller and Modigliani (1961) proposition of dividend irrelevancy,
the topic has been widely debated by experts in the financial arena. Prominent
academics such as Watts (1973) argued that “there is little potential information in
dividends” while Pettit (1972) disagreed and proposed the opposite. Aharony and
Swary (1980) studied the announcement effects of the separated dividend and
earnings announcements in the US capital market and found that the information
content of dividend does exist.
In recent research, the results are still dispersed. Conroy et al. (2000) conducted a
study in Tokyo Stock Exchange (TSE), where the information of current dividend and
earnings as well as the next year forecast figures are released on the same date. The
information effects of the dividend and earnings announcement were analyzed
separately. The findings suggested that earnings variable has more effect on share
price movement than the dividend variable has. In particular, current dividend
surprises do not have any effects on the share price; while, management’s forecast of
next year’s dividend provides little additional information to the earnings forecast
figure. The study concluded that the absent of the influence of current dividend
surprise on share price is consistent with the dividend irrelevancy proposition.
However, Sponholtz (2005) applied the methodology used in Conroy et al. (2000) on
the Danish market and reached a conclusion that dividend does convey additional
information to the shareholders.
If the supposition that the dividend and earnings announcement conveys information
regarding manager’s anticipation in future performance of the company is applicable,
then it would be relevant to investigate the future financial condition of the firm.

Joint Announcement Effect on Stock Price – A Study on Nordic Stock Exchanges
- 5 -
According to this interpretation, if a company presents a positive change from the
market’s expectations, an improvement of the future performance should occur in
subsequent periods while a negative change from the market’s expectation would
imply weakening future performance.
To shed a light over the NASDAQ OMX Nordic Stock Exchange (OMXN), the
objective of this study is to investigate the phenomena in the recent years (2006-2008)
on the Nordic markets and to analyze to what extent the dividend and earnings
announcement influences the stock price and its relation to the financial performance.
The majority of the companies listed on the OMXN release the information regarding
its performance and dividend simultaneously. This would give this study a
comprehensive edge to investigate the joint announcement of the dividend and
earnings.
1.3 Stock Market
1.3.1 NASDAQ OMX Nordic Stock Exchange (OMXN)
OMXN includes four main markets, OMX Copenhagen, OMX Helsinki, OMX
Iceland and OMX Stockholm Stock Exchange.
As inflation, population and overall market valuation change over time; all listed
companies in OMXN are grouped into three categories: Nordic Large Cap, Mid Cap
and Small Cap. The criterions are presented below:
Table 1: OMXN Market Capitalization Category
Category Criterion
Large Cap Market Cap is equivalent to EUR 1 billion or more
Mid Cap Market Cap is between EUR 150 million and 1 billion
Small Cap Market Cap is less than EUR 150 million.
Source: Business Wire

Joint Announcement Effect on Stock Price – A Study on Nordic Stock Exchanges
- 6 -
Exhibit 1: OMX Nordic Exchange: Domestic by Segment
Source: WFE 2007 Market Segmentation Survey
Exhibit 1 above present an overview of the OMXN market, Large Cap and Mid Cap
account for 97% of domestic market capitalization, 99% share trading volume and 92%
of domestic equity.
1.3.2 Comparison with Other Major Stock Markets
A lot of research on this topic had already been conducted on the major markets,
especially NYSE and London Stock Exchange (LSE). NYSE is the largest and most
liquid cash equities exchanges in the world. It has a domestic market capitalization of
US$15.7 trillion. LSE is the fifth largest stock exchange in the world with a market
capitalization of US$3.852 trillion. OMXN in comparison has a market capitalization
of US$1.242 trillion as of the end of 2007.

Joint Announcement Effect on Stock Price – A Study on Nordic Stock Exchanges
- 7 -
Table 2: Comparison of Major Stock Markets
Exchange World Rank
(Market
Capitalization)
Domestic
Market
Capitalization (USD bn)
Number
of listed
companies
Total Value
of Share
Trading (USD mn)
NYSE (US) 1 15,650,833 2,273 2,157,971
Tokyo SE 2 4,330,922 2,414 440,587
Euronext (Europe) 3 4,222,680 1,155 340,045
NASDAQ OMX 4 4,013,650 3,069 2,227,032
London SE 5 3,851,706 3,307 441,380
OMXN 16 1,242,578 851 96,978
Source: WFE 2007 Market Segmentation Survey
1.4 Purpose
The purpose of this study is to investigate to what extent the information content in
the joint dividend and earnings announcement affect share price reactions in the
OMXN. Further, this paper intends to examine the financial performance of the
companies in subsequent period to the announcement, to investigate the information
conveyed in the announcement and its relation to future performance.
1.5 Delimitation
This study focuses on the joint announcement effect of the dividend and earnings. It
does not isolate the announcement effect of the two components but instead intends to
capture the interaction between them. This study disregards any other published
information releases around the joint dividend and earnings announcement date.
1.6 Thesis Outline
Chapter two comprises theories that support this study and elaboration of previous
journals relevant to the topic. Further, the hypotheses to this research are introduced.

Joint Announcement Effect on Stock Price – A Study on Nordic Stock Exchanges
- 8 -
Chapter three describes I/B/E/S the research approach and data collection. This would
include aspects on how the research is constructed and its detailed process to arrive at
the result. It also illustrates research problems concerning the validity and reliability.
Chapter four presents empirical findings and the results from the regressions models.
Chapter five presents conclusions and proposals for further research.
1.7 Audience
This study would be of interest for academics interested in corporate finance,
investors active in the stock market, practitioners in the financial community or other
individuals interested in learning the stock behavior in the OMXN.

Joint Announcement Effect on Stock Price – A Study on Nordic Stock Exchanges
- 9 -
II. THEORETICAL FRAMEWORK
This chapter presents the following theories: Behavioral models of dividend, Dividend
growth model, Dividend irrelevancy proposition, Efficient market hypothesis,
Signaling theory and Information asymmetry as well as previous studies of the subject.
2.1 Theories
2.1.1 Behavioral of Dividend
John Lintner (1956) proposed that dividend policy has two variables: the target
dividend to earnings payout ratio and the speed of adjustment which current dividends
adjust toward the new target. His attempt to explain dividend behavior of companies
was achieved by observing company’s financial data as well as through conducting
interviews with 28 managers of selected American companies in the middle of 1950s.
Lintner’s findings from the interviews showed that management perceived dividend
policy as a main corporate financial decision and tended to set the dividend policy
first, then adjust other cash related decision accordingly. Furthermore, instead of
determining the dividend amount for each year, management tended to set target long-
term payout ratios and tend to maintain that level. The study discussed that
management would increase dividend only when they are confident that the change in
company’s performance would be sustainable in the long-run while they showed
reluctance in the choice of decreasing dividend. As a result, to stabilize the dividend
payout pattern, management tended to gradually change dividends by the partial
amounts indicated by changes in current financial figures until they achieve the
dividend target. The managers believed that this practice would help to minimize
adverse stockholder reactions. Fama and Babiak (1968) investigated different models

Joint Announcement Effect on Stock Price – A Study on Nordic Stock Exchanges
- 10 -
for explaining dividend behavior and found that Litner’s model is one of the best
models that can explain the behavior of dividend stabilization as well as the prediction
of the next year dividend payment. Brav, Graham, Harvey, and Michaely (2003)
surveyed CFOs and treasurers to discover the key factors that influences dividend and
stock repurchase policy. Their finding is in line with Lintner (1956) that management
will increase the payout only if the new policy is sustainable. Given this management
behavior, it is likely to assume that the investors will interpret an increase in dividend
as a signal that the increase in cash flow would be permanent.
2.1.2 Dividend Growth Model
Myron J. Gordon (1959) introduced the dividend growth model which illustrates the
relationship between expected share price and dividend policy. The model is
presented below:
Equation 1: ( 0) = 1
E (P0) is the expected share price, D1 is the next year dividend, k is defined as
shareholders expected return and g is identified as the long-term growth rate of
dividends.
According to this model, an increase in dividend would stimulate an increase in share
price. However, a dividend payment would also result in less cash for reinvestment in
the company. This would lead to a decline in expected growth rate which in turn
would negatively affect the share price. The conclusion of the dividend growth model
is that a change in policy would have an impact on the share price in two different
directions. Brigham and Ehrhardt (2002) hold the opinion that in order to maximize
the current share price, an optimum dividend policy could be achieved by balancing
the two aspects of current dividends and future growth. This notion provides a direct
link between dividend and stock price. Hence, the choice of increasing, decreasing or

Joint Announcement Effect on Stock Price – A Study on Nordic Stock Exchanges
- 11 -
maintaining dividend payment would be reflected in market price and should be
considered as a method to monitor management performance.
2.1.3 Dividend Irrelevancy Proposition
Miller and Modigliani (1961) published a study on “Dividend policy, growth and the
valuation of shares”. The paper examined the dividend policy and their effects on
share price by evaluating the relationship in an ideal economy. This is characterized
by perfect capital markets that it does not exist any participants that have any
extensive impact on the share price as well as it does not exist any transaction costs or
tax differentials, and that traders have equal, costless and all relevant information
regarding shares. It also assumes rational behavior that investors are focusing on
maximizing wealth and that they are indifferent whether the wealth is made by an
increase in market value or from a dividend payout as well as perfect certainty. By
investigating under these conditions, dividend affects neither the current price of the
shares nor the total return to its shareholder. In other words, in the ideal economy
dividend policy is irrelevant to shareholders’ wealth. Challenges to this dividend
irrelevance proposition stemmed from market imperfections. Miller and Modigliani
admitted that:
“where a firm has adopted a policy of dividend stabilization with a long- established
and generally appreciated "target payout ratio," investors are likely to (and have
good reason to) interpret a change in the dividend rate as a change in management's
views of future profit prospects for the firm.” (Miller and Modigliani 1961, p.430)
This quote revealed the perception that dividends contain information and was later
utilized in the signaling theory of dividends (Jensen and Johnson 1995).

Joint Announcement Effect on Stock Price – A Study on Nordic Stock Exchanges
- 12 -
2.1.4 Efficient Market Hypothesis (EMH)
Fama (1970) presented a theory that described the level of information efficiency of
the financial markets. It is divided into three categories depending on how accurate
the stock price reflects the available information:
• Weak efficiency: Asserts that the past stock prices and data are incorporated in
current stock price without any delays
• Semi-strong efficiency: Asserts that all publicly available information is
reflected in the current stock price
• Strong efficiency: Asserts that all information, both inside and published
information, is reflected into the current stock price
If the strong market efficiency phenomenon exists, then both the investors and
managements could not exploit any information asymmetry in the stock markets and
no abnormal returns could be obtained in trading stocks. The semi-strong form
efficient markets hypothesis the can be seen as a test of the speed of adjustment of
prices to new information. Ball and Brown (1968) event study provides evidence on
the reaction of share prices to earnings announcements. The result shows that the
information was partially anticipated by the market, most of the price adjustment had
started before the event was revealed to the market. However, when the new
information reached the market, the remaining price adjustments took place rapidly.
One way of testing the validity of strong-form market efficiency is to evaluate if
insiders, who have access to non-public available information, could outperform the
market. The results from Jaffe (1974) and Finnerty (1976) suggest that insiders earned
abnormal returns hence the strong market efficiency does not hold. Fama (1998)
published a following up study to clarify the theory. The study concluded that market
efficiency does exist in the long run and that any types of anomalies are chance results.
Hence, if the market has semi-strong form of efficiency, anomalies on stock price

Joint Announcement Effect on Stock Price – A Study on Nordic Stock Exchanges
- 13 -
should be observable on the date that the new information is made public.
2.1.5 Signaling Theory and Information Asymmetry
Information asymmetry is defined as a situation when one party has an information
advantage over the other. Managers as insiders have access to detailed internal reports
and better insights of the condition of the firm than the investors. In general, firms
demonstrate constant dividend payouts. Managements would only adjust the policy if
they are certain that this change in dividend could be sustained. Due to this behavior,
an alteration of the dividend policy is likely to be interpreted as that the managements
anticipate a permanent change in future cash flow of the firm (Lintner 1956). Several
studies regarding the topic of dividend signaling have been published. Fama, Fisher,
Jensen, and Roll (1969) studied stock split and its signaling to the investors. The
results showed that splits together with a positive change in dividend announcement
would lead to an increase in share price while a decrease in dividend would impact
the share price negatively. Ross (1977) study also supported the signaling theory. It
concluded that the market contains full information about the activities of firms that
give the information to the investors concerning firm’s performance efficiency and
potential achievements in the future. In other words, the managers send messages to
their investors by using their financial decision as a tool. Dividend payout could
therefore be regarded as a signaling device that indicates that the expected future cash
flow is sufficient to distribute dividend to the investors without increasing the
probability for bankruptcy (Copeland et al. 2005). As a result, the market should
expect improvements in firm performance in subsequent periods of the event.
2.2 Empirical Findings of Previous Researches
Ball and Brown (1968) study provided evidence of post-earnings announcement stock
anomalies in the direction denoted by an earnings surprise. Later, Ball (1978)
summarized twenty literatures on earnings-related anomalies and concluded that the

Joint Announcement Effect on Stock Price – A Study on Nordic Stock Exchanges
- 14 -
collective evidence was strong.
The information content in dividend announcement is a popular topic examined by
academics. Aharony and Swary (1980) investigated the information content of
dividend by applying the market model (see equation 2) on the stock where quarterly
cash dividends are announced at least eleven trading days apart from earnings
announcement of the same period. The findings from the dividend expectation model
showed that the stockholders realized abnormal returns (see equation 3) in the twenty-
day period surrounding these dividend announcements. In particular, stockholders
obtain normal return when firms maintain dividend, enjoy positive abnormal return
when firms increase of dividend and vice versa. The direction and magnitude of the
result are true regardless of the sequence of the earnings and dividend announcement.
Further, naive expectation model (see equation 4) was applied to examine stock
performance surrounding the date of earnings announcement in the quarter where
both dividend and earnings changes provided positive signals. The findings indicated
that stockholders realized significant positive abnormal returns at the earnings
announcement date whether these earnings announcement preceded or followed
dividend announcement. In other words, when a dividend increase was announced,
the stockholders realized abnormal returns in the days surrounding both dividend and
earnings announcement dates. This supports the hypothesis that quarterly cash
dividend announcement contains useful information beyond what had already been
provided in quarterly earnings announcement. The study then concluded that changes
in quarterly dividends provide a signaling device that is at least as effective as
quarterly earnings numbers.
Asquith and Mullins, Jr. (1983) tried to capture the full effect of dividend
announcement by using the naive expectation model to investigate the abnormal
return on stock price surrounding the date of initial dividend announcement and then
compare the results with subsequent dividend announcements. To capture the pure

Joint Announcement Effect on Stock Price – A Study on Nordic Stock Exchanges
- 15 -
effect of the initial dividend announcement, they collected data on other
announcements (such as earnings, merger negotiation, spin-off) surrounding the
twenty-one-day period of the initial dividend announcement date and reclassified their
sample data into three groups: Initial dividend announcement with no other events,
Initial dividend with earning announcement in the surrounding period and Initial
dividend with other announcement in the surrounding period. The excess return of
subsamples of initial dividend announcement with no other announcements in
surrounding period was still positive. This indicated that the market’s positive
reaction was due to the information in the dividend announcement itself instead of
other events. The study further explored the relation between the wealth effect and the
size of dividend by regressing market excess return on initial dividend announcement
against the annualized change in yield and repeated the process with the subsequent
dividend announcement. The results indicated that larger dividends are associated
with larger returns. Their results support the hypothesis that dividend announcement
contains additional information than those already presented in other announcement
(mainly earnings announcement). The study then suggests that dividend and earnings
announcements are partially substitutes.
Pettit (1972) carried through a study to investigate the dividend and earnings
announcement impact on stock price. The study focused on the event when the
information on dividend and earnings were released on different dates. It isolated the
dividend announcements into analogous groups, depending on whether the announced
figures exceeded market expectations or not. The market model was then used to
calculate abnormal performance index for each group. The study came to the
conclusion that:
“market participants make considerable use of the information implicit in
announcements of changes in dividend payments”. (Pettit 1972, p.1000 – 1001)

Joint Announcement Effect on Stock Price – A Study on Nordic Stock Exchanges
- 16 -
Pettit (1976) elaborated his opinion further by stating that the difference between
reported earnings and actual real earning power could explain why dividend
announcement would work as a messenger to mediate information to the public, as all
information might not be communicated through reported earnings.
Jensen and Johnson (1995) studied listed companies on the New York Stock
Exchange (NYSE) and the American Stock Exchange (AMEX) that reduced their
established dividend policy. The financial condition of the companies were analyzed
both in the prior and post announcement periods. The study indicated that a company
with a dividend drop would experience a declining performance in profitability, share
price as well as an increase in operating costs in the period prior to the announcement.
However, the study concluded that the dividend cut would represent a turning point
for the companies as the financial profile significantly improved afterwards.
Gunasekarage and Power (2002; 2006) recently published a paper that examined the
joint dividend and earnings announcement effect and its relation with the long-run
post financial performance for the companies that announced a change in dividend in
the UK market. The study was conducted by grouping companies according to the
changes in dividend and earnings components. The data was evaluated using the
market model to capture any behavior of abnormal return. The study then investigated
the subsequent five years in financial performance by analyzing financial perspectives
of profitability, leverage, liquidity and activity as well as the return performance of
the shares. The conclusion of the study was that positive news in dividend and
earnings led to a positive abnormal return as the opposite led to a negative abnormal
return. In terms of financial performance, the study concluded that the companies that
reported a negative dividend and earnings change was the group that had better
financial performance in the subsequent years of the announcement. The return
performance of the shares of this group outperformed all the other groups in the
following five years from the announcement date. The authors debated that a

Joint Announcement Effect on Stock Price – A Study on Nordic Stock Exchanges
- 17 -
reduction in dividend was to overcome its current financial difficulties for better
future performance rather than to convey a negative signal about future results.

Joint Announcement Effect on Stock Price – A Study on Nordic Stock Exchanges
- 18 -
III. METHODOLOGY AND DATA
In this chapter the hypotheses are formulated. Research approach and data collection
will be thoroughly described. This would include aspects on how the research is
constructed and its detailed process to arrive at the result. It would also illustrate the
research problems concerning the validity and reliability.
3.1 Hypothesis
Based on the theories presented in Chapter II, the following hypothesis can be
formulated:
Table 3: Hypotheses
Hypothesis Theory Author
H1 The joint dividend and earnings announcement will
generate daily stock abnormal return on the
announcement date
Behavioral of Dividend,
Dividend Growth Model,
EMH, Signaling Theory
and Information
Asymmetry,
Lintner (1956), Gordon
(1959), Fama (1970),
Ross (1977)
H2a The effect on share abnormal return would be positively
related to the dividend and earnings surprise component
of the joint announcement if both dividend and earnings
surprises increase.
Behavioral of Dividend,
Signaling Theory and
Information Asymmetry
Lintner (1956), Asquith
and Mullins,Jr. (1983),
Ross (1977)
H2b The effect on share abnormal return would be negatively
related to the of the dividend and earnings surprise
component of the joint announcement if both dividend
and earnings surprises decrease.
Behavioral of Dividend,
Signaling Theory and
Information Asymmetry
Lintner (1956), Asquith
and Mullins,Jr. (1983),
Ross (1977), Jensen and
Johnson (1995)
H3a A positive surprise joint announcement would indicate an
improvement of return on invested capital for the
company in the subsequent years
Behavioral of Dividend,
Signaling Theory and
Information Asymmetry
Lintner(1956), Gunasekarage and
Power(2006)

Joint Announcement Effect on Stock Price – A Study on Nordic Stock Exchanges
- 19 -
H3b A negative surprise joint announcement would indicate a
decline in return on invested capital for the company in
the subsequent years
Behavioral of Dividend,
Signaling Theory and
Information Asymmetry
Lintner(1956),
Gunasekarage and
Power(2006), Jensen
and Johnson (1995)
H4a A positive surprise joint announcement would indicate an
improvement in return on equity for the company in the
subsequent years
Behavioral of Dividend,
Signaling Theory and
Information Asymmetry
Lintner(1956),
Gunasekarage and
Power(2006)
H4b A negative surprise joint announcement would indicate a
decline in return on equity for the company in the
subsequent years
Behavioral of Dividend,
Signaling Theory and
Information Asymmetry
Lintner(1956),
Gunasekarage and
Power(2006), Jensen
and Johnson (1995)
H5a A positive surprise joint announcement would indicate an
improvement in net margin for the company in the
subsequent years
Behavioral of Dividend,
Signaling Theory and
Information Asymmetry
Lintner(1956),
Gunasekarage and
Power(2006) H5b A negative surprise joint announcement would indicate a
decline in net margin for the company in the subsequent
years
Behavioral of Dividend,
Signaling Theory and
Information Asymmetry
Lintner(1956),
Gunasekarage and
Power(2006), Jensen
and Johnson (1995) H6a A positive surprise joint announcement would indicate an
improvement in fixed charge coverage ratio for the
company in the subsequent years
Behavioral of Dividend,
Signaling Theory and
Information Asymmetry
Lintner(1956),
Gunasekarage and
Power(2006) H6b A negative surprise joint announcement would indicate a
decline in fixed charge coverage ratio for the company in
the subsequent years
Behavioral of Dividend,
Signaling Theory and
Information Asymmetry
Lintner(1956),
Gunasekarage and
Power(2006), Jensen
and Johnson (1995) H7a A positive surprise joint announcement would indicate an
improvement in cash dividend coverage ratio for the
company in the subsequent years
Behavioral of Dividend,
Signaling Theory and
Information Asymmetry
Lintner(1956),
Gunasekarage and
Power(2006) H7b A negative surprise joint announcement would indicate a
decline in cash dividend coverage ratio for the company
in the subsequent years
Behavioral of Dividend,
Signaling Theory and
Information Asymmetry
Lintner(1956),
Gunasekarage and
Power(2006), Jensen
and Johnson (1995) H8a A positive surprise joint announcement would indicate an
improvement in quick ratio for the company in the
subsequent years
Behavioral of Dividend,
Signaling Theory and
Information Asymmetry
Lintner(1956),
Gunasekarage and
Power(2006) H8b A negative surprise joint announcement would indicate a
decline in quick ratio for the company in the subsequent
years
Behavioral of Dividend,
Signaling Theory and
Information Asymmetry
Lintner(1956),
Gunasekarage and
Power(2006), Jensen
and Johnson (1995)

Joint Announcement Effect on Stock Price – A Study on Nordic Stock Exchanges
- 20 -
3.2 Research Approach
The entire study is based on a hypothetical-deductive approach. This paper
investigates Large Cap and Mid Cap securities listed at OMXN to determine to what
extent the management’s signal addressed on the joint dividend and earnings
announcement effect on the share price. Further, the financial performances of the
companies in the subsequent periods are analyzed. To conduct this study, quantitative
methods are implemented to arrive at the result.
3.3 Research Method
The research relies on the quantitative approach. Since all listed companies are
required to release their financial information and make it available to the public,
secondary data is chosen to be the most suitable.
3.3.1 Data Collection
The study is based on a cross-sectional data set. It is conducted on the sample of
Large Cap and Mid Cap securities listed on OMXN in the period of 2006-2008.
During 2004-2005, it was the transition period from GAAP to IFRS. To avoid any
influences of accounting restatements on the findings, the selection of the study
period in 2006-2008 is justifiable as the accounting regulations would be fully
synchronized and comparable. The full OMXN securities list was obtained from
www.nasdaqomxnordic.com on 22nd April 2009. The process described in the Sample
and Excluded Observation Section is then used to get a justifiable sample. When more
than one type of shares (common and preferred stocks) of the same company exists,
the one with the highest average trading volume during the study period is selected.
The liquidity of the stock is important in ensuring that the stock will have functioned
price mechanism; thereby, allowing the stock price to fluctuate and fully capture the
information content in the announcements.

Joint Announcement Effect on Stock Price – A Study on Nordic Stock Exchanges
- 21 -
To capture market reactions to information content of the announcement, it is crucial
to obtain the date when the information was initially available to the market. To
achieve that, press release date of the joint announcement is manually gathered from
the company websites. Financial and accounting data such as historical closing stock
prices and financial ratios are collected from Thomson DataStream. In order to
capture the market expectations, Thomson Reuters Institutional Brokerage Estimates
System (I/B/E/S) consensus estimates are acquired. I/B/E/S is a system that provides
real time data following a particular instrument. The system also provides Global
Aggregates of analyst’s consensus estimates that reflect the general view of the stock
analysts on the future earnings for the publicly traded companies. I/B/E/S aggregates
are global, updated monthly. The reliability of the estimates is proved by I/B/E/S
monthly audits which show accuracy levels of more than 99.9%.1 This source is
widely used in other financial related researches as its frequent updates should reflect
markets expectations at that time.
3.3.2 The Sample & Excluded Observations
The preliminary sample of this study is based on the full OMXN list. It consists of
651 listed stocks, of which 143 are Large Cap stocks, 191 are Mid Cap and 317 are
Small Cap. The Small Cap is excluded from the sample because it could distort the
trustworthiness of the OLS model (Ahern 2006). The financial industry is also
excluded from the observations due to the restricted regulations in the industry;
thereby it would not be likely to give a justifiable supposition to the hypothesis. As
this study is analyzing post-announcement performance, delisted companies are not
taken into account as the information would not be feasible. This may lead to a
survivorship bias; as a result, the performance of the sample may be overestimated
(Brown et al 1992). Furthermore companies that have separate announcement date for
dividend and earnings are excluded as this study focus on the interaction effects of the 1 Thomson Datastream, I/B/E/S

Joint Announcement Effect on Stock Price – A Study on Nordic Stock Exchanges
- 22 -
joint announcement. For each variable, 1% extreme values are eliminated to reduce
the bias that those outliners might cause. This resulted in 477 observations in the
sample set.
3.4 Cross-Sectional Regression Method
In order to test for the effects of dividend and earnings on stock returns behavior,
Ordinary Least Square (OLS) regression analysis is applied. It is widely used in
financial and economic studies. In the cross-sectional regression mechanism,
subsequent measurements are used.
w The Dependent Variables
Eight dependent variables are tested in the regression models to investigate the
relationship of the surprise components with stock abnormal returns and the
companies’ actual growth performance in the post announcement period.
Table 4: Description of Dependent Variables
Variables Description
AR Market Adjusted Abnormal Return
CAR Market Adjusted Cumulative Abnormal Return
GROEA Growth of Return on Equity After the Announcement
GROICA Growth of Return on Invested Capital After the Announcement
GNETMARGINA Growth of Net Margin After the Announcement
GFCCA Growth of Fixed Charge Coverage Ratio After the Announcement
GCDCA Growth of Cash Dividend Coverage Ratio After the Announcement
GQUICKRA Growth of Quick Ratio After the Announcement

Joint Announcement Effect on Stock Price – A Study on Nordic Stock Exchanges
- 23 -
Market Adjusted Abnormal Return (AR)
Daily normal return is defined by Brown & Warner (1985) in the market model as:
Equation 2: , = + , + , where Rj,t and Rm,t represent the returns on stock j and the market portfolio on day t,
respectively. In OLS regression, the residual , is regarded as the term of abnormal
return. The equation can be derived as (Gunasekarage 2006):
Equation 3: , = , − [ + , ] Market Adjusted Cumulative Abnormal Return (CAR)
To evaluate the full information content in the announcement of dividend, CAR for
the announcement period is calculated by accumulating the daily stock abnormal
returns of the announcement date (d0) and the day after (d1). The two-day abnormal
return is used to mitigate the problem that some companies released the information
late in the day or after the stock market was closed hence the adjustment of the stock
prices would occur in the next trading day. Market adjusted cumulative abnormal
return is then calculated (Barber and Lyon 1997):
Equation 4: = ∑ , 1
where τ defines time period (announcement date and the day after). CAR will be set
as the dependent variable in the regression and is regressed on the interaction effects
between dividend and earnings surprises. The surprise component is the percentage
difference between managements´ proposal and the I/B/E/S forecast of the period.
As one dimension of this research is to investigate the relationship between the
dividend and earnings surprises and the actual performance of the company in the

Joint Announcement Effect on Stock Price – A Study on Nordic Stock Exchanges
- 24 -
periods after the joint announcement date, the average growth of financial ratios after
the announcement are then applied as dependent variables in the regression models.
The mean financial growth ratios can be derived from:
Mean Financial Ratio Growth after Announcement Period= Mean Financial Ratio of 2007 and 2008 − Financial Ratio announcement year (2006)Mean Financial Ratio announcement year (2006)
Financial performance measurements2 are defined below:
Profitability Ratios
Profitability ratios are accounting based measurements that estimate the company’s
ability to generate profit during a specific period of time. Profitability ratios that
would be investigated in the research are return on equity, return on invested capital
and net margin.
Return On Equity (ROE) - Assesses the level of profit a company generates with the
money shareholders have invested. ROE also considers the degree to which a
company uses leveraging, as interest expense paid to creditors is generally deducted
from earnings to arrive at net income.
ROE = Company′s Net IncomeTotal Equity of Common Shares
Return On Invested Capital (ROIC) - Assesses the level of company's efficiency in
allocating their capital to profitable investments. ROIC can be improved by an
increase in net profit, a decrease in capital employed (working capital and fixed asset)
or a combination of both. The higher ROIC implies that the company is more efficient
and can generate more return for each unit of money invested. Interpretations of
2 The financial data on the ratios and the descriptive formulas are collected from Thomson DataStream I/B/E/S. The detailed explanations of the ratios are referred from Bragg (2003) and Walsh (2006).

Joint Announcement Effect on Stock Price – A Study on Nordic Stock Exchanges
- 25 -
ROIC can be made by comparing ROIC across the year, its peers and its cost of
capital. When ROIC is greater than their weighted average cost of capital (WACC),
the company is creating value by investing in their projects.
ROIC = Net Income before Preferred Dividends (Interest Expense on Debt Interest Capitalized)∗(1 Tax Rate)Average of Last Year′s and Current Years′s Total Capital Last Year′s Short Term Debt & Current Portion of Long Term Debt ∗100
Note: This calculation I/B/E/S uses restated data for last year’s values where available.
Net Margin - Assesses how effective a company is in translating each unit of revenue
earned into actual profits. The higher ratio indicates that the company is more
profitable. Net margin can be used in comparing companies in the same industry as
they encounter similar industry specific conditions. However, comparison across
different industries can demonstrate which industries are relatively more profitable
than the others.
Net Margin = Net Income before Preferred DividendsNet Sales or Revenues
∗ 100
Note: If Net Income before Preferred Dividends is not available, I/B/E/S uses Policyholder’s Surplus
as a substitute.
Leverage Ratios
Leverage ratios are accounting based measurements that estimate a company’s ability
to meet financial obligations.
Fixed Charge Coverage Ratio (FCC) – assesses the company’s ability to meet fixed
obligation from gross earnings. A high ratio indicates that the company has low level
of leverage.
FCC = Earnings before Interest and Taxes (Interest Expense on Debt + Preferred Dividends (Cash))/(1− Tax Rate100 ) ∗ 100

Joint Announcement Effect on Stock Price – A Study on Nordic Stock Exchanges
- 26 -
If the Tax rate is negative or not available or if preferred dividends are 0 the following
model would be applied:
FCC = Earnings before Interest and TaxesInterest Expense on Debt + Preferred Dividends (Cash)
Cash Dividend Coverage Ratio (CDC) – assesses the company's ability to meet
dividends obligation from operating cash flow. A ratio of less than 100 % (1:1)
indicates that the company is paying dividends more than what the company is
currently generating.
CDC = Funds from OperationsCommon Dividends (Cash)
Liquidity Ratios
Liquidity ratios are accounting based measurements that estimate a company's ability
to meet its short-terms debts obligations. The higher the ratio, the larger the margin of
safety the company possesses to cover short-term debts. The relation between
liquidity ratio and dividend and earnings surprise will be examined by quick ratio.
Quick Ratio - Assesses the ability of the company to fulfil its current liabilities.
Generally, a higher quick ratio implies a more liquid current position. The quick ratio
of 1:1 is acceptable by most creditors however this varies across different industry.
Quick Ratio = Cash & equivalents + Receivables (Net)Total Current Liabilities
w The Explanatory Variables
Eight independent variables will be used in groups and separately in the regression
models to investigate the relationship with stock and financial performance.

Joint Announcement Effect on Stock Price – A Study on Nordic Stock Exchanges
- 27 -
Table 5: Description of Independent Variables
Variables Description
DPSS Dividend per Share Surprise
EPSS Earnings per Share Surprise
DIEI Dividend Increase, Earnings Increase
DIED Dividend Increase, Earnings Decrease
DDEI Dividend Decrease, Earnings Increase
DDED Dividend Decrease, Earnings Decrease
DNCEI Dividend None Change, Earnings Increase
DNCED Dividend None Change, Earnings Decrease
Detailed explanations of the explanatory variables are presented below:
DPSS, EPSS
Dividends and earnings surprises are defined as the percentage of the announced
amount subtracted by the market´s expectations. Market expectation can be captured
either by the naive expectation model or the market forecast model.
Naive expectation model is built on the assumption that the market expects earnings
and dividend to be equivalent to last year figures (Brown 1968). Surprise according to
the naive expectation model can be derived as followed:
Equation 4:
= ( 0) − ( 1) ( 1) ∗ 100
Surprise according to the market forecast model is the deviation between the
announced amount and the I/B/E/S estimates on the joint announcement date.

Joint Announcement Effect on Stock Price – A Study on Nordic Stock Exchanges
- 28 -
Equation 5:
= ( 0) − ( 0) ( 0) ∗ 100
The joint announcement surprises are separated into six groups depended on the trend
of the surprise components. This would mitigate the problem of having extreme
values that might lead to bias results. The range of 10% deviation from market
expectation is created to reflect a considerable change that would represent a notable
signal. A smaller variation range would provide a larger sample but the signal would
be weaker.
The groupings are defined as following:
1. Companies which propose an increase in dividends and earnings with more
than 10 % from the market’s expectations (DIEI)
DPSS > 10% & EPSS > 10%
2. Companies which propose an increase in dividend of more than 10% when
earnings decrease more than 10% from market`s expectations (DIED)
DPSS > 10% & EPSS < -10%
3. Companies which propose a decrease in their dividend of more than 10% when
earnings increase more than 10% from the market`s expectations (DDEI)
DPSS < -10% & EPSS > 10%
4. Companies which propose a decrease in dividend and earnings of more than 10%
from the market`s expectations (DDED)
DPSS < -10% & EPSS < -10%

Joint Announcement Effect on Stock Price – A Study on Nordic Stock Exchanges
- 29 -
5. Companies which propose a dividend in the range of ±10% or equal from the
market`s expectations despite more than 10% increase surprise in earnings (DNCEI)
-10% ≤ DPSS ≤ 10% & EPSS > 10%
6. Companies which propose a dividend in the range of ±10% or equal from the
market`s expectations despite more than 10% negative surprise in earnings (DNCED)
-10% ≤ DPSS ≤ 10% & EPSS < -10%
These six groupings mentioned above are treated as dummy variables in the
regression models. They can be used as either dummy variables or conditions for
separation of earnings and dividends groups. In each observation, when both DPSS
and EPSS meet the predefined requirements, then the variable is regarded as 1,
otherwise it is defined as 0.
As a result, the samples of this study display the following composition:
Exhibit 2: Portfolio composition by fiscal year
30.2%19.5% 21.4%
6.3%
6.3% 6.9%
2.5%
3.8%8.8%
6.3%
8.8%
28.3%7.5%
6.9%
2.5%
8.8%
10.1%
5.0%
38.4%44.7%
27.0%
0%
10%
20%
30%
40%
50%
60%
70%
80%
90%
100%
2006 2007 2008
NC
DNCED
DNCEI
DDED
DDEI
DIED
DIEI

Joint Announcement Effect on Stock Price – A Study on Nordic Stock Exchanges
- 30 -
The full portfolio of this study consisted of 159 securities from the Large Cap and
Mid Cap of the OMXN. The table presents the composition of the portfolio for each
year of the study. For most of the years, the majority of the securities are categorized
in the non-change group. For year 2006 and 2007, the DIEI dominated the other
group. However, the composition structure is different in 2008, the non-change group
decreased to 27.0% accompanied by an increased of DDED group to 28.3%. This
change in the grouping composition can be explained by the current economic
situation.
Exhibit 3: Historical GDP Growth
Source: World Bank World Development Indicators3
The graph presents the historical GDP growth for the period of 2006-2008. The GDP
over the period show a diminishing pattern. In year 2008, Iceland GDP growth turned
negative. 3 World Bank World Development Indicators, International Financial Statistics of the IMF, Global Insight, and Oxford Economic Forecasting, as well as estimated and projected values developed by the Economic Research Service all converted to a 2005 base year
-1.00
0.00
1.00
2.00
3.00
4.00
5.00
6.00
2006 2007 2008
World
Average GDP growth Nordic Market
Denmark
Finland
Iceland
Sweden

Joint Announcement Effect on Stock Price – A Study on Nordic Stock Exchanges
- 31 -
The explanatory variables are expected to have the following influences on the
dependent variable for a positive surprise in the joint announcement.
Table 6: Expectation of the Explanatory Variables
Variables Expectation for a positive surprise
DPSS +
EPSS +
DIEI +
DIED 0
DDEI 0
DDED -
DNCEI +
DNCED -
According to the notion of signaling theory and information asymmetry, the signs of
the coefficients are expected to follow the pattern in table 6. As presented in
Gunasekerage and Power (2006), the interaction effect of the group with opposite
surprise directions is likely to cancel out.
3.4.1 Regression Models
According to the hypotheses, the empirical model is formulated as:
CARi = α + β1DPSSi + β2EPSSi + β3DIEI + β4DIED + β5DDEI + β6DDED + β7DNCEI + β8DNCED + εi Firstly, this model is tested on the full sample of the period 2006 to 2008.
Furthermore, to investigate the effects of different dividend and earnings directions to
CAR, the regression is tested six times according to the different groupings.

Joint Announcement Effect on Stock Price – A Study on Nordic Stock Exchanges
- 32 -
CARi = α + β1DPSSi + β2EPSSi + εi In the hypotheses testing for the relationship between the surprise components and the
subsequent financial performance, the regressions use year 2006 data as a base for the
DPSS, EPSS and dummy variables while Yi represents different financial growth
ratios. The empirical regression model is as following.
Yi = α + β1DPSSi + β2EPSSi + β3DIEI + β4DIED + β5DDEI + β6DDED + β7DNCEI + β8DNCED + εi,
3.5 Research Concerns
There are several aspects that could impact the result of the study. Statistical models
or any other models can hardly be perfect in the world. In this study, the primary
problem is the difficulty in data collection, as all dividend and earnings announcement
dates are manually collected from companies’ websites. During the research process,
problems such as data unavailability and deviation of data from difference sources are
encountered. More importantly is the ability of method measure which should be in
line with what it is set out to measure. In addition, the result has to be interpreted
accurately, reliably and trustworthily.
3.5.1 Validity
The validity represents the issue whether the framework applied in this study captures
the interaction effects of information content of dividend and earnings surprises on
share abnormal return. The strength of the research findings rely on trustworthy data
and methods.
Since this study intend to measure the information content of the joint announcement
of dividend and earnings, it is important to consider if the data collected are valid for
measuring the surprise components. This market reaction to the surprise should be

Joint Announcement Effect on Stock Price – A Study on Nordic Stock Exchanges
- 33 -
captured on period surrounding the first time those information were released to the
public. Hence, the firstly publicly available information should be used even though
they are unaudited.
The approach of using stock return as a measurement of the information content of
the announcement has been widely applied by many famous researchers in this area
(Pettit 1972; Aharony and Swary 1980; Asquit and Mullins,Jr. 1983). Furthermore,
the relationship between the company’s subsequent financial performance and the
information content has also been presented in the studies of Jenson and Jonson
(1995), Conroy et al. (2000) and Gunasekerage and Power (2006). Most of the
researches had been done in major stock exchanges such as NYSE and LSE. Since the
logics behind those relationships are well recognized in the academic arena, the
regression models of this study are developed in accordance with their logic.
3.5.2 Reliability & Replicability
Besides having a valid method, reliable and truthful data collection and results
interpretation are of importance in the research. The reliability of the result is a
measure whether the similar result would be obtained if the research is replicated.
Throughout this paper, detailed description of each process is provided for the
audience to ensure that it can be replicated (Bryman et al. 2003).
In terms of data collection, the joint announcement date is manually extracted from
preliminary financial report on each company’s websites, DataStream and Reuters.
In the previous researches, they are deemed to be reliable, trustworthy and the best
information proxies for external investors. Moreover, in order to minimize the manual
error, the collected information of all observations are double checked and cross
referenced among the sources. Taking the transfer of GAAP into IFRS into
Joint Announcement Effect on Stock Price – A Study on Nordic Stock Exchanges
- 34 -
consideration, only the companies using IFRS from fiscal year 2006 are regarded as
samples in the study. Thus, the collected data are judged to be reliable.
All regression models in this research had been tested for OLS assumptions. White’s
test was performed and the residuals appeared to be homoscedastic in all models.
Ramsey’s RESET test indicated no specification errors in the models. Variance
Inflation Factor (VIF) showed that none of the auxiliary regression’s R-squared
exceeded 0.9 of the regressions. However, some of them slightly exceed the model’s
R-squared; we assume that this was not because of multicollinearity problem but
rather the low R-squared of the model itself. Furthermore, it is recommended in
Brooks (2002) to employ OLS if possible as “its behavior in a variety of
circumstances has been well researched” and that “appealing to Central limit
theorem” certain violation of the assumptions is “virtually inconsequential” for
“sufficiently large” samples (Brooks 2002, p182). As a result, this study applies OLS
for all eight regressions.
Joint Announcement Effect on Stock Price – A Study on Nordic Stock Exchanges
- 35 -
IV. EMPIRICAL FINDINGS AND ANALYSIS
This chapter illustrates the empirical findings from the market-based and accounting
data and the regressions models in the research. Further, a detailed analysis of the
findings is presented.
4.1 Empirical Findings
4.1.1 Descriptive Statistics
For the samples applied in the research, the descriptive statistics is illustrated as
followed:
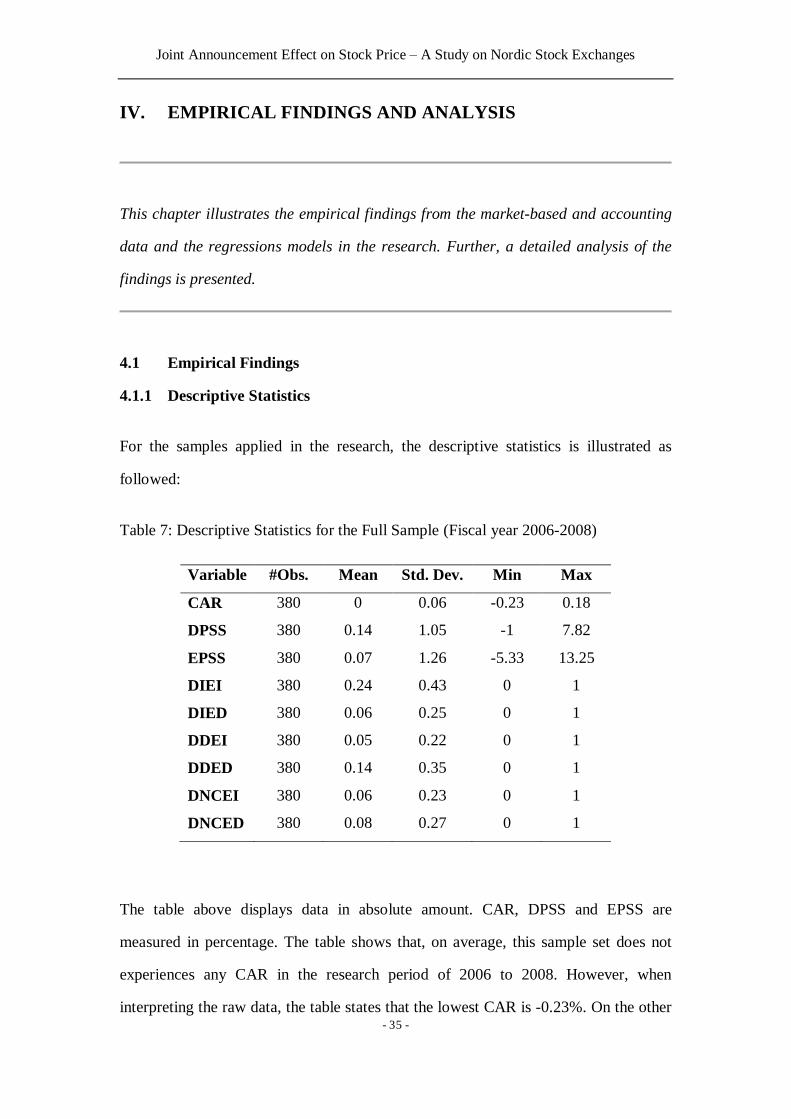
Table 7: Descriptive Statistics for the Full Sample (Fiscal year 2006-2008)
Variable #Obs. Mean Std. Dev. Min Max
CAR 380 0 0.06 -0.23 0.18
DPSS 380 0.14 1.05 -1 7.82
EPSS 380 0.07 1.26 -5.33 13.25
DIEI 380 0.24 0.43 0 1
DIED 380 0.06 0.25 0 1
DDEI 380 0.05 0.22 0 1
DDED 380 0.14 0.35 0 1
DNCEI 380 0.06 0.23 0 1
DNCED 380 0.08 0.27 0 1
The table above displays data in absolute amount. CAR, DPSS and EPSS are
measured in percentage. The table shows that, on average, this sample set does not
experiences any CAR in the research period of 2006 to 2008. However, when
interpreting the raw data, the table states that the lowest CAR is -0.23%. On the other

Joint Announcement Effect on Stock Price – A Study on Nordic Stock Exchanges
- 36 -
hand, the highest CAR is 0.18%. In conclusion, the table indicates that the dividend
and earnings announcements effect to the CAR is presence, but the magnitude is
negligible. For the independent variables, the average of each dividend and earnings
surprise is positive. During the timeframe of the study, the mean of DPSS and EPSS
is 0.14% and 0.7%, respectively.
Table 8: Descriptive Statistics for Fiscal Year 2006
Variable #Obs. Mean Std.
Dev. Min Max
CAR01_2006 149 -0.01 0.05 -0.1 0.11
DPSS_2006 124 0.55 1.27 -0.52 7.82
EPSS_2006 136 0.3 0.85 -0.98 4.71
GROICA 143 -0.12 0.47 -1.38 1.22
GNETMARGINA 135 0.06 0.13 -0.14 0.55
GQUICKRA 145 -0.03 0.24 -0.54 0.71
GFCCA 144 -0.13 0.63 -1.34 2.47
GROEA 134 0.09 0.41 -0.85 1.61
GCDCA 107 0.14 0.79 -0.83 3.33
DIEI_2006 159 0.3 0.46 0 1
DIED_2006 159 0.06 0.24 0 1
DDEI_2006 159 0.03 0.16 0 1
DDED_2006 159 0.06 0.24 0 1
DNCEI_2006 159 0.08 0.26 0 1
DNCED_2006 159 0.09 0.28 0 1
Table 8 shows that the mean CAR can be regarded as nonexistent (-0.01%). Dividend
surprise and earnings surprise are comparatively larger to the average amount
presented in the table 7. For the dependent variables, the table shows that the growths
of ROIC, Quick Ratio and Fix Charge Coverage were declining while Net Margin,
ROE and Cash Dividend Coverage were increasing during the subsequent years.

Joint Announcement Effect on Stock Price – A Study on Nordic Stock Exchanges
- 37 -
4.1.2 Regression Results
The table below presents the average CAR for each grouping in absolute amount of
the periods around the joint dividend and earnings announcement date of fiscal year
2006. This is done in order to observe if CAR presents any trends in the market.
Table 9: Mean CAR around Announcement Date of Fiscal Year 2006
CAR DIEI DIED DDEI DDED DNCEI DNCED
Y-1 -5.36% -7.13% -10.24% -63.98% -4.16% 185.69%
M-1 -1.18% -3.02% 2.16% 0.02% -1.09% -12.02%
Announcement
Period (d0 and d1) -1.17% 0.03% -0.38% -1.34% -0.48% -3.23%
M+1 -0.42% -1.87% 2.05% -3.09% -0.90% -25.31%
M+6 -8.45% 6.01% 4.95% -4.17% -3.46% -153.55%
Y+1 -13.16% -12.05% 9.03% -18.86% -8.97% -188.82%
Y+2 -27.82% -33.03% 6.15% -35.78% -38.41% -207.76%
In the year prior to the announcement date of fiscal year 2006, The DDED group
experienced the worse CAR of -63.98% while the DNCED group experienced the
best CAR of 185.69%. In the month prior to the announcement date, DDEI is the only
group that had a positive CAR of 2.16% while DDED performed slightly above zero.
DNCED group had the worse CAR of -12.02%. At the announcement period (d0 and
d1), most of the group experienced CAR near to zero regardless of the direction of the
announcement surprises. In other words, the results indicate that the announcement
has trivial or no effect on the share price. In the subsequent periods to the
announcement, only DDEI is able to maintain the positive CAR. However, it is
difficult to draw any conclusion on the stock price performance in a broad time
horizon as the stock prices would be affected by other noises in the market.

Joint Announcement Effect on Stock Price – A Study on Nordic Stock Exchanges
- 38 -
To examine whether the preliminary results, presented above, have any relations with
the actual announcement surprises, the following regressions would investigate if the
hypothesis holds.
In the short run window, two day surrounding the announcement date, abnormal
returns of the full portfolio (159 companies, including companies in none change
category) for each day were regressed with their surprise components. R-squared
represents the extent the dependent variable can be explained by the independent
variables of the dividend and earnings surprise of the separate groupings. The R-
squared is a general measurement of the regression and does not conclude each
variables magnitude to the abnormal return. Whenever an independent variable shows
significance in the regressions, it would then be retested in isolation to confirm its
relation with the dependent variable. Each coefficient explains the directionality and
magnitude of the independent variable with abnormal return.
Table 10: Regression of Abnormal Return for the Full Sample
Announcement
Period Constant DPSS EPSS F R2
Day-1 -0.00043 -0.00097 -0.00054 0.84 0.0049
t -0.42 -0.95 -0.64
Announcement
Date -0.0049 0.002181 0.002002 0.3889 0.0055
t -1.67 0.73 0.86
Day+1 0.00113 0.003008 -0.00133 2.06 0.0119
t 0.72 1.97 -1.08
The entries are regression coefficients and t statistics at 95% confidence interval. The
regressions were also tested at 90% and 99% levels; however, the statistical results

Joint Announcement Effect on Stock Price – A Study on Nordic Stock Exchanges
- 39 -
show that, in general, there is no relationship between the abnormal return and the
surprise announced.
Further investigations, focusing on the relation of CAR and the surprise factors for
each group, are shown in the following table:
Table 11: Regression of Cumulative Abnormal Returns on the Joint Dividend and
Earnings Announcement by Surprise Group
Regression CAR Constant DPSS EPSS F R2
1 DIEI -0.02227 0.0116046 ** 0.002486 3.14* 0.1388
t -1.75 2.04 0.61
2 DIED -0.00963 0.006183 0.01096 0.83 0.142
t -0.5 0.93 0.82
3 DDEI 0.03169 0.0628227* -0.00696 3.23 0.2539
t 1.57 2.13 -1.09
4 DDED 0.006916 0.00736 -0.00234 0.07 0.0024
t 0.48 0.32 -0.28
5 DNCEI 0.006765 0.8039858*** 0.016907 6.76*** 0.3805
t 0.5 3.28 1.52
6 DNCED -0.03229 -0.05962 -0.01027 0.2 0.0119
t -2.03 -0.25 -0.56
Note: Statistically significant at *90%, **95% and ***99% confidence interval
Table 12: Regression (Rerun) of Cumulative Abnormal Return by Group
Regression CAR Constant DPSS R2
1 DIEI
-0.0211
0.0128211** 0.1298
t -1.77 2.5
5 DNCEI 0.016813 0.8188402** 0.3156
t 1.39 3.26
Note: Statistically significant at *90%, **95% and ***99% confidence interval
Joint Announcement Effect on Stock Price – A Study on Nordic Stock Exchanges
- 40 -
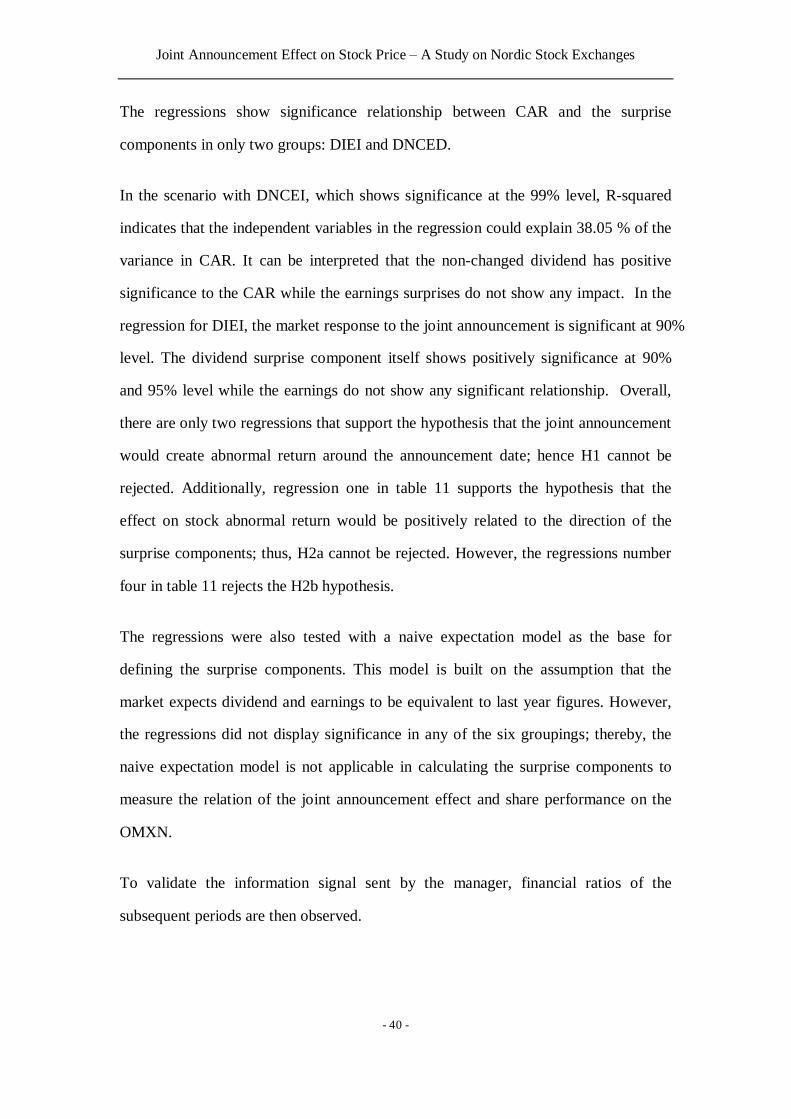
The regressions show significance relationship between CAR and the surprise
components in only two groups: DIEI and DNCED.
In the scenario with DNCEI, which shows significance at the 99% level, R-squared
indicates that the independent variables in the regression could explain 38.05 % of the
variance in CAR. It can be interpreted that the non-changed dividend has positive
significance to the CAR while the earnings surprises do not show any impact. In the
regression for DIEI, the market response to the joint announcement is significant at 90%
level. The dividend surprise component itself shows positively significance at 90%
and 95% level while the earnings do not show any significant relationship. Overall,
there are only two regressions that support the hypothesis that the joint announcement
would create abnormal return around the announcement date; hence H1 cannot be
rejected. Additionally, regression one in table 11 supports the hypothesis that the
effect on stock abnormal return would be positively related to the direction of the
surprise components; thus, H2a cannot be rejected. However, the regressions number
four in table 11 rejects the H2b hypothesis.
The regressions were also tested with a naive expectation model as the base for
defining the surprise components. This model is built on the assumption that the
market expects dividend and earnings to be equivalent to last year figures. However,
the regressions did not display significance in any of the six groupings; thereby, the
naive expectation model is not applicable in calculating the surprise components to
measure the relation of the joint announcement effect and share performance on the
OMXN.
To validate the information signal sent by the manager, financial ratios of the
subsequent periods are then observed.

Joint Announcement Effect on Stock Price – A Study on Nordic Stock Exchanges
- 41 -
Table 13: Mean Financial Ratio Announcement (2006)
DIEI DIED DDEI DDED DNCEI DNCED
Profitability Ratios
NetMargin 27.43 28.11 29.96 24.94 29.27 30.77
ROE 18.05 28.8 25.2 14.93 20.02 17.91
ROIC 15 14.24 22.3 12.71 17.71 16.96
Leverage Ratios
CDC 5.15 3.13 2.22 4.04 4.98 3.51
FCC 25.21 35.38 78.99 53.38 20.8 45.96
Liquidity Ratio
QuickRatio 1.01 1.14 0.96 1.41 1.18 1.57
The table displays the mean financial ratio for the fiscal year of 2006, separated by
the different surprise groupings. The numbers show that there is no obvious difference
among the groups. In the profitability perspective, the DDED group had relatively
low figures from other groups. In the liquidity perspective, the DDEI was
experiencing a lower than 1:1 quick ratio.

Joint Announcement Effect on Stock Price – A Study on Nordic Stock Exchanges
- 42 -
Table 14: Mean Financial Ratio Growth after Announcement (2007-2008)
DIEI DIED DDEI DDED DNCEI DNCED
Profitability Ratios
NetMargin 2.91% 11.87% 9.24% 18.30% 10.22% 11.37%
ROE 10.50% -15.30% 25.36% 20.02% -0.59% 38.43%
ROIC -6.01% -18.81% 1.93% -8.72% -24.03% 13.63%
Leverage Ratios
CDC 18.43% -0.26% 53.24% 4.28% 32.47% 9.67%
FCC -15.69% -14.33% -46.38% -24.81% -13.62% 3.51%
Liquidity Ratio
QuickRatio -5.84% -6.71% -3.44% -9.66% 4.24% -7.10%
The table above presents the mean financial ratio growth from fiscal year 2006 for
each separated groups. In the profitability perspective, the DNCED group
outperformed other groups. However, DDED had the highest growth in net margin. In
the leverage perspective, the groups with positive earnings surprise of fiscal year 2006
tended to outperform the others in the improvement of CDC. All groups except for the
DNCED group showed deteriorating performance in the FCC. In the liquidity
perspective, DNCEI is the only group that showed improvement in the ability to meet
its short-term obligations while DDED liquidity decreased by almost 10%.
To see whether these changes have any relations with the actual announcement
surprises the following regressions would investigate if the hypothesis holds.

Joint Announcement Effect on Stock Price – A Study on Nordic Stock Exchanges
- 43 -
Table 15: Regression of Post Announcement Financial Ratios Growth
Regression Profitability Ratios Leverage Ratios Liquidity Ratio
1 2 3 4 5 6
Net Margin ROE ROIC CDC FCC QuickRatio
DPSS 0.0039617 -0.050496 -0.058089 0.217397 -0.0665422 -0.003959
t 0.3 -1.24 -1.34 1.71 -1.1 -0.19
EPSS 0.0129846 0.0167334 0.0126045 -0.031689 -0.0232498 0.0384684
t 0.55 0.2 0.16 -0.17 -0.21 1.02
DIEI -0.0280363 * 0.0257915 0.1736625 -0.1509211 0.1068672 -0.136667 **
t -0.65 0.17 1.17 -0.53 0.51 -2.01
DIED 0.195749 ** -0.1022693 -0.162233 0.184118 -0.1507099 -0.076423
t 2.35 -0.39 -0.66 0.32 -0.44 -0.67
DDEI 0.0258755 0.1266164 0.1784336 0.6243055 -0.2953227 -0.136252
t 0.28 0.36 0.58 1.08 -0.68 -0.94
DDED 0.1601031 ** 0.1261674 0.1328578 0.3326225 -0.1006185 0.1088622
t 2.02 0.57 0.62 0.71 -0.3 0.86
DNCEI 0.057962 -0.0724244 -0.037405 0.3150724 0.0124711 0.0148752
t 1.15 -0.51 -0.24 0.99 0.06 0.2
DNCED 0.0865224 * 0.3227524 ** 0.317336 ** 0.2143847 0.0585241 -0.049111
t 1.92 2.1 2 0.7 0.26 -0.66
F 1.85 * 1.11 1.2 0.62 0.37 0.95
R2 0.1397 0.088 0.0883 0.0662 0.0296 0.0735
Note: Statistically significant at *90%, **95% and ***99% confidence interval.
The table above presents the joint announcement surprises and its relation to
subsequent financial performance. The result shows that at 90% confidence interval,
the average growth of net margin of the subsequent years can be affected by the
independent variables. For DNCED group the ROIC is positively significant whereas
the group of DIED, DDED, DNCED show positive significance for the ratios of net
margin at 95% level. The DNCED show a significantly positive trend in the ROE and
ROIC whereas the leverage ratios and liquidity cannot be explained by the surprise

Joint Announcement Effect on Stock Price – A Study on Nordic Stock Exchanges
- 44 -
and grouping components as their regressions is not significant. Whenever an
independent variable shows significance in the regressions, it would then be retested
in isolation to confirm its relation with the dependent variable.
Table 16: Regression (Rerun) of Financial Ratios Post Announcement
Financial Ratios DIEI DIED DDED DNCED
ROIC 0.2768709**
t 1.99
R2 0.0272
Net Margin 0.063394 0.1292106** 0.061015
t 1.28 2.25 1.65
R2 0.0122 0.0368 0.02
Quick Ratio -0.04359
t -1.03
R2 0.0074
ROE 0.317217
t 2.49
R2 0.0449
Note: Statistically significant at *90%, **95% and ***99% confidence interval.
After rerunning the significant independent variables at 95% to confirm its
relationship with the financial ratios, DNCED remains significant for ROIC and
DDED remains significant for net margin. The result of the regression of net margin
and DDED shows a positive relation. This is contradictory to H5b; hence, the H5b is
rejected. DIEI shows negative response direction to H8a however the result is
insignificant. According the results presented above, other hypotheses investigating
the information content and the financial performance in the subsequent period (H3a-
H5a and H6a-H8b) cannot be accepted, as they cannot be statistically confirmed that
the surprise components have any relations to the future development of the financial
profiles of the company.

Joint Announcement Effect on Stock Price – A Study on Nordic Stock Exchanges
- 45 -
In the regressions with the naive expectation model, the result displayed significance
in two groups on a 90% confidence interval. It showed a positive relation of
0.1441889 for net margin in DNCEI and a relation of 1.353285 with cash dividend
coverage ratio for the DDEI.
4.2 Analysis
As this research is composed by evaluating the joint announcement effect of dividend
and earnings, the results in this paper would convey a distinguishing angle into the
subject. The study brings contemporary relevance to the discussion around joint
announcements effect on shareholder value.
In the descriptive statistics for the full sample (see table 7) the DIED group represents
6% of the total observations. In this group, the management proposed a higher amount
of dividend than that expected by the market even though their earnings are below
expectations. This could be interpreted as the management used dividends as tool to
persuade the investors that the managements are confident in the company’s future
cash flows (Lintner 1956; Ross 1977). As presented in the regression for CAR (see
table 12), the results of the DIEI and DNCEI group provide statistically significant
evidences of their effects on CAR on the OMXN during the event study period of
fiscal year 2006-2008. For both of these two groups, the coefficient for dividend
surprise is positively significant while the earnings surprise does not show any impact
on the CAR. However, the magnitude of the dividend surprise for the DIEI group is
relatively small, a coefficient of 0.0116046 per unit. It seems to have no amplified
impact on the CAR as in comparison to DNCEI that has a coefficient of 0.8039858
per unit. The common factor of these two groups is that both display a positive
surprise in earnings. This might indicate that the market would value the companies
with a positive surprise in earnings that decide to maintain or increase their dividend.
However, other results of the regressions for CAR (see table 11) do not follow the

Joint Announcement Effect on Stock Price – A Study on Nordic Stock Exchanges
- 46 -
traditional pattern of theoretical reasoning regarding joint announcement effect of
dividend and earnings. If that should be the case, then a negative dividend-earnings
announcement (DDED) should arouse a negative abnormal return (Conroy et al.
2000).
In the regressions where the trends of the dividend and earning components display
contrary surprises (+,-), the results are in general insignificance. It might be
interpreted as the opposite effects of the surprises components canceled out each other
(Gunasekarage et al. 2006). Overall, the coefficients are miniscule for all the
components. The rather low R-squared (with the highest R-squared of 38.05% of
DNCEI group) suggests poor explanatory power of the independent variables. Hence,
there are other independent variables beside those already expressed in the regression
that would affect the movement of share price. Additionally, this could be interpreted
as the market might not be able to capture the full value of the deviation from the
I/B/E/S forecast. Thus, it cannot be concluded that the signaling effect and the
information content of dividend and earnings prevail in the OMXN. This discovery
thereby support the original theory from Miller & Modigliani (1961) around dividend
irrelevancy proposition as the findings present that a change in dividend policy has
diminutive effect on the share price. However, regarding the efficient market
hypothesis, the statistical results of the joint announcement effects on the OMXN is
inconclusive. The regressions on the full sample (see table 10) present that there is no
relationship between abnormal return and the surprise components while the
regressions on different groupings (see table 11) show significant result for DIEI
group at 90% level and for DNCEI at 99% level. As a result, this study provides no
congruent evidences to conclude that the market is fully efficient.
The post announcement performance of the six dividend and earnings groups are
examined to test whether the predictions of the joint announcement signaling
hypotheses are accurate. The financial performances of the two subsequent years to

Joint Announcement Effect on Stock Price – A Study on Nordic Stock Exchanges
- 47 -
the announcement are observed. The proposed logical pattern is build under the
assumptions of information asymmetry and that dividend could convey information
by signaling managers’ anticipation about the company’s future performance;
therefore, it should be feasible to investigate the development of the company’s
financial profile to extend the understanding regarding the actual information content
of the signal. The results of regressions of post announcement financial ratios growth
(see table 16) are partially consistent with what previous researches had concluded.
The groups that present negative earnings announcement surprises to the market
expectation display significant improvement in profitability in the subsequent years.
The pattern of dividend reduction and the improvement of the subsequent financial
performance of the DDED can be described as a turning point for the company
(Jenson and Johnson 1995). It could be explained as the company that reduced its
dividend did so in order to resolve its current financial difficulty instead of signaling
to the market that the inferior performance would be permanent. This conclusion does
not support the signaling theory (Gunasekarage and Power 2006). Furthermore, in
relation with the dividend growth model, it is possible to argue that a dividend
decrease could indicate that the company might be focusing on reinvestments. As a
result, those groupings show improvement in the financial profile in the subsequent
years. The dividend growth model has the expected share prices as the dependent
variable; the theory discusses the tradeoff between dividend payout and the level of
retained earnings that would impact the expectations of share price (Gordon 1956).
Yet, in the study conducted the statistical insignificance of the CAR and its relation
with DDED does not give this paper any further insight into this issue. The pattern of
DNCED can be explained by the behavioral of dividend that managements tend to
maintain the dividend if they perceived the weakening performance as temporary
(Lintner 1956). This explanation supports the notion of information asymmetry and
signaling theory. However, this study attempts to see if the pattern can be related to
any specific segmentation by evaluating table 17 below.

Joint Announcement Effect on Stock Price – A Study on Nordic Stock Exchanges
- 48 -
Table 17: The Composition of the Joint Dividend and Earnings Surprises Group by
Industry
INDUSTRIES DIEI DIED DDEI DDED DNCEI DNCED NC
Consumer Discretionary 10.42% 30.00% 0.00% 0.00% 25.00% 21.43% 16.39%
Consumer Staples 14.58% 10.00% 0.00% 10.00% 8.33% 0.00% 8.20%
Energy 8.33% 0.00% 0.00% 0.00% 0.00% 0.00% 1.64%
Health Care 12.50% 0.00% 0.00% 10.00% 16.67% 0.00% 13.11%
Materials 4.17% 10.00% 0.00% 0.00% 0.00% 7.14% 16.39%
Tele Services 0.00% 0.00% 25.00% 0.00% 0.00% 0.00% 1.64%
Information Technology 8.33% 20.00% 25.00% 20.00% 0.00% 21.43% 4.92%
Industrials 41.67% 30.00% 50.00% 60.00% 41.67% 42.86% 37.70%
Utilities 0.00% 0.00% 0.00% 0.00% 8.33% 7.14% 0.00%
The evidence in this study displays that there are no obvious differences in the
characteristics of the composition across the dividend and earnings surprises group.
Thereby, it is not possible to explain the behavior of those earning decrease groups by
its segment specific factors.
Exhibit 2 shows an interesting aspect of the development in the compositions of the
groupings during the selected time frame. It cannot be disregarded that the unexpected
scale of the financial crisis has had an impact on the transformation of the grouping.
Additionally, it is very likely that it has impacted the probabilities for the market to
make accurate predictions about earnings and dividends. As a result, this has to be
taken into consideration as this study was conducted in the time when irrational
behavior and uncertainty factors due to the economic crisis could proceed into
illogical stock price movements. Furthermore, this might partially explain why the
regression of CAR does not follow the traditional pattern of the signaling theory.

Joint Announcement Effect on Stock Price – A Study on Nordic Stock Exchanges
- 49 -
Several previous studies reached different results on the topic. Our interpretation to
this phenomenon could be separated into three aspects:
1. Methodology: The different methodology approaches that are used to examine the
announcement affect are one of these factors. As different numerical models, sample
size and regressions are structured in diverse ways and does not follow the same
outline, the result would be affected by these parameters.
2. Markets: The studies are constructed on different stock exchange markets which
have different weight of industry composition to its market, tax regime, and
legislative regulation thereby having different presumptions both for the investor as
for a comparable study.
3. Exogenous factors: As researches were conducted in different time frames,
exogenous variables such as unexpected strength of economical cycles and other
external factors might impact the interpretation of the result.

Joint Announcement Effect on Stock Price – A Study on Nordic Stock Exchanges
- 50 -
V. CONCLUSION AND PROPOSAL FOR FURTHER RESEARCH
This chapter concludes the complete study and suggests potential topics for further
research.
5.1 Conclusion
The purpose of this study is to investigate to what extent the information content in
the joint dividend and earnings announcement affect share price reactions in the
OMXN and to examine the financial performance of the companies in subsequent
period to the announcement. By examining these aspects, the study wants to shed a
light on the topic of the information conveyed in the announcements and its relation
to future performance.
The majority of the companies listed on the OMXN publish the information of
dividend and earnings simultaneously. This gives this study a comprehensive edge to
investigate the joint announcement of the dividend and earnings.
The results from this study show that surprises in the joint announcement of dividend
and earnings do not have an impact on share price. This discovery thereby support the
original theory from Miller & Modigliani (1961) around dividend irrelevancy
proposition as the findings present that a change in dividend policy has diminutive
effect on the share price. However, regarding the efficient market hypothesis, the
statistical result of the joint announcement effects on the OMXN is inconclusive. As a
result, this study provides no congruent evidences to conclude that the market is fully
efficient.

Joint Announcement Effect on Stock Price – A Study on Nordic Stock Exchanges
- 51 -
The findings of the regressions on the post announcement financial ratio growth were
statistically insignificant. However, there is an observable pattern for the earning
decrease groups. In the post announcement period, the DDED and DNCED showed
an improvement in the profitability ratios growth. The pattern of dividend reduction
and the improvement of the subsequent financial performance of the DDED can be
explained as the company that reduced its dividend did so in order to resolve its
current financial difficulty instead of signaling to the market that the inferior
performance would be permanent. Furthermore, in relation with the dividend growth
model, it is possible to argue that a dividend decrease could indicate that the company
might be focusing on reinvestments (Gordon 1956). The pattern of DNCED can be
explained by the behavioral of dividend that managements tend to maintain the
dividend if they perceived the weakening performance as temporary (Lintner 1956).
5.2 Further Research
Suggestions for further researcher which has been initiated as interesting aspects during
the process of this thesis: Our R-Squared is fairly low, which open up for other
hypothesis of potential factors and events that could further describe share price
movements. It would also be interesting to investigate:
l Investigate the full dividend effect on shareholders’ wealth by capturing the effects
on both dividend announcement and ex-dividend date
l Announcement effect of dividend and earnings in emerging markets
l Dividend policy among separate markets, its relation with corporate governance
and the effects on share price
Joint Announcement Effect on Stock Price – A Study on Nordic Stock Exchanges
- 52 -
REFERENCES
Articles
Abeyratna, G., Lonie, A.A., Power, D.M. and Sinclair, C.D., 1996, “The Influence of
Company Financial Performance on the Interpretation of Dividend and Earnings Signals: A
Study of Accounting – And Market – Based Data”, British Accounting Review, 1996. 28,
pp.229-247
Aharony, J. and Swary, I., 1980, “Quarterly Dividend and Earnings Announcements and
Stockholders’ Return: An Empirical Analysis”, The Journal of Finance, Vol. 35, No. 1, pp.1-
12
Ahern, K.R., 2006, “Sample selection and event study estimation”, Journal of Empirical
Finance, Vol.16, No.3, pp.466-482
Asquith, P. and Mullins, Jr. D.W., 1983, “The Impact of Initiating Dividend Payment on
Shareholders’ Wealth”, The Journal of Business, Vol.56, No.1, pp.77-96
Ball, R., 1978, “Anomalies in Relationships between Securities' Yields and Yield-Surrogates”,
Journal of Financial Economics, Vol.6, No.2-3, pp.103-126
Barber, B.M. and Lyon, J.D., 1997, “Detecting Long-run Abnormal Stock Returns: The
Empirical Power and Specification of Test Statistics”, Journal of Financial Economics, Vol.
43, pp.341-372
Brav, A., Graham, J.R., Harvey, C.R. and Michaely, R., 2005, “Payout Policy in the 21st
Century”, Journal of Financial Economics, Vol.77, No.3, pp.483-527
Brigham, E.F. and Ehrhardt, M.C., 2002, “Financial Management: Theory and Practice”, 10th
edition, Harcourt, New York, pp.699.

Joint Announcement Effect on Stock Price – A Study on Nordic Stock Exchanges
- 53 -
Brown, P. and Ball, R., 1968, “An Empirical Evaluation of Accounting Income Numbers”,
Journal of Accounting Research, Vol.6, No.2, pp.159-178
Brown, S.J. and Warner, J.B., 1985, “Using Daily Stock Returns”, Journal of Financial
Economics, Vol. 14, pp.3-31
Brown, S.J., Goetzmann, W., Ibbotson, R.G. and Ross, S.A., 1992 “ Survivorship Bias in
Performance Bias”, The Review of Financial, Vol.5, No.4, pp.553-580
Conroy, R.M., Eades, K.M. and Harris, R.S., 2000, “A Test of the Relative Pricing Effects of
Dividends and Earnings: Evidence from Simultaneous Announcements in Japan”, The
Journal of Finance, Vol.55, No. 3, pp.1199-1227
Fama, E.F., Fisher, L., Jensen, M.C. and Roll, R., 1969, “The adjustment of Stock Prices to
New Information”, International Economic Review, Vol.10, No.1, pp.1-21
Fama, E.F., 1970, “Efficient Capital Markets: A Review of Theory and Empirical Work”,
Journal of Finance, Vol.25, No.2, pp.383-417
Fama, E.F., 1998, “Market Efficiency, Long-term Returns, and Behavioral Finance”, Journal
of Financial Economics, Vol.49, No.3, pp.283-306
Finnerty, J.E., 1976, “Insiders and Market Efficiency”, Journal of Finance, Vol.31, No.4,
pp.1141-1148
Gordon, M.J., 1959, “Dividends, earnings and stock prices”, Review of Economics and
Statistics, Vol. 41, pp.99–105
Gunasekarage, A. and Power, D.M., 2002, “The Post-Announcement Performance of
Dividend-Changing Companies: The Dividend-Signaling Hypothesis Revisited”, Accounting
and Finance, No. 42, pp.131-151

Joint Announcement Effect on Stock Price – A Study on Nordic Stock Exchanges
- 54 -
Gunasekarage, A. and Power, D.M., 2006, “Anomalous Evidence in Dividend Announcement
Effect”, Managerial Finance, Vol. 32, No. 3, pp.209-226
Jaffe, J.F., 1974, “The Effect of Regulation Changes on Insider Trading”, The Bell Journal of
Economics and Management Science, Vol.5, No.1, pp.93-121
Jensen, G.R. and Johnson, J.M., 1995, “The Dynamics of Corporate Dividend Reductions”,
Financial Management, Vol. 24, No. 4, pp.31-52
Miller, M.H. and Modigliani, F., 1961, “Dividend Policy, Growth, and the Valuation of
Shares”, Journal of Business, 34, pp.411-433
Lintner, J., 1956, “Distribution of Incomes of Corporations among Dividends, Retained
Earnings and Taxes”, American Economic Review, Vol. 46, No. 2, pp.97–113
Pettit, R., 1972, “Dividend Announcement, Security Performance, And Capital Market
Efficiency”, Journal of Finance, Vol.27, No.5, pp.993-1007
Pettit, R, 1976, “The Impact of Dividend and Earnings Announcements: A Reconciliation”,
Journal of business, Vol.49, No.1, pp.86-96
Ross S.A., 1977, “The Determination of Financial Structure: The Incenggggggtive - Signaling
Approach”, The Bell Journal of Economics, 8, pp.23-40
Sponholtz, C., 2005, “Sperating The Stock Market’S Reaction To Simultaneous Dividend
And Earnings Announcements”, Aarhus: University of Aarhus
Watts, R., 1973, “The Information Content of Dividend”, The Journal of Business, Vol. 46,
No. 2, pp.191-121
Watts, R., 1976, Comments on “The Impact of Dividend and Earnings Announcements: A
Reconciliation”, The Journal of Business, Vol. 49, No. 1, pp.97-106

Joint Announcement Effect on Stock Price – A Study on Nordic Stock Exchanges
- 55 -
Literatures
Berk, J. and DeMarzo, P., 2009, “Corporate Finance - The Core,” Pearson Education, Inc.
pp.532-534
Brooks, C., 2005, “Introductory Econometrics for Finance”, Cambridge University Press,
Cambridge
Bryman, A. and Bell, E., 2003, “Business research methods”, Oxford University Press
Copeland, T.E., Weston, J.F. and Shastri, K, 2005, “Financial Theory and Corporate Policy”
Fourth Edition, Pearson Education, Inc.
Gujarati, D.N., 2002, “Basic Econometrics” 4th Edition, McGraw-Hill/Irwin, pp.109
Long. J.S. and Freese, J., 2006, “Regression Models for Categorical Dependent Variables
Using Stata”, Stata Press, StataCorp LP
Tracy, J.A., 2004, “How to Read a Financial Report: Wringing Vital Signs Out of the
Numbers”, John Wiley and Sons, Inc. pp.173
Ross, S.A., Westerfield, R.W. and Jaffe, J., 2008, “Corporate Finance”, McGraw-Hill
Companies
Bragg, S.M., 2003, “Business Ratios and Formulas: A Comprehensive Guide”, John Wiley
and Sons, Inc.
Walsh, C., 2006, “Key Management Ratios: Master the management metrics that drive and
control your business”, Fourth Edition, Prentice Hall

Joint Announcement Effect on Stock Price – A Study on Nordic Stock Exchanges
- 56 -
Internet Websites
Business Wire, 2007, “OMX: Changes in Market Cap Segments on the Nordic Exchange”,
available: http://www.allbusiness.com/services/business-services/4518575-1.html [12 May
2009]
Konjunkturinstitutet, 2008, “Den Finansiella Krisen –utveckling under 2008”, available:
http://www.konj.se/download/18.6b38234911d6cedb125800040543/Ruta2_+KL_dec2008_
web.pdf [09 May, 2009]
NASDAQ OMX, available: www.nasdaqomxnordic.com/ [22 April, 2009]
NASDAQ OMX, 2008,”Rules & regulations”, available:
http://www.nasdaqomx.com/listingcenter/nordicmarket/rulesandregulations/ [13 May, 2009]
NASDAQ ONLINE, 2009, “About NASDAQ”, available:
http://www.nasdaq.net/PublicPages/AboutNasdaq.aspx [11 May 2009]
NYSE Euronext, 2009, “NYSE – Listings Directory”, available:
http://www.nyse.com/about/listed/lc_ny_overview.html [11 May 2009]
World Bank World Development Indicators, International Financial Statistics of the IMF,
“Real Historical Gross Domestic Product (GDP) and Growth Rates of GDP for baseline
countries/Regions (in billions of 2005 dollars) 1969-2008”, (updated 16 December 2008)
available: www.ers.usda.gov/Data/macroeconomics/Data/HistoricalRealGDPValues.xls [17
May, 2009]
World Federation of Exchange, 2007, “Domestic market Capitalization Segmentation
Survey”, available: http://www.world-
exchanges.org/files/statistics/excel/Market%20Cap%20Segmentation%20Survey%202007-
Annex.pdf [14 May 2009]

Joint Announcement Effect on Stock Price – A Study on Nordic Stock Exchanges
- 57 -
World Federation of Exchanges, “Domestic Market Capitalization (Download Statistics)”,
available: http://www.world-exchanges.org/statistics/annual/2008/equity-markets/domestic-
market-capitalization [11 May 2009]
World Federation of Exchanges, “Domestic Market Capitalization (Latest Statistics)”,
available: http://www.world-exchanges.org/statistics/ytd-monthly [11 May 2009]
Yahoo Finance, “Dow Jones Industrial Average”, available:
http://finance.yahoo.com/q/hp?s=^DJI&a=03&b=1&c=1999&d=04&e=11&f=2009&g=d [10
May, 2009]
Yahoo Finance, “NASDAQ Composite”, available:
http://finance.yahoo.com/q/hp?s=^IXIC&a=03&b=1&c=2004&d=04&e=15&f=2009&g=d
[10 May, 2009]
Database
Thomson Datastream