John Gasch Lazaros Oreopoulos - Landsat Missions Oreopoulos Landsat Science Team NASA-GSFC ... •...
39
20 January 2010 20 January 2010 Lazaros Oreopoulos Lazaros Oreopoulos Landsat Science Team Landsat Science Team NASA NASA - - GSFC GSFC John Gasch John Gasch Landsat Mission Operations Landsat Mission Operations Emalico LLC Emalico LLC
Transcript of John Gasch Lazaros Oreopoulos - Landsat Missions Oreopoulos Landsat Science Team NASA-GSFC ... •...

20 January 201020 January 2010
Lazaros OreopoulosLazaros OreopoulosLandsat Science TeamLandsat Science TeamNASANASA--GSFCGSFC
John GaschJohn GaschLandsat Mission OperationsLandsat Mission OperationsEmalico LLCEmalico LLC
1/20/2010 2
1/20/2010 3
1 T.Arvidson, S.Goward, J.Gasch, D.Williams, Landsat 7 Long-Term Acquisition Plan:Development and Validation, PE&RS, Vol 72, No. 10, October 2006, pp. 1137-1146.
2 T.Arvidson, R.Irish, B.Markham, D.Williams, J.Feuquay, J.Gasch, S.Goward, Validation of theLandsat 7 Long-Term Acquisition Plan, Proceedings of Pecora 15, ASPRS, Bethesda, MD

1/20/2010 4

1/20/2010 5

1/20/2010 6
1/20/2010 7
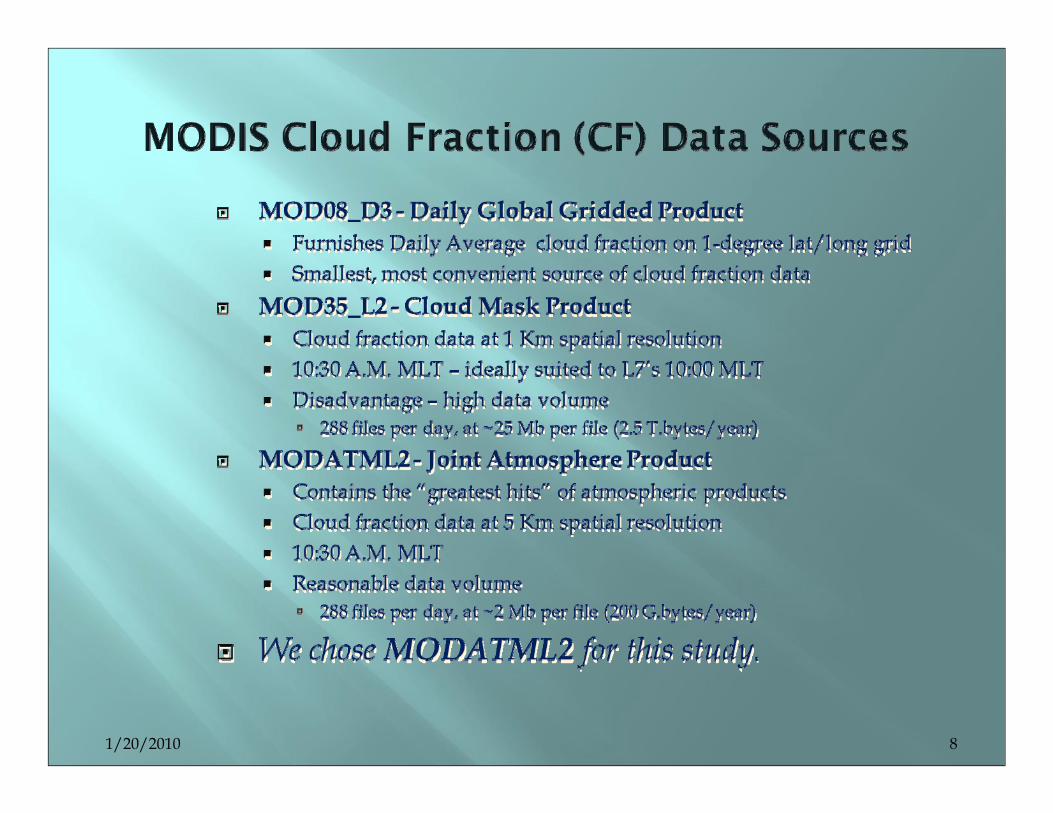
1/20/2010 8
1/20/2010 9

0 MODIS D3 CF 100
0 ACCA 100
1/20/2010 10
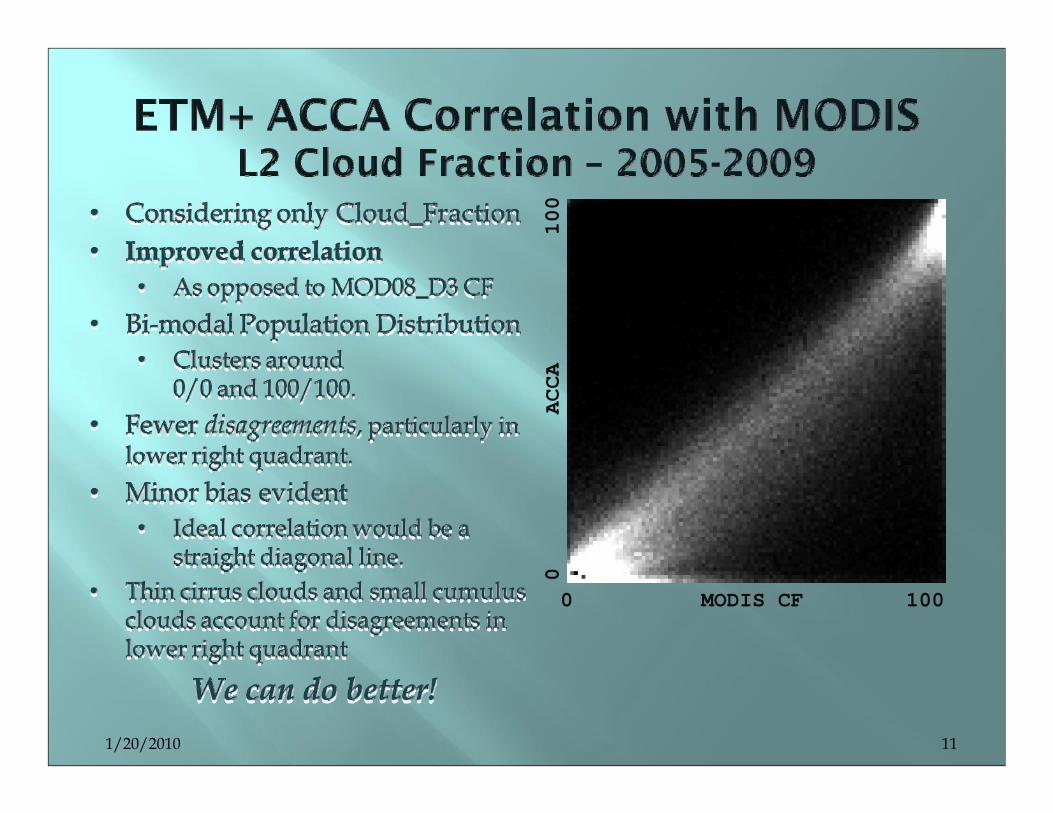
0 ACCA 100
1/20/2010 11
0 MODIS CF 100
0 ACCA 100
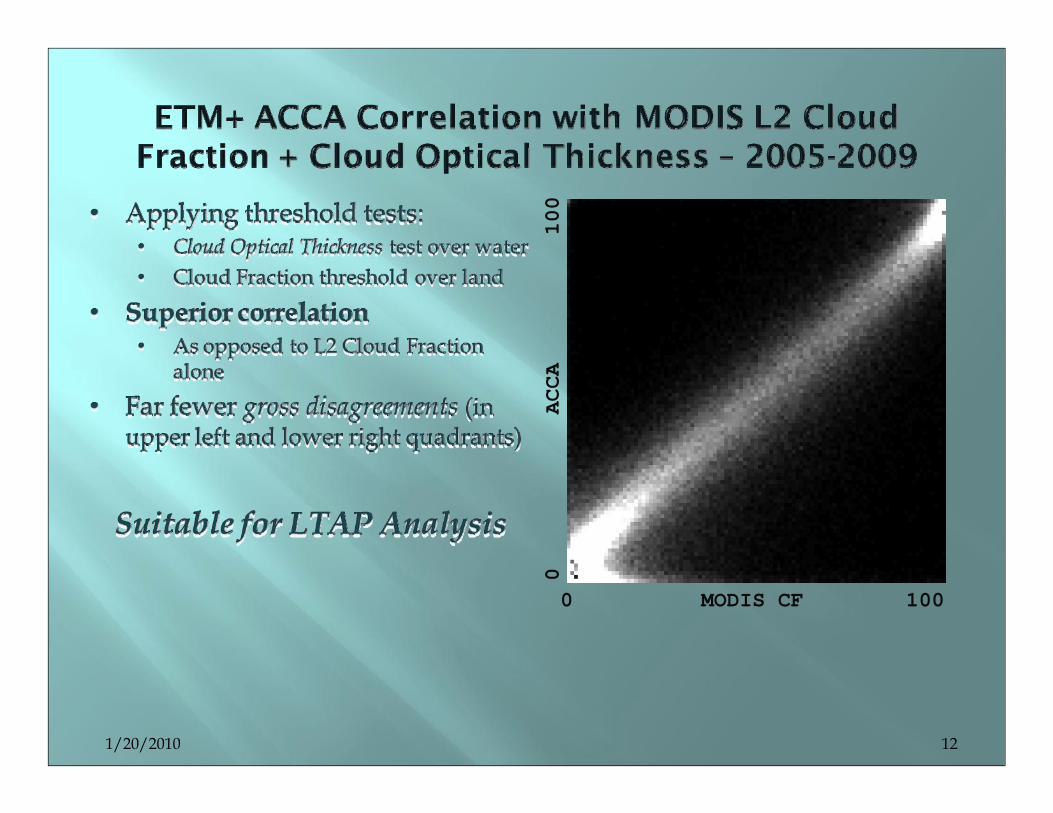
0 MODIS CF 100
1/20/2010 12

WRS 26/41 5-Aug-2009
ETM+ ACCA = 3 MODIS CF = 28.1Example of problematic scene.
Sensor resolution affects discrimination of fair weather cumulus clouds
1/20/2010 13

WRS 112/64 10Apr2009
ETM+ ACCA = 5 MODIS CF = 4.7
1/20/2010 14

WRS 2/76 1-Jan-2009
ETM+ ACCA = 29 MODIS CF = 33.8
1/20/2010 15

WRS 41/26 2006/154
ACCA = 31MODIS_CF = 32.1
WRS 182/64 2006/182
ACCA = 40MODIS_CF = 31.5
1/20/2010 16
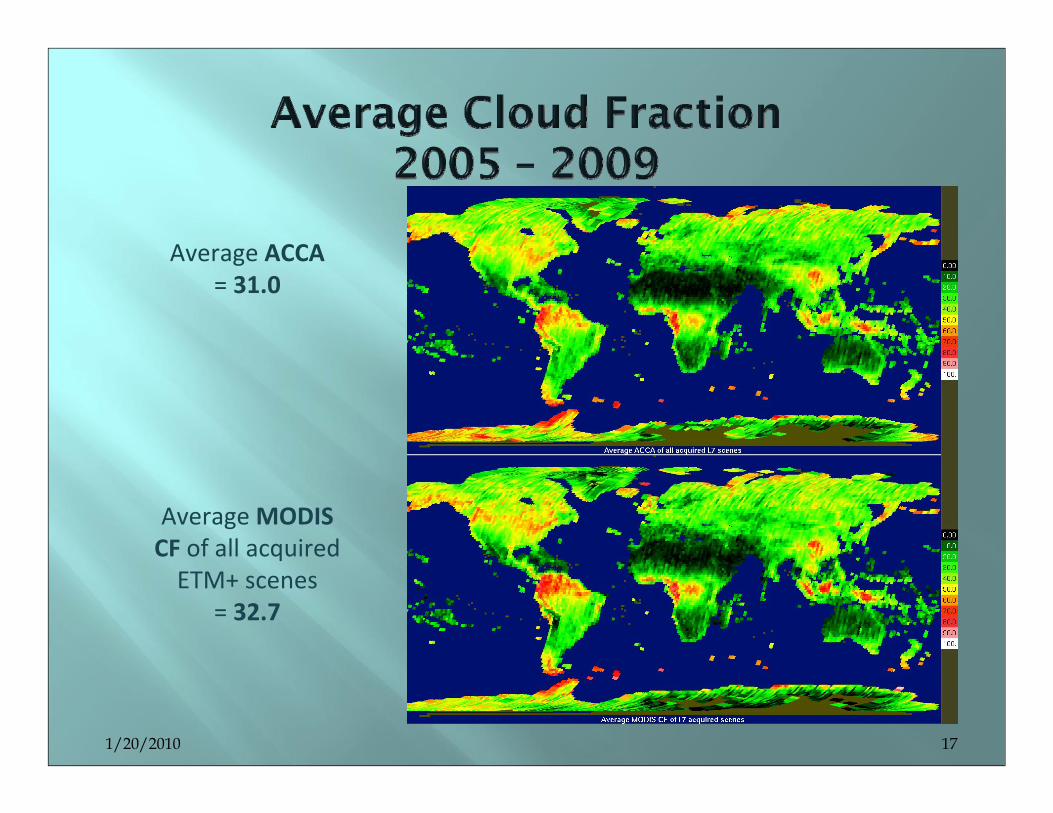
Average ACCA= 31.0
Average MODIS CF of all acquired ETM+ scenes
= 32.7
1/20/2010 17
1/20/2010 18
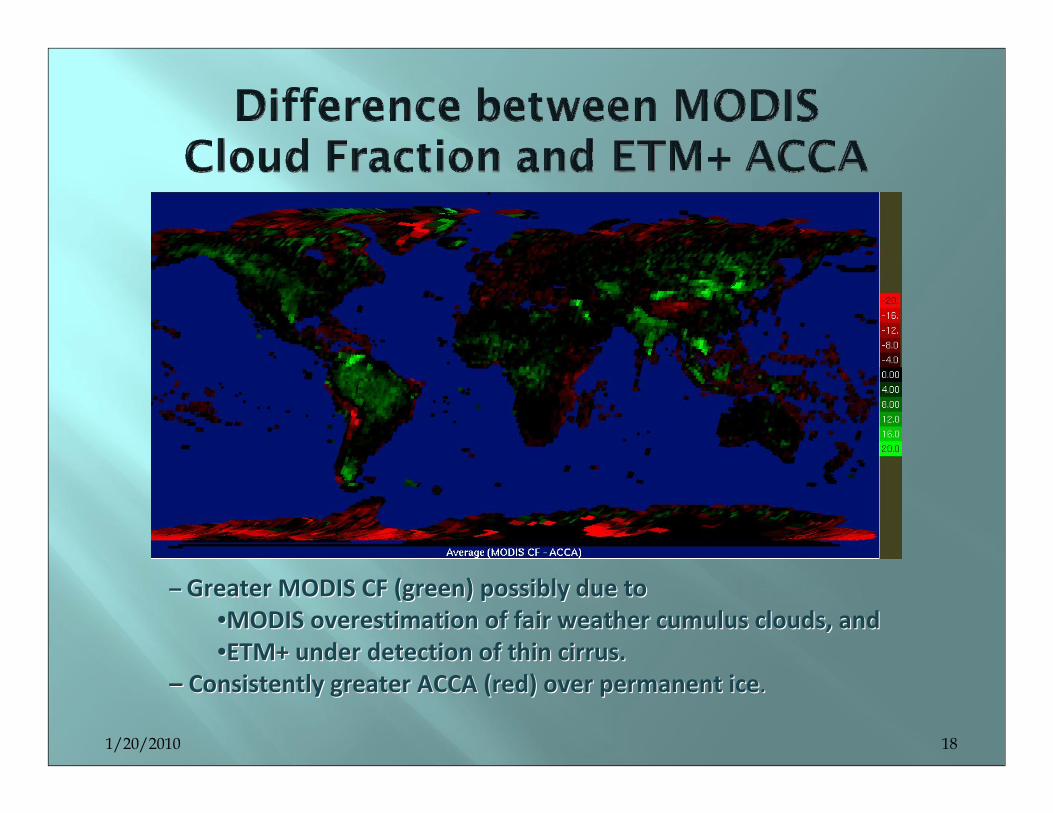
–– Greater MODIS CF (green) possibly due to Greater MODIS CF (green) possibly due to ••MODIS overestimation of fair weather cumulus clouds, and MODIS overestimation of fair weather cumulus clouds, and ••ETM+ under detection of thin cirrus.ETM+ under detection of thin cirrus.
–– Consistently greater ACCA (red) over permanent iceConsistently greater ACCA (red) over permanent ice..

1/20/2010 19
Using this function to Using this function to normalizenormalize MODIS CF yieldsMODIS CF yieldsaverage CF = average CF = 31.4 31.4 for all acquired ETM+ scenes for all acquired ETM+ scenes
1/20/2010 20


•There was a maximum of 5x365/16=114 opportunities for each WRS scene for 2005-2009.•The LTAP chooses some to acquire, and skips others based on many factors.•High latitudes have fewer candidate scenes due to sun angle constraints.•Desert scenes (principally Sahara, Saudi Arabia) have candidate scenes due to LTAP seasonal single acquisition considerations.
1/20/2010 22
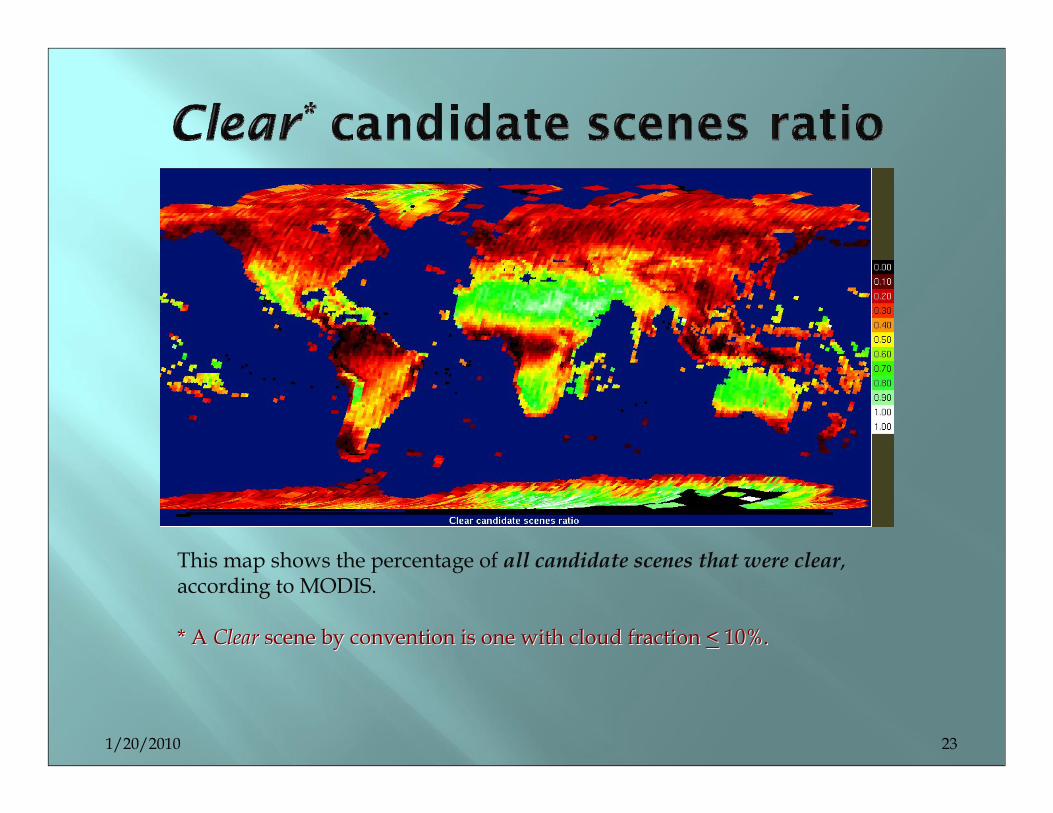
This map shows the percentage of all candidate scenes that were clear, according to MODIS.
* A * A ClearClear scene by convention is one with cloud fraction scene by convention is one with cloud fraction << 10%.10%.
1/20/2010 23
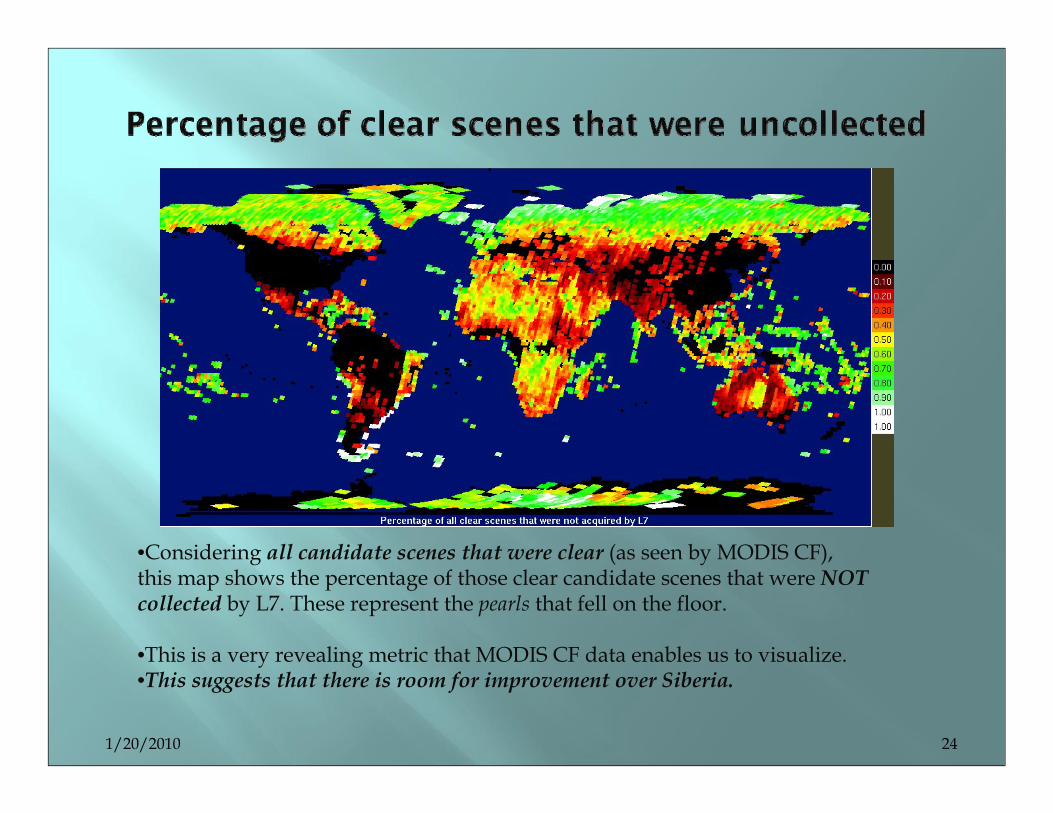
•Considering all candidate scenes that were clear (as seen by MODIS CF),this map shows the percentage of those clear candidate scenes that were NOT collected by L7. These represent the pearls that fell on the floor.
•This is a very revealing metric that MODIS CF data enables us to visualize.•This suggests that there is room for improvement over Siberia.
1/20/2010 24
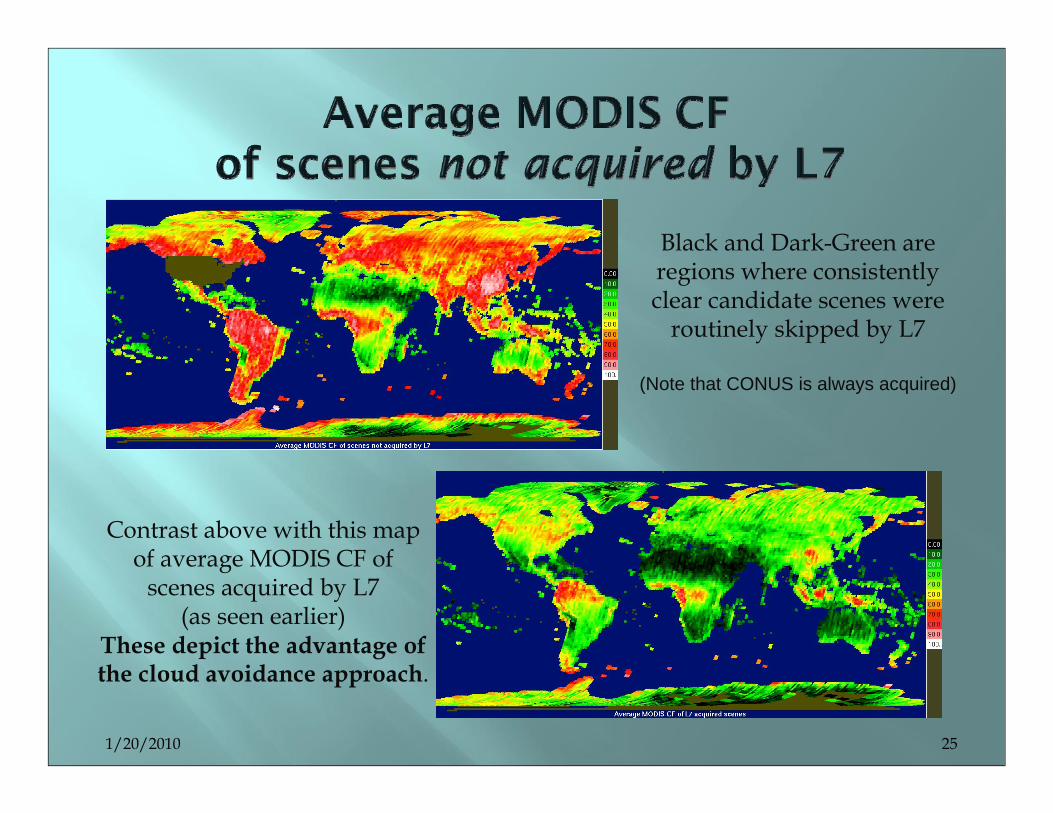
Black and Dark-Green are regions where consistently clear candidate scenes were
routinely skipped by L7
(Note that CONUS is always acquired)
1/20/2010 25
Contrast above with this map of average MODIS CF of
scenes acquired by L7(as seen earlier)
These depict the advantage of the cloud avoidance approach.

• This shows the ratio of average clear sky fraction (1 - CF) of all collected scenes versus the average clear sky fraction of all candidate scenes.• Yellow is “neutral”, where cloud avoidance yields no advantage.• Green toward white shows beneficial performance.• White shows where the average clear sky fraction of collected scenes exceeds the average clear sky fraction of all candidate scenes by greater than 50%.• Note the sparseness of black and red scenes, where cloud avoidance rules are detrimental.
1/20/2010 26
1/20/2010 27
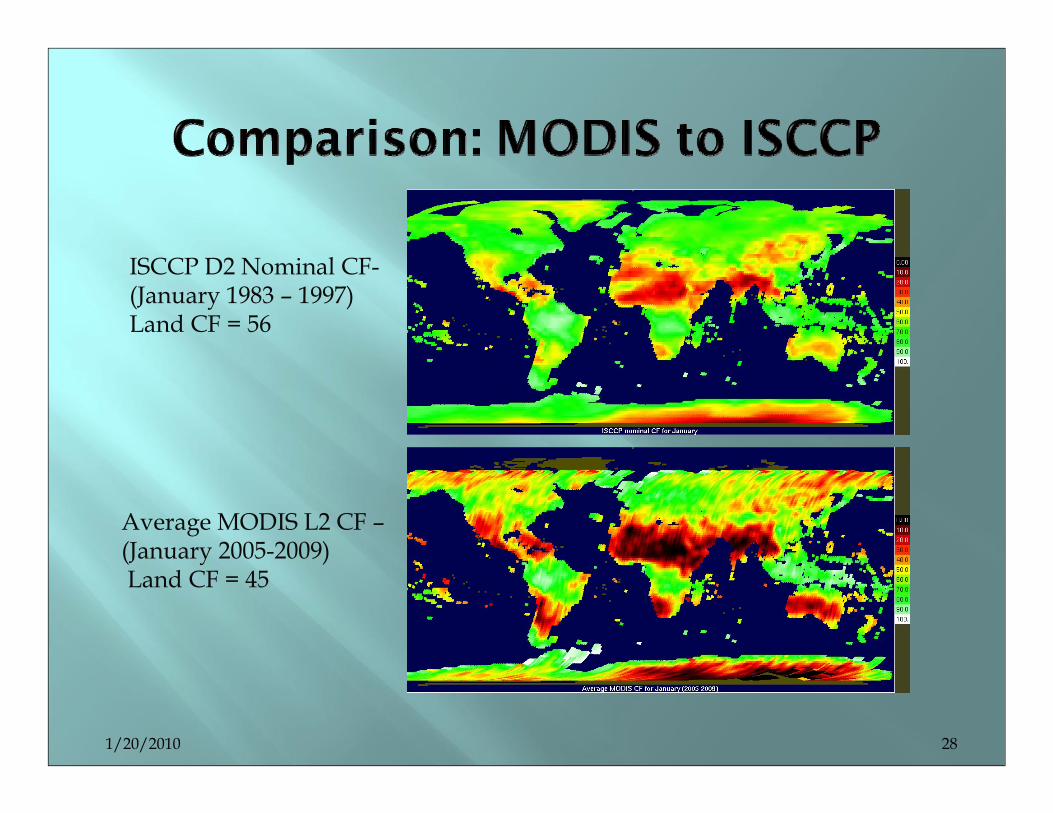
ISCCP D2 Nominal CF-(January 1983 – 1997) Land CF = 56
Average MODIS L2 CF –(January 2005-2009)Land CF = 45
1/20/2010 28

1/20/2010 29
1/20/2010 30

1/20/2010 31


1/20/2010 33
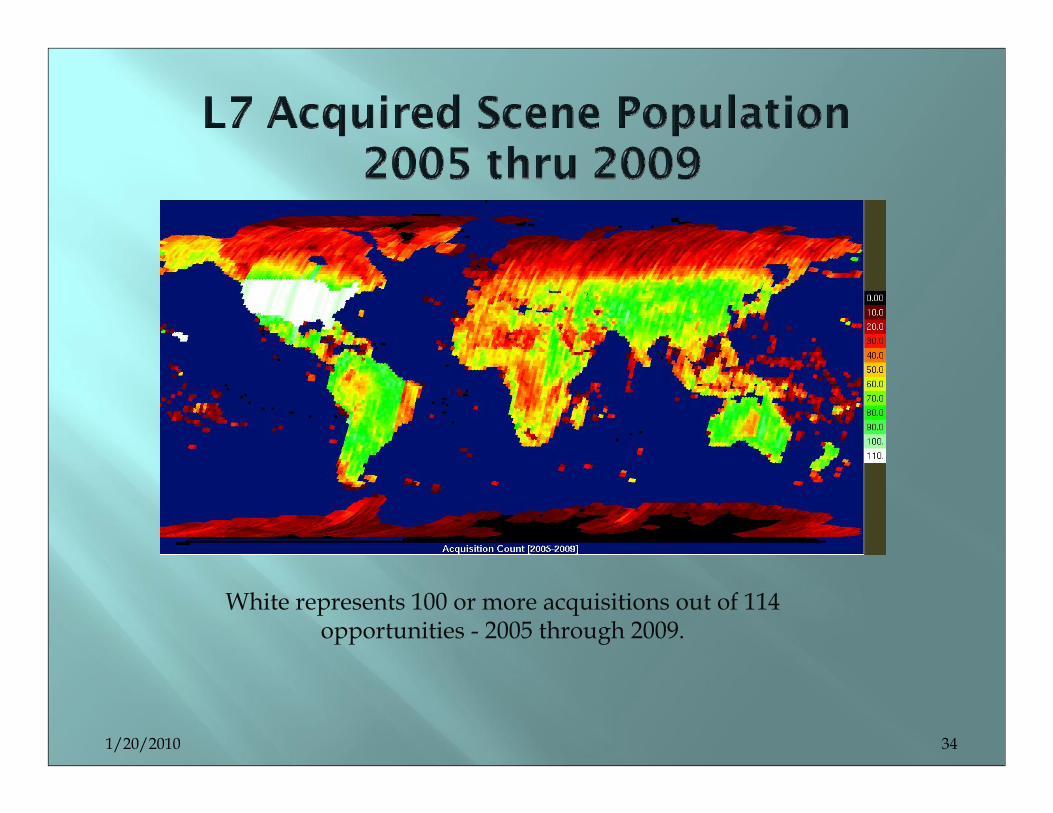
White represents 100 or more acquisitions out of 114 opportunities - 2005 through 2009.
1/20/2010 34
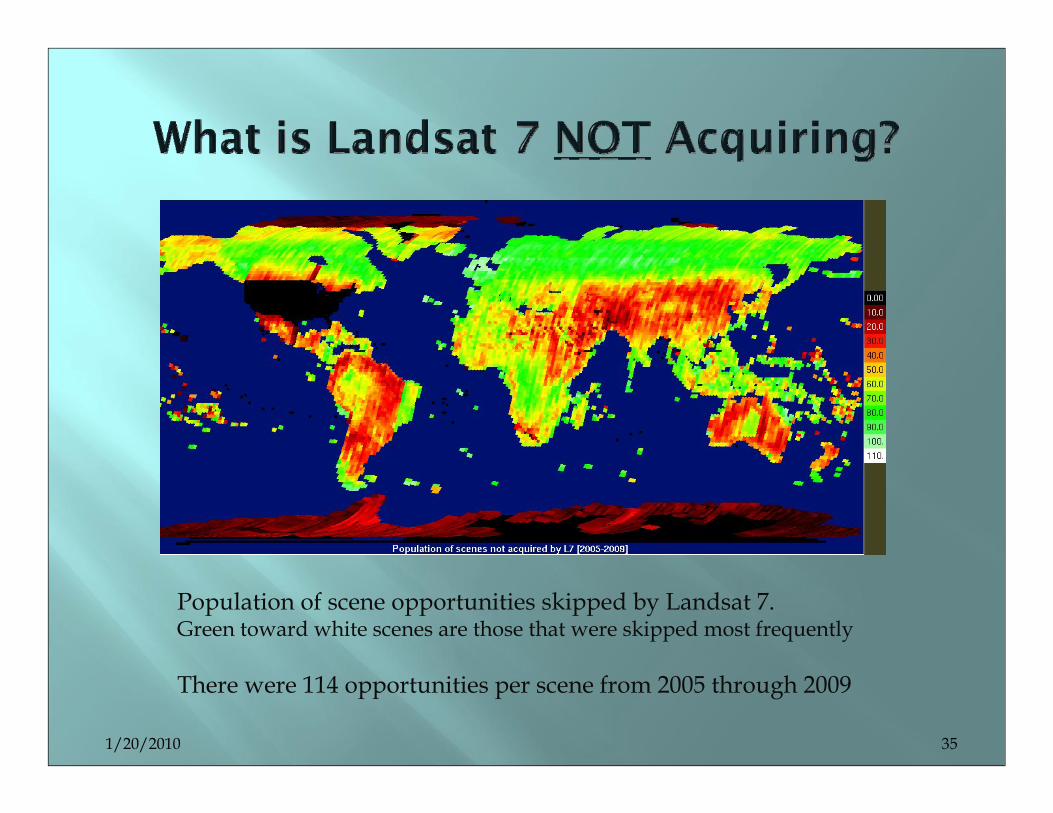
Population of scene opportunities skipped by Landsat 7.Green toward white scenes are those that were skipped most frequently
There were 114 opportunities per scene from 2005 through 2009
1/20/2010 35

This map shows the ratio of clear scenes collected by L7 with respect to the population of all candidate scenes (judgement of "clear" is based on MODIS CF < 10)
1/20/2010 36
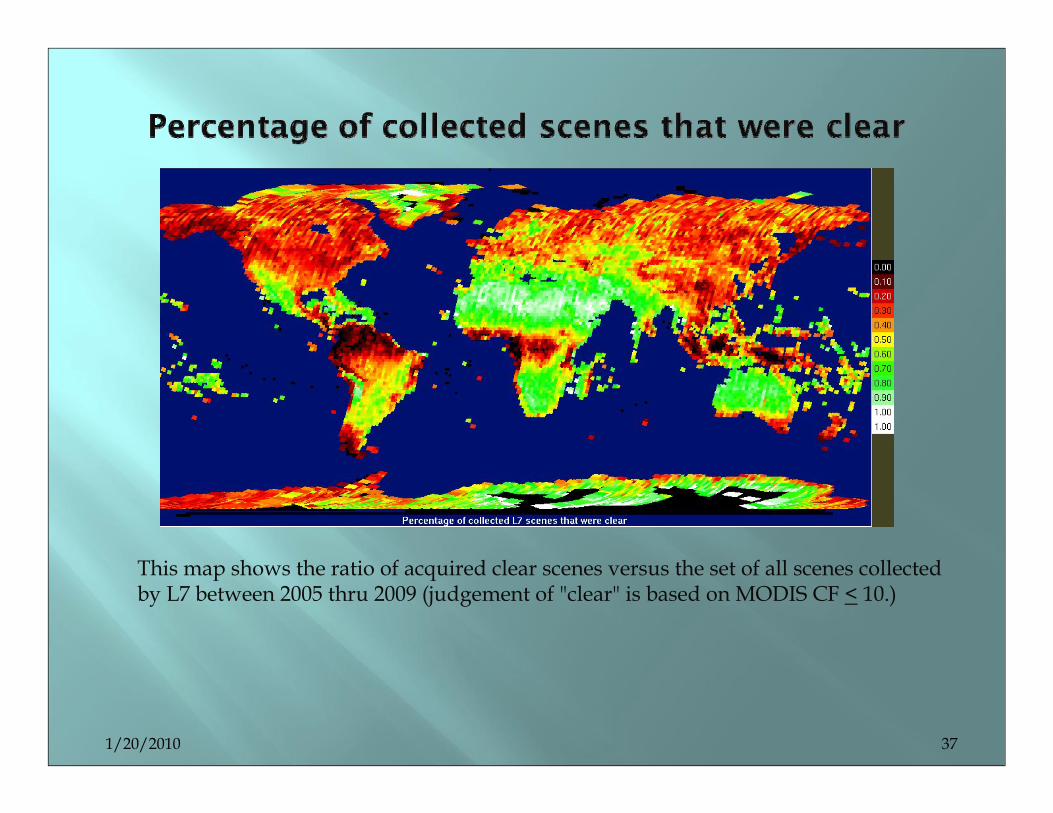
This map shows the ratio of acquired clear scenes versus the set of all scenes collected by L7 between 2005 thru 2009 (judgement of "clear" is based on MODIS CF < 10.)
1/20/2010 37
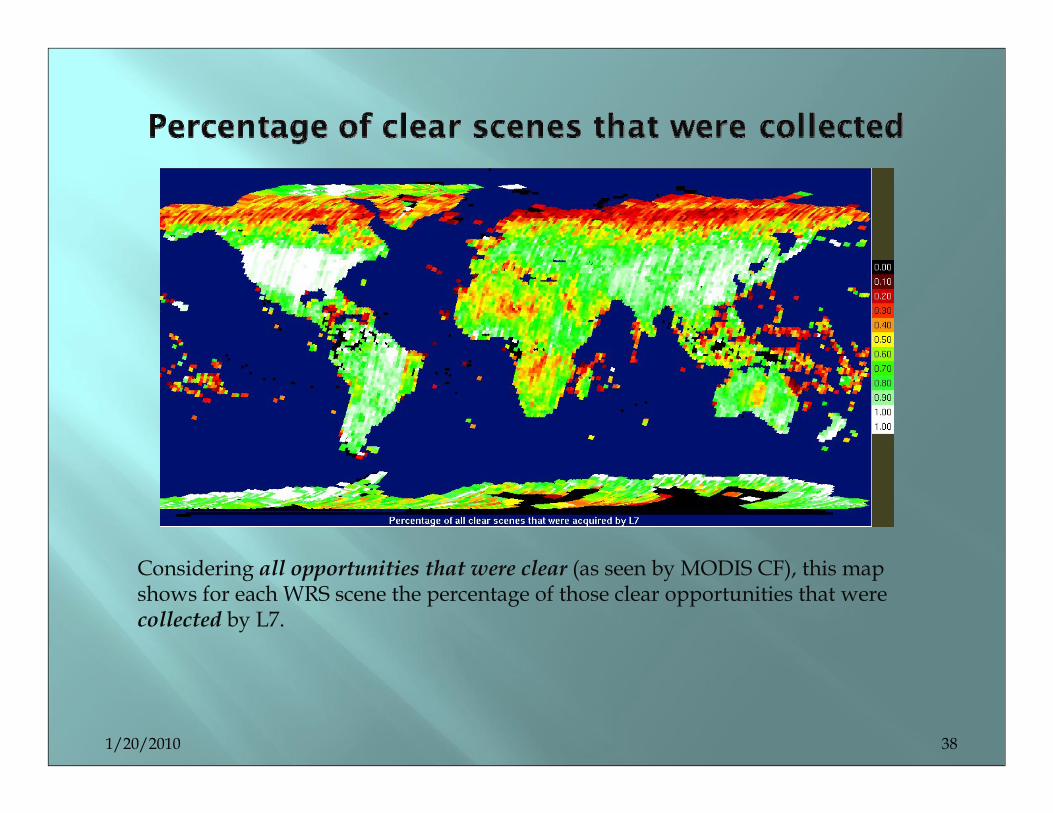
Considering all opportunities that were clear (as seen by MODIS CF), this map shows for each WRS scene the percentage of those clear opportunities that were collected by L7.
1/20/2010 38

1/20/2010 39