JMA / WMO Workshop on Quality Management in Surface ...
197
JMA / WMO Workshop on Quality Management in Surface, Climate and Upper-air Observations in RA II (Asia) Tokyo, Japan 27-30 July 2010 Japan Meteorological Agency
Transcript of JMA / WMO Workshop on Quality Management in Surface ...

JMA / WMO Workshop on Quality Management in Surface, Climate and Upper-air Observations in RA II (Asia)
Tokyo, Japan
27-30 July 2010
Japan Meteorological Agency


JMA / WMO Workshop on Quality Management in Surface, Climate and Upper-air Observations in RA II (Asia)
Tokyo, Japan
27-30 July 2010
Contents
AGENDA ...................................................................................................................................... 1
LIST OF PARTICIPANTS ............................................................................................................. 5
ABSTRACTS OF LECTURES AND COUNTRY REPORT PRESENTATIONS ............................ 9
SESSION 1: USER REQUIREMENTS .............................................................................................. 9 Climate Services Perspective ............................................................................................... 9 The importance of the Data Quality Controlfor the Disaster Prevention and Mitigation. ....... 9 The Impact of Observational data on Numerical Weather Prediction ................................. 10
SESSION 2: STANDARDIZATION .................................................................................................. 10 WMO/CIMO Perspective ..................................................................................................... 10 Siting Classification for Surface Observing Stations on Land ............................................. 12
SESSION 3: SITING AND METADATA ............................................................................................ 13 Current state and development potential of Roshydromet surface meteorological, upper air and climate monitoring networks ......................................................................................... 13 UPDATED STATION DOCUMENTATION AND METADATA PILOT CASE: PHETCHABURI OBSERVATION STATION ................................................................................................... 13
SESSION 4: SENSORS/INSTRUMENTS ........................................................................................ 13 Status of Meteorological Network, Observations and Data Management In Lao P D R 13 Observation network of Mongolia ........................................................................................ 14 Meteorological Observations and Instrumental Systems for Meteorological services in Sri Lanka .................................................................................................................................. 15 One of issues related to replacement the manual observational weather stations with automated ones. ................................................................................................................. 15
SESSION 5: QA/QC .................................................................................................................. 16 An Integrated Meteorological Data Quality Assurance System for operation of the Automatic Weather Station (AWS) Network in Hong Kong .................................................................. 16 Quality Assurance and Quality Control of Surface Observations in JMA ............................ 16 Kazhydromet is National Hydrometeorological Service REPUBLIC OF KAZAKHSTAN. .... 17
SESSION 6: TRAINING ............................................................................................................... 17 Training Facilities in India Meteorological Department ........................................................ 17
SESSION 7: RIC-TSUKUBA AND UPPER AIR OBSERVATIONS ........................................................ 18 Overview of MIC .................................................................................................................. 18 Upper-air sounding network of JMA .................................................................................... 18 Upper-air observation at Tateno (Aerological Observatory) ................................................ 19 Lecture on fundamentals of wind profiling radar and applications in measuring wind and temperature profiling ........................................................................................................... 20
LECTURES ................................................................................................................................ 21
CLIMATE SERVICES PERSPECTIVE ............................................................................................. 21 THE IMPORTANCE OF DATA QUALITY CONTROL IN DISASTER PREVENTION AND MITIGATION ......... 25 THE IMPACT OF OBSERVATIONAL DATA ON NUMERICAL WEATHER PREDICTION ............................ 33 WMO/CIMO PERSPECTIVE ...................................................................................................... 38 SITING CLASSIFICATION FOR SURFACE OBSERVING STATIONS ON LAND ...................................... 47

COUNTRY REPORTS ............................................................................................................... 67
REPORT ON THE STATUS OF WEATHER OBSERVATION IN CAMBODIA ........................................... 67 QUALITY MANAGEMENT IN SURFACE, CLIMATE AND UPPER-AIR OBSERVATIONS IN CHINA ................................................................................................................................................ 75 COUNTRY REPORT OF HONG KONG, CHINA ............................................................................... 87 COUNTRY REPORT .............................................................................................................. 92 COUNTRY REPORT FOR JAPAN .................................................................................................. 99 KAZHYDROMET – NATIONAL HYDROMETEOROLOGICAL SERVICE OF REPUBLIC
KAZAKHSTAN ...................................................................................................................... 109 STATUS OF METEOROLOGICAL NETWORK, OBSERVATIONS AND DATA MANAGEMENT IN LAO P D R ............................................................................................................................................... 112 OBSERVATION NETWORK OF MONGOLIA .................................................................................... 118 PERSPECTIVE OF DEPARTMENT OF HYDROLOGY AND METEOROLOGY (DHM) IN NEPAL ............. 123 SURFACE, CLIMATE AND UPPERAIR OBSERVATIONS SYSTEN IN PAKISTAN .............. 130 PLANNING AND SITUATION OF THE METEOROLOGICAL OBSERVATION IN THE REPUBLIC OF KOREA
.............................................................................................................................................. 138 UPPER-AIR OBSERVATIONS IN THE RUSSIAN FEDERATION ........................................................ 150 METEOROLOGICAL OBSERVATIONS AND INSTRUMENTAL SYSTEMS FOR METEOROLOGICAL SERVICES
IN SRI LANKA .......................................................................................................................... 161 METEORLOGICAL OBSERVATIONS IN THAILAND ........................................................... 170 OBSERVATIONAL HYDROMETEOROLOGICAL NETWORK IN UZBEKISTAN: ...................................... 175 CURRENT STATUS AND FUTURE PLAN OF SURFACE, CLIMATE AND UPPER-AIR OBSERVATIONS OF NATIONAL HYDRO-METEOROLOGICAL SERVICE OF VIET NAM .............................................................................................................................................. 185

1
JMA / WMO Workshop on Quality Management in Surface,
Climate and Upper-air Observations in RA II (Asia)
Tokyo, Japan, 27-30 July 2010
Agenda Day 1, Tuesday 27 July Opening 09:30 – 10:00
Welcome address Yuji Kano
Director-General of the Observations Department, JMA Opening address
Miroslav Ondras Chief, WMO Observing Systems Division, Observing and Information Systems Department, World Meteorological Organization
Self introduction of Participants Organization for the workshop
Hakaru Mizuno (JMA)
Session 1: User Requirements 10:00 – 12:30 10:00 – 10:45 Climate Services Perspective
Takafumi Umeda (Climate Prediction Division, JMA) 10:45 – 11:00 Coffee break 11:00 – 11:45 The importance of the Data Quality Control
In Disaster Prevention and Mitigation. Kazuhiko Nagata (Forecast Division, JMA)
11:45 – 12:30 The Impact of Observational data on Numerical Weather Prediction Hirokatsu Onoda (NWP Division, JMA)
Group Picture 12:40 – 14:00 Lunch Session 2: Standardization 14:00 – 16:45 14:00 – 15:00 WMO/CIMO Perspective Miroslav Ondras (WMO/OBS) 15:00 – 16:00 Siting Classification for Surface Observing Stations on Land
Michel Leroy (Meteo France) 16:00 – 16:15 Coffee break

2
16:15 – 16:45 Lecture on the RIC-Beijing (Regional Instrument Centre) Kejun Wu (CMA) Session 3: Siting and metadata 16:45 – 18:25 16:45 – 17:05 Survey results
Kotaro Bessho (JMA) 17:05 – 17:25 Current state and development potential of Roshydromet surface
meteorological, upper air and climate monitoring networks Oleg M.Pokrovsky (Russian Federation) 17:25 – 17:45 Updated Station Documentation and Metadata Pilot Case: Phetchaburi
Observation Station Songkran Agsorn (Thailand)
17:45 – 18:05 Report on The Status of Weather Observation in Cambodia Peou Phalla (Cambidia)
18:05 – 18:25 Perspective of Department of Hydrology and Meteorology (DHM) in
Nepal Rajendra Prasad Shrestha (Nepal)
19:00 – Workshop Reception Day 2, Wednesday 28 July Session 4: Sensors/Instruments 09:30 – 12:10 09:30 – 10:30 Planning and Situation of the Meteorological Observation in The
Republic of Korea Hyuk Je Lee (Republic of Korea)
10:30 – 10:50 Status of Meteorological Network, Observations and Data Management Singthong Pathoummady (Lao People's Democratic Republic)
10:50 – 11:10 Coffee break 11:10 – 11:30 Observation network of Mongolia
Norov Battur (Mongolia) 11:30 – 11:50 Meteorological Observations and Instrumental Systems for
Meteorological services in Sri Lanka Dayananda Malavige Don (Sri Lanka)
11:50 – 12:10 One of issues related to replacement the manual observational weather stations with automated ones
Merkushkin Aleksandr (Uzbekistan) 12:10 – 13:40 Lunch Session 5: QA/QC 13:40 – 15:40 13:40 – 14:00 Survey results
Kotaro Bessho (JMA)
3
14:00 – 14:30 An Integrated Meteorological Data Quality Assurance System for operation of the Automatic Weather Station (AWS) Network in Hong Kong
Hing-yim Mok (Hong Kong, China) 14:30 – 15:00 Quality Assurance and Quality Control of Surface Observations in JMA
Hakaru Mizuno (JMA) 15:00 – 15:20 Kazhydromet - National Hydrometeorological Service Republic of
Kazakhstan Zainuldinova Dinara (Kazakhstan)
15:20 – 15:40 Current Status and Future Plan of Surface, Climate and Upper-air Observations of National Hydro-Meteorological Service of Viet Nam Nguyen Dinh Luong (Viet Nam)
15:40 – 16:00 Coffee break Session 6: Training 16:00 – 18:00 16:00 – 16:10 Survey results
Kotaro Bessho (JMA) 16:10 – 16:40 Training Facilities in India Meteorological Department
Mahesh Kumar GUPTA (India) 16:40 – 17:00 Surface, Climate and Upper-air Observations and Training System in
Pakistan Muhammad Touseef ALAM (Pakistan)
17:00 – 17:20 Country report for Bangladesh Shamsuddin Ahmed (Bangladesh) 17:20 – 17:40 Country report for Kyrgyzstan Svetlana Vandasheva (Kyrgyzstan) 17:40 – 18:00 Country report for Kuwait Essa Ramadan Mohammad (Kuwait) 18:00 – 18:20 QUALITY MANAGEMENT IN SURFACE, CLIMATE AND UPPER-AIR
OBSERVATIONS IN CHINA Zhang Hongzheng (China) 18:05 – Working group meeting for draft summary Day 3, Thursday 29 July Session 7: RIC-Tsukuba and Upper air Observations Meteorological Instruments Center(MIC) 10:00 – 10:20 Overview of MIC Toshihiko Kobayashi (MIC) 10:20 – 11:00 Reserch and development at MIC Hiroshi Kawamura, Mariko Kumamoto (MIC) 11:00 – 12:00 Technical tour of Calibration rooms MIC staffs 12:00 – 13:10 Lunch Aerological Observatory 13:10 – 13:35 Upper-air observation network in Japan
Kenji Akaeda (JMA) 13:35 – 13:55 Upper-air observation in Tateno

4
Hiroatu Maki (Aerological Observatory) 13:55 – 14:10 Radiation observation
Staffs of Aerological Observatory 14:10 – 14:20 Observation of the Lower Atmosphere
Staffs of Aerological Observatory 14:20 – 14:40 Ozonesonde observation
Staffs of Aerological Observatory 14:40 – 15:10 Coffee break Meteorological Research Institute (MRI) 15:10 – 15:20 Overview of MRI
Hiroshi Takahashi (MRI) 15:20 – 15:55 Lecture and tour of wind profiler
Ahoro Adachi (MRI) 16:00 – 16:30 Lecture and tour of wind tunnel
Shinji Nakagawa (MRI) Day 4, Friday 30 July Session 8: Summary 09:30 – 12:15 09:30 – 10:30 Technical tour of JMA Headquarters
Observational operation center Forecasting operation center Wind tunnel facility
JMA staffs
10:30 – 10:45 Coffee break 10:45 – 12:15 Outcomes of the sessions
Adoption of the report Hakaru Mizuno (JMA)
12:15 Closure of the Workshop

5
JMA / WMO Workshop on Quality Management in Surface, Climate and Upper-air Observations in RA II (Asia)
Tokyo, Japan, 27-30 July 2010
LIST OF PARTICIPANTS
LECTURERS Miroslav Ondras Chief, WMO Observing Systems Division,
Observing and Information Systems Department, WMO Chemin des Montagnais 53,1214 Vernier,Switzerland E-Mail: [email protected]
Michel Leroy Chief ,Surface Observation Department, Meteo-France, DSO/QMR/CEP
7 Rue Teisserenc-de-Bort,B.P. 202, F-78195 TRAPPES CEDEX,France E-Mail: [email protected]
Hirokatsu Onoda Scientific Officer,Numerical Prediction Division,
Forecast Department, JMA E-Mail: [email protected]
Kazuhiko Nagata Scientific Officer,Forecast Division,
Forecast Department, JMA E-Mail: [email protected]
Takafumi Umeda Senior Scientific Officer,Climate Prediction Division,
Global Environment and Marine Department, JMA E-Mail: [email protected]
PARTICIPANTS Bangladesh Shamsuddin Ahmed Assistant Director,Bangladesh Meteorological Department
House No-704, 3rd Floor, Road No-24, C.D.A.Agargaon,Dhaka-1207 E-Mail: [email protected]
Cambodia Peou Phalla Official of Researching and Forecasting Office,
Department of Meteorology, Ministry of Water Resources and Meteorology #47,Preah Norodom BLvd,Phnom Penh,Cambodia E-Mail: [email protected]
China Zhaolin MENG Meteorological Observation Center (MOC),CMA
No.46, Zhongguancun South Street, Beijing 100081,China E-Mail: [email protected]
Kejun WU Meteorological Observation Center (MOC),CMA
No.46, Zhongguancun South Street, Beijing 100081,China E-Mail: [email protected]

6
Zhang Hongzheng National Meteorological Information Centre(NMIC),CMA No.46 South Road of Zhongguancun, Beijing, 100081, P.R.China E-Mail: [email protected]
Hong Kong, China Hing-yim Mok Senior Scientific Officer,
Climatological Information Services,Hong Kong Observatory 134A,Nathan Road,Kowloon,Hong Kong E-Mail: [email protected]
India Mahesh Kumar Gupta Director of Surface Instrument Division,
India Meteorological Department Scientist-e,Instrument Division,IMD,Pune-4110055 E-Mail: [email protected]
Kazakhstan Zainuldinova Dinara RSE Kazhydroment
11/1 Orynbor str,Astana,010000 E-Mail: [email protected]
Kuwait Essa Ramadan Mohammad Superintendent of Stations and Upper Air,
Kuwait Meteorological Department POBOX:17 SAFAT 13001 KUWAIT E-Mail: [email protected]
Kyrgyzstan Svetlana Vandasheva Head, Department on Meteorology and Climatology,
Agency on Hydrometeorology under Ministry of emergency situations of the Kyrgyzstan Republic 1 Kerimbekova str, Bishkek 720017 E-Mail: [email protected]
Lao People’s Democratic Republic Singthong Pathoummady Director of Meteorological Network Division,
Department of Meteorology and Hydrology(DMH) Souphanouvong Avenue,Ban Akard, Sikhottabong District,Vientiane Capital,Lao PDR E-Mail: [email protected]
Mongolia Norov Battur National Agency for Meteorology and Environment Monitoring of
Mongolia Juulchny Gudamj-5. Ulaanbaatar-210646 Mongolia E-Mail: [email protected]
Nepal Rajendra Prasad Shrestha Meteorological Forecasting Division,
Department of Hydrology and Meteorology Tribhuvan International Airport,Kathmandu,Nepal E-Mail: [email protected]
Pakistan Muhammad Touseef ALAM Director-General,Regional Meteorological Centre,

7
Pakistan Meteorological Department, Regional Meteorological Centre Karach Airport,Pakistan E-Mail: [email protected]
Republic of Korea Hyuk Je Lee Senior Scientific Officer of Observation Policy Division Observation Policy Division, Observation Infrastructure Bureau,
Korea Meteorological Administration, 45 Gisangcheong-Gil Dongjak-Gu Seoul, 156-720, The Republic of Korea E-Mail: [email protected]
Russian Federation Oleg Pokrovsky Main Geophysical Observatory,RosHydroMet
Main Geophysical Observatory,Karbyshev str.7, 194021, St. ,Petersburg, Russia E-Mail: [email protected]
Sri Lanka Dayananda Malavige Don Deputy Director of Department of Meteorology
No.383,Department of Meteorology, Bauddhaloka Mawatha,Colombo 07,Sri Lanka E-Mail: [email protected]
Thailand Songkran Agsorn Director of Meteorologiacl Obseravtion Bureau,
Thai Meteorological Department 4353 Sukhumvit Road,Bangna,Bangkok 10260 Thailand E-Mail: [email protected]
Uzbekistan Aleksandr Merkushkin Deputy Chief,
Centre of Hydrometeorological Service at the Cabinet of Ministers of Republic of Uzbekistan(Uzhydromet) 71 K,Makhsumov str,100052,Tashkent,Uzbekistan E-Mail: [email protected]
Viet Nam Nguyen Dinh Luong Deputy Director of Centre for
Hydrometeorological & Environmental Station Network National Hydro-Meteorological Service of Virt nam 62 Nguyen Chi Thanh Str., Dong Da, Ha Noi, Viet nam
E-Mail: [email protected] Japan Meteorological Agency
1-3-4, Otemachi, Chiyoda-ku,Tokyo 100-8122,Japan Kunio Sakurai Director-General Yuji Kano Director-General of the Observations Department
Administration Division/Observations Department Hakaru Mizuno Senior Coordinator for Observation Networks
Administration Division,Observation Department,JMA 1-3-4, Otemachi, Chiyoda-ku,Tokyo 100-8122,Japan

8
E-Mail: [email protected] Akira Yamamoto Senior Scientific Officer Masato Fukuda Senior Scientific Officer Jinji Koike Senior Scientific Officer,Office of Data and Information Services
Observations Division/Observations Department Kenji Akaeda Director E-Mail: [email protected] Yoshihisa Kimata deputy Director Kotaro Bessho Coordinator for Observation Technique Hidehiko Isobe deputy Director,Office of Statistics Toshihiko Kobayashi Head of Meteorological Instruments Center
E-Mail: [email protected] Kouichi Nakashima Scientific Officer, Meteorological Instruments Center
Planning Division/Administration Department Naohisa Koide Scientific Officer,Office of International Affairs
Administration Division/Forecast Department Osamu Hamada Senior Scientific Officer
Administration Division/Global Environment and Marine Department Satoshi Ogawa Scientific Officer
Meteorological Research Institute Fumiaki Fujibe Head ,The 3rd Research Laboratory,Forecast Research Department
Aerological Observatory Hiroatu Maki Director of the Aerological Observatory E-Mail: [email protected]
Meteorological College Nobuyuki Kinoshita Associate Professor Observer Japan Association of Meteorological Instrument Engineering 3-17, Kandanishikicho, Chiyoda-ku, Tokyo 101-0054,Japan Kousuke Hashimoto Acting Leader Takashi Iizaka Executive Board Member (EKO Instruments Co., Ltd.) Chiaki Kato Executive Board Member (EKO Instruments Co., Ltd.) Osamu Sakamoto Executive Board Bember (EKO Instruments Co., Ltd.) Yoshiki Ito Board Member (Sonic Corporation) Naoki Kaneko Member (Meisei Electric Co., Ltd.) Japan International Cooperation Agency Nibancho Center Building, 5-25 Niban-cho, Chiyoda-ku, Tokyo 102-8012,Japan
Water Resources and Disaster Management Group, Global Environment Department
Wataru Ono Deputy Assistant Director, Disaster Management Division 2 Taichi Minamitani Disaster Management Division 2

9
Abstracts of lectures and country report presentations Session 1: User Requirements
Climate Services Perspective
Takafumi Umeda (Climate Prediction Division,Japan Meteorological Agency)
JMA is monitoring global surface climate in order to detect climate variability and change (e.g. extreme climate events, global warming). JMA produces weekly, monthly, seasonal, and annual reports on temperature, precipitation and hazardous climatic events (flood / drought / tropical cyclone) by using SYNOP and CLIMAT data collected through GTS. Also, JMA calculates the long-term trend of annual global average temperature to get hold of climatic change caused by global warming using land surface data (CLIMAT, GHCN-Monthly) and the result of sea surface temperature analysis (COBE-SST). JMA is operating a climate data assimilation system (JRA-JCDAS) based on satellite, upper air (TEMP), surface (SYNOP), and ship data. By using JRA-JCDAS, COBE-SST, CLIMAT reports, and satellite observations, JMA provides diagnosis information on the climate system as background of extreme climate events. Weather and climate reports for stations should be produced and circulated through GTS more certainly for the world-wide monitoring of extreme events. More historical datasets are necessary for a re-analysis over a longer time period (e.g. JRA-55). Accurate measurements are also important especially to detect variability and change of global average temperature precisely.
The importance of the Data Quality Controlfor the Disaster Prevention and Mitigation.
Kazuhiko Nagata
(Forecast Division, Japan Meteorological Agency) Japan often experiences natural disasters such as sediment disasters, snow disasters, wave disasters, storm surge disasters, earthquakes, tsunamis and so on. In recent years, these disasters caused about 100 deaths and missing people. The most of these people were caused by gust, flood and snow disasters.
If hazardous weather conditions are expected, JMA delivers a variety of plain messages including warnings, advisories and bulletins to the general public and disaster prevention authorities. Warnings and advisories for appropriate municipalities are issued whenever forecasters suppose that weather elements, such as the amount of rainfall, wind speed, wave height, tide level and so on, will meet criteria. Concerning the heavy rain warning, advisory and flood warning, advisory, which
are information related to sediment disasters, flood and inundation, the criteria of these warnings and advisories are the amount of rainfall, “soil water index”, and “runoff index”. The “soil water index” shows the risk of sediment disaster and the “runoff index” shows the risk of flood. An accurate rainfall grid data are needed for these indices.
Instruments measuring the amount of rainfall are raingauges and radars.

10
Raingauges can measure the actual amount of rainfall, but they can observe the amount of rainfall at only single points. On the other hand, radars can observe large areas with higher spatial resolution than the raingauge network, but they may produce readings different from rainfall observed on the ground, as it does not measure the amount of rainfall directly.
JMA uses “Radar/Raingauge-Analyzed Precipitation” for the forecast operation. The “Radar/Raingauge-Analyzed Precipitation”, which is calibrated radars data with raingauges data, depicts rainfall with high quantitative accuracy.
If radars and raingauges observe anomalous values, they contaminate the “Radar/Raingauge-Analyzed Precipitation” and they could obstruct the forecast operation.
In this presentation, I will show the sources of the anomalous value of the radars and raingauges and their impacts on the “Radar/Raingauge-Analyzed Precipitation” taking an example to show the importance the Quality control of observational data.
The Impact of Observational data on Numerical Weather Prediction
Hirokatsu Onoda (Numerical Prediction Division, Japan Meteorological Agency)
A lot of observational data is assimilated in operational NWP system in JMA. In recent years, remote sensing data such as Satellite is increasing and dominates about 80% of total observational data. The data remaining 20% conventional observation such as SYNOP or Radiosonde, however, still serve as an important role for the NWP system. We show the impact of each observation on the NWP system and appeal how conventional observation is important.
JMA perform quality control (QC) about observational data operationally, and the QC plays an essential part to improve the initial value and forecast field. In some cases, we find the observational data includes false reports. We show these examples and emphasize substantiality of the observation network and the importance of its maintenance.
Finally, we introduce “the report on the quality of land surface observations in RA-II” that JMA publishes every six months as the lead center and “monthly global data monitoring report”. By utilizing these documents effectively, we can maintain better observation in future. Session 2: Standardization
WMO/CIMO Perspective
Dr Miroslav Ondráš (WMO Observing Systems Division)
One of the purposes of WMO, as described in the WMO Convention, Part II, Article 2, is to facilitate worldwide cooperation in the establishment of networks of stations for the making of meteorological observations as well as hydrological and other geophysical observations related to meteorology, and to promote standardization of meteorological and related observations and to ensure the
11
uniform publication of observations and statistics. Eight technical commissions of the World Meteorological Organization were established by WMO Congress and their structure and Terms of Reference are described in Annex III to the General Regulation of WMO. The General Terms of Reference of technical commissions describe their responsibility for the development of international standards. Within the terms of responsibility and within the provisions of the General Regulations, each technical commission shall, among others, “Develop, for consideration by the Executive Council and Congress, proposed international standards for methods, procedures, techniques and practices in meteorology and operational hydrology including, in particular, the relevant parts of the Technical Regulations, guides and manuals”. WMO Congress and the Executive Council adopt Regulatory Materials that define meteorological practices and procedures to be followed by Members. In this respect, the Technical Regulations of the World Meteorological Organization are determined by Congress in accordance with Article 8(d) of the Convention. Their purpose of is to (a) Facilitate co-operation in meteorology and hydrology between Members; (b) Meet, in the most effective manner, specific needs in the various fields of application of meteorology and operational hydrology in the international sphere; and (c) Ensure adequate uniformity and standardization in the practices and procedures employed in achieving (a) and (b) above. The WMO Technical Regulations (WMO-No. 49) is a mandatory publication and has four volumes and six annexes:
(a) Volume I: General Meteorological Standards & Recommended Practices, (b) Volume II: Meteorological Service for International Air navigation, (c) Volume III: Hydrology, (d) Volume IV: Quality Management (approved by EC-LXII following a
proposal of Inter-Commission Task Team on WMO Quality Management Framework ICTT-QMF),
(a) Annex I: International Cloud Atlas (WMO-No. 407), Volume I - Manual
on the observations of clouds and other meteors, (b) Annex II: Manual on Codes (WMO-No. 306), (c) Annex III: Manual on the Global Telecommunication System (WMO-No.
386), (d) Annex IV: Manual on the Global Data-processing System
(WMO-No.485), (e) Annex V: Manual on the Global Observing System (WMO-No. 544), (f) Annex VI: Manual on Marine Meteorological Services (WMO-No. 558).
While WMO Manuals describe standard practices and procedures, a number of WMO Guides have been developed to describe recommended practices and procedures. WMO has concluded cooperation agreements and working arrangements with international standardization bodies, such as International Standardization Organization (ISO) and International Committee for Weights and Measures (CIPM). The standardization effort of WMO has lead to recognition of WMO as an International Standardization Body by ISO.

12
Details of CBS and CIMO standardization efforts are provided based on the above mandate as well as in the context of WMO high priority areas, such as the WMO Integrated Global Observing System and its effort to further standardize practices relevant to instrument and methods of observation, exchange of data and metadata, and end product quality. Examples of standard practices and recommended procedure are presented with a view to guide possible improvement in quality of surface and upper-air observations in the Region II (Asia) with the emphasis on quality assurance and quality control of observational data. The role of regional bodies, such as the Regional Instrument Centres, in quality management is brought to the attention of participants and the Coordination Group of the RA II Pilot project to enhance the availability and quality management support for NMHSs in surface, climate and upper-air observations. Several decision of the Fifteenth WMO Congress are also brought to the attention of participants of the Workshop, especially a request to NMSs to quality control on-site observations and to ensure the traceability of measurements to recognized world standards approved for the use of WMO Members.
Siting Classification for Surface Observing Stations on Land
Michel Leroy, Météo-France [email protected]
Several factors have an influence on the « quality » of a meteorological measurement: the intrinsic characteristics of sensors or measurement methods; the maintenance needed to maintain the system in nominal conditions; the site representiveness. Environmental conditions on a site may generate measurement errors larger than the uncertainty of the instrument itself, whilst more attention is usually being given to the instrument itself. WMO/CIMO has clear recommendations about siting and exposure of instruments. But they are not always possible to follow and this is scarcely documented. Several years ago, Météo-France defined a siting classification for wind, temperature, precipitation and solar radiation, ranging from 1 (WMO recommendations) to 5 (bad environment to be representative). It has been applied and proved to be efficient both to document the siting and to improve it, by rating it. Recently, an expert meeting was organized by WMO, to cross experience on the subject and to define a siting classification for Surface Observation at Land. This classification will be proposed for validation by the next CIMO-XV in September 2010. Considering also the various metrological characteristics of the equipment used in different surface networks, Météo-France defined also another classification, called "maintained performance classification", including the uncertainty of the instrument and the organization of preventive maintenance and calibration. This complementary classification was also discussed within the expert team of WMO, but was not considered enough mature to be proposed to CIMO for

13
validation. The principles of these two classifications will be presented, along with the experience of Météo-France in applying them. Session 3: Siting and metadata Russian Federation Current state and development potential of Roshydromet surface meteorological,
upper air and climate monitoring networks
Oleg M.Pokrovsky (Main Geophysical Observatory, Roshydromet, Russian Federation)
Current state of surface meteorological, upper air and climate monitoring networks is presented. A set of observing network maps provides the survey information on coverage and density of observing stations in different areas of Russia. Time and frequency of observations at various stations is another issue of report. Maps of closed stations after nineties years of last century is considered as a set of potential locations to establish new observing sites with automatic meteorological complexes. New scenarios on optimal design and redesign of networks configurations are considered as a potential to extend existed networks in sparse data areas (e.g., Arctic and North-East domains). Thailand
UPDATED STATION DOCUMENTATION AND METADATA PILOT CASE: PHETCHABURI OBSERVATION STATION
SONGKRAN AGSORN, Ph.D.
Director of Meteorological Observation Bureau
Meteorological Department 4353 Sukhumvit Rd, Bangna
Bangkok, THAILAND Thai Meteorological Department plans to update and revise the station information for more useful usages of meteorological data. Phetchaburi Observing Station (48465). Station information and additional metadata are surveyed and collected. The data are to be formulated as a standardized Thai observation station. In addition, data in the representative area are included in the study. Further statistics for the station will be added. Session 4: Sensors/Instruments Lao People’s Democratic Republic
Status of Meteorological Network, Observations and Data Management In Lao P D R
Singthong Pathoummady
(Department of Meteorology and Hydrology)
14
Lao PDR started operational weather observation since the year 1950 in some large cities and was registered as a member of WMO in 1955. In this presentation, the status of meteorological network and relating operational weather observation tasks as well as Data archiving and data quality will be discussed. Unfortunately under the least developed country status, there has not been much improvement or development in the field of meteorology during the past decades. The establishment of meteorological stations has been slightly increased and extended in most of large cities in the last 10 years. All instruments are analogue and manual types as a result, these furnished all manned stations. These existing deteriorated instruments have no means to get calibration due to lack of standard calibrating tools. This situation leads to poor data quality even though data are preliminary checked manually prior to be archived in forms of hard copies and digital recorded devices. In order to cope with the current regional or global commitment on data quality assurance and data quality control, DMH has been striving to get improved its capability, therefore has formulated strategic and implementation plan by participating in capacity building of some key projects , such as the WMO technical supported and World Bank funded, organized by UNISDR, under the project titled ”Global facility on Disaster Risk Reduction (GFDRR Track 1) » , the component for Strengthening Meteorological and Hydrological Services in Southeast Asia” (5 countries). On the other hand DMH has been involved in the implementation of the Mekong-Integrated Water Resources Management Programme (M-IWRMP) and the Information and knowledge Management Programme (IKMP) of the Mekong River Commission (MRC). Mongolia
Observation network of Mongolia
Battur. N (MONGOLIA)
Meteorological and Hydrological Services of Mongolia are functioning
officially since 1936 when the first meteorological observation stations were established in the country.
The National Agency for Meteorology and Environment Monitoring /NAMEM/, is the government’s implementing agency.
The agency provides information of weather forecasting, hydro-meteorology and environmental condition to governmental and private organizations, coordinates all hydro-meteorological observation networks of Mongolia.
Currently there are 130 meteorological stations, 186 meteorological posts, 3 upper-air stations in observation network of NAMEM.
The observed variables in all meteorological stations: Air temperature, surface soil temperature, atmospheric pressure, humidity, velocity and direction of wind, precipitation /amount and intensity/, cloud amount and type, visibility, weather present and past, snow depth and density.
Some meteorological stations observe solar radiation, sunshine duration, deep soil temperature, soil moisture, evaporation except above stated variables.
All meteorological stations are making synoptic and climate observations 8 times per day.

15
National Meteorological Telecommunication Network has two GTS lines with WMO Regional Meteorological Centers in Novosibirsk, Russia and Beijing, China and twenty local lines with local centers through VSAT.
There are about 60 automatic meteorological station in our observation network, 30 of the stations are installed in 2008. Types of automatic meteorological stations in our observation network: MAWS301, SK4100, CAMS630, QLI50.
There is a need to improve meteorological observation networks of the country. Our main goal is:
- improve skills of meteorologists and technicians - Improve quality of observational data. - Improve observational technologies and techniques.
Sri Lanka
Meteorological Observations and Instrumental Systems for Meteorological services in Sri Lanka
M.D. Dayananda
(Department of Meteorology, Sri Lanka)
Department of Meteorology, Sri Lanka having 20 Meteorological stations, 12 of them are operational round -the-clock and doing observation at every three hour while other stations doing observation during the day time including 0000 & 1500 UTC. Only Colombo station is doing Radar/Radiosond observation while Pilot balloon observations are done at three stations
Quality controlling of data is done subjectively at the Head office checking are carried out ; Check for coding errors, Check for physical reasonableness of observation, Check against it’s neighbours, spatial and temporal consistency, Check against self recording charts. The Quality managment system in Sri Lanka is not in WMO standard as such the Department of Meteorology is seeking the ways to improve the QMS. Uzbekistan One of issues related to replacement the manual observational weather stations
with automated ones.
Aleksandr Merkushkin (Uzhydromet, Uzbekistan)
Critical water management within the five central Asian republics (CAR) requires access to reliable climate and hydrological data. As part of the effort to strengthen trans-boundary water resources management within the region, the US Agency for International Development’s (USAID) Natural Resources Management Program (NRMP) funded a pilot automated climate data collection network. Sixteen automated weather stations (AWS) were installed within Tajikistan, Kyrgyzstan, Kazakhstan, Uzbekistan and Turkmenistan during the period from February 2002 to September 2003. . Ease of use, low operational cost, suitability for remote unmanned operation, proven reliable collection of high quality data and capability to electronically store and transfer data are the

16
primary reasons for utilizing automated climate monitoring instrumentation. Most of these stations use the USAID sponsored meteor burst radio communications to provide real time data telemetry and acquisition. This automated data collection and telemetry system was the first of its kind deployed within the region. The national Hydromet service (NHMS) within the CAR had little experience with this technology. Two key objectives of the program was to demonstrate the utility for remote automated deployment as well as allow for simultaneous operation with familiar manual monitoring. Eight of the stations were installed at operational climate stations that were staffed by NHMS observers. The homogeneity of accumulated long term data series by manual measurements going to be replenished with data come from automated weather stations is not to be negatively affected. This рарer provides the results of the comparative analysis from some of the simultaneous manual and sensors measurements. Session 5: QA/QC Hong Kong,China An Integrated Meteorological Data Quality Assurance System for operation of the
Automatic Weather Station (AWS) Network in Hong Kong
H Y Mok (Hong Kong Observatory, Hong Kong, China)
The Hong Kong Observatory has developed and operated a new Automatic
Weather Station (AWS) System with a capability to carry out data quality assurance automatically. The AWS data received by the central data acquisition system are passed to the Integrated Data Quality Assurance System for real-time data quality control. The System, which is highly automatic, serves to enhance data quality and at the same time reduce manual labour. Through various real-time and non-real-time automatic data quality control processes, the system carries out quality assurance for each piece of data received from the AWS by assigning a quality assurance flag to the data, filtering out erroneous data from the AWS, and alerting maintenance staff to action via automatic email. Operation of the AWSs can also be monitored via a webpage which displays the status of the AWS network in real-time. The advantage of this automatic alerting feature is that it enables early detection and diagnosis of faults as well as enhancing data availability. Apart from monitoring the operation of the AWS, the quality assurance flags also serve as an indication of quality, facilitating reference by users in future studies. This presentation will focus on the overall design concepts and quality assurance algorithms used for the System. Japan
Quality Assurance and Quality Control of Surface Observations in JMA
Hakaru Mizuno (Observations Department, Japan Meteorological Agency)

17
JMA operates surface observation networks carried out at about 1,300 stations: 68 manned meteorological observatories, 88 unmanned meteorological observatories, and more than 1,100 AWSs. All these stations are integrated into the AWS network in Japan named as AMeDAS (Automated Meteorological Data Acquisition System). Observational data at meteorological observatories are transmitted to the
data-processing centre (AMeDAS Integrated Processing System: AIPS) in JMA headquarters every ten seconds, and ten minutes frequency for observations at other AWSs. Observational data are quality controlled in the instruments and in the AIPS in
real time. After sending SYNOP reports to GTS line and domestic BUFR reports to the external telecommunication line, processing systems in JMA-HQ implement non-real time AQC: Spatial check, sequential check and extreme value check. According to the AQC result returned from AIPS and the processing systems, the officer in the observatory corrects observation value. Kazakhstan
Kazhydromet is National Hydrometeorological Service REPUBLIC OF KAZAKHSTAN.
Zainuldinova Dinara (RSE Kazhydroment)
The main task KAZHYDROMET "is to provide meteorological,
agrometeorological, hydrological and ecological monitoring of the Republic. Meteorological network consists from 259 stations, and 8 upper air network
stations. Quality control of observations made by using an automated processing system
(Person ISI). Kazhydromet participates in international exchange of hydrometeorological data
from the Global Telecommunication System through the regional meteorological centers in Tashkent and the world meteorological centers in Moscow. Session 6: Training India
Training Facilities in India Meteorological Department
M K Gupta (Scientist-E,India Meteorological Depart,Pune)
Human resource development has always been one of the prime thrust areas of the India Meteorological Department for capacity building and to keep pace with latest trends in various activities of the Department. The Central Training Institute (CTI) of the India Meteorological Department (IMD) is situated at a pleasant location at Pashan in Pune. The training facilities for Upper Air Instrumentation and Meteorological Telecommunication are located at New Delhi. The Central Training Institute of IMD has a distinguished history dating back to 1942 when it had a humble beginning as an outcome of World War II wherein the

18
need for meteorological training to the personnel working in IMD was acutely felt and, consequently, a formal training course started in that year. In 1943 a full-fledged training school started in Pune, India. Since then this training institute (CTI) has undergone dramatic changes in its training capabilities, composition, objectives, contents, etc, in catering to personnel covering all levels from Class I to Class IV. Since its inception its mission has always been to achieve excellence in education researcher and service to meteorological community and thereby to the society. The WMO Executive Council at its thirty-eight session approved the designation of the training facilities of India Meteorological Department in New Delhi and Pune as WMO Regional Meteorological Training Centre (RMTC) for the Regional Association II (Asia) in the year 1986. The activities of RMTC are periodically assessed for quality and contents, by an independent assessor, deputed by WMO. Dr. Robert Riddaway visited RMTC, India (at Pune and New Delhi) during November 26 - December 5, 2002. He was apprised of various activities of RMTC, about which he was very appreciative as evidenced by his communication to WMO. The presentation describes the Training facilities, Syllabus of various courses offered, statistics and various programs of international co-operation in the field of training in Meteorology. Session 7: RIC-Tsukuba and Upper air Observations
Overview of MIC
Toshihiko Kobayashi (Head of Meteorological Instruments Center (MIC))
The Meteorological Instruments Center ( MIC) has continued services
of verification, inspection, investigation, development and improvement of meteorological instruments and provided reference values of meteorological instruments since the establishment in 1944. MIC has also taken charge of RIC to assist members of Regional Association II (RA II) through calibration and comparison with meteorological instruments and support to train instrument specialist since 1996. Therefore MIC has greatly contributed to the quality management of meteorological data in Asian region including Japan.
In order to carry out these services, MIC has 21 meteorological instruments experts and maintains standard meteorological instruments such as a standard platinum resistance thermometer, an air piston gauge and a chilled-mirror dew point hygrometer and calibration chambers for thermometers, hygrometers and barometers and so on.
MIC meets requirements to maintain the high-quality meteorological data to cope with the issue of worsening meteorological disaster and global climate change in the world.
Upper-air sounding network of JMA
Kenji Akaeda (Director of Observations Division,Observations Department)
19
The Japanese radiosonde network consists of 16 stations employed by JMA and 2 stations by SDF, which have operational observations twice a day of 00 UTC and 12 UTC. Its spatial resolution is almost 250-300 km. There is also an upper-air network of 31 wind profilers in JMA. Its horizontal spacing is 120 km on the average over the main islands of Japan. The observational data are exchanged internationally by using Global Telecommunication System (GTS). The Japanese upper-air sounding network started from 1938, and reach to final stage almost same as present one in 1973. All JMA sounding stations are belonged to Regional Basic Synoptic Network (RBSN) of WMO, and 6 stations (Sapporo, Tsukuba, Kagoshima, Ishigakijima, Chichijima and Minamitorishima) and Syowa station in Antarctic are incorporated into GCOS Upper-Air Network: GUAN. Through these networks, JMA is intent on stable observational data distribution. In March 2010, all 16 sounding stations of JMA were updated to GPS radiosonde system. 8 of them are operated as unmanned system with a combination of automatic balloon launcher and hydrogen generator system. The hydrogen generator system provides hydrogen by electrolysis. JMA operational Wind profiler network is called as WINDAS. The profiler is a ground-based multiple-beam Doppler radar unit with 1.3 GHz-band covering a range of up to 5 – 8 km from the surface and automatically performing wind measurement every 10 minutes. All observational data of GPS upper-air sounding system and WINDAS from Japan islands are collected in JMA HQ, and quality check is executed. These GPS sounding data include descent data. In future, sophisticated observational data with position information, which is retrieved from GPS sonde system of sonde, will be provided to numerical weather prediction.
Upper-air observation at Tateno (Aerological Observatory)
Hiroatsu MAKI (Director of Aerological Obserbatory)
Aerological observatory in Japan was established in 1920, in Tateno, where
is now a part of Tsukuba, a newly developed city for research and education. And in 1924, we observed strong wind of wind speed 72m/s at just below 10km level, which is believed as the first observation of jet stream. Since then, our observatory has acted as the technical center for upper-air observation in Japan. We also contribute for the discovery of Ozone Depletion through technical support of upper-air observation at Japanese base(Showa) in Antarctic. Now, the observatory has extended their activities, as a GRUAN (GCOS Reference Upper Air Network) site, and as a BSRN (Baseline Surface observation Network) site. We also, devoted our activities for the technical development. One of the example is automation of Dobson Ozone Spectrophotometer.

20
Lecture on fundamentals of wind profiling radar and applications in measuring wind and temperature profiling
Ahoro Adachi
(Meteorological Research Institute)
This lecture is intended to present information and details on wind profiling radar. The goal of this lecture is to provide background information and basic theory for the novice in remote sensing especially in wind profiling radar to understand what is advantage and disadvantage of the remotely sensed data. This lecture will be divided into three parts. The first part will be devoted to a brief overview of the profiling and an introduction to radar profiling techniques including Radio Acoustic Sounding System (RASS) used for temperature profiling. The second part will be devoted to show some operational characteristics of the MRI wind profilers including initial installation costs. Some observational results obtained from the profilers will be also presented. Comparisons with in situ measurements will be included in the results to show the accuracy and precision of the profiling radar. This will be followed by an introduction to some of current profiler networks in the world. This lecture will be ended with a short excursion to the MRI field site. We may see profiling radars and other instruments there. (15-min lecture + 5-min excursion)
21
Lectures
JMA/WMO Workshop on Quality Management in Surface, Climate and Upper-air Observations in RA II (Asia)
Tokyo, Japan
27 – 30 July 2010
Doc.
Japan ________
(10.VII.2010)
Climate Services Perspective (Submitted by Takafumi Umeda, Japan Meteorological Agency)
Summary and Purpose of Document
This document briefly presents the climate services of JMA, which monitors the global surface climate to detect climate variability and change (e.g., extreme climate events and global warming). JMA also operates a climate data assimilation system based on satellite, upper air, surface and ship data to provide diagnostic information on the climate system as background data to extreme climate events. The document will help to illustrate the importance of in-situ observation from the viewpoint of climate services.

22
Climate Services Perspective
1. Outline of climate services provided by CPD/JMA The main tasks and activities of the Climate Prediction Division at the Japan Meteorological Agency are as follows: · Provision of climatic information to the government and the public
- Climate impact assessment - Climate system monitoring - Seasonal outlook & El Niño outlook - Climate change projection
· Development of climate models to support the above tasks (in conjunction with the Meteorological Research Institute) - Atmospheric GCM & Data Assimilation System (JCDAS1) - Oceanic GCM & Data Assimilation System - Coupled Atmosphere-ocean General Circulation Model (CGCM) - Land surface analysis - Regional Climate Model - Long-term Re-analysis Project (JRA-252)
· Support for NMHS climate services in the Asia Pacific region (as the Tokyo Climate Center) 2. Surface climate monitoring JMA monitors the global surface climate to detect indicators of climate variability and change (e.g., extreme climate events and global warming). 2.1 Monitoring of extreme climate events JMA produces weekly, monthly, seasonal and annual reports on temperature, precipitation and hazardous climatic events (e.g., floods, droughts and tropical cyclones) using SYNOP and CLIMAT reports collected through GTS (Figure 1). This information is useful in international activities such as trading, transportation and disaster relief. 2.2 Monitoring of global warming JMA calculates the annual global average temperature anomaly to keep track of the manifestation of ongoing global warming using land surface data (CLIMAT, GHCN-monthly) and the results of sea surface temperature analysis (COBE3-SST) (Figure 2).
1 JCDAS: JMA Climate Data Assimilation System 2 JRA-25: Japanese 25-year Re-analysis 3 COBE: Centennial in-situ observation-based estimates of variability of SST and marine meteorological variables

23
1. High temperatures from eastern Siberia to northern Japan2. Heavy precipitation from southeastern Siberia to northern Mongolia 3. High temperatures from western Japan to southern China 4. High temperatures from western China to eastern Iran 5. Heavy precipitation from western Kazakhstan to Morocco 6. High temperatures around Mali 7. Torrential rains in southern Africa 8. Light precipitation around the northeastern USA 9. Heavy precipitation from central Canada to the western area of the Great Lakes 10. Low temperatures from southwestern Canada to the northwestern USA 11. High temperatures and light precipitation in southern South America 12. High temperatures around southern Polynesia
Figure 1. A JMA report on extreme climate events (March 2009)
The annual anomaly of the global average surface temperature in 2009 (i.e., the average of the near-surface air temperature over land and the SST) was +0.31°C above normal (based on the 1971 – 2000 average), which was the third highest since 1891. On a longer time scale, global average surface temperatures have been rising at a rate of about 0.68°C per century.
Figure 2. JMA report on global warming (2009)

24
3. Climate system monitoring The climate system consists of some subsystems including the atmosphere, oceans, land, the biosphere and so on. JMA monitors atmospheric general circulation and boundary conditions (sea surface temperature, sea-ice, snow cover, etc.) as follows: · Atmospheric circulation (JRA/JCDAS data) · Tropical convective activity (satellite observations: NOAA data) · Sea surface temperature (COBE-SST) · Snow and sea ice (CLIMAT reports & satellite observations: DMSP-SSM/I data) 4. Diagnostic information on the climate system as background to extreme
climate events JMA provides diagnostic information on the climate system as background to extreme climate events through the TCC web site at:
http://ds.data.jma.go.jp/tcc/tcc/news/index.html (TCC News is available in the “printable version” column.)
The following articles, for example, can be read in the latest TCC News (No. 20): · Summary of Asian Winter Monsoon 2009/2010
- Extremely low temperatures in northern Asia and extremely high temperatures in southern Asia
· Extremely Negative Arctic Oscillation in Winter 2009/2010 5. Importance of in-situ observation from the viewpoint of climate services Surface monthly data are important for detecting not only extreme climate events but also global warming. All CLIMAT reports from around 3,000 RBCN stations (including around 1,000 GSN stations) are necessary for overall monitoring of the world climate. Past long-term monthly data sets are also important for calculating climatological normals, standard deviations and long-term trends. Accurate measurement and precise analysis are necessary to calculate the global surface temperature anomaly (which has a year-to-year variation of around 0.1°C). Surface and upper-air daily data (SYNOP and TEMP reports) are important for monitoring and predicting the behavior of the climate system. Past long-term daily data sets are important for re-analysis projects.
Fig. 3. Examples of JMA’s climate system monitoring results
25
JMA/WMO Workshop on Quality Management in Surface, Climate and Upper-air Observations in RA II (Asia)
Tokyo, Japan
27 – 30 July 2010
Doc.
Japan ________
(10.VII.2010)
The Importance of Data Quality Control in Disaster Prevention and Mitigation
(Submitted by Kazuhiko Nagata, Japan Meteorological Agency)
Summary and Purpose of Document
Every year, Japan is affected by storm and flood damage resulting from heavy rain,
heavy snow, high waves, storm surges and so on caused by typhoons, extratropical cyclones and fronts. When hazardous weather conditions are expected, JMA delivers a variety of simple messages including warnings, advisories and bulletins to the general public and disaster prevention authorities.
Heavy rain warnings/advisories and flood warnings/advisories provide information on sediment-related disasters, floods and inundation. The criteria for these warnings and advisories are the amount of rainfall, the soil water index and the runoff index.
JMA uses the radar/raingauge-analyzed precipitation, which is calibrated radar data by accurately measuring raingauges data, for forecast operations.
Anomalous values observed using raingauges or radar can contaminate radar/raingauge-analyzed precipitation data, which are used as criteria for warnings and advisories. Such values may therefore obstruct forecast operations.
Quality control for observed data is therefore important for smooth forecast operation.

26
1. Meteorological characteristics and natural disasters of Japan 1.1 Meteorological characteristics of Japan
Japan is located on the eastern edge of the Asian continent, and has a temperate climate with four distinct seasons.
In wintertime (from December to February), developed extratropical cyclones over the Pacific Ocean and dominant Siberian anticyclones bring snowfall to the Sea of Japan side of the country.
Conversely, in summertime (from July to August), Pacific anticyclones cover Japan and bring clear skies to the whole country along with temperatures of over 30°C. Sometimes these conditions spawn thunderstorms.
In spring and autumn, extratropical cyclones and moving highs pass over Japan alternately. Rains falls around the front of these extratropical cyclones.
In the rainy season (known as the Baiu in Japan) from June to July, the Baiu front has a tendency to bring in heavy rains. In another rainy season in September, the Akisame front also tends to bring in heavy rains.
In summer and autumn (from August to October), typhoons sometimes hit Japan. Figure 1 shows typical seasonal weather maps.
1.2 Natural disasters in Japan
Heavy rains occur when a front such as the Baiu stalls over Japan and when extratropical cyclones or typhoons hit the country.
Heavy snow may fall on the Sea of Japan side when developed extratropical cyclones over the Pacific Ocean and dominant Siberian anticyclones are present, causing upper cold air to move southward.
Storm winds and high waves occur when developed extratropical cyclones and typhoons approach Japan.
(A) (B) (C)
(D) (E)
Figure 1. Typical seasonal weather maps (A) Winter (Jan. 3, 2009) (B) Spring (Mar. 5, 2009) (C) Baiu (Jun. 7, 2006) (D) Summer (Aug. 6, 2007) (E) Autumn with typhoon (Oct. 7, 2009)

27
In recent years, related disasters have resulted in about 100 fatalities or people unaccounted for, mostly as a result of gusting winds, floods and snow disasters.
A
B
C
D
cm
Figure 2. Examples of heavy rain and heavy snow Figures A and B show a heavy rain event that occurred from July 19 to July 26, 2009,
resulting in 30 people killed or unaccounted for. Figure A shows a weather map for July 26, 2009. Figure B shows cumulative rainfall from July 19 to July 26, 2009. Figures C and D show a heavy snow event that occurred from Dec. 31, 2009 to Jan. 1,
2010, resulting in a number of injuries. Figure C shows a weather map for Jan. 1, 2010. Figure D shows cumulative snowfall from Dec. 31, 2009 to Jan. 1, 2010.
Figure 3. Temporal sequence showing numbers of fatalities and missing people This figure shows the number of fatalities and missing people resulting from natural
disasters such as storm/flood damage, volcanic eruptions, snow damage, earthquakes, tsunami and so on in recent years. In 1995, the Hyogoken Nambu earthquake (also known as the Great Hanshin-Awaji Earthquake) occurred, killing over 6,000 people. (Reference: White Paper on Disaster Management 2009)
100 km 500 km

28
2. Information for severe weather preparedness 2.1 Information delivered by JMA
Every year, Japan is affected by storm and flood damage resulting from heavy rain, heavy snow, high waves, storm surges and so on caused by typhoons, extratropical cyclones and fronts. When hazardous weather conditions are expected, JMA delivers a variety of simple messages including warnings, advisories and bulletins to the general public and disaster prevention authorities.
Warnings and advisories for the relevant municipalities are issued whenever forecasters expect weather elements such as rainfall, wind speed, wave height and tide level to meet the trigger criteria.
Currently, JMA issues warnings and advisories for 1,777 municipalities to support the activities of disaster prevention agencies.
2.2 Criteria for heavy rain warnings/advisories and flood warnings/advisories
Here we look at heavy rain warnings/advisories and flood warnings/advisories. These provide information on sediment-related disasters, floods and inundation, which account for a large number of fatalities and missing people.
A heavy rain warning or advisory is issued when sediment-related disasters and inundation caused by heavy rains are feared, while a flood warning or advisory is issued when a rise in water levels and flooding caused by heavy rain, persistent rain and snowmelt water may occur.
The criteria for these warnings and advisories are the amount of rainfall, the soil water index and the runoff index.
The more rain seeps underground, the higher the risk of sediment-related disasters such as debris flow, slope failure and so on. The soil water index is used to estimate the amount of water in soil, and indicates the risk of sediment-related disasters.
Additionally, rainwater accumulates in rivers and runs downstream over time. The runoff index shows the risk of flooding from the amount of rainwater in the drainage basin and the time of flow.
To calculate these indices, precipitation values with a high level of quantitative accuracy are needed.
Figure 4. Visual outlines of the soil water index and the runoff index (Left) The soil water index indicates the amount of rainwater stored in soil. (Right) The runoff index indicates the flow of rainwater accumulating in the drainage basin and its downstream flow over time.

29
3. Rainfall data for forecasting operations 3.1 Precipitation observation equipment
The basic types of equipment for observing precipitation are raingauges and radar. An advantage of raingauges is that they measure actual amounts of precipitation, while a disadvantage is that they can observe precipitation only at single points. An advantage of radar is that it observes large areas at a higher spatial resolution than the raingauge network, and a disadvantage is that it may produce readings different from those of rainfall observed on the ground as it does not measure the amount of rainfall directly. One-hour cumulative rainfall measured using raingauges and one-hour accumulated echo intensity measured using radar for the same hour are shown in Figure 5. These images indicate that raingauges can observe rainfall only at single points, while radar can observe echoes with no spatial gap. The one-hour cumulative rainfall amount measured using raingauges is different from the one-hour accumulated echo intensity measured using radar.
Raingauges measure rainfall amounts automatically, and JMA collects data from around
10,000 such units belonging to JMA, the Ministry of Land, Infrastructure, Transport and Tourism (MLIT) and local governments every 10 minutes or every hour. The number of units means that a raingauge is located in every 7-km grid on average. Figure 6 shows the location of raingauges in Japan (only part of the country is shown due to space limitations). Red squares are JMA raingauges, blue squares are MLIT raingauges, and green squares are local government raingauges.
100 km
Figure 6. Locations of raingauges This figure shows part of Japan. Red squares are JMA raingauges, blue squares are MLIT raingauges, and green squares are local government raingauges.
Figure 5. Precipitation observation equipment These data show the same locations. (Left) A raingauge and example raingauge data (Right) A radar site and example radar data
100 km

30
JMA collects data from 46 C-band radars run by JMA and MLIT. The grid size of the data is 1 km. Figure 7 shows the location of each radar site. Red circles are JMA radar sites, and white triangles are MLIT radar sites.
3.2 Radar/raingauge-analyzed precipitation For the issue of warnings or advisories, accurate data on rainfall amounts over and around
Japan are required, including for areas where no raingauges are located. Such accurate data are also necessary to create the soil water index and runoff index. JMA uses the radar/raingauge-analyzed precipitation, which is calibrated radar data by accurately measuring raingauges data, for forecast operations.
Precipitation amounts observed using radar generally do not match those observed using raingauges, and are therefore calibrated with raingauge data. For the convenience of forecasters, these calibrated radar data are then made into a single composite data set.
This composite data set is known as radar/raingauge-analyzed precipitation, which indicates precipitation with high dimensional accuracy and is issued every 30 minutes with a spatial resolution of 1 km.
Figure 8. Development of radar/raingauge-analyzed precipitation data (Left) Radar data are calibrated with raingauge data. (Right) The calibrated radar data are made into a single composite data set.
Figure 7. Locations of radar sites Red circles are JMA radar sites, and white triangles are MLIT radar sites.
1,000 km

31
4. The importance of quality control for rainfall data
Anomalous values observed using raingauges or radar can contaminate radar/raingauge-analyzed precipitation data, which are used as criteria for warnings and advisories. Such values may therefore obstruct forecast operations.
The following issues may cause anomalous values: (1) Observation of non-precipitation data due to inappropriate performance of
raingauge inspections. (2) Observation of measurements that are higher or lower than the true values due to
influences related to the raingauge installation site. (3) Observation of inappropriate data due to raingauge blockages.
(1) is seen when a raingauge is inspected to ascertain proper operation. If the general
public sees the anomalous data, they feel strange and observation data could lose its trust. . If inspections are carried out correctly, such anomalous values will not arise.
(2) is seen if a raingauge is installed near a structure such as a wall or on a pole. Walls can obstruct rainfall, and as a result raingauge measurements may be lower than the true values. Similarly, if water runs from a roof onto a raingauge, the recorded value will be higher than the true value. Raingauges in such locations should be moved to a suitable place or not used.
(3) is seen when a raingauge’s funnel becomes blocked. Even if it rains heavily around the raingauge, it cannot observe this precipitation because of the blockage. Conversely, if the blockage is removed, the water sitting in the funnel will suddenly flow into the measuring part of the raingauge, causing it to record a value that is higher than the true value at the wrong time. Such anomalous values may occur at any time, so forecasters need to judge whether or not raingauge data are correct.
Forecasters must avoid the issuance of warnings or advisories based on anomalous data. To this end, quality control of raingauge data is performed by setting an upper data limit so that anomalous data are not returned. This limit must be decided carefully; if it is inappropriate, data showing large amounts of rainfall may be regarded as anomalous even if they are correct. The heavier it rains, the higher the risk of disasters becomes. However, the judgment of data showing heavy rainfall as anomalous means that forecasters cannot identify such increased risk.
Also important are metadata showing information such as the location of raingauges, observation intervals, units and so on. As an example, if the location of a raingauge is wrong, even if it observes heavy rain correctly, forecasters will misidentify the location of the precipitation.
As described above, it is clear that quality control for AWS (automatic weather station) data
is important. It should also be noted that the importance of quality control for manual
Figure 9. Example of radar/raingauge-analyzed precipitation Radar/raingauge-analyzed precipitation is a composite data set indicating precipitation with high dimensional accuracy, and is issued every 30 minutes with a spatial resolution of 1 km.This image and those in Figure 5 show the same time and area.

32
observation is the same as that for automatic observation. Forecasters require accurate, prompt observation data, making it important to obtain
correct measurements at fixed times and report them quickly.

33
WMO/JMA RA II (Asia) Workshop on Quality Management in Surface, Climate and Upper-air Observations
Tokyo, Japan
27-30 July 2010
Doc.
__Japan__
(10.VII.2010)
The Impact of Observational Data on Numerical Weather Prediction
(Hirokatsu Onoda,Japan Meteorological Agency)
Summary and Purpose of Document
Large amounts of observational data are assimilated in the operational
NWP system at JMA. In recent years, the volume of remote sensing data such as satellite radiance has been increasing, and now accounts for about 80% of all observational data. The data remaining 20% come from conventional observation such as SYNOP and Radiosonde, however, still play an important role in the NWP system. JMA perform quality control (QC) for observational data, and this is an essential part of improving the initial value and forecast field. In some cases, observational data are found to include anomalous values. Here, we show the importance of maintenance for the observation network through examples. Finally, we introduce the Report on the Quality of Land Surface Observations in RA-II published by JMA as the lead center, and also outline the Monthly Global Data Monitoring Report.

34
1. Introduction
The Japan Meteorological Agency (JMA) continues to work on the development of its Numerical Weather Prediction (NWP) system. As one of the world's most advanced NWP centers, JMA now provides a variety of NWP products that play a vital role in weather services both nationally and on an international level.
Currently, JMA operates the following NWP models:
1) The Global Spectral Model (GSM) for the short- and medium-range forecast up to nine days ahead to cover the entire globe,
2) The Mesoscale Model (MSM) for warnings and the very short-range forecast of precipitation to cover Japan and its surrounding areas,
3) A low-resolution version of the GSM for ensemble prediction in one- week forecasting and long-range forecasting up to six months ahead,
and 4) Others for specific targets such as ocean waves, sea ice extent and
El Niño. The specifications of the deterministic NWP models are shown in Table.1 Table.1 Specifications of JMA’s NWP models (deterministic only)
Global Model (GSM) Mesoscale Model (MSM)
Purposes Short- and medium-range
forecast Very short-range forecast
Forecast domain Globe Japan and its surrounding
areas Grid size and/or number of grids
0.1875 deg. (TL959) 5 km / 721 x 577
Vertical levels / Top
60 / 0.1 hPa 50 / 21,800 m
Forecast hours (Initial time)
84 hours (00,06,18UTC) 216 hours (12UTC)
15 hours (00,06,12,18UTC) 33 hours (03,09,15,21UTC)
Initial condition 4D-Var analysis 4D-Var analysis
2. Data use of NWP system
Large amount of observational data are assimilated in the operational NWP system at JMA. High-performance telecommunications and data processing are needed to enable this system to operate on an everyday basis. As one of the Regional Telecommunication Hubs (RTHs) in RA II of the GTS, JMA is connected to two World Meteorological Centers (Washington and Melbourne), four RTHs (Beijing, New Delhi, Bangkok and Khabarovsk), and three National Meteorological Centers (Seoul, Hong Kong and Manila).
Figure 1 shows data use of NWP models. The daily number of observational report reaches about 650,000 for the GSM and about 820,000 for the MSM. In recent years, the volume of remote sensing data such as satellite radiance has increased and now accounts for about 80% of all assimilated data. The remaining 20% come from conventional observation such as SYNOP. Although the percentage of conventional data among assimilated observational data is relatively small, it still plays an important role in the NWP system.

35
Figure 1. Data use of NWP models.
* Automated Meteorological Data Acquisition system ** GPS radio occultation
3. The impact of assimilated observations
An observation system experiment was conducted in regard to ground-based observation with the JMA global data assimilation (DA) system. An analysis-forecast cycle experiment was carried out in which ground-based conventional observation (SYNOP, RAOB) were not assimilated. The MSLP departure of observation and background (O-B) values increased in comparison with those of the operational analysis-forecast cycle. This result shows that continuous observation and dense network is important for initial value improvement.
We also investigated which type of data had the greater influence. Langland and Baker (2004) suggested a method to estimate the observation impact. The global observation impact can be expressed as the sum of contributions from all individual observations by considering sensitivity gradients. The quantities for which the system uses the observations to pull the signal from the background are called DFS (degrees of freedom for signal; see for example Wahba, 1995). DFS values according to the type investigated by JMA shows that conventional data still exert a significant influence in the DA system.
It is very important to continue and maintain the conventional observation for NWP system even though the ratio of conventional data has become smaller overall.

36
4. Quality control in NWP system
JMA operationally performs quality control (QC) for all observational data. QC plays an essential part in maintaining the quality of the initial value and forecast field. The QC system is composed of an automatic component called real-time QC and a manual component called non real-time QC.
The DA system performs real-time QC. If data are climatologically unrealistic, appear as duplicates, show a large difference from the first-guess field (background) of the model or significantly disagree with neighboring values, they are rejected in real-time QC.
In some cases, however, data are found to include anomalous values that are difficult to reject in real-time QC. A blacklist is kept for non real-time QC to deal with such data. Platforms (stations, airplanes, ships, etc) found to report biased or erratic observations placed on the blacklist for careful monitoring, and blacklisted observations are rejected before real-time QC procedures. The blacklist is updated manually whenever sudden deterioration occurs, and blacklisting status is lifted when the careful monitoring shows that the quality has returned to an accepted standard.
Typical causes of blacklisting include the following:
Problems with instrumentation Erroneous reporting formats Change of tendency from new correction methods Data with low observation density
Some correct observation, however, deviates from the background because the NWP model is not perfect. It is difficult to discriminate wheather errors are related to observation or to the NWP model itself.
5. Data monitoring report
JMA publishes the following two reports:
1) Monthly Global Data Monitoring Report
The JMA Global Data Monitoring Report is a monthly publication intended to give an overview of the quality of observation. It should be recognised that the statistics given in this report refer to data as received by JMA in time for appropriate analysis. The information presented on data quality is based on differences between observations and the values of the most recent JMA forecast (known as first guess) of the same parameters.
2) Report on the Quality of Land Surface Observation in Region II (Asia)
As stipulated in Paragraph 22 of Attachment II.7, of the Manual on the Global Data Processing and Forecasting System (WMO No.485), the Regional Specialized Meteorological Center (RSMC) Tokyo was designated by the President of the Commission for Basic Systems (CBS) as a lead center for monitoring the quality of land surface observations (i.e. SYNOP) for Region II in March 1991. The lead center is responsible for monitoring the quality of land surface observations and composing lists of suspected low-quality observations together with adequate evidence. These lists are passed on to
37
the WMO Secretariat and centers participating in this monitoring activity as well as to members of the Regional Association (RA) II for their reference.
6. References
Langland, R. and N. Baker, 2004: Estimation of observation impact using the NRL atmospheric variational data assimilation adjoint system. Tellus, 56A, 189-201. Wahba, G. D. R. Johnson, F. Gao and J. Gong, 1995: Adaptive tuning of numerical weather prediction models: Randomized GCV in three and four dimensional data assimilation, Mon. Wea. Rev., 123, 3358-3369.

38
JMA/WMO Workshop on Quality Management in Surface, Climate and Upper-air Observations in RA II (Asia)
Tokyo, Japan
27-30 July 2010
Doc.
Japan ________
(27.VII.2010)
WMO/CIMO Perspective (Submitted by M.Ondras, WMO Observing Systems Division)

World Meteorological OrganizationWorld Meteorological OrganizationWorking together in weather, climate and water
WMO
Workshop on Quality Management in Surface,
Climate and Upper AirClimate and Upper-Air ObservationsObs a o s
(Tokyo, 27-30 July 2010)
Dr M. OndrášChief, WMO Observing Systems Division
7/29/2010 1WMO/OBS www.wmo.int
WMO Convention(Part II, Article 2, Purposes)
(a) To facilitate worldwide cooperation in the(a) To facilitate worldwide cooperation in the establishment of networks of stations for th ki f t l i l b tithe making of meteorological observations as well as hydrological and other
h i l b ti l t d tgeophysical observations related to meteorology, and…;
(c) To promote standardization of meteorological and related observations gand to ensure the uniform publication of observations and statistics;
7/29/2010 2
;
General Regulation of WMO ( Annex III, Structure and TOR of TCs)
I Basic Commissions II Applications CommissionsI. Basic Commissions• CBS – (A)• CIMO – (A)
II. Applications Commissions• CAeM – (C)• CAgM - (C)( )
• CHy – (A)• CAS – (B)
g ( )• JCOMM - (C) • CCl - (C)
(A) Basic operations and facilities(B) Research in Atmospheric sciences
(C) Applications to economic and social activities
Develop, for consideration by the Executive Council and Congress, proposed international standards for methods, procedures, t h i d ti i t l d ti l h d ltechniques and practices in meteorology and operational hydrology including, in particular, the relevant parts of the Technical Regulations, guides and manuals.
7/29/2010 3
Regulations, guides and manuals.
Standardization (WMO R l M i l)(WMO Regulatory Material)
C d EC d t R l t M t i lCg and EC adopt Regulatory Material that define meteorological practices and procedures to be followed by Memberse be s
1 Standard practices and procedures -1. Standard practices and procedures -Manuals
2. Recommended practices and procedures - Guides
7/29/2010 4
p
Partnership in Standardizationp
W ki t ith th UN• Working agreements with other UN bodies and international Organizations:g– ISO: Working Agreement on joint
St d dStandards
– ICAO: Issuing Standards and gRecommended Practices for Aviation
CIPM&BIPM: Working Agreement on– CIPM&BIPM: Working Agreement on cooperation and collaboration & MRA
7/29/2010 5
Partnership inPartnership in Standardization
(ISO)(ISO)
7/29/2010 6
39

Partnership in StandardizationPartnership in Standardization
Cooperation Agreement with ISO:Cooperation Agreement with ISO:1. Aimed at development of joint ISO/WMO tech standards2. WMO to retain primary control of own standards3. WMO could retain WMO specific standards
(TCs decide which standard to propose)4 Benefits4. Benefits Underlines authority of WMO documents Enhances international recognition and dissemination of g
WMO standards5. Costs: Standards need to be updated every 5 years (current Standards need to be updated every 5 years (current
revision cycle of WMO Technical Regulations variable) Publication strategy – free access for Members
7/29/2010 7
Partnership in StandardizationPartnership in Standardization
TC identifies possible
TC establishes benefit/cost to
TC informs PTC and EC members of plans and requests assessment f i t th i ifcommon
standard
benefit/cost to Members
of impact on their programmes, if any
Risk assessment of proposed standard: if d t d d if itt d
TC submits consolidated report
C f
TC finalizes standard to be
SOadopted and if omitted to EC for approval proposed to ISO
Submission of proposal to ISO Central Secretariat
TC approvalNote: in this slide TC
means WMO Tech. Commission
7/29/2010 8OBS in connection with Dept. supporting WMO TC
Partnership inPartnership in Standardization
(CIPM&BIPM)(CIPM&BIPM)
7/29/2010 9
Cg-XV decisionsR 31 (C XV) “I l f QMS”Res. 31 (Cg-XV) “Impl of QMS”
1 Recommended QMS Implementation for1. Recommended QMS Implementation for NMHSs
2. WMO Quality Management Framework• Develop overall QM strategy for WMODevelop overall QM strategy for WMO
• Includes both the needs of Members and the implementation of WMO Programmesimplementation of WMO Programmes
• WMO QMF aims at ensuring the development, d i t f th WMO t h i luse and maintenance of the WMO technical
documentation, supporting QMS of Members
7/29/2010 10
Cg-XV decisionsR 31 (C XV)Res. 31 (Cg-XV)
3 Encouraged NMSs to implement QMS3. Encouraged NMSs to implement QMS following appropriate internationally
f SOrecognized standards, if possible ISO 9001
4. Encouraged NMSs to develop a QMS4. Encouraged NMSs to develop a QMS covering most of their activities
5 NMHS h5. NMHSs may choose:– Whether or not to pursue certification
– Whether to certify all or part of the activities covered by their QMS
7/29/2010 11
y Q
Cg-XV decisionsR 32 (C XV) “WMO QMF”Res. 32 (Cg-XV) “WMO QMF”
NMSs were requested to:
• Quality control on-site observations
f• Ensure the traceability of measurements to recognized worldmeasurements to recognized world standards approved for the use of WMO M bWMO Members.
7/29/2010 12
40

Standardization (WMO R l M i l)(WMO Regulatory Material)
T h i l R l ti (WMO N 49)Technical Regulations (WMO-No. 49) (Mandatory publication):
– Volume I: General Meteorological Standards & Recommended Practices
– Volume II: Meteorological Service for International Air navigationg
– Volume III: Hydrology
Volume IV: QM (Generic a proposal of ICTT– Volume IV: QM (Generic, a proposal of ICTT-QMF approved by EC-LXII)
Fi A WMO M l7/29/2010 13→ Five Annexes: WMO Manuals
Standardization (WMO R l M i l)(WMO Regulatory Material)
• Basic Commissions (CBS, CIMO, CAS, CHy)Basic Commissions (CBS, CIMO, CAS, CHy)– CAS: Manual on the observations of clouds and
other meteors (Vol. I of ICA) (I), GAW Reports– CBS: Manuals on Codes (II), on GTS (III), on GDPFS
(IV), on GOS (V)CBS G id GOS GDPFS GTS– CBS: Guides on GOS, GDPFS, GTS
– CIMO: Guide to Met. Instruments and Methods of Obs.CHy: Guide to Hydro Practices Technical Docs– CHy: Guide to Hydro Practices, Technical Docs
• App. Commissions (CCl, CAgM, CAeM, JCOMM)Some Manuals e g Manual on Marine Met Services– Some Manuals, e.g. Manual on Marine Met Services (VI) but mostly Guides to xx Practices or Services, TN and other Reports, e.g. IOM Report series
7/29/2010 14NOTE: Marked red are mandatory publications and are Annexes to WMO TR
Standardization (WMO R l M i l QM)(WMO Regulatory Material-QM)
M l th GDPFS P t II Ch 2 QC f• Manual on the GDPFS, Part II, Ch.2 QC of observational data and their reception at GDPFS C t i l d l tiCentres in real and non-real time (authoritative reference on all matters related to QC i )QC issues),
• Manual on the GOS, Part V, QC
• Guide to the GOS, Part VIII, QM
• CIMO Guide, Part III, QA and QM of Obs. SystemsCIMO Guide, Part III, QA and QM of Obs. Systems
• Manual on Marine Met Services, Vol. I, QC of Data7/29/2010 15
Data(Note: Sections on QM also in other Manual and Guides)
Manual on GDPFS, P II, CH.2(QC of observational data and their reception at(QC of observational data and their reception at
GDPFS Centres in real time)
• QC requires that an operational entity (WMC• QC requires that an operational entity (WMC, RSMC, NMC or observing site) has the ability to select edit or otherwise manipulate observationsselect, edit, or otherwise manipulate observations according to its own set of physical or dynamical principles. p p
• The primary responsibility for QC of obs data rest with the originating NMS.g g
• NMS should ensure that when obs data enter GTS they are free from errors.y
• NMS should implement minimum standards of real-time quality control (Appendix II-1).7/29/2010 16
q y ( pp )
7/29/2010 17
Manual on GDPFS, P II, CH.2(QC of observational data and their reception at(QC of observational data and their reception at
GDPFS Centres in non-real time)
1 Prior to storage of data they should be subject to1. Prior to storage of data they should be subject to the QC necessary to ensure a satisfactory standard of accuracy for users.
2. The primary responsibility for non-real-time QC should rest with Members which operate the centres that store the data (Note: This apply alsocentres that store the data. (Note: This apply also Members data storage.) This QC should be performed on a routine basis and should begin as p gsoon as possible after the data have been received at the centre.
3 P i t l i d t i t ll t l3. Prior to placing data in storage, all suspect values and proposed corrections should be appropriately marked for future users of data.
7/29/2010 18
marked for future users of data.
41

7/29/2010 19
Guide on GDPFS, CH.6(QC P d d T h i )(QC Procedures and Techniques)
Gross-error limit checks (against physical or climatological limits)
7/29/2010 20
Guide on GDPFS, CH.6(QC P d d T h i )(QC Procedures and Techniques)
Internal consistency checksInternal consistency checks (Different parameters are checked against each other)
7/29/2010 21
Manual on GOS, Part V, QCManual on GOS, Part V, QC
1 QC f b ti l d t i t f i ti f1. QC of observational data consists of examination of data at stations at data centres to detect errors so that data may be corrected or flaggedthat data may be corrected or flagged.
2. A QC system should include procedures for returning to the source of data to verify them andreturning to the source of data to verify them and to prevent recurrence of errors.
3 Within the framework of the GOS QC shall be a real3. Within the framework of the GOS, QC shall be a real-time activity which has to be performed prior to the transmission of the observational data on GTS.
4. The primary responsibility for QC of all obs data shall rest with the Members (where observations originated).
7/29/2010 22
Guide on GOS, Part VIII, QM(Ref: QMF)
1 The key aim: to check the entire process not only the1. The key aim: to check the entire process not only the final product.
2. Res.27 (Cg-XIV) –initiated WMO QMF to develop the ( g ) pfollowing elements: WMO technical standards; QMS, including QC; and certification procedures.
3 The structure of the QMF corresponds to the following3. The structure of the QMF corresponds to the following aims of WMO:a) To ensure adequate uniformity and standardization in the
Spractices and procedures used by NMSs;b) To ensure quality of observational data, since the
effectiveness of any NMS depends on the quality of data and y p q yproducts exchanged through the WMO Systems;
c) To ensure overall availability of observational data for all purposes, especially for the NWP.
7/29/2010 23
p p , p y
CIMO Guide, Part III“QA & QM f OS”“QA & QM of OS”
1 ISO 9000: QMS Fundamentals and vocabulary1. ISO 9000: QMS – Fundamentals and vocabulary
2. ISO 9001: QMS – Requirements
3 ISO 9004: QMS – Guidelines for performance3. ISO 9004: QMS – Guidelines for performance improvements
4. 9011 : Guidelines for quality and/or environmental q ymanagement systems auditing
5. ISO /IEC 1 7025: General requirements for the t f t ti d lib ti l b t icompetence of testing and calibration laboratories
6. ISO /IEC 20000: Information technology – Service managementmanagement
7. WMO QMF
8. Accreditation of Laboratories
7/29/2010 24
8 cc ed tat o o abo ato es
9. Factors affecting Data Quality
42
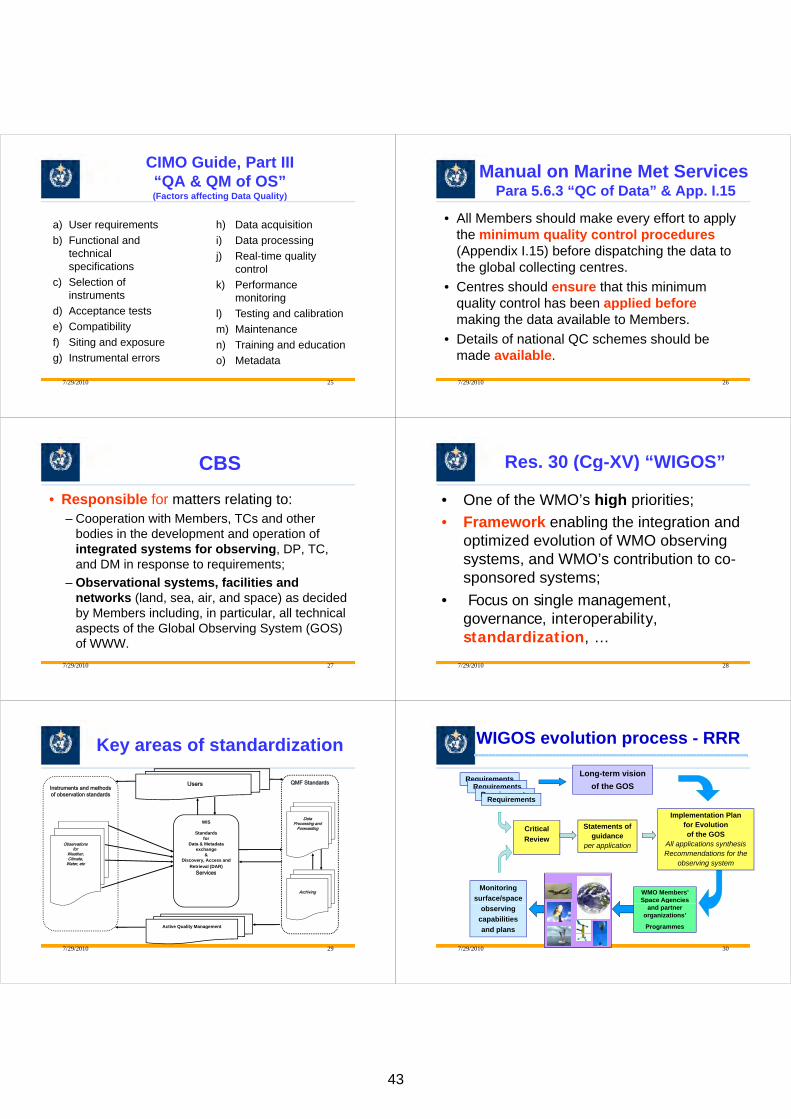
CIMO Guide, Part III“QA & QM of OS”QA & QM of OS(Factors affecting Data Quality)
a) User requirements
b) Functional and
h) Data acquisition
i) Data processing)technical specifications
) p g
j) Real-time quality control
c) Selection of instruments
k) Performance monitoring
d) Acceptance tests
e) Compatibilityl) Testing and calibration
m) Maintenancef) Siting and exposure
g) Instrumental errorsn) Training and education
o) Metadata
7/29/2010 25
Manual on Marine Met ServicesPara 5.6.3 “QC of Data” & App. I.15
All M b h ld k ff t t l• All Members should make every effort to apply the minimum quality control procedures(Appendix I.15) before dispatching the data to the global collecting centres.
• Centres should ensure that this minimum quality control has been applied beforequality control has been applied beforemaking the data available to Members.
• Details of national QC schemes should be• Details of national QC schemes should be made available.
7/29/2010 26
CBSCBS
• Responsible for matters relating to:• Responsible for matters relating to:– Cooperation with Members, TCs and other
bodies in the development and operation of integrated systems for observing, DP, TC, and DM in response to requirements;
– Observational systems, facilities and networks (land, sea, air, and space) as decided by Members including, in particular, all technical aspects of the Global Observing System (GOS) of WWW.
7/29/2010 27
Res. 30 (Cg-XV) “WIGOS”Res. 30 (Cg XV) WIGOS
• One of the WMO’s high priorities;• One of the WMO s high priorities;
• Framework enabling the integration and g goptimized evolution of WMO observing systems and WMO’s contribution to cosystems, and WMO s contribution to co-sponsored systems;
• Focus on single management, governance interoperabilitygovernance, interoperability, standardization, …
7/29/2010 28
Key areas of standardizationKey areas of standardization
QMF St d dQMF Standards Instruments and methods of observation standards
Users
WIS
Standardsfor
D & M d
DataProcessing and
Forecasting
Data & Metadata exchange
&Discovery, Access and
Retrieval (DAR)
Services
Observationsfor
Weather,Climate,
Water, etc
Services
Archiving
Active Quality Management
7/29/2010 29
WIGOS evolution process - RRR
Long-term vision Requirements
of the GOSRequirements
RequirementsRequirements
Requirements
Implementation Planfor Evolution of the GOS
All li ti th i
Critical
Review
Statements of guidance
All applications synthesis Recommendations for the
observing system
per application
WMO Members’ Space Agencies
Monitoring
surface/space gand partner
organizations’
Programmes
observing
capabilities
and plans
7/29/2010 30
43
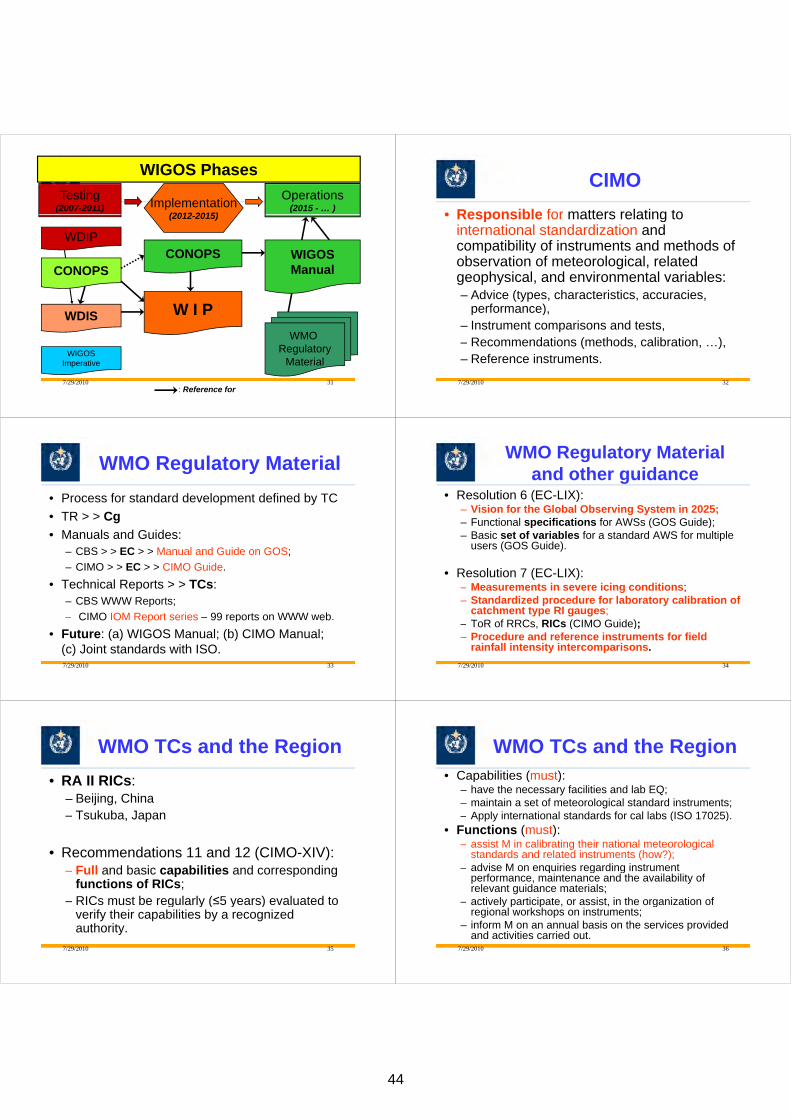
WIGOS Phases
Testing(2007-2011) Implementation
(2012 2015)
Operations(2015 - … )
WDIP
(2012-2015)
CONOPSCONOPS WIGOS
Manual
W I P
WMO
WDIS W I P
WMO Regulatory
MaterialWIGOS
Imperative
7/29/2010 31: Reference for
CIMOCIMO
• Responsible for matters relating to• Responsible for matters relating to international standardization and compatibility of instruments and methods ofcompatibility of instruments and methods of observation of meteorological, related geophysical and environmental variables:geophysical, and environmental variables:– Advice (types, characteristics, accuracies,
performance)performance),– Instrument comparisons and tests,
( )– Recommendations (methods, calibration, …),– Reference instruments.
7/29/2010 32
WMO Regulatory MaterialWMO Regulatory Material
• Process for standard development defined by TC• Process for standard development defined by TC
• TR > > Cg
• Manuals and Guides: – CBS > > EC > > Manual and Guide on GOS;
– CIMO > > EC > > CIMO Guide.
• Technical Reports > > TCs:p– CBS WWW Reports;
– CIMO IOM Report series – 99 reports on WWW web.C O O epo t se es 99 epo ts o eb
• Future: (a) WIGOS Manual; (b) CIMO Manual; (c) Joint standards with ISO7/29/2010 33
(c) Joint standards with ISO.
WMO Regulatory Material d h idand other guidance
• Resolution 6 (EC-LIX):Resolution 6 (EC LIX):– Vision for the Global Observing System in 2025;– Functional specifications for AWSs (GOS Guide);– Basic set of variables for a standard AWS for multiple
users (GOS Guide).
• Resolution 7 (EC-LIX):– Measurements in severe icing conditions;Measurements in severe icing conditions;– Standardized procedure for laboratory calibration of
catchment type RI gauges;T R f RRC RIC (CIMO G id )– ToR of RRCs, RICs (CIMO Guide);
– Procedure and reference instruments for field rainfall intensity intercomparisons.
7/29/2010 34
y p
WMO TCs and the RegionWMO TCs and the Region
• RA II RICs:• RA II RICs: – Beijing, China
T k b J– Tsukuba, Japan
• Recommendations 11 and 12 (CIMO-XIV):– Full and basic capabilities and correspondingFull and basic capabilities and corresponding
functions of RICs;– RICs must be regularly (≤5 years) evaluated toRICs must be regularly (≤5 years) evaluated to
verify their capabilities by a recognized authority.
7/29/2010 35
y
WMO TCs and the RegionWMO TCs and the Region• Capabilities (must):p ( )
– have the necessary facilities and lab EQ;– maintain a set of meteorological standard instruments;
A l i i l d d f l l b (ISO 17025)– Apply international standards for cal labs (ISO 17025).• Functions (must):
assist M in calibrating their national meteorological– assist M in calibrating their national meteorological standards and related instruments (how?);
– advise M on enquiries regarding instrument q g gperformance, maintenance and the availability of relevant guidance materials;
– actively participate or assist in the organization ofactively participate, or assist, in the organization of regional workshops on instruments;
– inform M on an annual basis on the services provided and activities carried out
7/29/2010 36
and activities carried out.
44

WMO TCs and the RegionWMO TCs and the Region
• CIMO ET on RIC (Casablanca 4 5 Dec 09)• CIMO ET on RIC (Casablanca, 4-5 Dec.09)– Evaluation scheme for RICs (or CAL labs of M)
St t i t t t bilit– Status on instrument traceability;– Recommended instruments for CAL Labs;– Guidance on inter-labs comparisons.
• WIGOS PP (GE, 8/9 Oct.09)( , )– Siting classification of surface Oss;– Maintained performance classification ofMaintained performance classification of
surface Oss.
7/29/2010 37
CIMO GuideC O Gu dePart I. Measurement of meteorological Variables:
CHAPTER 1 G l• CHAPTER 1. General• CHAPTER 2. Measurement of temperature• CHAPTER 3. Measurement of atmospheric pressure
CHAPTER 4 Measurement of humidity• CHAPTER 4. Measurement of humidity• CHAPTER 5. Measurement of surface wind• CHAPTER 6. Measurement of precipitation• CHAPTER 7 Measurement of radiation• CHAPTER 7. Measurement of radiation• CHAPTER 8. Measurement of sunshine duration• CHAPTER 9. Measurement of visibility• CHAPTER 10 Measurement of evaporationCHAPTER 10. Measurement of evaporation• CHAPTER 11. Measurement of soil moisture• CHAPTER 12. Measurement of UA pressure, temperature and humidity• CHAPTER 13. Measurement of upper windCHAPTER 13. Measurement of upper wind• CHAPTER 14. Present and past weather; state of the ground• CHAPTER 15. Observation of clouds• CHAPTER 16. Measurement of ozone
7/29/2010 38• CHAPTER 17. Measurement of atmospheric composition
CIMO GuideC O Gu dePart II. Observing Systems:
CHAPTER 1 M t t t ti th t ti• CHAPTER 1. Measurements at automatic weather stations• CHAPTER 2. Measurements and observations at aeronautical met stations• CHAPTER 3. Aircraft observations• CHAPTER 4 Marine observationsCHAPTER 4. Marine observations• CHAPTER 5. Special profiling techniques for the BL and the troposphere• CHAPTER 6. Rocket measurements in the stratosphere and mesosphere• CHAPTER 7. Locating the sources of atmosphericsg p• CHAPTER 8. Satellite observations• CHAPTER 9. Radar measurements• CHAPTER 10. Balloon techniques
CHAPTER 11 U b b ti• CHAPTER 11. Urban observations• CHAPTER 12. Road Meteorological MeasurementsPart III. QA and Management of Observing Systems:• CHAPTER 1 Quality management• CHAPTER 1. Quality management• CHAPTER 2. Sampling meteorological variables• CHAPTER 3. Data reduction• CHAPTER 4. Testing, calibration and intercomparison
7/29/2010 39
g, p• CHAPTER 5. Training of instrument specialists
7/29/2010 40
7/29/2010 41 7/29/2010 42
45
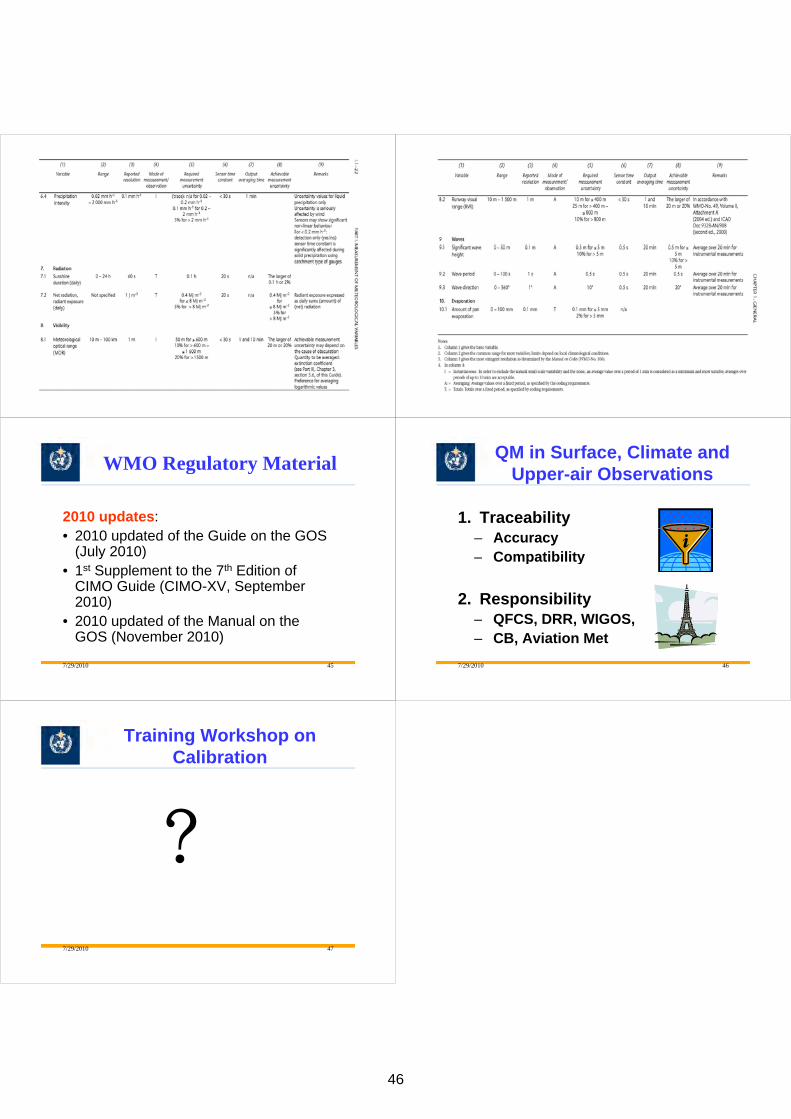
7/29/2010 43 7/29/2010 44
WMO Regulatory MaterialWMO Regulatory Material
2010 updates:• 2010 updated of the Guide on the GOS
(July 2010)( y )• 1st Supplement to the 7th Edition of
CIMO Guide (CIMO-XV, SeptemberCIMO Guide (CIMO XV, September 2010)
• 2010 updated of the Manual on the• 2010 updated of the Manual on the GOS (November 2010)
7/29/2010 45
QM in Surface, Climate and U i Ob iUpper-air Observations
1. Traceability– Accuracy– CompatibilityCompatibility
2. Responsibility– QFCS DRR WIGOS– QFCS, DRR, WIGOS,– CB, Aviation Met
7/29/2010 46
Training Workshop on C lib iCalibration
7/29/2010 47
46

47
JMA/WMO Workshop on Quality Management in Surface, Climate and Upper-air Observations in RA II (Asia)
Tokyo, Japan
27-30 July 2010
Doc.
Japan ________
(27.VII.2010)
Siting Classification for Surface Observing Stations on Land
(Submitted by Michel Leroy, Meteo-France)
Summary and Purpose of Document
Several factors have an influence on the « quality » of a meteorological measurement: the intrinsic characteristics of sensors or measurement methods; the maintenance needed to maintain the system in nominal conditions; the site representiveness.
Environmental conditions on a site may generate measurement errors larger than the uncertainty of the instrument itself, whilst more attention is usually being given to the instrument itself. WMO/CIMO has clear recommendations about siting and exposure of instruments. But they are not always possible to follow and this is scarcely documented. Several years ago, Météo-France defined a siting classification for wind, temperature, precipitation and solar radiation, ranging from 1 (WMO recommendations) to 5 (bad environment to be representative). It has been applied and proved to be efficient both to document the siting and to improve it, by rating it. Recently, an expert meeting was organized by WMO, to cross experience on the subject and to define a siting classification for Surface Observation at Land. This classification will be proposed for validation by the next CIMO-XV in September 2010. Considering also the various metrological characteristics of the equipment used in different surface networks, Météo-France defined also another classification, called "maintained performance classification", including the uncertainty of the instrument and the organization of preventive maintenance and calibration. This complementary classification was also discussed within the expert team of WMO, but was not considered enough mature to be proposed to CIMO for validation. The principles of these two classifications will be presented, along with the experience of Météo-France in applying them.

WMO/JMA RA II (Asia) Workshop on Quality Management
in Surface, Climate and Upper-air Observations
Tokyo, Japan 27-30 July 2010
Doc.
FRANCE ________
Siting Classification for Surface Observing Stations on Land Michel Leroy, Météo-France
Abstract
Several factors have an influence on the « quality » of a meteorological measurement: the intrinsic characteristics of sensors or measurement methods; the maintenance needed to maintain the system in nominal conditions; the site representiveness. Environmental conditions on a site may generate measurement errors larger than the uncertainty of the instrument itself, whilst more attention is usually being given to the instrument itself. WMO/CIMO has clear recommendations about siting and exposure of instruments. But they are not always possible to follow and this is scarcely documented. Several years ago, Météo-France defined a siting classification for wind, temperature, precipitation and solar radiation, ranging from 1 (WMO recommendations) to 5 (bad environment to be representative). It has been applied and proved to be efficient both to document the siting and to improve it, by rating it. Recently, an expert meeting was organized by WMO, to cross experience on the subject and to define a siting classification for Surface Observation at Land. This classification will be proposed for validation by the next CIMO-XV in September 2010. Considering also the various metrological characteristics of the equipment used in different surface networks, Météo-France defined also another classification, called "maintained performance classification", including the uncertainty of the instrument and the organization of preventive maintenance and calibration. This complementary classification was also discussed within the expert team of WMO, but was not considered enough mature to be proposed to CIMO for validation. The principles of these two classifications will be presented, along with the experience of Météo-France in applying them.
48

QUALITY OF A MEASUREMENT Quality is the ability to satisfy implicit or explicit needs. For meteorological measurements, this is often translated to a statement of operational accuracy requirements. Several factors have an influence on the « quality » of a measurement; one can quote: a) The intrinsic characteristics of sensors or measurement methods.
They are coming from technical specifications, emitted by technical services, users or manufacturers. These characteristics are commonly described by the manufacturers, sometimes controlled during intercomparisons and are generally well known and mastered, at least for the classic measurements which we are dealing with. Meteorological services have been traditionally dealing with this aspect.
b) The maintenance tasks (including calibration) needed to maintain the system in nominal conditions. These operations are often expensive and necessitate a continuous effort. Preventive maintenance is the best guaranty to maintain a system close to its nominal performance, allowing final measurements to be close to the « intrinsic » performances of the sensor. Our experience shows that this maintenance is not always well mastered in case of a dense network.
c) The site representativeness and therefore the measurement representativeness. SITE REPRESENTATIVENESS This representativeness is sometimes neglected, especially when the density of a network is increasing. The people selecting a site know the exposure rules, but numerous logistic constraints exist. For cost and availability considerations, the measurement system is often (at least in France) hosted on a site not belonging to the owner (or the administrator) of the network. The access to the site, its supervision and the availability of telephone and power lines are important elements. These logistic aspects and also the topography, may surpass the strict application of exposure rules, quite restricting, especially for wind measurements (at least 10 times the height of nearby obstacles, which exclude nearby trees or buildings). A compromise is often selected. But when the rules are not applied, there may be no limits. Who have not ever seen anemometers close to high trees? THE GENESIS OF THE SITING CLASSIFICATION In 1998, Météo-France defined a classification for some basic surface variables to document the nearby environment of a site. Class numbers are used, ranging from 1 (the best) to 5 (the worst). This classification was first applied to select the sites of 400 AWS of a new network, named RADOME. Obviously the objective was to select class 1 sites, but compromise were sometimes necessary and it was decided to accept sites with a maximum class number of 3. This classification was presented is some international conferences (TECO, AMS). It is applied, with some modifications, by the USA, to document their climatic reference network. Some other countries (Canada, Switzerland, …) got also an interest in this approach. Finally, this classification was considered and discussed within WMO (CBS, CIMO and as part of a pilot project for WIGOS). Group of experts amended it and it will be proposed for consideration and possible approval to the next CIMO XV in September 2010. Therefore, it could become a standard from WMO.
49

SITING CLASSIFICATION Environmental conditions of a site1 may generate measurement errors exceeding the tolerances envisaged for instruments. More attention being usually given to the characteristics of the instrument than to the environmental conditions in which the measurement was made; it is often environmental conditions that distort results, influencing their representativeness, particularly where a site is supposed to be representative of a large area (i.e. 100 to 1 000 km2).
WMO-No. 8 indicates exposure rules for various sensors. But what should be done when these conditions are not fulfilled?
There are sites which do not respect the recommended exposure rules. Consequently a classification has been established to help determine the given site’s representativeness on a small scale (impact of the surrounding environment). Hence, a class 1 site, can be considered as a reference site. A class 5 site is a site where nearby obstacles create an inappropriate environment for a meteorological measurement that is intended to be representative of a wide area (at least tenths of km2) and where meteorological measurements should be avoided. The smaller is the siting class, the higher is the representativeness of the measurement for a wide area. A site with a poor class number (large number) can stay valuable for a specific application needing a measurement in this particular site including its local obstacles.
Each type of measurements on a site is subject to a separate classification.
By linking measurements to their associated uncertainty levels, this classification may be used to define the maximum class number of a station, in order to be included in a given network, or to be used for a given application. In a perfect world, all sites would be of class 1, but the real world is not perfect and some compromises are necessary. It is more valuable to accept this situation and to document it by means of this siting classification.
By experience of Météo-France, the classification process helps the actors and managers of a network to better take in consideration the exposure rules and thus often improves the siting. At least, the siting environment is known and documented in the metadata. It is obviously possible and recommended to fully document the site, but the risk is that a fully documented site may increase the complexity of the metadata, which would often restrict their operational use. That is why this siting classification is defined to condense the information and facilitate the operational use of this metadata information.
A site as a whole has no single classification number. Each parameter being measured at a site has its own class, and is sometimes different from others. If a global classification of a site is required, the maximum value of the parameters’ classes can be used.
The rating of each site should be reviewed periodically as environmental circumstances can change over a period of time. A systematic yearly visual check is recommended: if some aspects of the environment have changed, a new classification process is necessary.
A complete update of the site classes should be done at least every 5 years.
In the following text, the classification is (occasionally) completed with an estimated uncertainty due to siting, which has to be added in the uncertainty budget of the measurement. This estimation is coming from bibliographic studies and/or some comparative tests.
The primary objective of this classification is to document the presence of obstacles close to the measurement site. Therefore, natural relief of the landscape may not be taken into account, if far away (i.e. >1 km). A method to judge if the relief is representative of the surrounding area is the following: does a move of the station by 500 m change the class 1 A “site” is defined as the place where the instrument is installed.
50

obtained? If the answer is no, the relief is a natural characteristic of the area and is not taken into account.
Complex terrain or urban area generally leads to high class number. In such cases, an additional flag “S” can be added to class numbers 4 or 5 to indicate Specific environment or application (i.e 4S).
The example of the classification for precipitation is given below.
CLASSIFICATION FOR PRECIPITATION
Wind is the greatest source of disturbance in precipitation measurements, due to the effect of the instrument on the airflow. Unless rain gauges are artificially protected against wind, for instance by a wind shield , the best sites are often found in clearings within forests or orchards, among trees, in scrub or shrub forests, or where other objects act as an effective wind-break for winds from all directions. Ideal conditions for the installation are those where equipment is set up in an area surrounded uniformly, by obstacles of uniform height. An obstacle represents an object with an angular width of 10° or more.
The choice of such a site is not compatible with constraints in respect of the height of other measuring equipment. Such conditions are practically unrealistic. If obstacles are not uniform, they are prone to generate turbulence which distorts measurements; this effect is more pronounced for solid precipitation. This is the reason why more realistic rules of elevation impose a certain distance from any obstacles. The orientation of such obstacles with respect to prevailing wind direction is deliberately not taken into account. Indeed, heavy precipitation is often associated with convective factors, whereby the wind direction is not necessarily that of the prevailing wind. Obstacles are considered of uniform height if the ratio between the highest and lowest height is lower than 2.
Reference for the heights of obstacles is the catchment’s height of the rain gauge.
Class 1
• Flat, horizontal land, surrounded by an open area, slope less than 1/3 (19°). Rain gauge surrounded by obstacles of uniform height, seen under an elevation angle between 14 to 26° (obstacles at a distance between 2 to 4 times their height).
or
• Flat, horizontal land, surrounded by an open area, slope less than 1/3 (19°). For a rain gauge artificially protected against wind, the instrument does not necessarily need to be protected by obstacles of uniform height. In this case, any other obstacles must be situated at a distance of at least 4 times their height.
51

Class 2 (additional estimated uncertainty added by siting up to 5 %)
• Flat, horizontal land, surrounded by an open area, slope less than 1/3 (19°).
• Possible obstacles must be situated at a distance at least twice the height of the obstacle (with respect to the catchment’s height of the rain gauge).
Class 3 (additional estimated uncertainty added by siting up to 15 %)
• Land is surrounded by an open area, slope less than 1/2 (≤ 30°).
• Possible obstacles must be situated at a distance greater than the height of the obstacle.
Class 4 (additional estimated uncertainty added by siting up to 25 %)
• Steeply sloping land (> 30°).
• Possible obstacles must be situated at a distance greater than one half (1/2) the height of the obstacle.
52

Class 5 (additional estimated uncertainty added by siting up to 100 %)
• Obstacles situated closer than one half (1/2) their height (tree, roof, wall, etc.).
MAINTAINED PERFORMANCE CLASSIFICATION
Another primary quality factor of a measurement is the set of “intrinsic” characteristics of the equipment used. They are the characteristics related to the design of the instrument. They are known from the manufacturer documentation and/or from laboratory or field tests. Once an instrument is selected and its performance characteristics known, it is necessary to maintain the level of performance during its operational period. Preventive maintenance and calibration are therefore necessary and must be identified to maintain the desired measurement uncertainty. When delivering observations for various applications (mainly forecasts and climatology), it should be possible to state the “guaranteed” (for example with a 95% level of confidence) accuracy of a measurement. But it is not always done, the observations may come from several networks with different characteristics and considering “by default” the “achievable measurement uncertainty” of WMO n°8, Annex 1B could be a mistake. The required accuracy of the main surface-observing network of Météo-France, named Radome, has been stated, the instruments were selected and the maintenance and calibration are organized accordingly. Doing this, the performances are known and documented. They are generally less stringent than the WMO operational measurement uncertainty requirements. In addition to his proprietary Radome network, Météo-France also uses observations from other AWS networks (not belonging to Météo-France) and from manual climatologic sites (cooperative network). The instruments used in such networks are often not the same that the instruments specified and selected for Radome. Therefore, their performances are different, often lower. Nevertheless, their data have been used for climatological and forecasting applications, generally without considering the “quality” of the network. This may not be satisfactory and the “quality” of the observations has sometimes to be taken into account, mainly for the climatology. In order to document the performance characteristics of the various surface observing networks used, Météo-France defined another classification, called "maintained performance classification", including the uncertainty of the instrument and the periodicity and the procedures of preventive maintenance and calibration. The five levels are:
53

• Class A: WMO/CIMO required measurement uncertainty or achievable measurement uncertainty when higher. Maintenance and calibration are organized to keep this uncertainty in the field and over time. When the required measurement uncertainty is smaller than the achievable accuracy, the latter is indicated.
• Class B: Lower specifications, but still considered as quite “good”, often having a good value to money ratio and more affordable in practice. Maintenance and calibration are organized to keep this uncertainty in the field and over time.
• Class C: Specifications and/or maintenance and calibration procedures lower than class B, but known and applied. Maintenance and calibration are still organized.
• Class D: Specifications lower than class C or no maintenance and calibration organized.
• Class E: Unknown performances and/or unknown maintenance procedures. Typical conditions to get and maintain the stated accuracy are indicated. This classification is related to a network, considering the instruments used and the maintenance organization applied for this network. So, it is an “organization” classification. It doesn’t give the information of what has been made on a particular day on a particular site. This classification covers the quality factors a) and b) listed above. An example for liquid precipitation is given below. Class A
• The larger of 5% and 0.1mm. (achievable measurement uncertainty). • Reported resolution better than or equal to 0.1 mm. • If any, error related to precipitation intensity corrected. • Use of a wind shield. • Daily control of the collecting cone for rain gauges using a cone. • 6 months calibration for tipping bucket rain gauges.
Class B • The larger of 5% and 0.2 mm. • Reported resolution better than or equal to 0.2 mm. • If any, error related to precipitation intensity corrected or at least known. • 6 months calibration for tipping bucket rain gauges. • Weekly control of the collecting cone for tipping bucket rain gauges.
Class C • The larger of 10% and 0.5 mm. • Unknown error related to precipitation intensity. • Calibration period of tipping bucket rain gauges lower than 18 months. • A preventive maintenance is defined and applied.
Class D • > 10% • or no control and adjustment methods defined • or no regular maintenance organized.
This classification was also discussed within the WIGOS project pilot, but was not considered as enough mature to be proposed as a WMO standard. More work is needed to reach a consensus.
54

EXEMPLE: STATUS OF THE RADOME NETWORK IN FRANCE With these two classifications, a letter and a number therefore describe a measurement on a given site. So, it is possible to have a general view of the classes of a network. The following graphs show the result of the classification of the Radome network.
For each diagram, the siting class is horizontal; the maintained performance class is vertical. The color is a little bit related to the “quality” of the combination of the two classes. A1 (green) is the best; the yellow zone is still a good compromise; the usefulness of a
55
measurement in the orange zone begins to be questionable; no points should be in the red zone; the blue one is for the unknown maintained performance class. We have some values in the red zone:
• We currently have some electronic drifts with some acquisition modules for temperature, leading to an uncertainty that we have flagged with a class D. We are finishing to solve this problem.
• Some sites have a bad environment for some sensors, mainly wind sensors. For such sites, the installation was accepted with derogation, registered in our quality system.
The C class for precipitation is related to the use of a rain gauge model that exhibits quite large evaporation errors. These rain gauges will be replaced. This objective presentation of our Radome network shows that it is not perfect. But it is an honest presentation, which may also brings arguments to improve it.
CONCLUSION The two classifications described have the advantage of being simple and therefore, easy to use as metadata. Unfortunately, the siting classification as it is defined, doesn’t allow to correct the measurements. Correction methods remain possible, but independently of the siting classification. It is a clear limitation, but these classifications allow to easily document the “quality” of the design of a network. Another advantage is that it is also a didactic approach, both for network designers, financing authorities and final users. It gives a clear and honest view of a network status. The Météo-France experience is that the implementation of these classifications brought and still bring improvements in the networks’ design, thus optimizing their value, not necessarily at an extra cost.
56

Annex : definition of site classification for air temperature and humidity, surface wind, global and diffuse solar radiation, direct radiation and sunshine duration
Air temperature and humidity
Sensors situated inside a screen should be mounted at a height determined by the meteorological service (within 1.25 m to 2 m as indicated in the CIMO Guide). The height should never be less than 1.25 m. The respect of the higher limit is less stringent, as the temperature gradient vs. height is decreasing with height. For example, the difference in temperature for sensors located between 1.5 and 2 m is less than 0.2 °C.
The main discrepancies are caused by unnatural surfaces and shading.
• Obstacles around the screen influence the irradiative balance of the screen. A screen close to a vertical obstacle may be shaded from the solar radiation or “protected” against the night radiative cooling of the air, by receiving the warmer infra red (IR) radiation from this obstacle or influenced by reflected radiation.
• Neighbouring artificial surfaces may heat the air and should be avoided. The extent of their influence depends on the wind conditions, as wind affects the extent of air exchange. Unnatural or artificial surfaces to take into account are heat sources, reflective surfaces (e.g. buildings, concrete surfaces, car parks) and water sources (e.g. ponds, lakes, irrigated areas).
Shading by nearby obstacles should be avoided. Shading due to natural relief is not taken into account for the classification (see above).
The indicated vegetation growth height represents the height of the vegetation maintained in a 'routine' manner. A distinction is made between structural vegetation height (per type of vegetation present on the site) and height resulting from poor maintenance. Classification of the given site is therefore made on the assumption of regular maintenance (unless such maintenance is not practicable).
Class 1
• Flat, horizontal land, surrounded by an open space, slope less than 1/3 (19°).
• Ground covered with natural and low vegetation (< 10 cm) representative of the region.
• Measurement point situated:
o at more than 100 m from heat sources or reflective surfaces (buildings, concrete surfaces, car parks etc.)
o at more than 100 m from an expanse of water (unless significant of the region)
o away from all projected shade when the Sun is higher than 5°.
A source of heat (or expanse of water) is considered to have an impact if it occupies more than 10 % of the surface within a circular area of 100 m surrounding the screen, makes up 5% of an annulus of 10m-30m, or covers 1% of a 10 m circle.
57

Class 2
• Flat, horizontal land, surrounded by an open space, slope inclination less than 1/3 (19°).
• Ground covered with natural and low vegetation (< 10 cm) representative of the region.
• Measurement point situated :
o At more than 30 m from artificial heat sources or reflective surfaces (buildings, concrete surfaces, car parks etc.)
o At more than 30 m from an expanse of water (unless significant of the region)
o Away from all projected shade when the Sun is higher than 7 °.
A source of heat (or expanse of water) is considered to have an impact if it occupies more than 10 % of the surface within a circular area of 30 m surrounding the screen, makes up 5% of an annulus of 5m-10m, or covers 1% of a 5 m circle.
Class 3 (additional estimated uncertainty added by siting up to 1 °C)
• Ground covered with natural and low vegetation (< 25 cm) representative of the region.
• Measurement point situated:
o at more than 10 m from artificial heat sources and reflective surfaces (buildings, concrete surfaces, car parks etc.)
o at more than 10 m from an expanse of water (unless significant of the region)
o away from all projected shade when the Sun is higher than 7 °.
A source of heat (or expanse of water) is considered to have an impact if it occupies more than 10 % of the surface within a circular area of 10 m surrounding the screen or makes up 5% of an annulus of 5m.
58

Class 4 (additional estimated uncertainty added by siting up to 2 °C)
• Close artificial heat sources and reflective surfaces (buildings, concrete surfaces, car parks etc.) or expanse of water (unless significant of the region, occupying:
o Less than 50% of the surface within a circular area of 10 m around the screen
o Less than 30% of the surface within a circular area of 3 m around the screen
• Away from all projected shade when the Sun is higher than 20 °.
Class 5 (additional estimated uncertainty added by siting up to 5 °C)
Site not meeting the requirements of class 4.
59

Surface wind
Conventional elevation rules stipulate that sensors should be placed 10 m above ground surface level and on open ground. Open ground here represents a surface where obstacles are situated at a minimum distance equal to at least ten times their height.
Roughness
Wind measurements are not only disturbed by surrounding obstacles; terrain roughness also plays a role. The WMO defines wind blowing at a geometrical height of 10 m and with a roughness length of 0.03 m as the surface wind for land stations.
This is regarded as a reference wind for which exact conditions are known (10 m height and roughness length of 0.03 m).
Therefore, roughness around the measuring site has to be documented. Roughness should be used to convert the measuring wind to the reference wind, but this procedure can be applied only when the obstacles are not too close. Roughness related matters and correction procedure are described in chapter 5 of the CIMO Guide.
The roughness classification, reproduced from the CIMO Guide, is recalled here:
Terrain classification by Davenport (1960),
adapted by Wieringa (1980) in terms of aerodynamic roughness length zo
Class index
Short terrain description Z0 (m)
2 Mud flats, snow; no vegetation, no obstacles 0.005
3 Open flat terrain; grass, few isolated obstacles 0.03
4 Low crops; occasional, large obstacles : x/H > 20 0.10
5 High crops; scattered obstacles : 15 < x/H < 20 0.25
6 Parkland, bushes; numerous obstacles : x/H ~ 10 0.5
7 Regular large obstacle coverage (suburb, forest) 1.0
8 City centre with high- and low- rise buildings 2
Here x is a typical upwind obstacle distance and H is the height of the corresponding major obstacles. For more detailed and updated terrain class index descriptions see Davenport, et al. (2000).
Environment classification
The presence of obstacles (almost invariably) means a reduction in average wind readings, but less significantly affects wind gusts.
The following classification assumes measurement at 10 m which is the standard elevation for meteorological measurement.
When measurement are carried out at lower height (such as measurement carried out at 2 m, as is sometimes the case for agro-climatological purposes), a class 4 or 5 (see below) is to be used, with flag S (Specific situation).
60

Where numerous obstacles higher than 2 m are present, it is recommended that sensors should be placed 10 meters above the average height of the obstacles. This method allows the influence of the adjacent obstacles to be minimised. This method represents a permanent solution for partly eliminating the influence of certain obstacles. It inconveniently imposes the necessity for higher masts which are not standard and consequently more expensive. It must be considered for certain sites and where used, the height of obstacles to be taken into account is that above the level situated 10 m below the sensors (e.g. for an anemometer installed at a 13 m height, the reference “ground” level of the obstacles is at a 3 m height; an obstacle of 7 m is considered to have an effective height of 4 m).
In the following, an object is considered to be an obstacle if its angular width is over 10°, except for tall thin obstacles, as mentioned below.
Changes of altitude (positive or negative) in the landscape which are not representative of the landscape, are considered as obstacles.
Class 1
• The mast should be located at a distance equal to a least 30 times the height of surrounding obstacles.
• Sensors should be situated at a minimum distance of 15 times the width of narrow obstacles (mast, thin tree) higher than 8 m.
Single obstacles lower than 4 m can be ignored.
• Roughness class index is between 2 to 4 (roughness length ≤ 0.1 m).
61

Class 2 (additional estimated uncertainty added by siting up to 30 %, possibility to apply correction)
• The mast should be located at a distance of at least 10 times the height of the surrounding obstacles.
• Sensors should be situated at a minimum distance of 15 times the width of narrow obstacles (mast, thin tree) over 8 m high.
Single obstacles lower than 4 m can be ignored.
• Roughness class index is between 2 to 5 (roughness length ≤ 0.25 m).
Note: when the mast is located at a distance of at least 20 times the height of the surrounding obstacles, a correction (see CIMO Guide, wind chapter) can be applied. In case of nearer obstacles, a correction may be applied is some situations.
Class 3 (additional estimated uncertainty added by siting up to 50 %, correction cannot be applied)
• The mast should be located at a distance of at least 5 times the height of surrounding obstacles.
• Sensors should be situated at a minimum distance of 10 times the width of narrow obstacles (mast, thin tree) higher than 8 m.
Single obstacles lower than 5 m can be ignored.
62

Class 4 (additional estimated uncertainty added by siting greater than 50 %)
• The mast should be located at a distance of at least 2.5 times the height of surrounding obstacles.
• No obstacle with an angular width larger than 60° and a height greater than 10 m, within a 40 m distance.
Single obstacles lower than 6 m can be ignored, only for measurements at 10 m or above.
Class 5 (additional estimated uncertainty cannot be defined)
Site not meeting the requirements of class 4.
Global and diffuse radiation
Close obstacles have to be avoided. Shading due to the natural relief is not taken into account for the classification. Non-reflecting obstacles below the visible horizon can be neglected.
An obstacle is considered as reflecting if its albedo is greater than 0.5.
The reference position for elevation angles is the sensitive element of the instrument.
Class 1
• No shade projected onto the sensor when the Sun is at an angular height of over 5°. For regions with latitude ≥ 60°, this limit is decreased to 3°.
• No non-shading reflecting obstacles with an angular height above 5° and a total angular width above 10°.
Class 2
• No shade projected onto the sensor when the Sun is at an angular height of over 7°. For regions with latitude ≥ 60°, this limit is decreased to 5°.
63

• No non-shading reflecting obstacles with an angular height above 7° and a total angular width above 20°.
Class 3
• No shade projected onto the sensor when the Sun is at an angular height of over 10°. For regions with latitude ≥ 60°, this limit is decreased to 7°.
• No non-shading reflecting obstacles with an angular height above 15° and a total angular width above 45°.
Class 4
• No shade projected during more than 30% of the daytime, for any day of the year.
Class 5
• Shade projected during more than 30% of the daytime, for at least one day of the year.
64

Direct radiation and sunshine duration
Close obstacles have to be avoided. Shading due to the natural relief is not taken into account for the classification. Obstacles below the visible horizon can be neglected.
The reference position for angles is the sensitive element of the instrument.
Class 1
• No shade projected onto the sensor when the Sun is at an angular height of over 3°.
Class 2
• No shade projected onto the sensor when the Sun is at an angular height of over 5°.
Class 3
• No shade projected onto the sensor when the Sun is at an angular height of over 7°.
Class 4
• No shade projected during more than 30% of the daytime, for any day of the year.
Class 5
• Shade projected during more than 30% of the daytime, for at least one day of the year.
65
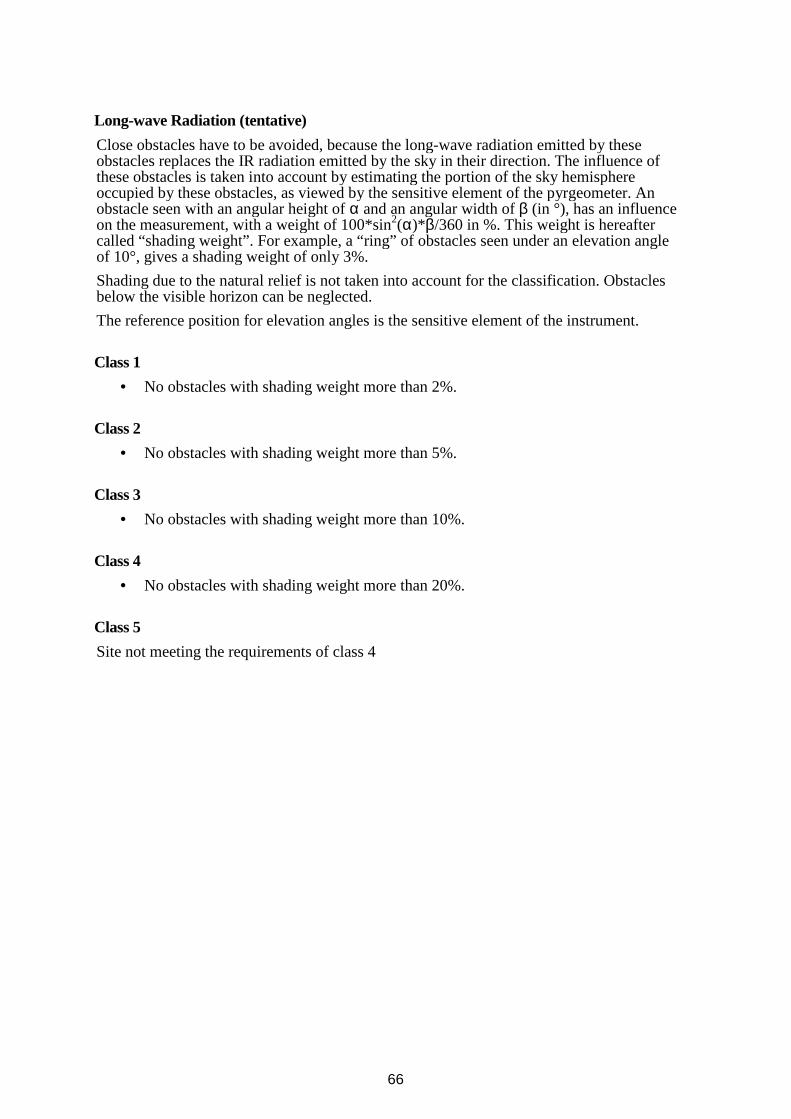
Long-wave Radiation (tentative)
Close obstacles have to be avoided, because the long-wave radiation emitted by these obstacles replaces the IR radiation emitted by the sky in their direction. The influence of these obstacles is taken into account by estimating the portion of the sky hemisphere occupied by these obstacles, as viewed by the sensitive element of the pyrgeometer. An obstacle seen with an angular height of α and an angular width of β (in °), has an influence on the measurement, with a weight of 100*sin2(α)*β/360 in %. This weight is hereafter called “shading weight”. For example, a “ring” of obstacles seen under an elevation angle of 10°, gives a shading weight of only 3%.
Shading due to the natural relief is not taken into account for the classification. Obstacles below the visible horizon can be neglected.
The reference position for elevation angles is the sensitive element of the instrument.
Class 1
• No obstacles with shading weight more than 2%.
Class 2
• No obstacles with shading weight more than 5%.
Class 3
• No obstacles with shading weight more than 10%.
Class 4
• No obstacles with shading weight more than 20%.
Class 5
Site not meeting the requirements of class 4
66

67
Country reports Cambodia
JMA/WMO Workshop on Quality Management in Surface,
Climate and Upper-air Observations in RA II (Asia)
Tokyo, Japan 27 – 30 July 2010
Doc.
Japan ________
(10.VII.2010)
Report on The Status of Weather Observation in Cambodia (Submitted by Peou Phalla, Researching and Forecasting Office,Department of Meteorology)
Summary and Purpose of Document
This document contains an overview of the surface and upper-air observations in Japan, with respect to instruments, quality assurance / quality control, training, statistics and applications.

68
Ministry of Water Resources and Meteorology
Department of Meteorology
Report on The Status of Weather Observation in Cambodia
July, 2010.
69
Content
1- Background of Cambodia Weather Observation 2- Observation Network 3- Sitting and Metadata 4- Instruments 5- Quality Assurance/Quality Control ( real time, non-real time) 6- Training 7- Statistics issues and Applications. 8- Current issues and future plan

70
1- Background of Cambodia Weather Observation
Cambodia Weather Observation was beginning since 1894. Cambodia joined the World Meteorological Organization in 1955. Between1972-1975, Cambodia carried out of the project under UNDP-Funded. From 1975-79, Cambodia was in the political instable of the Khmer Rouse (Democratic Kampuchea), Weather Observation Network and Service were abandoned and all Equipment were destroyed. After 1979, weather Observation Service was re-established with the technical and equipment support from Soviet Union and Viet Nam, that was established 5 synoptic stations and 33 rainfall stations. From 1992-1995, Weather Observation Network and Service were re-habilitated through the project of Danida-Financed Program and implemented by Lutheran World Service. During these years Cambodia Weather Observation was still in a basic of operational system due to the limited of funds. During the period of the year 2001-2003, Cambodia Weather Observation was improved through the project of JICA; the project installed weather sensor 6 stations and conducted of the site of job training to the staff. From 2005-2006, under the project of JICA, Global Telecommunication System (GTS) was installed. During 2007-2008, JICA funded project on the Urgent Rehabilitation and Improvement of Civil Aviation Meteorology, the GTS was improved, and MTSAT was installed. In March 2010, Department of Meteorology was moved to the new place, GTS was re-installed and connected link to Bangkok again on June 14, 2010, and MTSAT was re-installed on July 15, 2010 that was under technical supported and assistant of WMO Volunteer.
2- Observation Network
Cambodia observes only on the Surface and we are not yet to observe on upper air.
2-1 Surface Observation: 2-1-1 Synoptic Station: Weather Observation Network in Cambodia consists of:
- 20 synoptic stations including of 9 automatic stations (AWS) was broken and 20 synoptic stations are operational with manned observational equipment.
- 200 manual rainfall stations.
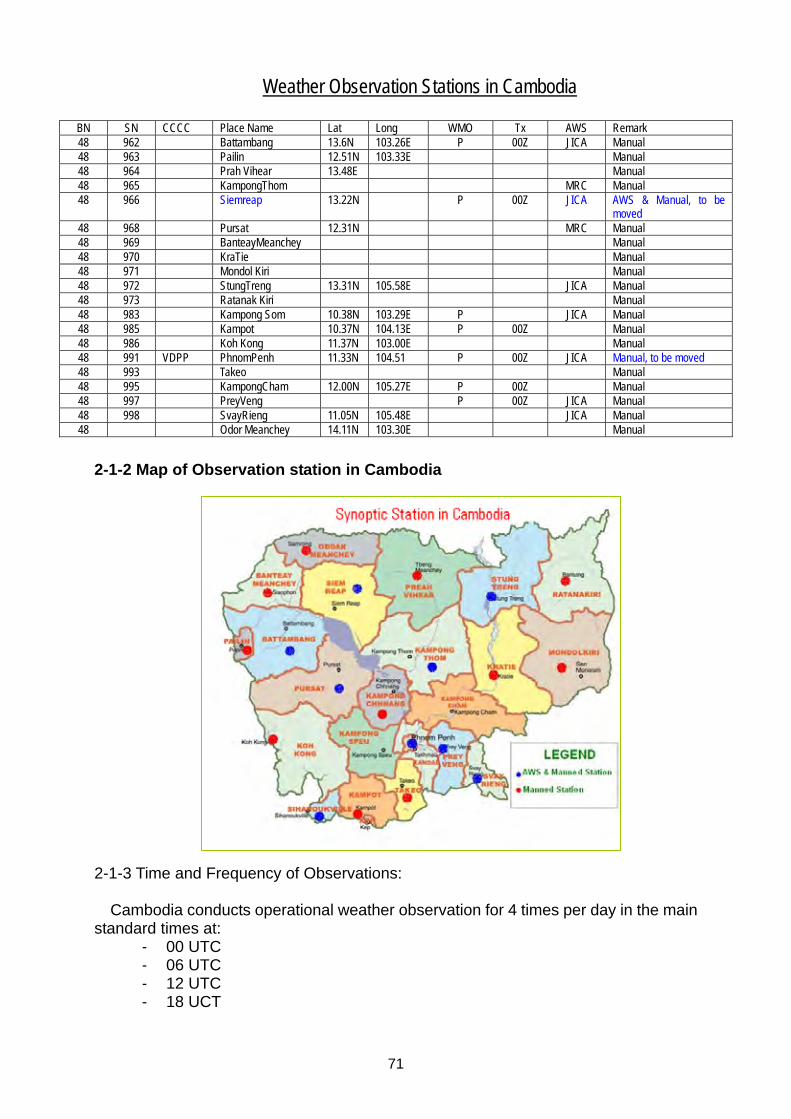
71
Weather Observation Stations in Cambodia
BN SN CCCC Place Name Lat Long WMO Tx AWS Remark 48 962 Battambang 13.6N 103.26E P 00Z JICA Manual 48 963 Pailin 12.51N 103.33E Manual 48 964 Prah Vihear 13.48E Manual 48 965 KampongThom MRC Manual 48 966 Siemreap 13.22N P 00Z JICA AWS & Manual, to be
moved 48 968 Pursat 12.31N MRC Manual 48 969 BanteayMeanchey Manual 48 970 KraTie Manual 48 971 Mondol Kiri Manual 48 972 StungTreng 13.31N 105.58E JICA Manual 48 973 Ratanak Kiri Manual 48 983 Kampong Som 10.38N 103.29E P JICA Manual 48 985 Kampot 10.37N 104.13E P 00Z Manual 48 986 Koh Kong 11.37N 103.00E Manual 48 991 VDPP PhnomPenh 11.33N 104.51 P 00Z JICA Manual, to be moved 48 993 Takeo Manual 48 995 KampongCham 12.00N 105.27E P 00Z Manual 48 997 PreyVeng P 00Z JICA Manual 48 998 SvayRieng 11.05N 105.48E JICA Manual 48 Odor Meanchey 14.11N 103.30E Manual
2-1-2 Map of Observation station in Cambodia
2-1-3 Time and Frequency of Observations: Cambodia conducts operational weather observation for 4 times per day in the main standard times at:
- 00 UTC - 06 UTC - 12 UTC - 18 UCT

72
2-1-4 Data flow to users and archives
Data collection from manned station is recorded in the observation log, and transmitted to Department of Meteorology in Phnom Penh by Telephone and by Fax (HF SSB). The data is transfer first to the Head office of Research and Weather Forecast for using in forecasting, and after the data is transmitted to the Head office of Climate for climatologically use. Rainfall data collection is carried out by local observation officer. Rainfall data are recorded in a log book that provided by Department of Meteorology, Actually, the rainfall data transmitting to Department of Meteorology only from 34 stations. The data are analyzed and stored by the Head Office of Climate. The data production is provided to many users such as: Royal Palace, Prim minister Cabinet, Cabinet Ministry of Water Resources and Meteorology, Ministry of Information, Provincial Department of Water Resources and Meteorology, Radio, TV, Newspaper, Other NGO, and Other User.

73
Structure of Data Flow and Archive Chart
3- Sitting and Metadata Surface Observation data in Cambodia is including: - Air temperature - Surface wind, - Solar radiation, - Evaporation, - Cloud amount and type, - Atmospheric pressure, - Precipitation, amount and intensity, - Humidity, and - Visibility
Meteorology Station Rainfall Station
Head Office Research & Weather Forecast
Head Office Climate
Royal Palace
Prim Minister Cabinet
Cabinet Minister of MOWRAM
Ministry of Information
Radio, TV, Newspaper
Provincial Dep. of WRAM
Other NGOs
Other User

74
4- Instruments, Sensor, Maintenance
The installation and maintenance of the instruments is responded by Head
Office of Equipment Management. The officers of Head Office of Equipment Management are able to repair only manned instrument. Actually, instruments are repaired when the data at station are reported as error and being installed when it is broken.
5- Quality Assurance/Quality Control ( real time, non-real time)
Global Telecommunication System (GTS) in Cambodia is frequency error in the connection system between Phnom Penh and Bang Kok.
The data transmitting to GTS is conducted only at 00 UTC, it is non-real time and not address to the framework of Global Observing System (GOS), it is done by the data are not provided from the local station, Technical Capacity is limited and Low cost resolution.
20 Synoptic station are provided the real data only Phnom Penh and Siem Reap, and 18 Synoptic stations provided only one or two data such as Air temperature and Surface wind, all these done its lack of instrument.
6- Training
The National Weather Center provides the job-training to the staff of the
Local observation stations on operation and maintenance of the weather observation station the weather observation by providing as lecture and practice.
7- Statistics issues and Applications
- Produce surface weather map and Upper Air charts,
8- Current issues and future plan
- Build technical capacity to the staff - Reinstall Automatic Station - Install Upper Air Weather Observation - Improve telecommunication service - Improve observation data management

75
China
JMA/WMO Workshop on Quality Management in Surface, Climate and Upper-air Observations in RA II (Asia)
Tokyo, Japan
27-30 July 2010
Doc.
Country ________
( .VII.2010)
QUALITY MANAGEMENT IN SURFACE, CLIMATE AND UPPER-AIR OBSERVATIONS IN CHINA
Zhang Hongzheng
National Meteorological Information Centre of CMA, Beijing, 100081, P.R.China
Meng Zhaolin Meteorological Observation Centre of CMA, Beijing, 100081, P.R.China
Summary and Purpose of Document This paper has attended the characters of China surface, climate and up-air
stations which are exchanging data in RA II, including the number of stations, distribution map, instruments upgrade and maintenance, quality control etc. The total number of surface observation stations for exchange in China is 220, the number of up-air stations is 83. Since 2002, the instrument has been upgraded gradually, and now all these stations are AWS. Atmospheric Observing System Operations and Monitoring (ASOM) has been built up for the instruments tracing and maintaining. The operational quality control of meteorological data in China can be divided into real-time and non-real-time quality control in terms of effectiveness for a given period of time. Real-time QC is for the real-time data, non-real-time QC is for the storage and archived data. Many forms of data product have been used in a lot of fields like education, medicine, and agriculture etc.

76
QUALITY MANAGEMENT IN SURFACE, CLIMATE AND UPPER-AIR OBSERVATIONS IN CHINA
Zhang Hongzheng1 Meng Zhaolin2
1 National Meteorological Information Centre of CMA, Beijing 2 Meteorological Observation Centre of CMA, Beijing
July 2010
1. Introduction In China, operational meteorological observation network comprises observing facilities on land, at sea, in the air and in outer space. The observation network is used in weather, climate and professional meteorology observation services. This paper will introduce conventional meteorological surface and upper-air observing networks, the number of stations within RBSN, RBCN, GSN/GUAN and the distribution map. Also discuss the Instruments and sensors’ upgrade and maintenance , and quality management of observation data etc.
2. Observation Networks
2.1 Surface observation network
The total number of surface observation stations for exchange through the Regional Basic
Synoptic Network (RBSN) is 219, and the number of surface stations for exchange through the
Regional Basic Climatological Network (RBCN) is 82, out of which 81 (with only exception of the
station with the index number 50527) also function as RBSN stations at the same time. The
number of surface stations from China participating in the Global Climate Observing System
(GCOS) Network (GSN) is 33, which are all RBCN observation stations. All these stations are
Automatic Weather Stations (AWS), but such elements as cloud and weather phenomena still rely
on manual observations. A list of the stations is given in Table 1; and for their distribution, please
see Figure 1.
Table 1 Number of China’s surface stations
RBSN RBCN GSN Manned
stations AWS
Number 219 82 33 / 220
Figure 1 Distribution of China’s surface stations

77
The transmission frequency of China’s SYNOP reports for exchange via RBSN is 4 times per
day, i.e. at 00, 06, 12, 18 UTC respectively. Normally each transmission will be completed 30
minutes after each synoptic observation hour. China’s surface CLIMAT messages for exchange
through RBCN are transmitted once a month, i.e. the message transmission is made at 06 UTC on
the 4th day of each month. The work flows for transmitting both SYNOP and CLIMAT reports are
identical, i.e. real-time data acquisition by observing station network, logging in AWS data files
immediately after automatic quality control, automatic coding, human interventions by adding
manual observations of such elements as weather phenomena and clouds, transmission to a
provincial data centre, retransmission to the National Meteorological Data Centre, report sorting at
the National Meteorological Data Centre, format checking, and dissemination via GTS to other
relevant international centers. All observational data and reports transmitted to the National Data
Centre shall be archived. A flow diagram is given in Figure 2.
Figure 2 Flow diagram for data transmission
2.2 Upper-air observation network
The total number of China’s upper-air sounding stations for exchange through the Regional
Basic Synoptic Network (RBSN) is 82; the number of upper-air stations that participate in regional
exchange via the Regional Basic Climatological Network (RBCN) is 43, in which 42 (except station
number 50527) are functioning as RBSN stations as well. The total number of the China’s
upper-air stations that have been included in the Global Climate Observing System (GCOS)
Network (GUAN) is 7, which are all RBCN stations. All these stations are automatic ones. The

78
number of upper-air sounding stations in China is listed in Table 2, and their distribution is shown
in Figure 3.
Table 2 Number of China’s upper-air sounding stations
RBSN RBCN GUAN Manned stations
Automated system stations
Number 82 43 7 / 83
Figure 3 Distribution of China’s upper-air sounding stations
The transmission frequency of China’s TEMP reports for exchange through RBSN is twice per
day, i.e. at 00 and 12 UTC respectively. Under normal conditions, each observation will be coded
and transmitted within 30 minutes after a synoptic hour. The CLIMAT TEMP messages for
exchange through RBCN are transmitted once a month, i.e. at 06 UTC on the 4th day of every
month. The transmission procedure is identical to that for transmission of SYNOP reports.
3. Instruments and sensors’ upgrade and maintenance 3.1 upgrade
In the past few years, all national surface station has installed the AWS by the CMA. The observations contain parameters such as wind direction and speed, temperature (atmospheric, ground and grass), atmospheric pressure and humidity; amount of precipitation; radiation automatically. But the weather phenomena, amounts, types and height of clouds, visibility are still observed by human as supplement. The observing data quality is needed to improve. The technique of the cloud, visibility and weather phenomena observation automatically is planned to develop.
Since 1950’s, the instruments of up-air sounding has renew 2 times. First, type 49 had been replaced by type 59-701. Second, L band electronic radiosonde and windfinding radar sounding system as a new generation sounding system to replace the old sounding system (Type 59-701 Mechanical Radiosonde and Secondary Windfinding Radar). By 2010, April, almost all up-air stations have been replaced by L band sounding system.
3.2 Maintenance
A near real-time monitoring system of China meteorological observation network has been built up, named as Atmospheric Observing System Operations and Monitoring (ASOM). It monitors national surface observation system and upper-air sounding system. ASOM contains several subsystems, including equipments operation monitoring, observation data monitoring,

79
equipment maintenance management, logistic management and observation site management.
3.2.1 Equipments operation monitoring Based on parameters and certain model, equipment operation monitoring will show some
indexes by processing and judging operational status, such as normal, alarm and so on, and it will display these statuses in many ways. Real-time monitoring can directly show the equipment status by overlapping on the Chinese electrical map with some special flags with a updating period of 1 hour for AWS. Historical monitoring figures can show the equipment operational status in any time or any period with time series. Station synthetically displaying can gather figures, parameters and alarm information, which is benefit for analyzing both equipment status and products quality.
3.2.2 Equipment maintenance management
Equipment maintenance management can realize life management and it can also offer supporting platform to improve maintenance level by archived the life time of the equipment from registration. It contains equipments maintain management, equipments repairing, maintenance and repairing experiences and knowledge management and things. In this subsystem, the uniform equipment ID is taken the module function chain, the equipment’s maintaining and repairing status can be traced by the ID. When the equipment is down, all processes are filled in the form, and the different people from different sections will fill the same form in one accident. The national and the province center can collector these repairing experiences to form the knowledge database and sharing it so as to convenient for the following equipments maintenance and repairing work.
3.2.3 Logistic management
Logistical management realizes the meteorological equipments, meteorological apparatuses’ lifetime tracing and management using the uniform equipment’s ID number. Logistic management includes calibration and license modules. Calibration module establishes a database for supervising instrument calibration valid periods, which has alarm, and statistics function. Logistics management realized plan, stock, supply and storage in the internet. On the basis of operation and consumption, it can form stock plan and submit report by corresponding approval procedure then carry out stock in the internet and issue storage status at the same time. License module has realized declaration, experimentation, approval and search information management and has standardized management flow. Technology rules, regulations, criterions, database and information searching platform were established.
It will also generators some evaluation results, such as the consumption of the different equipments, the number of the stock and warehousing in one time and the top 10 purchase and so on.
3.2.4 Observation site management
Observation site management includes the management of the people, all equipments and the whole site environment in China meteorological observing network. It supplies this foundation information for the other subsystems. It has some basic information about stations, equipment types, numbers, observation items and update information about the sensors.
4. Quality Control
The operational quality control of meteorological data in China can be divided into real-time
and non-real-time quality control in terms of effectiveness for a given period of time. In the whole
process from data collection to data sending, storing and archiving (see Figure 2), real-time quality
control should ensure the timeliness of data. Simple quality control methods can be used to
achieve automated processing without manual intervention. Non-real-time quality control is
targeted at monthly data or accumulated real-time data reported by stations. It uses more
comprehensive quality control techniques, which is mainly based on computers and supplemented
by manual intervention, combines both manual intervention and computers.
4.1 Real-time quality control
Real-time quality control is first made at the station level. The data will be sent, via provincial
data center, to National Data Center. In this process, at the provincial level, real-time quality

80
control is not made for data uploaded from stations to National Data Center. At the national level,
real-time quality control is made so that these data are provided to domestic users and sent to
overseas data centers through international communication system GTS after sorting, coding, and
format checking.
4.1.1 Real-time quality control at the station level
Observing stations collect data in a real-time manner, and check the data against climatic
extreme and element allowance range (B-QC), check element continuity (E-QC) and element
consistency. Then, the results of these checks are written into AWS data collection files. In the
process of data quality control, it is necessary to identify whether quality control is made on
sampling instantaneous value and instantaneous meteorological value, as well as the results of
quality control. This identification is used to qualitatively describe data confidence. The
specifications of the identification are given in Table 1.
Table 3 Data quality control identifiers
ID code Description
0 “Right”: the data does not exceed a given limit.
1 “Doubtful”: not credible.
2 “Wrong”: erroneous data that exceeds a given limit.
3 “Inconsistent”: one or more parameters are inconsistent; the relationship
between different elements does not meet the required standards.
4
“Checked”: Raw data that are identified as doubtful, wrong or
inconsistent and that are reconfirmed as right using other verification
procedures.
8 “Missing”: Data are missing.
9 “Not checked”: the variable has not been checked for quality control
purpose.
N No sensors. No data.
Note: If instantaneous meteorological values lack measurement data due to collectors
or telecommunication, directly give “missing” when the terminal commands a
data output, and the corresponding quality control is identified as “8”. If data are
available, which are judged as wrong by the quality control, and when the
terminal commands a data output, their values are still given, and the
corresponding quality control is identified as “2”, but the erroneous data can not
participate in subsequent computing or accounting.
4.1.2 National real-time quality control
4.1.2.1 Ground
The quality of data for regular observation messages in national real-time ground observation
data is controlled. Elements under quality check include air pressure, temperature, dew point
temperature, wind direction and speed, and precipitation. Quality control includes:
(1) Limiting value or allowable values of climate
First of all, elements are checked against the limiting value or allowable values of climate
according to Table 4. If the value of an element exceeds the limit or allowable values of
climate, then it is wrong. The quality control code is set to be 2;
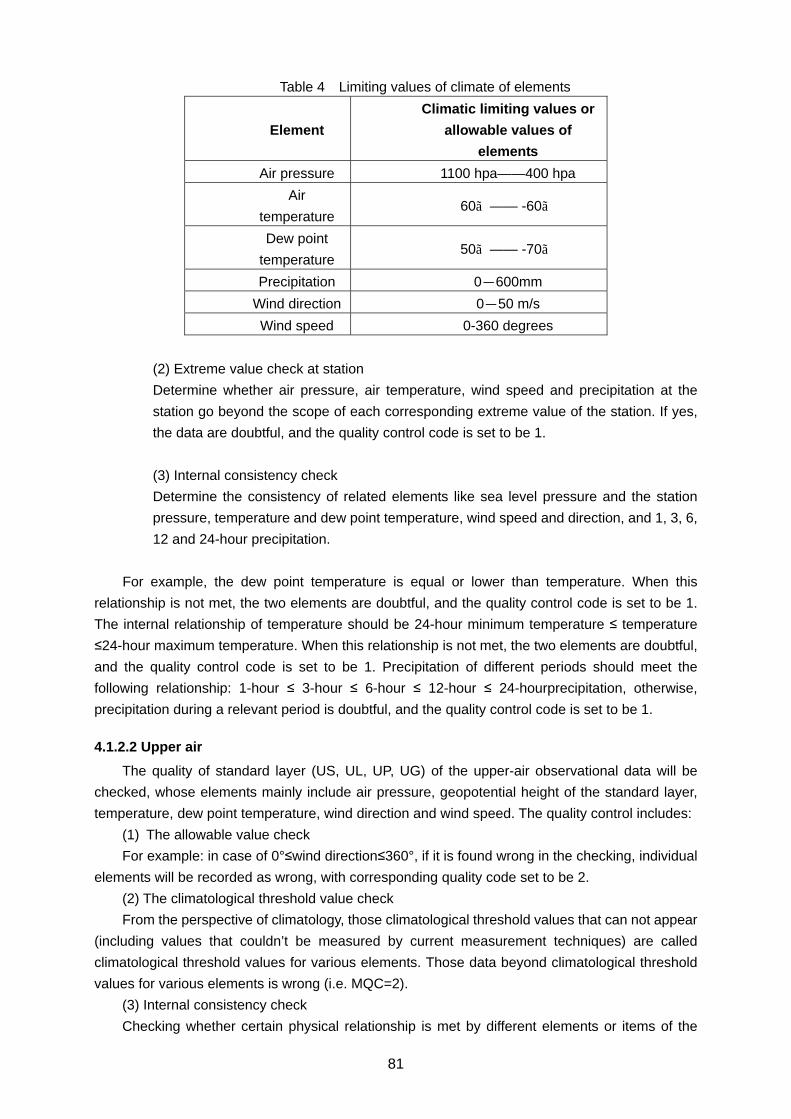
81
Table 4 Limiting values of climate of elements
Element
Climatic limiting values or
allowable values of
elements
Air pressure 1100 hpa——400 hpa
Air
temperature 60℃—— -60℃
Dew point
temperature 50℃—— -70℃
Precipitation 0-600mm
Wind direction 0-50 m/s
Wind speed 0-360 degrees
(2) Extreme value check at station
Determine whether air pressure, air temperature, wind speed and precipitation at the
station go beyond the scope of each corresponding extreme value of the station. If yes,
the data are doubtful, and the quality control code is set to be 1.
(3) Internal consistency check
Determine the consistency of related elements like sea level pressure and the station
pressure, temperature and dew point temperature, wind speed and direction, and 1, 3, 6,
12 and 24-hour precipitation.
For example, the dew point temperature is equal or lower than temperature. When this
relationship is not met, the two elements are doubtful, and the quality control code is set to be 1.
The internal relationship of temperature should be 24-hour minimum temperature ≤ temperature
≤24-hour maximum temperature. When this relationship is not met, the two elements are doubtful,
and the quality control code is set to be 1. Precipitation of different periods should meet the
following relationship: 1-hour ≤ 3-hour ≤ 6-hour ≤ 12-hour ≤ 24-hourprecipitation, otherwise,
precipitation during a relevant period is doubtful, and the quality control code is set to be 1.
4.1.2.2 Upper air
The quality of standard layer (US, UL, UP, UG) of the upper-air observational data will be
checked, whose elements mainly include air pressure, geopotential height of the standard layer,
temperature, dew point temperature, wind direction and wind speed. The quality control includes:
(1) The allowable value check
For example: in case of 0°≤wind direction≤360°, if it is found wrong in the checking, individual
elements will be recorded as wrong, with corresponding quality code set to be 2.
(2) The climatological threshold value check
From the perspective of climatology, those climatological threshold values that can not appear
(including values that couldn’t be measured by current measurement techniques) are called
climatological threshold values for various elements. Those data beyond climatological threshold
values for various elements is wrong (i.e. MQC=2).
(3) Internal consistency check
Checking whether certain physical relationship is met by different elements or items of the

82
station is called internal consistency check. Upper-air data refers to multi-layer data extending
vertically in the space. The consistency of related elements in the same layer is checked only in
the quality control scheme, not involving in elements of many layers. For example, for the air
temperature and dew point temperature, if the air temperature is lower than the dew point
temperature in the same layer, then at least one item of the air temperature and dew point
temperature is wrong, with the quality control code set to be 1 respectively for the two elements.
Through the aforementioned real-time quality control, statistics is taken for quality check
results of international exchange stations from Jan. to Jun. 2010, with erroneous data accounting
for 0.01% of the total data. The percentage of various types of errors is shown in Table 5.
Table 5 error type and percentage of quality control of real-time data
Error type Percentage
Equipment failure 44.44%
Operation failure 37.04%
Unexplained 18.52%
4.2 Message format check
Once the real-time observational data from observation network is uploaded to the National
Data Centre, the format of the message will be checked. The checking includes integrity of the
bulletin (mainly checking the starting line, end line, correctness of the bulletin length), header
(checking the bulletin header format, the correctness of time group), bulletin content (checking the
bulletin formats of various kinds of data according to the WMO Manual on Codes (WMO-No.306).
For ground report FM12, upper-air report FM35, ground monthly report FM71, upper-air monthly
report FM75, etc., the format of each set of data and each report will be checked. After format
checking, the correct data will be sorted and coded, and sent to overseas data centre by GTS.
4.3 Non-real-time quality control
For monthly report or accumulated real-time data from stations, more comprehensive quality
control techniques are applied to non-real-time quality control, which is mainly based on computer
and supplemented by manual intervention, and combines both manual intervention and computer.
At present, an operational flow consisting of a three-level quality control system has been
established for monthly and annual reports from ground AWSs and manual stations. The
operational flow of the three-level quality control system is given in Figure 4, which includes station
QC, provincial QC and national QC. The station QC means that stations make quality inspection
and preliminary examination of data using station-level quality control software and submit those
qualified data to provincial data processing center. Provincial QC means that the said data files are
collected from stations within the province during specified time of each month. The data file will
undergo quality inspection and man-computer interactive examination with provincial quality
control software, while the information on quality inspection will be fed back to stations. The data
will be submitted to National Meteorological Information Center after it is confirmed to be qualified
through re-inspection. National QC means that data files are collected from provinces during
specified time of each month. With national quality control software, rolling format examination and
quality inspection will be conducted for the data files, while data check and processing will be
made with human-computer interactive interface. Meanwhile, information on final quality control
will be fed back to provinces, which will be kept in the archives of the Data Office of the National

83
Meteorological Information Center after it is confirmed to be qualified.
Figure 4 Flow chart of three-level quality control system
In the three-level quality control system, quality control is the core of the system as a whole.
National and provincial QC processes are shown in Figure 5. The QC process at the station level
is similar to Figure 6 but without spatial consistency check. In Figure 6, all links from format check
to consistency check are automatically controlled by software.
Figure 5 The flow chart of QC process
Fully automated quality control cannot solve all problems of data quality. For some special
cases or problems, manual check is used as a supplement to make judgment. Manual check can
be done at any level of quality control, which is the man-machine interactive quality control carried
out on suspicious or erroneous data after automatic control mentioned above. According to data
comparison, graphical analysis, inquiry stations, neighborhood stations comparison and manual
analysis judgments, it is ultimately determined whether to modify or revise data, and determines
quality control code corresponding to element value.
Following the quality control process, each data must be marked with quality-control flag,
quality-related information has to be archived for reference of data processors and users. In
monthly report, intervals have been set for storing information on data quality which contains
quality-control codes and data amendments.
Quality control code representing quality status of observational data, according to the
operational process, can be divided into three levels: station level, provincial and national level.
Quality control code is represented by an integer of three digits, with one digit standing for national
level, tens digit for provincial level, and hundred's digit for station level. The meaning of quality
control code at all levels is as follows:
0:Data correct
1:Data suspicious
2:Data error
3:Data with corrected value
4:Data has been corrected
8:Lack Measured Data
9:Data without quality control
In the quality control process, it is allowed to correct doubtful data and data lacking

84
measurement. Data correction includes data revising and data modification. Data revising refers to
doubtful data or lacking of measured original observational data, a kind of data calculated and
estimated through a given statistical method. This data does not replace the original data in
observational data, only recording its revised data in data correction information. Data modification
means that the original observational data is wrong, confirming the correct data after inquiries,
which replaces the original data in observational data, while recording its modification status in
data correction information. The corrected quality control codes are 3 or 4.
5. Training Activities
Training centers have been established in both national and provincial meteorological
departments, which bear the responsibility for training employees at all levels of meteorological
departments on basic meteorological knowledge, station network maintenance, forecasting
operation, observation and detection technology, quality control technology. What's more, an
integrated observing training/practice base was established to carry out online distance training.
Through training, the operational personnel would deeply understand practice of meteorological
observations and detection, master methods and operational requirements of meteorological
observations and detection, and grasp basic principles of quality inspection and automatic quality
control software operation. This will improve the operational capacity of meteorological technical
personnel at all levels, ensure the quality of uploaded data, so as to meet the requirements for
meteorological data in operational service and scientific researches.
6. Data Statistics and Application
6.1 The Climate standard value
WMO recommends that all the countries collate and prepare statistics for climate data taking
30 years as the standard, so as to facilitate WMO to issue a global climate standard value and to
provide services for the national governments. Many member countries of WMO including China
also stipulate that the climate standard value will be updated every ten years, in order to describe
the average pattern of climate in 30 years, which is also regarded as the reference object for
current climate condition. Meanwhile, climate standard value can be used to divide regional
climate, providing extensive support to such areas as basic residential environment, agriculture,
natural vegetation, energy utilization, transportation, tourism and environment research. China’s
30-year (i.e. 1951-1980, 1961-1990, and 1971-2000) meteorological data have been collated and
compiled for three times (Figure 9). At present, preparations are underway to collate and compile
the fourth 30-year (i.e. 1981-2010) meteorological data.
6.2 Data homogenization
Regarding data homogenization, studies on homogeneous verification and correction for data
from surface and upper-air sounding stations nationwide are being carried out. Homogeneous
verification for daily and monthly series of temperature, precipitation and upper-air temperature
has been preliminary completed (see Figure 6).

85
Figure 6 Verification of data homogenization
6.3 Application of meteorological data to various sectors
As meteorology is related to all aspects of national economy and scientific research, there are
extensive and urgent needs for meteorological data. Meteorological data are applied to many
sectors such as education, scientific research, government, agriculture, forestry, water
conservancy, military, pharmacy, ocean, railway, public security, media and environment protection.
Figure 7 presents a distribution chart of user groups based on statistics by sectors. Evidently,
major user groups are from scientific institutions, colleges and universities followed by
meteorological sectors, while the rest users are from earth science, agricultural science,
bio-science, water engineering, and medicine and health sectors. All of them are professional staff
involving in national scientific and technological projects, such as 863, 973 and the Natural
Science Foundation, etc.
16.35
29.81
9.62 6.73
2.88
2.88
2.88 1.92
2.88
9.62
0.96 13.46
Chinese academy of Sciences UniversityArmy Forestry
Geology Ministry of Industry and InformationMinistry of Water Source China Aerospace CorporationMedicine GovernmentAgriculture Others
Figure 7 Sectors applying meteorological data
7. Existing problems and future plan
The improvement of observation data quality is needed. Although the electronic radiosonde in
use has obviously been improved compared to mechanical ones, the stability and accuracy should
further be increased to meet the requirements of climate observation. The high accuracy sensor of
the pressure, temperature and humidity is planned to develop.
Quality control schemes need to be improved, and quality control is not used effectively for all
observing elements. For example, quality control schemes are not developed for significant level,
surface layer and L-band minute-level data for upper-air sounding data. Therefore, more efforts
Observation time changed in April

86
should be made to develop quality control schemes and put them into operation.
Metadata are limited, and a large amount of metadata are still archived in different stations,
leading to uncertainties in judgment of data breakpoints, since it is hard to identify whether
breakpoints are caused by natural variability or by other factors such as observing methods,
changing of instruments. In this regard, cooperation should be enhanced with stations to collect
metadata as much and soon as possible.
It is necessary to improve capabilities of data observers and recorders, allowing them to
comprehensively and scientifically understand physical meaning and algorithm of observing
elements, strengthening, meanwhile, operational practices to reduce or avoid data quality
problems caused by human factors as far as possible.
Acknowledgments: We thank Ren Zhihua, Li Xiang, Yang Zhibiao and Chen Zhe for their kindness help for this report. Also, thanks go to Li Wei, Zhang Zhifu, Yu Yu and Yu Jingjing for their help with software and other technical issues.

87
Hong Kong, China
JMA/WMO Workshop on Quality Management in Surface,
Climate and Upper-air Observations in RA II (Asia)
Tokyo, Japan 27-30 July 2010
Doc.
Country ________
( .VII.2010)
Country Report of Hong Kong, China (Submitted by H Y Mok, Hong Kong Observatory)
Summary and Purpose of Document
This country report describes the operation of the meteorological and climatological monitoring network of Hong Kong, China being operated by the Hong Kong Observatory. Besides operational details, the quality assurance programme being used for data quality assurance is also described.
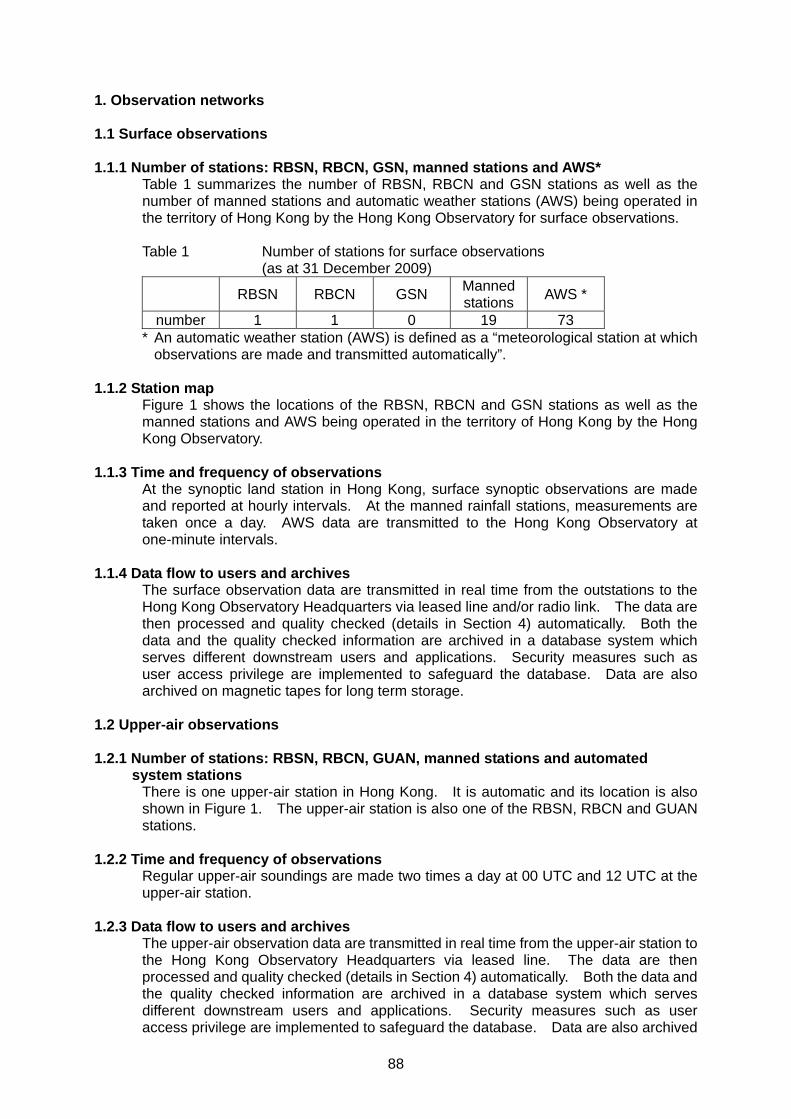
88
1. Observation networks 1.1 Surface observations
1.1.1 Number of stations: RBSN, RBCN, GSN, manned stations and AWS*
Table 1 summarizes the number of RBSN, RBCN and GSN stations as well as the number of manned stations and automatic weather stations (AWS) being operated in the territory of Hong Kong by the Hong Kong Observatory for surface observations. Table 1 Number of stations for surface observations (as at 31 December 2009)
RBSN RBCN GSN Manned stations
AWS *
number 1 1 0 19 73 * An automatic weather station (AWS) is defined as a “meteorological station at which
observations are made and transmitted automatically”.
1.1.2 Station map Figure 1 shows the locations of the RBSN, RBCN and GSN stations as well as the manned stations and AWS being operated in the territory of Hong Kong by the Hong Kong Observatory.
1.1.3 Time and frequency of observations
At the synoptic land station in Hong Kong, surface synoptic observations are made and reported at hourly intervals. At the manned rainfall stations, measurements are taken once a day. AWS data are transmitted to the Hong Kong Observatory at one-minute intervals.
1.1.4 Data flow to users and archives
The surface observation data are transmitted in real time from the outstations to the Hong Kong Observatory Headquarters via leased line and/or radio link. The data are then processed and quality checked (details in Section 4) automatically. Both the data and the quality checked information are archived in a database system which serves different downstream users and applications. Security measures such as user access privilege are implemented to safeguard the database. Data are also archived on magnetic tapes for long term storage.
1.2 Upper-air observations 1.2.1 Number of stations: RBSN, RBCN, GUAN, manned stations and automated
system stations There is one upper-air station in Hong Kong. It is automatic and its location is also shown in Figure 1. The upper-air station is also one of the RBSN, RBCN and GUAN stations.
1.2.2 Time and frequency of observations Regular upper-air soundings are made two times a day at 00 UTC and 12 UTC at the upper-air station.
1.2.3 Data flow to users and archives
The upper-air observation data are transmitted in real time from the upper-air station to the Hong Kong Observatory Headquarters via leased line. The data are then processed and quality checked (details in Section 4) automatically. Both the data and the quality checked information are archived in a database system which serves different downstream users and applications. Security measures such as user access privilege are implemented to safeguard the database. Data are also archived

89
on magnetic tapes for long term storage.
2. Siting and metadata The siting of weather stations for surface observation generally follows the guidelines given in the WMO “Guide to Meteorological Instruments and Methods of Observation, WMO-No. 8 (CIMO Guide)”. For metadata, the Hong Kong Observatory compiles annually a publication to provide users with comprehensive information of how, where, when and what surface observations are made at weather stations in Hong Kong. The metadata format and layout adopted in the publication generally follow the guidelines and recommendations suggested in the WMO "Guidelines on Climate Metadata and Homogenization, WMO-TD No. 1186”. The historical records of measuring instruments at each station and the station location, including latitude, longitude and altitude, are given in the publication.
3. Instruments, sensors, upgrade, maintenance, instrument intercomparisons and
traceability In recent years, several Heat Stress Measurement Systems (system measuring the Wet Bulb Globe Temperature (WBGT)) have been installed at some automatic weather stations in the urban and rural areas. A network of weather camera has also been implemented to assist forecasters in the monitoring of weather conditions, visibility and sea conditions, and to provide the public and special users with real-time weather photos.
To maintain high data availability, backup instruments using independent data transmission paths are installed at strategic AWSs to provide data redundancy. The Observatory implements calibration procedures for meteorological sensors to ensure that the measurement results are traceable to the System International (SI) standard. Solar radiation instruments are calibrated using a PMO-6 absolute radiometer, which itself is kept traceable to the WRR through intercomparisons with the regional standard kept by the Japan Meteorological Agency every 5 years. Sunshine duration and UV-Index radiometers are calibrated at factory every 2 years. From December 2007 to January 2008, the Observatory carried out a comparison of the Hong Kong Standard Barometer with the Japan Meteorological Agency’s Primary Standard Barometer through the use of travelling standards. In 2009, the Observatory upgraded its pressure standard from a Kew-pattern mercury barometer (WMO Class C barometer) to a high-accuracy digital barometer (WMO Class B barometer).
4. Quality assurance / quality control (real-time, non-real time)
The Hong Kong Observatory has implemented quality assurance procedures to carry out quality check and control of observational data both on a real-time and non-real-time basis. The AWS data received by the central data acquisition system at the Hong Kong Observatory Headquarters are passed to an Integrated Meteorological Data Quality Assurance System (System) for real-time data quality check and control. The System is highly automatic. Through various real-time QC procedures including range test, trend (jump) test and consistency test, the System carries out quality assurance for each data received from the AWS by assigning a quality assurance flag to the data, filtering out erroneous data from the AWS, and alerting maintenance staff to action via automatic email. Operation of the AWSs can also be monitored via a webpage which displays the status of the AWS network in real-time. The automatic alerting feature enables early detection and diagnosis of faults as well as enhancing data availability. Apart from monitoring the operation of the AWS, the quality assurance flags also serve as an indication of quality, facilitating reference by users in future studies. The quality check and control procedures generally follow the “Guide on the Global
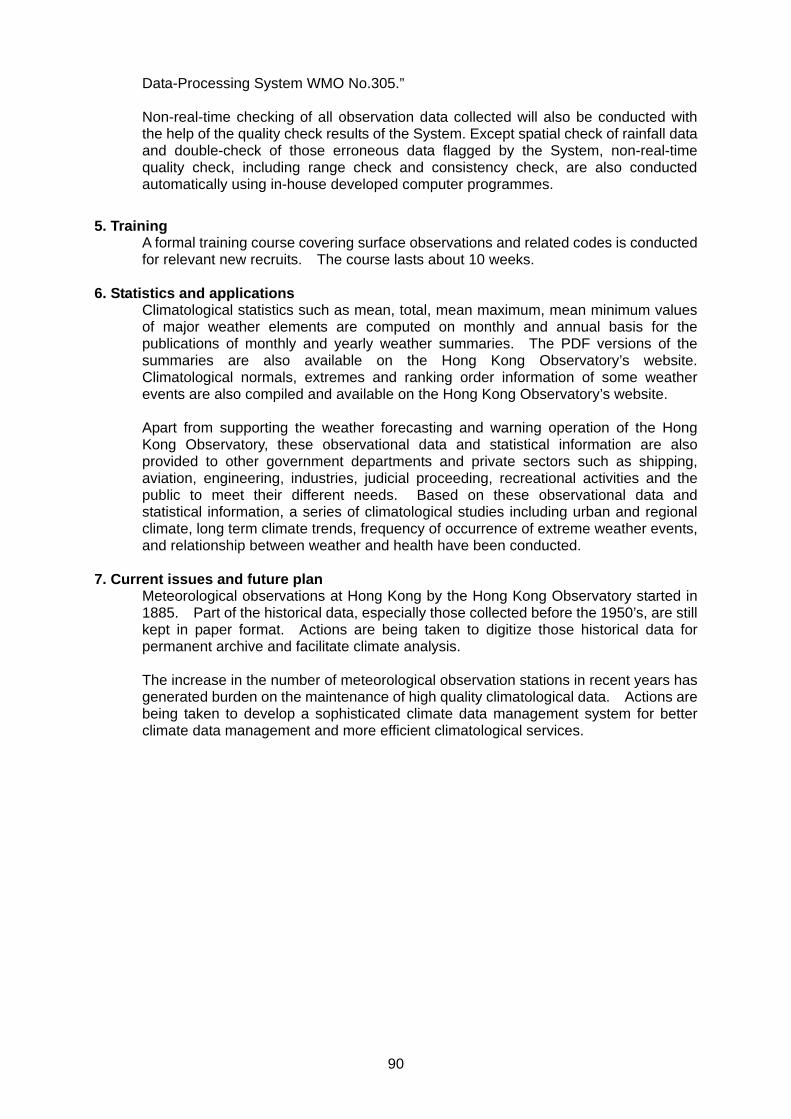
90
Data-Processing System WMO No.305.” Non-real-time checking of all observation data collected will also be conducted with the help of the quality check results of the System. Except spatial check of rainfall data and double-check of those erroneous data flagged by the System, non-real-time quality check, including range check and consistency check, are also conducted automatically using in-house developed computer programmes.
5. Training A formal training course covering surface observations and related codes is conducted for relevant new recruits. The course lasts about 10 weeks.
6. Statistics and applications Climatological statistics such as mean, total, mean maximum, mean minimum values of major weather elements are computed on monthly and annual basis for the publications of monthly and yearly weather summaries. The PDF versions of the summaries are also available on the Hong Kong Observatory’s website. Climatological normals, extremes and ranking order information of some weather events are also compiled and available on the Hong Kong Observatory’s website. Apart from supporting the weather forecasting and warning operation of the Hong Kong Observatory, these observational data and statistical information are also provided to other government departments and private sectors such as shipping, aviation, engineering, industries, judicial proceeding, recreational activities and the public to meet their different needs. Based on these observational data and statistical information, a series of climatological studies including urban and regional climate, long term climate trends, frequency of occurrence of extreme weather events, and relationship between weather and health have been conducted.
7. Current issues and future plan Meteorological observations at Hong Kong by the Hong Kong Observatory started in 1885. Part of the historical data, especially those collected before the 1950’s, are still kept in paper format. Actions are being taken to digitize those historical data for permanent archive and facilitate climate analysis. The increase in the number of meteorological observation stations in recent years has generated burden on the maintenance of high quality climatological data. Actions are being taken to develop a sophisticated climate data management system for better climate data management and more efficient climatological services.

Legend* Manned Weather Station
▲ Automatic Weather Station (AWS)■ AWS with wind measurement only◆ AWS with rainfall measurement only● Automatic Weather Buoy Station╬ Manned Rainfall Station
▲
EPC
▲
TAP
▲
KAT
▲
▲
▲
▲
▲/╬
■
SCTMT
■
▲
TKL
▲
TU1
▲
▲
▲
▲
▲
▲
■ ▲CPH
CSW■
114° 10' E
114° 20' E
114° 30' E
22° 20' N 22° 20' N
22° 30' N
▲/╬●
▲
22° 30' N ◆
◆
◆/╬R28
◆
R29
◆R24
SHA
◆
╬180
╬
╬150
152
╬104
157
◆/╬81
28
65
╬146
╬16
╬ 20
╬103
▲◆
R21
▲
■ TUN
SSH
PLC R31
LFS
◆
R23
TPO
R27
SEK
WLP
TMS
TWN
◆R25
TYW
R32
SK
TC
JKB
KLTSHL
R22
▲KSC
▲WTS
▲KT
For surface observations, HKA is RBSN station and KP is the RBCN station.
Figure 1 Locations of surface and upper-air stations in Hong Kong as at 31 December 2009
Note: A station code is assigned to each station.
For upper-air obervations, KP is RBSN, RBCN and GUAN station.
Legend* Manned Weather Station
▲ Automatic Weather Station (AWS)■ AWS with wind measurement only◆ AWS with rainfall measurement only● Automatic Weather Buoy Station╬ Manned Rainfall Station
▲
EPC
▲/★
▲
TAP
▲
▲
KAT
▲
▲
▲
▲
▲/╬
■
SC
■TO
TMT
■
▲
TKL
▲
TU1
▲
▲
▲
■SW
▲■
▲▲
■
▲
PEN
▲
▲
▲
▲
▲
■
■ ▲CPH
CSW■
▲
114° 10' E
114° 20' E
114° 30' E
114° 20' E114° 10' E114° 0' E 22° 10' N
22° 20' N 22° 20' N
22° 30' N
■
*/╬▲/ HK
▲
▲
GI
■
km
Scale
0 2 4 6 8 10
KP▲/╬
WB2●
▲ / */ ╬HKA
●
WB3
▲
◆
22° 30' N ◆
◆
◆/╬R28
◆
R29
◆R24
SHA
◆
◆
◆
◆
R13
◆ /╬R12
╬ 68
184
185
158
24╬/▲
╬180
╬
╬150
152
╬104
157
◆/╬81
128
65
╬146
╬16
╬ 20
╬103
▲
▲▲
NGP
◆
R21
▲
■ TUN
SSH
PLC R31
LFS
◆
R23
TPO
R27
SEK
WLP
TMS
TWN
◆R25
TYW
R32
SK
TC
R18
JKB
KLT
SE
SHL
SFCP1
NP R19
SKW
BHD
WGL
R14
VP1HKP
CCH
SHW
YTS
SL
NLS
◆
R11
R22
╬
╬84HKS
HP
▲KSC
■CCB
▲WTS
▲SWH
▲KT
▲ STY
91

92
India
JMA/WMO Workshop on Quality Management in Surface,
Climate and Upper-air Observations in RA II (Asia)
Tokyo, Japan 27-30 July 2010
Doc.
Country INDIA
( .VII.2010)
COUNTRY REPORT
By M K Gupta Scientist-E
Instrument Division India Meteorological Department
Pune
Summary and Purpose of Document
The document is submitted as per the requirement stipulated in the invitation letter for JMA/WMO WORKSHOP ON QUALITY MANAGEMENT IN SURFACE, CLIMATE AND UPPER-AIR OBSERVATIONS IN RA II (ASIA)
The document describes the status of Meteorological Observation in India including quality control, instrumentation, training and other related aspect thereof.

93
A GUIDE TO WRITING A COUNTRY REPORT AND PRESENTATION 1. Observation networks 1.1 Surface observations
1.1.1 Number of stations: RBSN, RBCN, GSN, manned stations and AWS
Table 1 Number of stations
RBSN RBCN GSN Manned stations
AWS ARG
number 82 44 20 528 425 * 324 # * Further addition in progress. Total planned : 675 ** Further addition in progress. Total Planned :1350
1.1.2 Station map
Maps showing locations of the RBSN, RBCN and GSN station : Fig. 1 to 3 Maps showing locations of the manned station and AWS : Fig 4 & 5
1.1.3 Time and frequency of observations
All surface stations included in the regional basic synoptic network take surface observations at the four main standard times of observation, i.e. 0000, 0600, 1200 and 1800 UTC, and at the four intermediate standard times of observation, i.e. 0300, 0900, 1500 and 2100 UTC.
1.1.4 Data flow to users and archives
Illustrated in Fig 9 1.2 Upper-air observations 1.2.1 Number of stations: RBSN, RBCN, GUAN, manned stations and automated
system stations
RBSN RBCN GUAN Manned stations
Automated system stations
number - 20 - 39 -
1.2.2 Station map Map showing locations of the RBCN upper-air stations : Fig.6 Map showing locations of all upper-air and Pilot balloon stations : Fig. 7 & 8
1.2.3 Time and frequency of observations upper air observations are made and reported at 0000 UTC and 1200
UTC. Pilot balloon observations are made and reported at -
o 0000 UTC and 1200 UTC where Radiosonde observation not taken
o 0600 UTC and 1800 UTC where Radiosonde observation are taken

94
1.2.4 Data flow to users and archives Illustrated in Fig 9
2. Siting and metadata
Outdoor instruments are installed on a level piece of ground, approximately 10 m x10 metres, covered with short grass or a surface representative of the locality, and surrounded by open fencing. Within the enclosure, a bare patch of ground about two metres by two metres is reserved for observations of the state of the ground and of soil temperature at depths of equal or less than 20 centimetres. There should be no steeply sloping ground in the vicinity and the site should not be in a ditch. The site should be well away from trees, buildings, walls or other obstructions. The distance of any such obstacle (including fencing) from the raingauge should not be less than twice the height of the object above the rim of the gauge, and preferably four times the height. Metadata consists of station name, latitude, longitude, altitude, height (above ground) of pressure and wind measuring instrument, details of obstruction if any,
3. Instruments, sensors, upgrade, maintenance, instrument intercomparisons
and traceability India belongs to that select group of countries who manufacture their own
upper air and surface instruments. This is done by the meteorological department through in-house production facilities
All instruments at surface stations are checked and compared once a year with portable standard that are traceable to national standards. National standards are also regularly compared and calibrated against international /WMO standards.
The maintenance of modern electronic instruments is a matter of concern. Availability of spare part is restricted to its manufacturer and sometime too costly. Lack of skilled manpower for maintenance is another difficulty towards upgrade to modernization/ automation.
4. Quality assurance / quality control (real-time, non-real time)
Manual QC is applied at manned synoptic station by comparing with long term normals (Averages) at observer’s intelligence. QC algorithms for AWS is under development
SYNOP/TEMP messages are checked for proper WMO format at communication centres before forwarding to users. Any message found erratic is flagged for manual correction.
Suitable software of 10 day moving averages is run for checking errors in meteorological parameters. Doubtful values are flagged for manual correction.
Hydrostatic quality checks is performed on upper air data at processing centres.
5. Training
The Central Training Institute (CTI) of the India Meteorological Department (IMD) is situated at a pleasant location at Pashan in Pune. IMD also has training centres at New Delhi for Upper Air Instrumentation.
Facilities for meteorological training at Pune and New Delhi have been recognized by the WMO to function as RMTC in all the four main

95
disciplines namely, General Meteorology, Meteorological instrumentation, Telecommunication and Agro-meteorology.
The training institute (CTI) has been continuously upgrading, keeping pace with technological advancement, its training capabilities, composition, objectives, contents, etc, in catering to personnel covering all levels from Class I to Class IV.
6. Statistics and applications
Application for surface and upper-air observations: Weather forecasting Climatology Agromet advisory Civil aviation Marine navigation Cyclone warning Hydrology and flood forcasting Environmental monitoring Supply of data to various users on demand
7. Current issues and future plan
Current issues: Non-availability of quality monitoring mechanism for AWS and ARG data
from large number of stations. Poor quality of radiosonde data due to poor accuracy (repeatability) of
baroswitch (pressure sensor) Future plans:
Development of algorithms and software for automatic quality monitoring of AWS and ARG data.
Development of indigenous GPS radiosonde
____________

96
Fig.1 GSN- Surface stations
Fig 2 RBCN-Surface stations
Fig 3 RBSN-Surface stations
Fig. 4 Manned surface stations

97
Fig 5 AWS netwirk
Fig 6 RBCN-Upper-air stations
Fig 7. Upper Air Stations
Fig 8. Pilot Balloon Stations

98
Fig 9 Surface and Upper-air Data flow to users and archives
Surface or
upperairstations
AMSS
RTH (Transmet)
Regional Meteorological Centres, State Meteorological Centres
and 15 international circuits
Text Synop & TEMP Message through email over internet or FTP over VPN
Socket communication
Bulletins every 10 min to real-time
users
Data entry
and file transfer to NDC
Archival after QC at NDC,
Pune

99
Japan
JMA/WMO Workshop on Quality Management in Surface, Climate and Upper-air Observations in RA II (Asia)
Tokyo, Japan
27 – 30 July 2010
Doc.
Japan ________
(10.VII.2010)
Country Report for Japan (Submitted by Kenji Akaeda, Japan Meteorological Agency)
Summary and Purpose of Document
This document contains an overview of surface and upper-air observations in Japan with respect to instruments, quality assurance/quality control, training, statistics and applications.

100
1. Observation networks 1.1 Surface observation 1.1.1 Number of stations: RBSN, RBCN, GSN, manned stations and AWS*
Japan has 156 meteorological observatories that perform observations of air pressure/temperature, wind, precipitation, visibility, weather and other elements to meet the general requirements of meteorological stations. Sixty-eight of these are observer-staffed weather stations, while the others are unmanned stations equipped with fully automatic instrumentation including visibility sensors. All these observatories are integrated into Japan’s AWS network, known as AMeDAS (the Automated Meteorological Data Acquisition System), which consists of more than 1,100 local observation stations all over the country. All AMeDAS stations measure precipitation, and approximately 690 of them also measure air temperature, wind and sunshine duration.
Fifty-two meteorological observatories (not including Syowa Station in Antarctica), both staffed and unstaffed, have been appointed as RBSN stations, whose data are utilized for international exchange. These stations have stably provided data of the accuracy level stipulated in the CIMO Guide (WMO-No. 8) for years. Accordingly, they have also been registered as RBCN stations and submit CLIMAT reports every month.
In consideration of observational record length, site environment and station density, 13 stations have been registered as GSN stations.
Table 1. Number of stations RBSN RBCN GSN Manned AWS *
Number 52 52 13 68 1,209
1.1.2 Station map Figure 1 shows the locations of the RBSN, RBCN and GSN stations, and Figure 2
shows the locations of manned stations and AWSs in Japan.
Figure 1. RBSN, RBCN and GSN stations in Japan Solid circles: RBSN/RBCN stations; double solid circles: GSN stations (also
RBSN/RBCN stations)

101
Figure 2. Meteorological observatories and AMeDAS stations (AWSs) in Japan 1.1.3 Timing and frequency of observations
Observations at almost all meteorological observatories (154 stations) are made and transmitted to the data-processing center at JMA’s headquarters every 10 seconds, with a 10-minute frequency for observations at other AWSs. 1.1.4 Data flow to users and archives All JMA observational data are transmitted to JMA’s headquarters, processed and quality-controlled in computing systems (see Figure 3). The data are utilized in weather and climate monitoring, statistical analysis and other prediction tasks, thereby benefitting the public in terms of disaster mitigation, transportation safety and improvements in life and industry.

102
JMA’s Headquarters (Tokyo)
QC/QA (real‐time)Numeric ranges, intra‐consistency
checks,to add the quality flag to the datum
AMeDAS stations
Data collection server
GTS
Users
JMA Computer System for Meteorological Services
Data sharing/storage server
Web serverObservations entered manually
(visibility, weather, etc)
Surface observation stations (1,300)
Data statistics/archive system AMeDAS Integrated Processing System
Data processing
Data dissemination
Users (Organizations, NMHSs)
Data dissemination(publication, CD‐ROM,
Internet, etc)
Data archive
Data statistics
SYNOPBUFR
CLIMAT
JMA users
QC/QA (non‐real‐time)
Spatial consistency,time‐series consistency,
climate range checks
QC /HK informationInter‐sensor/hardware checks,
gross error checks
Meteorological observatoriesMeteorological
observatories
(unmanned)
QC/HK
Public
QC/HK
Figure 3. Flow of surface observation data to users and archives
1.2 Upper-air observation 1.2.1 Number of stations: RBSN, RBCN, GUAN, manned stations and automated
system stations
Table 2. Number of stations RBSN RBCN GUAN Manned Automated Number 16* 16* 6* 8* 8
*Syowa Station (Antarctica) is not included.

103
1.2.2 Station map
Figure 4. RBSN, RBCN and GUAN stations for upper-air observation in Japan. Solid circles: RBSN/RBCN stations; double solid circles: GUAN stations (including RBSN/RBCN stations) 1.2.3 Timing and frequency of observations
Observations are made and reported twice a day at 00 and 12 UTC at 16 stations in Japan and at Syowa Station in Antarctica. In the event of severe weather conditions such as typhoons, radiosondes are also launched at 06 UTC and/or 18 UTC.
When data are not obtained below 150 hPa in an observation, the observation has to be made again from the beginning. 1.2.4 Flow of data to users and archives
Figure 5 shows the flow of upper-air observation data to users and archives.

104
Surface observation dataIncorporated in the upper air report
GPS satellite signal
Radiosonde signal
TEMP message
Ascent data(PTU, Wind)
Descent data(PTU, Location)
Data storage serverQC/QA (non‐real‐time)
GTS
JMA’s Headquarters (Tokyo)
Calculation of observation
(Including quality control procedures such as gross error
checks)
Radiosonde stations (16)Users
JMAComputer System for
Meteorological Services
Data statistics/archive systemQC/QA (non‐real‐time)
CLIMAT TEMP
A/N report (For domestic use)
Figure 5. Flow of upper-air observation data to users and archives
2. Siting and metadata Siting and exposure criteria for surface observation stations have been designed in accordance with WMO recommendations. The specifications are as follows: a) Outdoor instruments should be installed on a level area of ground covered with short
grass, preferably more than 20 m in width or length, and approximately 600 m2 in area.
b) Sites as described in a) should be located well away from buildings, i.e., a distance equivalent to more than three times the building height or 10 meters.
c) The angular height of nearby buildings as seen from the center of the site should be 18 degrees or less. No matter how carefully instruments are positioned according to the above criteria,
measurement uncertainties caused by fluctuations in site conditions are unavoidable. It is therefore important to document metadata that describe the conditions in which data have been recorded. We conducted surveys to ascertain which metadata factors significantly influence measurements when it comes to monitoring the current status of sites and possible changes in siting environments such as plans for new construction in the neighborhood. It was concluded that operational periods, geographical data (such as latitude, longitude and elevation), site size, instrument mounting height and exposure, and site maps and photos showing the surroundings constituted critical metadata items for identifying site conditions. All these kinds of metadata have been documented and updated by local staff, gathered and stored by the management section at JMA’s headquarters, and shared by all JMA staff through the Agency’s intranet.

105
3. Instruments, sensors, upgrading, maintenance, instrument intercomparison
and traceability 3.1 Surface observation
Upgrading of weather observation equipment at local meteorological observatories is being planned. The current equipment (JMA-95, used since 1995) consists of a set of sensors connected to data collection and transmission units, automatically sending data to computing systems at JMA’s headquarters. The new equipment (JMA-10, to be installed from 2010 to 2014) includes measurement devices for air pressure/temperature, humidity, wind, precipitation, snow depth and sunshine duration/radiation, and at unmanned stations exclusively, visibility and present/past weather. As seen in Table 4, the equipment is expected to meet or exceed the measurement accuracy requirements of international standards such as those recommended in WMO’s CIMO Guide (WMO-No. 8), featuring sensors using the same observation methods as JMA-95 except for those measuring snow depth and sunshine duration.
In designing the new equipment, improvement of strength and durability, increased efficiency in maintenance and operation, and adaptation to versatile low-cost devices and technologies have been particularly considered. By way of example, installation of independent input/output modulation for individual CPU sensors and improvements to system software for checking, monitoring and quality control can be expected.
Table 3. Performance specifications of JMA-10 and JMA-95 sensors WMO/CIMO achievable
measurement uncertainty
JMA-10 JMA-95Performance specification
Sensor Performance specification
Sensor
Pressure ±0.3 hPa ±0.2 h Pa Capacitive barometer
±0.2 hPa Capacitive barometer
Temperature ±0.2°C ±0.15°C Platinum resistance thermometer
±0.15°C Platinum resistance thermometer
Humidity ±3% ±3% Capacitive hygrometer
±5% Capacitive hygrometer
Wind speed – 5.0 m/s ±0.5 m/s 5.0 m/s – ±10%
– 10.0 m/s ±0.3 m/s 10.0 m/s – ±3%
Combined wind vane and propeller anemometer
– 10.0 m/s ±0.3 m/s 10.0 m/s – ±3%
Combined wind vane and propeller anemometerWind
direction ±5° ±3% ±3%
Precipitation The larger of ±5% or 0.1 mm
±3% Tipping-bucket gauge
±3% Tipping-bucket gauge
Snow depth – 20 cm ±1 cm 20 cm – ±5% *
±1 cm Snow depth meter (laser sensing)
±2 cm Snow depth meter (ultrasonic/ laser sensing)
Sunshine radiation
– 8 MJm-2 ±0.4 MJm-2
8 MJm-2 – ±5% (based on daily totals)
±3% Electric pyranometer
±3% Electric pyranometer
Sunshine duration
The larger of 0.1 h or 2% (based on daily totals)
120 Wm-2 ±10% (based on the threshold value)
Sunshine duration meter (rotation type)
120 Wm-2 ±10% (based on the threshold value)
Sunshine duration meter (sun tracking)
Visibility The larger of 20 m or 20%
– 10,000 m ±10% 10,000 m – ±15%
Forward scatter meter
– 10,000 m ±10%10,000 m – ±20%
Forward scatter meter
*Required measurement uncertainty

106
3.2 Upper-air observation The upper-air observation system was renewed in fiscal 2009. Meisei Radiosonde
RS2-91 and Meisei GPS Radiosonde RS-01GM were replaced by Vaisala GPS Radiosonde RS92-SGP and Meisei GPS Radiosonde RS-06G, respectively, thereby achieving complete updating of the existing radiosonde network with GPS radiosondes.
Comparisons of observations by the new and old types of sonde at the Aerological Observatory in Tsukuba have been analyzed to ensure data continuity before and after the renewal. As RS-01GM uses the same sensors and conversion formulas as RS2-91, RS-06G is compared with RS2-91 instead of RS-01 GM. The comparison periods are as follows:
a) From September 28th to October 14th, 2009 (20 comparisons) b) From December 3rd, 2009 to January 15th, 2010 (30 comparisons) c) From March 1st to 19th, 2010 (30 comparisons) d) From May 24th to July 9th, 2010 (30 comparisons) e) A total of 30 comparisons are also scheduled for September 2010.
4. Quality assurance/quality control (real-time, non-real-time) 4.1 Instrumental AQC in real time
JMA’s weather observation equipment (JMA-95) has a management system of self-checking and automatic quality checking (AQC) to facilitate its maintenance. Processing tasks such as invalidation of erroneous data are performed according to instrumental housekeeping parameters.
In upper-air observation, the signal receiver on the ground invalidates erroneous data in signal processing and conversion to physical values. 4.2 AQC in real time in the observation system
The AMeDAS Integrated Processing System (AIPS) implements real-time AQC for observation values acquired from stations via telecommunication lines. AQC tasks such as gross-error checking and logical checking are performed on values covering ten seconds, one minute and ten minutes. Quality flags of “Normal,” “Serious (Warning level),””Minor (Advisory level)” or “Invalid” are added to the values. 4.3 AQC in non-real time in the processing systems
After sending SYNOP reports to GTS lines and domestic BUFR reports to the external telecommunication lines, the processing systems in JMA-HQ implement non-real-time AQC.
The various types of AQC are as followings: a) Spatial checking: Data from the station are compared with those from surrounding
stations. A multiple regression relationship for the past and a simple magnitude relationship are used. This type of AQC is also applied to rainfall data from external agencies.
b) Sequential checking: Checking is performed to detect when identical values (temperature, wind direction, wind speed) are observed over a number of hours.
c) Extreme value checking: Checking is performed to detect when values above past extreme levels are observed.
In upper-air observation, AQC in non-real time is performed to detect when values at the standard pressure level are observed with an anomaly of above 2 σ.
Observatory officials correct observation values according to AQC results returned from AIPS and processing systems. 4.4 Correction of erroneous data
Observatory officials correct observation values according to AQC results returned from AIPS and processing systems.

107
Figure 6. Flow-chart of QC for surface observation data
5. Training 5.1 Surface observation
Maintenance staff from local district observatories attend an annual 15-day training program, which aims to provide them with the knowledge and skills needed for instrumentation maintenance and nurture their expertise toward future leadership in the field. In addition, a three-day program is also held annually at local district observatories. The program provides instructions to local observatory maintenance staff on how to take immediate remedial action in response to instrumentation problems during operation. In these programs, trainees learn about inspections and maintenance through demonstration and practice using actual instruments, sensors and equipment, and also attend lectures on the mechanics of the instruments. 5.2 Upper-air observation
For staff at manned stations where radiosondes are launched by hand, a four-day training program is provided annually at the Aerological Observatory in Tsukuba. A representative from each observatory attends the program to learn the basics of upper-air observation and keep abreast of new knowledge and techniques.
The training program for staff at automated stations is quite different from the above. It is a one-day program for operators who are responsible for physically loading the balloon train (including the radiosonde) into the tray of the carousel in observations. When an annual routine inspection is conducted, the manufacturer and JMA headquarters staff together give instructions to the local staff on the practice of loading balloons and how to respond to mechanical problems.
6. Statistics and applications
JMA has prepared and updated its original guide to statistical procedures in past decades. The guide describes in detail how to deal with data inhomogeneities including those stemming from changes in observational site locations and changes in the instrumentation used to make observations, as well as basic statistical procedures. Quality flags for statistics are also defined according to the quality flags of the observational data and the number of available observational data over the reference period.
All observational data and data statistically processed over the past 100 years are
ObservatoryAWS
Processing systems(statistics, application)
Public usersOrganizations
SYNOP
NMHSs
Real-time AQC withHK parameter
Non-real-time AQC
internetBUFR
CD-ROM
AQC resultsfeedback
JMA HQ
Integrated Meteorological Observation System
Real-time AQC

108
archived together with their associated quality flags. Metadata concerning instrumentation, locations, etc. for each observational site since the commencement of observation are also archived.
Observations made and quality-controlled by AIPS are processed every 10 minutes for the prompt output of a variety of statistics such as daily maximum and minimum temperatures and any updates on daily/monthly extremes. These statistical data and information are made available on JMA’s website on a real-time basis (limited data and information are also available on its English site). 7. Current issues and future plans 7.1 Surface observation
Changes in site environments due to urbanization or other factors can affect the quality of observational data, possibly to the extent of making it difficult to meet the requirements for long-term sustainable climate monitoring. JMA is currently developing tools to assess the effects of changes in surroundings and trying to clarify suitable environmental conditions to serve individual purposes for different types of data usage. 7.2 Upper-air observation
The new GPS radiosonde system has made it possible to obtain data during descent as well as ascent. The feasibility of using descent data as reference data in the future will be examined.

109
Kazakhstan
JMA/WMO Workshop on Quality Management in Surface,
Climate and Upper-air Observations in RA II (Asia)
Tokyo, Japan 27-30 July 2010
Doc.
Country ________
( .VII.2010)
KAZHYDROMET – NATIONAL HYDROMETEOROLOGICAL SERVICE OF REPUBLIC KAZAKHSTAN
(submitted by Zainuldinova Dinara,RSE Kazhydroment)
Summary and Purpose of Document This document contains an overview of the surface and upper-air observations and Radar observation in kazakhstan.

KAZHYDROMET-KAZHYDROMETNATIONAL HYDROMETEOROLOGICAL SERVICE
OF REPUBLIC KAZAKHSTAN
ASTANA 2010ASTANA, 2010
The ministry of preservation of the environment of Republic Kazakhstan The republican State EnterpriseRepublic Kazakhstan The republican State Enterprise
«Kazhydromet»
Main objective of activity of RSE “Kazhydromet " is maintenanceMain objective of activity of RSE Kazhydromet is maintenancewith the information on weather, a climate and a state ofenvironment, notifications about the dangerous and spontaneousmeteorological, agrometeorological, hydrological phenomena andg , g g , y g pextremely high levels of environmental contamination,maintenance of high level of hydrometeorological and ecologicalsafety of the country.
Primary goals of RSE “Kazhydromet ":1. Working out and drawing up of all kinds of hydrometeorologicalforecasts;2. Carrying out of regular hydrometeorological and ecologicalsupervision;3 P ti f ibilit f f th t3. Preventions of possibility of occurrence of the spontaneoushydrometeorological phenomena;4. Conducting of Republican fund of the data onhydrometeorology and environmental contamination;hydrometeorology and environmental contamination;5. Hydrometeorological maintenance of branches of economy ofRepublic Kazakhstan. 2
THE INTERNATIONAL COOPERATIONTHE INTERNATIONAL COOPERATION
The basic directions:• The world Meteorological Organization (WMО)• Regional Associations II (Asia) and VI
(Europe) WMО• Interstate Council about Hydrometeorology
(ICH)• Bilateral and multilateral Agreements in the
field of hydrometeorology• The international courses, trainings,
educational seminars
Observant network of Kazhydromet
Meteorological station Makes supervision over temperature and
humidity of air, Direction and in the speed of a wind,
atmospheric pressure, Meteorological visibility range,
the height of the bottom border of clouds, Condition of weather,
The atmospheric phenomena, The dangerous and spontaneous
phenomena, Quantity and the form of clouds,
Amount of precipitation, condition and in temperature spreading
Soil surfaces.
CONDUCTING METEOROLOGICAL MONITORING
The land meteorological network of Republic Kazakhstan includes 259 meteorological stations.
On structure meteorological stations are subdivided on: • stations of the international exchange (65 MS); • stations of the international exchange (65 MS); • stations of a global network of supervision over a climate (16 МS); efe ence climatic stations (33 МS) • reference climatic stations (33 МS);
• stations of an interstate hydrometeorological network of commonwealth of the independent states (159 МS).
ACTINOMETRICAL OBSERVATION
At 12 meteorological stations are spent actinometrical observation –observation over intensity of the straight line di i t d t t l l disseminated, total solar radiation, and also over effective radiation, radiating balance balance.
OZONOMETRICAL OBSERVATION
Observation over the general maintenance of ozone in atmosphere are spent at 5 stations – Almaty, Aral sea, Atyrau, Karaganda, Semipalatinsk. g , p
110

Upper-air Observations
One of the major directions of activity of hydrometeorological service are the aerological observation intended for data acquisition about the observation intended for data acquisition about the basic meteorological sizes of atmosphere (temperature, pressure, relative humidity of air, a direction and speed of a wind) at standard and direction and speed of a wind) at standard and special levels to heights of 30-40 km. The aerological information from 8 stations is used for studying of atmospheric processes, weather y g p p ,forecasts, and also service of consumers.
RADAR MARL-A
Microelectronic aerological radar (MARL A) Microelectronic aerological radar (MARL-A) It is intended for work as a part of small-sized system of network aerological sounding and carries out following functions: Tracking angular co-ordinates and range of the radiosonde let out in free flight; Reception of the telemetering information from a radiosonde about meteorological data of atmosphere (temperature, humidity) in a flight point; Calculation of speed and wind direction; Calculation of speed and wind direction; Formation of standard meteorological telegrams.
Into structure MARL enter as actually radar equipment (in drawing - without radio transparent shelter), and the operating COMPUTER and the software of secondary processing of the information of the information.
RADIOSOUNDING OF ATMOSPHERE АC-1 System "АC-1“ (automatic centre) is intended for temperature-wind or wind radio System АC 1 (automatic centre) is intended for temperature wind or wind radio sounding of atmosphere with automatic data processing and delivery of aerological telegrams.
THE STATE NETWORK OF HYDROMETEOROLOGICAL SUPERVISION
GATHERING-TRANSFER OF THE OPERATIVE HYDROMETEOROLOGICAL INFORMATION
Aerological stations
Meteorological posts
Hydrological posts
Meteorological stations
The usual The wiring
ACCC i i
telephone telephone
PortableRadio set
telegraph The telephone channel, E-mail
HC ACC
Th t f G th i d i f ti P i
Communication centre, mail
telegraph E-mail E-mail
The centre of Gathering and information ProcessingThe reception-transfer, the automated processing, archiving
The telephone channelHYDROMETEOROLOGICAL
MoscowIMC
BRAKNEL
WASHINGTON
The telephone channel
EAS
The telephonechannel, E-mail
HYDROMETEOROLOGICAL CENTRE
Drawing up: Hydrometeorologicalforecasts forecasts of The telephone channel
HC
IMC WASHINGTONIMC
NEW DELYThe telephone channel
forecasts, forecasts of weather conditions of air pollution, preventions about AHE
p
TASHKENTRMC NOVOSIBIRSKThe telephone channelThe telephone channel
CONSUMERS
RESULTS OF METEOROLOGICAL SUPERVISION
RESULTS OF HYDROLOGICAL SUPERVISION
RESULTS OF AEROLOGICAL SUPERVISION
GATHERING AND PROCESSING OF THE REGIME HYDROMETEOROLOGICAL INFORMATION
post
SUPERVISION
telegraph, E-mailpost telephoneE-mail
Management of the regime information (Quality check of supervision,
ЦСОИ (Reception, draft on cards, unseal)
ЦГМ (Quality check of supervision, P i th l i ) HYDROMETEOROLOGI
telephone, E-mail
draft on the technical carrier, processing, the analysis, the spacial control)
HYDROMETEOROLOGICAL CENTRE (The analysis drawing up of
Processing, the analysis)
Hydrology department(Preparation and the edition of hydrological Y b k )
HYDROMETEOROLOGICAL CENTRE (Drawing up of hydrological forecasts)
(The analysis, drawing up of forecasts of small and average advance time)
Year-books)
REPUBLICAN FUND OF THE DATA ON HYDROMETEOROLOGY AND ENVIRONMENT
POLLUTION (Archiving and storage)
CONSUMERS
HYDROMETEOROLOGICAL CENTRE (D i f l t f t )(Drawing up of long-term forecasts)
Consumers of the hydrometeorological informationConsumers of the hydrometeorological information
Public authorities
Power
AgricultureThe population
Mass media
Oil and gas complexEcology and tourism
KAZHYDROMET
Oil and gas complex
Sailing charterFish economy
Ecology and tourism
g
Air and ground transport
y
Water supply and building
Th k f iThanks for attention
111

112
Lao People’s Democratic Republic
JMA/WMO Workshop on Quality Management in Surface,
Climate and Upper-air Observations in RA II (Asia)
Tokyo, Japan 27-30 July 2010
Doc.
Japan ________
(10.VII.2010)
Status of Meteorological Network, Observations and Data Management In Lao P D R
(by Singthong Pathoummady, Department of Meteorology and Hydrology)
Summary and Purpose of Document This document aims to report on the meteorological network in Lao PDR and relating operational weather observation tasks. Data archiving and data quality is also discussed. As a matter of fact Laos started operational weather observation since the year 1950 in some large cities and was registered as a member of WMO in 1955. Unfortunately under the least developed country status, there has not been much improvement or development in the field of meteorology during the past decades. The establishment of meteorological stations has been slightly increased and extended in most of large cities in the last 10 years. All instruments are analogue and manual types as a result these furnished all manned stations. These existing deteriorated instruments have no means to get calibration due to lack of standard calibrating tools. This situation lead to poor data quality even though data are preliminary checked manually prior to be archived in forms of hard copies and digital recorded devices.

113
1. Observation networks 1.1 Surface observations 1.1.1 Number of stations: RBSN, RBCN, GSN, manned stations and AWS*
Table 1 Number of stations
RBSN RBCN GSN Manned stations
AWS *
number 19 4 0 0
Note: There are 29 secondary climatic stations which make a total of 48 stations, including 4 RBCN

114
1.1.2 Station map
115
1.1.3 Time and frequency of observations
- 4 stations carried out 8 times observations namely : 48940 , 48947 , 48930 and 48955 at 00UTC, 03UTC, 06UTC , 09UTC, 12UTC,15UTC,18UTC ,and 21UTC
- Others make 4– 5 observations (day time only): 00UTC, 03UTC,06UTC,09UTC,12UTC
1.1.4 Data flow to users and archives 1.2 Upper-air observations 1.2.1 Number of stations: RBSN, RBCN, GUAN, manned stations and automated
system stations
RBSN RBCN GUAN Manned stations
Automated system stations
number 0 0 0 0 0
1.2.2 Station map 1.2.3 Time and frequency of observations 1.2.4 Data flow to users and archives
Upper-air observation data flow to users and archives is expected to be described with an illustration.
Telecommunications Center at DMH’s HQ
Weather Forecast and Aeronautical Division
End Users & Public
RBSN & RBCN Stations
Climate & Agro-Met. Division
Log Books
Secondary Climate Stations
Hard Copies Storage
Archived Digitized Devices
Concerned End Users
on demands

116
2. Siting and metadata
List of meteorological stations : The highlighted blue stations are RBSN & RBCN No. WMO ID Station name District Village Latitude N Longitude E Altitude
1 48940 Vientiane DMH Sikhottabong Akat 17゜57’ 102゜34’ 171
2 48944 Thangone Xaithani Thangone 18゜17’ 102゜38’ 185
3 Veunkham Xaithani Chaleunsay 18゜11’ 102゜37’ 178
4 48942 Naphok Xaithani NAFRI 18゜09’ 102゜44’ 170
5 48921 Phongsali Phongsali Phongsali 21゜42’ 102゜05’ 1300
6 48924 Louangnamtha LouangNamtha LouangNamtha 21゜03’ 101゜28’ 557
7 48922 Meuang Sing Sing Siliheuang 21゜11’ 101゜09’ 643
8 48923 Viangphoukha Viangphoukha Phouka 20゜41’ 101゜04’ 671
9 48925 Oudomxai Xai Phoulay 20゜41’ 102゜00’ 648
10 48926 Houayxay Houayxay Airport 20゜16’ 100゜24’ 401
11 48929 Thonpheung Thonpheung Khoneluang 20゜19’ 100゜09’ 371
12 48930 Louangphabang Louangphabang 19゜53’ 102゜08’ 560
13 XiangNgeum Xiang‐Ngeun HouaiKhoat 19゜45’ 102゜10’ 304
14 48931 Phoukhoun Phoukhoun Phoukhoun 19゜26’ 102゜26’ 1317
15 48928 XamNua Xam‐Nua 20゜25’ 104゜04’ 1000
16 48927 Viangxai Viangxai Phonbeng 20゜25’ 104゜14’ 913
17 48938 Xaignabouri Xaignabouli Xaignabouri 19゜14’ 101゜44’ 292
18 48935 Phonsavan Pek Thonghaihin 19゜28’ 103゜08’ 1094
19 48936 Meuang Kham Kham Longpeeo 19゜39’ 103゜34’ 587
20 48932
Meuang Phoukout
Phoukout 19゜34’ 103゜05’ 1114
21 48941 Phonhong Phonhong Nalongkhoon 18゜28’ 102゜24’ 179
22 48943 Napheng Thoulakhom Thourakhom 18゜16’ 102゜56’ 172
23 Kasi Kasi Kasikhammueang 19゜24’ 102゜29’ 360
24 48939 Vangviang Vangviang Vangviang 18゜55’ 102゜27’ 298
25 Meuang Fuang Fuang Fuang 18゜39’ 102゜26’ 243
26 48934 Longxan Hom PhonhNgam 18゜32’ 102゜57’ 254
27 48933 Xaisomboun Xaisomboun Namcha 18゜59’ 102゜56’ 460
28 48945 Pakxan Pakxan 18゜24’ 103゜40’ 155
29 48950 Lak 20 Khamkeut Somsanouk 18゜11’ 104゜51’ 540
30 48946 Thakhek Thakhek Chompheth 17゜23’ 104゜49’ 151
31 Nongbok Nongbok Song Muang Tai 17゜09’ 104゜49’ 147
32 48947 Savannakhet Kaysone Phonmvihane Xai Oudom 16゜33’ 104゜45’ 144
33 48948 Xeno Outhoumphon Outhomphon 16゜40’ 105゜00’ 185
34 Donghen Atsaphangthong Donghen 16゜42’ 105゜16’ 158
35 48949 Xepon Xepon Xepon 16゜43’ 106゜12’ 170
36 48952 Salavan Salavan Laksong 15゜41’ 106゜26’ 168
37 48951 Khongxedon Khongxedon Khong 15゜36’ 105゜48’ 156
38 Laongam Lao‐Ngam Laoneam 15゜28’ 106゜10’ 540
39 Samouay Samouay Samouay 16゜25’ 106゜49’ 400
40 48953 Xekong Lamam Phiamai 15゜20’ 106゜41’ 143
41 48954 Thateng Thateng Thateng 15゜27’ 106゜22’ 816
42 48955 Pakxe Pakxe Pakxe 15゜07’ 105゜47’ 104
43 48956 Pakxong Pakxong Pakxong 15゜14’ 106゜20’ 1200
44 Nikhom 34 Pakxong Houei Vai 15゜10’ 106゜24’ 1120
45 Itou Pakxong Itou Lak35 15゜10’ 106゜35’ 890
46 48958 Soukhouma Soukhouma Soukhouma 14゜39’ 105゜47’ 90
47 48959 Meuang Khong Khong 14゜07’ 105゜50’ 76
48 48957 Attapu Samakkhixai 14゜48’ 106゜50’ 103

117
Metadata = Most of parameters are daily mean, monthly and yearly mean, extreme Absolute (Max, Min) , Average, Normal
3. Instruments, sensors, upgrade, maintenance, instrument intercomparisons and
traceability
All existing instruments are analogue system. All stations are manned stations. Installation, checking of status and maintenance by DMH HQ’s staff. No calibration nor intercomparisons were conducted. Recent improvement of six synoptic stations by JICA TCP.
4. Quality assurance / quality control (real-time, non-real time)
1). Quality Assurance : DMH does not have QA system (mechanism). Data are
manually keyed into message switching PC, then send in to GTS RTH Bangkok. Simply the operators are taking care of possible errors or mistakes.
2). Quality Control : This is primary manually checked for possible man made
mistakes basing on staff experiences , then staff key in to CLICOM software format. For hydrological data , the HYMOS software is used
5. Training
DMH conducted its in-house Training Course on surface observation, but only technician operational Observer level. The trainees have to completed High School or year 12. This is not a regular training to be opened every year, but depending on needs of new staff and availability of fundings.
6. Statistics and applications Statistics .are utilized for climate analysis, to serve for agricultural purposes, disaster risk analysis, as well as for requested projects
7. Current issues and future plan
DMH has set up its implementation plan for data management improvement firstly by the TCP , support by JICA experts for technology transfer and the WMO-World Bank-UNISDR Project to support Southeast Asia member countries. Secondly under the capacity building framework alongside with the implementation of Mekong-Integrated Water Resources Management Programme (M-IWRMP). Within the strategic plan 2011 – 2015, DMH has to take part in providing data over projected basins with data quality assured and controlled. This will be achieved by technical Assistance of International Experts and financial support by potential donors including Japan. Thirdly DMH will participate the activities of MRCS, especially the capacity building on Hydro-Met Data Quality assurance and Quality Control under the Information and Knowledge Management Programme (IKMP) and the HYCOS project.
118
Mongolia
JMA/WMO Workshop on Quality Management in Surface,
Climate and Upper-air Observations in RA II (Asia)
Tokyo, Japan 27-30 July 2010
Doc.
Japan ________
(10.VII.2010)
Observation network of Mongolia (Submitted by Norov BATTUR,
National Agency for Meteorology and Environment Monitoring of Mongolia)
Summary and Purpose of Document
This document contains an overview of the surface observations in Mongolia, with respect to instruments, training.

119
Observation network of Mongolia
Battur. N / MONGOLIA / Meteorological and Hydrological Services of Mongolia are functioning officially since 1936 when the first meteorological observation stations were established in the country. But several meteorological observations stations operated since 1986 in capital city in Ulaanbaatar, and some other administrative centers of Mongolia. Mongolia has joined to the World Meteorological Organization in 1963.
The National Agency for Meteorology and Environment Monitoring /NAMEM/, is the government’s implementing agency. The agency provides information of weather forecasting, hydro-meteorology and environmental changes to governmental and private organizations, coordinates all hydro-meteorological observation networks of Mongolia.

120
Currently there are 130 meteorological stations, 186 meteorological posts, 3 upper-air stations in observation network of NAMEM.
Figure.1. Location of meteorological stations
The observed variables in all meteorological stations: Air temperature, surface soil temperature, atmospheric pressure, humidity, velocity and direction of wind, precipitation /amount and intensity/, cloud amount and type, visibility, weather /present and past/, snow depth and density. In addition to these variables mentioned above, some meteorological stations observe solar radiation, sunshine duration, deep soil temperature, soil moisture, evaporation. There are 70 manned stations in meteorological observation network. We supply instruments to all observation stations and purchase mostly observation instruments from Russian and China. Our Agency is intending to install automatic meteorological station at all observation stations, but we have difficulty is financial problems. Therefore, this plan greatly depends on Mongolian economics and finance. Present, about 60 automatic meteorological stations operated since 2000 in our meteorological observation network, 30 of the stations have been set up in 2008. Types of automatic meteorological stations in our observation network: MAWS301, SK4100, CAMS630, QLI50.
Table 1. number of stations RBSN RBCN GSN Manned
stationsAWS
1 130 130 - 70 60

121
Figure.2. Location of automatic meteorological stations
All meteorological stations are making synoptic and climate observations 8 times per day. Local meteorologists and technicians use mobile, internet, VSAT to transfer observation data. National Meteorological Telecommunication Network has two GTS lines with WMO Regional Meteorological Centers in Novosibirsk, Russia and Beijing, China and twenty local lines with local centers through VSAT. Above given, there are a lot of manned station in meteorological observation network since it’s necessary to check observation data. Therefore, Local meteorologists check first observation data in province meteorological center. Climate section in the Institute of the Hydrology and Meteorology make last control of observation data along specific instruction and transfer checked data to center of data base. It’s different series of observation data in ever station and have over 70 years observation data in the oldest stations . All observation data are stored in data base center of NAMEM.

122
About training
NAMEM is responsible for training activities for meteorologists and technicians of
observation network. We organize special trainings for different fields such as
meteorology, agro-meteorology, hydrology and environmental monitoring. The used
types of training: lecture, discussion, practice, e-learning.
Figure.3. Lecture rooms of the Training center.
Some observers of the observation network are not graduated from special college
for this observation. So every year we organize short training / 1 month/ course for them
and they obtained a certificate. Also last few years we have installed several types of
automatic meteorological stations. So we need specialized technicians and engineers.
In the future we would like to extend our training activities to cooperate other
international and regional training centers. It will be very important to improve their skills
and knowledge for our meteorologists and engineers.
There is a need to improve meteorological observation networks of the country. Our
main goal is:
- improve skills of meteorologists and technicians
- Improve quality of observational data.
- Improve quality technologies and techniques.

123
Nepal
JMA/WMO Workshop on Quality Management in Surface,
Climate and Upper-air Observations in RA II (Asia)
Tokyo, Japan 27-30 July 2010
Doc.
Japan ________
(10.VII.2010)
Perspective of Department of Hydrology and Meteorology (DHM) in Nepal
(Submitted by Rajendra P. Shrestha, Meteorological Forecasting Division)
Summary and Purpose of Document
Department of Hydrology and Meteorology has a mandate from Government of Nepal to monitor all the hydrological and meteorological activities in Nepal. The scope of work includes the monitoring of river hydrology, climate, agrometeorology, sediment, air quality, water quality, limnology, snow hydrology, glaciology, and wind and solar energy. General and aviation weather forecasts are the regular services provided by DHM. DHM is also look network of all type of observation station. As a member of the World Meteorological Organization (WMO), DHM contributes to the global exchange of meteorological data on a regular basis.

124
Introduction Government of Nepal started hydrological and meteorological activities in an organized way in 1962. The activities were initiated as a section under the Department of Electricity. The section was subsequently transferred to the Department of Irrigation and was ultimately upgraded to Department status in 1988. The Department of Hydrology and Meteorology (DHM) is an organization under the Ministry of Environment, Government of Nepal. The department with headquarters in Kathmandu has three basin offices: Karnali Basin Office in Surkhet, Narayani Basin Office in Pokhara and Kosi Basin Office in Dharan. DHM actively participates in the programs of relevant international organizations, such as, the UNESCO's International Hydrological Program (IHP) and WMO's Operational Hydrology Program (OHP). In the past, DHM has hosted several regional and international workshops, symposia, seminars and meetings on different aspects of meteorology, hydrology, sediment, and snow hydrology. The department is also a focal point for the Intergovernmental Panel on Climate Change (IPCC) and for the meteorological activities of the South Asian Association for Regional Co-operation (SAARC). The International Civil Aviation Organization (ICAO) has recognized DHM as an authority to provide meteorological services for international flights. The Principal Activities of DHM Collect and disseminate hydrological and meteorological information for water resources, agriculture, energy, and other development activities. Collect and disseminate hydrological and meteorological information for water resources, agriculture, energy, and other development activities. Issue hydrological and meteorological forecasts for public, mountaineering expedition, civil aviation, and for the mitigation of natural disasters. Conduct special studies required for the policy makers and for the development of hydrological and meteorological sciences in the region. Promote relationship with national and international organizations in the field of hydrology and meteorology. Organizational Setup The Director General heads DHM. The present Organizational Chart has four divisions headed by Deputy Director Generals: Hydrology Division, Climatology Division, Meteorological Forecasting Division and Co-ordination Division. Hydrology Division has four major sections: River Hydrology Section, Flood Forecasting Section, Snow and Glacier Hydrology Section and Sediment and Water Quality Section. Similarly, the sections under the Climatology Division include: Climatology Section, Agrometeorology Section, and Wind and Solar Energy Section & Data Section. The Meteorological Forecasting Division has three main units: the Communication Unit, Aviation Unit, and General Weather Forecast Unit. Co-ordination Division is primarily responsible for developing policies and co-coordinating all the departmental activities including financial and administrative matters. Along with the three basin offices, the Co-ordination Division provides support to the following sections: Data Management Section, Planning Section, Instrument Section, and Training Section.

125
Hydrology Division Hydrology division is responsible for collecting hydrological (river, lake, flood, snow and glacier) data, studying and analyzing them, publishing analyzed data and report, and run and manage hydrological project across the country. There are different sections under Hydrology division. They are River Hydrology Section This section is responsible for following activities: Nation wide study and analyze water level and discharge of different rivers and lakes. Hydrological data collected from the basin offices is processed, corrected and validated. Management and supervision of current meter calibration. Publication of hydrological data. Providing guidelines for abovementioned jobs. Snow and Glacier Hydrology Section Responsible for monitoring snow and Glacier Lake, river etc. of High- Mountain by establishing monitoring stations. Publication of collected and analyzed snow and snow hydrology related data. Estimation of snowmelt from high mountain region. Providing guidelines for abovementioned jobs. Sediment and Water Quality Section Responsible for monitoring sediment in different rivers. Regular monitoring of existing sediment stations and analyzes the data collected from them. Publication of collected and analyzed sediment data. Providing guidelines for abovementioned jobs. Flood Forecasting Section Collection and processing of rainfall, water level and discharge data from different flood station during flood season from radio set. Preparation of forecasting models from analyzing the abovementioned data. River water level will be forecasted according to these models. Establish different flood stations and manage them. Preparing guidelines for flood forecasting and running models. Climatology Division Meteorology division is responsible for collecting meteorological (rainfall, lake, flood, snow and glacier) data, studying and analyzing them, publishing analyzed data and report, and run and manage hydrological project across the country. Climatology Section According to geographical Different aspects of agriculture, water resource, environment change etc. Study and investigation about climate change. Collection and publication of air pollution data. Preparation of climatic atlas of Nepal.Agromet Section Preparation of crop calendar of different weather to help agriculture. Wind and Solar Energy Section Technical and Human Resources DHM maintains nation-wide networks of 337 precipitation stations, 154 hydrometric stations, 20 sediment stations, 68 climatic stations, 22 agrometeorological stations, 9 synoptic stations and 6 Aero-synoptic stations. Data are made available to users through published reports, bulletins, and computer media outputs such as hard copies or diskettes. DHM publishes data on an annual basis. Most of the sections under DHM are equipped with personal computer systems connected through a network. The computers are not only used for database management but also for hydrological and meteorological modelling and analyses. Hydrological and meteorological

126
studies are produced as reports every year. Recent publications include the reports on low flow analyses, flood risk assessment and integrated database developments. DHM is equipped with several data collection facilities based on different technologies, such as, wireless communication, meteor burst, radiosonde, Satellite Distribution Information System (SADIS), Weather Fax, and satellite picture receiving system. Wireless system connects Kathmandu to 54 stations spread over Nepal for climatic and hydrological data whereas the Global Telecommunication System (GTS) links DHM to the global meteorological community. DHM employs a staff of 238 personnel. Eighty-four staff are employed at field offices, 48 at basin offices, and 130 at the headquarters. Sixty professional staff and 143 technicians serving the department are supported by 34 administrative staff. Objective Collect and disseminate hydrological and meteorological information for water resources, agriculture, energy, and other development activities. Issue hydrological and meteorological forecasts for public, mountaineering expedition, civil aviation, and for the mitigation of natural disasters. Conduct special studies required for the policy makers and for the development of hydrological and meteorological sciences in the region. Promote relationship with national and international organizations in the field of hydrology and meteorology. Function The Department of Hydrology and Meteorology (DHM) is a central governing organization under the Ministry of Environment, Science and Technology. The major functions of the department are as follows: Collect and disseminate hydrological and meteorological information for water resources, agriculture, energy and other development activities. Issue hydrological and meteorological forecasts for public, mountaineering expedition, civil aviation and for the mitigation of natural disasters. Conduct special studies required for the policy makers and for the development of hydrological and meteorological sciences in the region. Promote relationship with national and international organizations in the field of hydrology and meteorology. International Relation DHM actively participates in the programs of relevant international organizations, such as, the UNESCO's International Hydrological Program (IHP) and WMO's Operational Hydrology Program (OHP). In the past, DHM has hosted several regional and international workshops, symposia, seminars and meetings on different aspects of meteorology, hydrology, sediment, and snow hydrology. The department is also a focal point for the Intergovernmental Panel on Climate Change (IPCC) and for the meteorological activities of the South Asian Association for Regional Co-operation (SAARC). The International Civil Aviation Organization (ICAO) has recognized DHM as an authority to provide meteorological services for international flights. Observation network Surface Observation Number of station: RBSN, RBCN, GSN, manned station and AWS RBSN RBCN GSN Manned
Station AWS
Number 15 68 2 83 15

127
Fig: 1 Synoptic Station
Fig: 2 Climatological Stations
-
Legend
High Himal
High Mountain
Middle Mountain
Siwalik (Chure)
Terai") Climate_stations (72)
")
")
")
")
")
")
")
")
")
")
")") ")
")
")
")
")
")
") ")
")
")
")
")
")
")
")")
")
")
")
")
")
")")
")
")
")
")
")
")
")
")
")
")
")
")
")
")")
")") ") ")
")")
")
")
")
")
")
")
")
")
")
")
")
")
")
")
")
")
-
Legend
High Himal
High Mountain
Middle Mountain
Siwalik (Chure)
TeraiSynoptic_stations (15)
JUMLA
DHANKUTA
TAPLEJUNG
DADELDHURA
OKHALDHUNGA
GHORAI (DANG)
DIPAYAL (DOTI)
SIMARA AIRPORT
POKHARA AIRPORT
KATHMANDU AIRPORT
NEPALGUNJ AIRPORT
BHAIRAHAWA AIRPORT
DHANGADHI (ATARIYA)
BIRATNAGAR AIRPOART
SURKHET (BIRENDRA NAGAR)

128
Fig: 3 Existing AWS Station Time and Frequency of Observations Synoptic observations at Kathmandu (capital) are made 8 times per day and 5 times per day in the rest of the stations. All observations are taken in WMO Standard time. Data flow to users and archives All synoptic observation data are transmitted to Meteorological Forecasting Division via Code Division Multiple access (CDMA) as well as HF Transceiver system (SSB) (Conventional) to analyze and weather forecasting. Data receiving from all stations are archived electronically and hard copy too. Necessary data are given for users on request. Temperature and rainfall data has also been posted in website. Siting and Meta data: Location of stations (Latitude, Longitude and Altitude) is routinely checked every year. Instruments, Sensors, upgrade, maintenance instruments intercomparison and traceability: Regular inspection of observing stations and maintenance of instruments are conducting, Apart from this, when problems are reported then maintenance would be conducted. Quality assurance/quality control: All data are checked for logical and statistical error at data processing centre as well as in real time. Training: There is no routinely training program although refreshing courses and training classes for new comers are conducted if necessary. During last five years we have conducted two training classes. Future Plan: Installation of AWS in all synoptic stations during this year 2010 under SAARC_STORM
project. One Doppler Weather Radar probably next year Two GPS Sonde Stations
81 82 83 84 85 86 87 88
27
28
29
30
Dadeldhura
Dhangadhi
DangPokhara Airport
Kathmandu Airport
Biratnagar Airport
Nepalgunj Airport
Simara

129
16 telemetry rainfall stations will be installed in model basin.
Fig: 3
130
Pakistan
JMA/WMO Workshop on Quality Management in Surface,
Climate and Upper-air Observations in RA II (Asia)
Tokyo, Japan 27-30 July 2010
Doc.
Country ________
( .VII.2010)
SURFACE, CLIMATE AND UPPERAIR OBSERVATIONS SYSTEN IN PAKISTAN
(submitted by MUHAMMAD TOUSEEF ALAM, Pakistan Meteorological Department)
Summary and Purpose of Document The purpose of this document to illustrate the existing surface and upper air observational network of Pakistan Meteorological Department. It also explains the type of observing station and timing of the observation. A brief about techniques and procedures being adopted for the QC applied at different levels, at the observing station,in the data processing centre, communication centre, data archive/dissemination centre has been given. Meteorological and observational training being imparted has also been included.

COUNTRY REPORT
ON
SURFACE, CLIMATE AND UPPER-
AIR OBSERVATIONS SYSTEN IN
PAKISTAN
BY
MUHAMMAD TOUSEEF ALAM Pakistan Meteorological Department
JMA/WMO WORKSHOP ON QUALITY MANAGEMENT IN SURFACE, CLIMATE AND
UPPER-AIR OBSERVATIONS IN RA II (ASIA)
Tokyo, Japan
27-30 July 2010
131

Summary and Purpose of Document
The purpose of this document to illustrate the existing surface and upper air observational network of Pakistan Meteorological Department. It also explains the type of observing station and timing of the observation. A brief about techniques and procedures being adopted for the QC applied at different levels, at the observing station, in the data processing centre, communication centre, data archive/dissemination centre has been given. Meteorological and observational training being imparted has also been included.
1. Observation networks 1.1 Surface observations
1.1.1 Number of stations: RBSN, RBCN, GSN, manned stations and AWS*
Table 1 Number of stations
RBSN RBCN GSN Manned stations
AWS *
number 92 55 6 - 50
* An automatic weather station (AWS) is defined as a “meteorological station at which observations are made and transmitted automatically”.
1.1.2 Station map
Map showing locations of the PMD RBSN, RBCN and GSN stations
62° E 64° E 66° E 68° E 70° E 72° E 74° E 76° E
62° E 64° E 66° E 68° E 70° E 72° E 74° E 76° E
24° N
26° N
28° N
30° N
32° N
34° N
36° N
24° N
26° N
28° N
30° N
32° N
34° N
36° N
A R A B I A N S E A
C H I N AStations Network of PMDlocations of RBSN, RBCN and GSN stations
AstoreBabusar
BunjiChilas
Ghari Dupatta
Gilgit
GupisHunza
Kotli
Muzaffarabad
Rawalakot
Skardu
Barkhan
DalbandinKalat
Khuzdar
Panjgur
Quetta
Zhob
Balakot
Cherat
Chitral
Dir
Drosh
Kakul
Kalam
Malam Jaba
Parachinar
Patan
Saidu Sharif
Murree
Hill Station
GwadarJiwani
Lasbella
Nokkundi
OrmaraPasni
Sibi
Turbat
Bannu
D.I.Khan
Kohat
Peshawar Risalpur
Bahawalnagar
Bhawalpur
Dhamial
D.G.Khan
Faisalabad
Islamabad
Jhang
Jhelum
Jouharabad
Kamra
Khanpur
Lahore
Mundi B.D.
Mangala
Mianwali
Multan
Noorpurthal
OkaraRafiqui
R.Y.Khan
Sahiwal
Sargodha
Sialkot
Badin
Chhor
Dadu
Hyderabad
Jacobabad
Karachi
Larkana
Mir Pur Khas
Mithi
Moenjodaro
Nawabshah
Padidan
RohriSukkar
Thatta
Plain Station
I R A N
132

Additional data generation
Resources in this project
•AWS Network
in the country 45
•Rain-guage stations 500
•Soil Moisture & Under Ground
Water situation Monitoring
Regional Drought Centre
National Drought Monitoring
Centre
Project Components
Map showing locations of PMD AWS
Automation of Meteorological Observing Network
Khuzdar
Zhob
Astore
ChhorJiwani
Larkana
Nawabshah
Sibbi
D.I.Khan
Bannu
Parachinar
Balakot Muzaffarabad
Central data archiving Station
Automatic Weather Stations
133

Map showing locations of PMD Rain gauges (500) Network
1.1.3 Time and frequency of observations 00 UTC 03 UTC 06 UTC 09 UTC
12 UTC 15 UTC 18 UTC 21 UTC
1.1.4 Data flow to users and archives
Surface observation data flow to users and archives is expected to be described with an illustration.
1.2 Upper-air observations 1.2.1 Number of stations: RBSN, RBCN, GUAN, manned stations and automated
system stations
RBSN RBCN GUAN Manned stations
Automated system stations
number 6 3 0 - -
1.2.2 Station map
A map showing locations of the RBSN, RBCN and GUAN stations for upper-air observations are expected.
134

62° E 64° E 66° E 68° E 70° E 72° E 74° E 76° E
62° E 64° E 66° E 68° E 70° E 72° E 74° E 76° E
24° N
26° N
28° N
30° N
32° N
34° N
36° N
24° N
26° N
28° N
30° N
32° N
34° N
36° N
Stations Network of PMD
(upper air)
Quetta
Karachi
Sargodha
Multan
Peshawar
Lahore
Sonding Observation
I R A N
1.2.3 Time and frequency of observations One (1) time per day:
00 UTC
1.2.4 Data flow to users and archives
Upper-air observation data flow to users and archives is expected to be described with an illustration.
REAL TIME DATA DELAYED TIME DATA
Weather Observing Station
National Communication Centre
National Forecasting Centres
WMO Regional Data Hub (International Users)
Regional Centre
Regional Centre
National Climate Data Centre
Scrutinizing & Varification of Data
SSB, SMS, V-SAT,Telephone, Internet
(Data processing/archiving, QC, climate publications etcc.)
Users (Climate Research, Engineering, strategic planning, etccc
GTS
GTS
Monthly CLIMAT Data
135
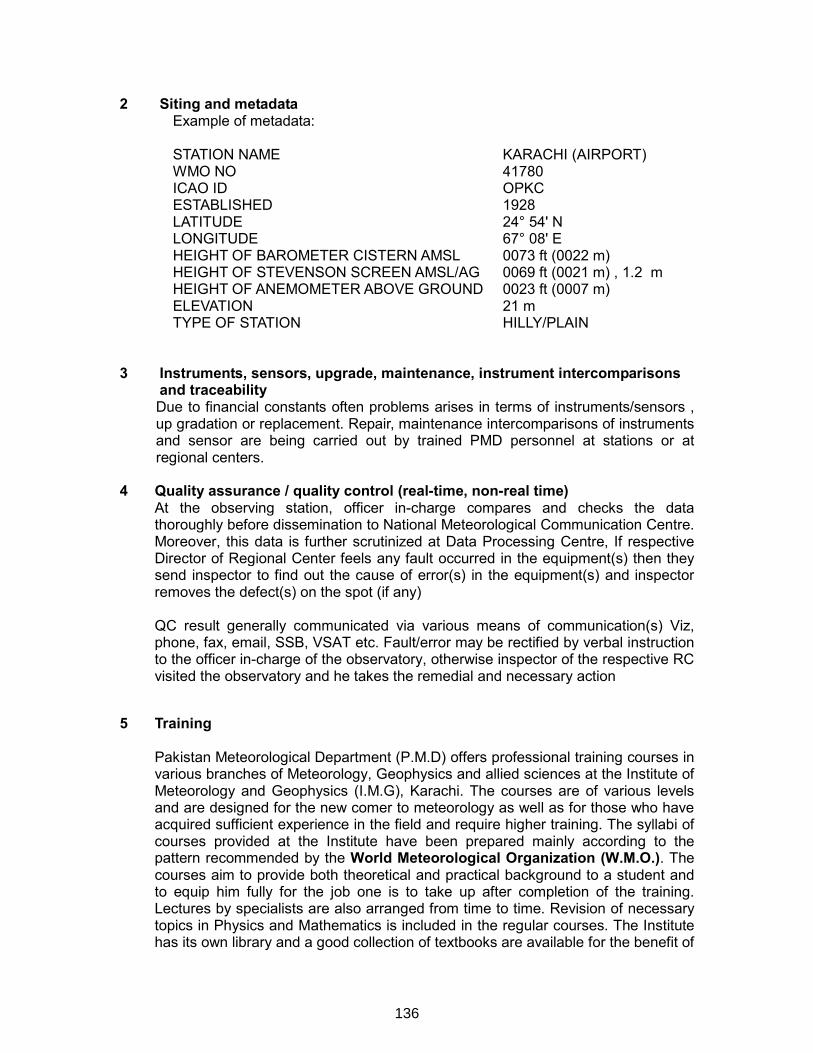
2 Siting and metadata Example of metadata: STATION NAME KARACHI (AIRPORT) WMO NO 41780 ICAO ID OPKC ESTABLISHED 1928 LATITUDE 24° 54' N LONGITUDE 67° 08' E HEIGHT OF BAROMETER CISTERN AMSL 0073 ft (0022 m) HEIGHT OF STEVENSON SCREEN AMSL/AG 0069 ft (0021 m) , 1.2 m HEIGHT OF ANEMOMETER ABOVE GROUND 0023 ft (0007 m) ELEVATION 21 m TYPE OF STATION HILLY/PLAIN
3 Instruments, sensors, upgrade, maintenance, instrument intercomparisons
and traceability Due to financial constants often problems arises in terms of instruments/sensors , up gradation or replacement. Repair, maintenance intercomparisons of instruments and sensor are being carried out by trained PMD personnel at stations or at regional centers.
4 Quality assurance / quality control (real-time, non-real time)
At the observing station, officer in-charge compares and checks the data thoroughly before dissemination to National Meteorological Communication Centre. Moreover, this data is further scrutinized at Data Processing Centre, If respective Director of Regional Center feels any fault occurred in the equipment(s) then they send inspector to find out the cause of error(s) in the equipment(s) and inspector removes the defect(s) on the spot (if any) QC result generally communicated via various means of communication(s) Viz, phone, fax, email, SSB, VSAT etc. Fault/error may be rectified by verbal instruction to the officer in-charge of the observatory, otherwise inspector of the respective RC visited the observatory and he takes the remedial and necessary action
5 Training Pakistan Meteorological Department (P.M.D) offers professional training courses in various branches of Meteorology, Geophysics and allied sciences at the Institute of Meteorology and Geophysics (I.M.G), Karachi. The courses are of various levels and are designed for the new comer to meteorology as well as for those who have acquired sufficient experience in the field and require higher training. The syllabi of courses provided at the Institute have been prepared mainly according to the pattern recommended by the World Meteorological Organization (W.M.O.). The courses aim to provide both theoretical and practical background to a student and to equip him fully for the job one is to take up after completion of the training. Lectures by specialists are also arranged from time to time. Revision of necessary topics in Physics and Mathematics is included in the regular courses. The Institute has its own library and a good collection of textbooks are available for the benefit of
136

the students. New books and publications are added from time to time. The Institute also has well equipped computer laboratory.
6 Statistics and applications
Description of statistics and application for surface and upper-air observations:
o Aeronautical Forecast and Warning services for Aviation. o Flood Forecast and Warning Service. o Farmer's Weather Bulletins and Warning Services o Public Utility and Advisory Services in various fields of :
• Planning and Development
• Town Planning
• Construction: Road, Bridges, Aerodrome, Power Plant, Air-conditioning etc.
• Provision of Meteorological/Geophysical data for Court cases, Insurance Claims, Enquiry Reports, and District Gazetteers etc.
o Marine Met. Forecast and Warning Services.
o Air Pollution Monitoring services.
o Research activities in the following disciplines:
• Meteorology
• Climatology
• Hydrology
• Oceanography
• Atmospheric Physics
• Environmental Pollution
• Geophysics
• Agricultural Meteorology
7 Current issues and future plan
� Expansion of more data observing network
� Up gradation of existing observing stations.
� Installation of more AWS
� Increase in the more observational hours (24 observations per day)
____________
137

138
Republic of Korea
JMA/WMO Workshop on Quality Management in Surface,
Climate and Upper-air Observations in RA II (Asia)
Tokyo, Japan 27-30 July 2010
Doc.
Country ________
( .VII.2010)
Planning and Situation of the Meteorological Observation in The Republic of Korea
(Hyuk Je Lee, Korean Meteorological Administration)
Summary and Purpose of Document
The Korea Meteorological Administration (KMA) has an extremely dense network of the surface and upper-air observation. This high density has been dictated by Korea’s complex topographic and meteorological gradients. The KMA has devoted substantial efforts to the standardization of meteorological observation. However, there are actually some issues for improving the observational ability and the data quality. This report will describe briefly the planning and situation of the surface and upper-air observation in Korea.

139
1. Observation networks 1.1 Surface observations
1.1.1 Number of stations: RBSN, RBCN, GSN, manned stations and AWS*
Table 1 Number of stations
RBSN RBCN GSN Manned stations
AWS *
number 41 11 3 86 483
* An automatic weather station (AWS) is defined as a “meteorological station at which observations are made and transmitted automatically”.
1.1.2 Station map
A map showing locations of the RBSN, RBCN and GSN stations.
A map showing locations of the manned stations and AWSs.
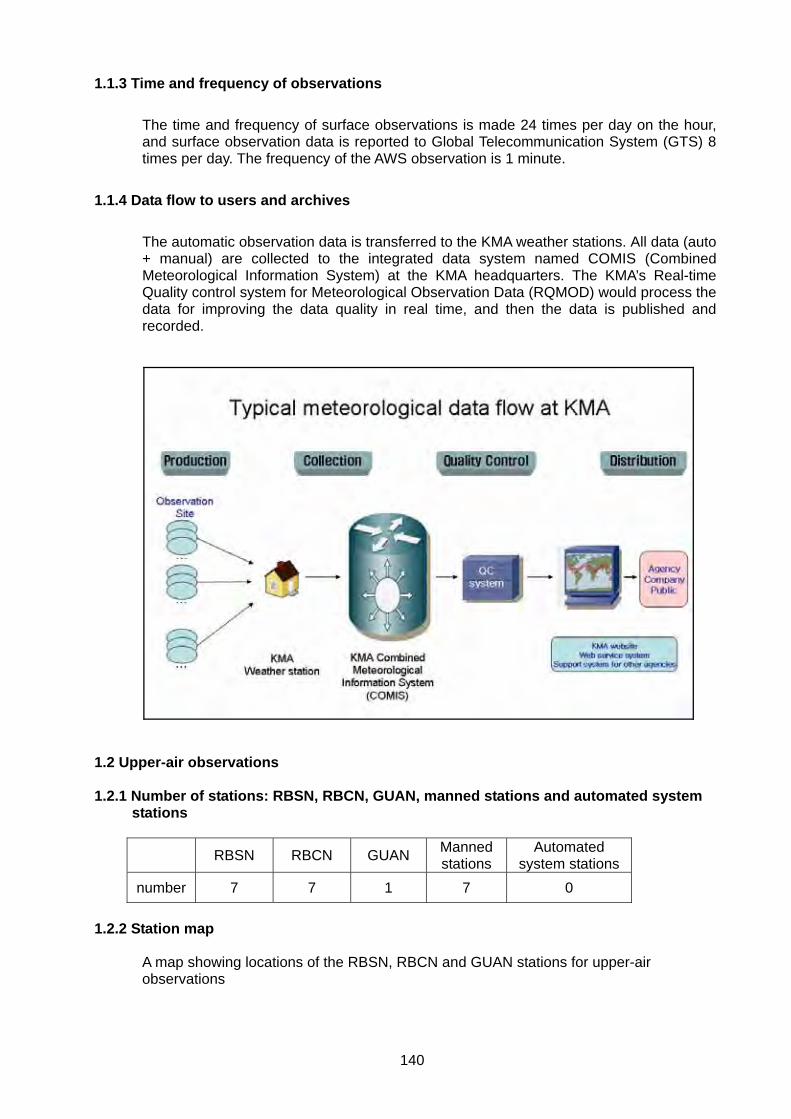
140
1.1.3 Time and frequency of observations
The time and frequency of surface observations is made 24 times per day on the hour, and surface observation data is reported to Global Telecommunication System (GTS) 8 times per day. The frequency of the AWS observation is 1 minute.
1.1.4 Data flow to users and archives
The automatic observation data is transferred to the KMA weather stations. All data (auto + manual) are collected to the integrated data system named COMIS (Combined Meteorological Information System) at the KMA headquarters. The KMA’s Real-time Quality control system for Meteorological Observation Data (RQMOD) would process the data for improving the data quality in real time, and then the data is published and recorded.
1.2 Upper-air observations 1.2.1 Number of stations: RBSN, RBCN, GUAN, manned stations and automated system
stations
RBSN RBCN GUAN Manned stations
Automated system stations
number 7 7 1 7 0
1.2.2 Station map
A map showing locations of the RBSN, RBCN and GUAN stations for upper-air observations

141
1.2.3 Time and frequency of observations
The time and frequency of upper-air observations is made twice per day at 0000 UTC and 1200UTC, and upper-air observation data is reported to the GTS twice per day at the same time.
1.2.4 Data flow to users and archives
The upper-air observation is performed at the KMA weather stations. The data of upper-air observation is transferred to the COMIS at the KMA headquarters. And then Quality Control (QC) must be applied to the data through the RQMOD. Finally, the data is stored and provided for users.

142
2. Siting and metadata Siting of the synoptic observational stations that the KMA has been operating follows the standards of WMO (WMO-NO. 8). As for AWSs, however, they need some efforts to meet the requirements. In the urban areas, some of AWSs are located on rooftops. The KMA has operated the metadata system (National Meteorological Observation Environment Information System) since 2005. It tracks close to 100 fields for each observational station including AWS. These include latitudes, longitudes, contact information, climatological extremes, observation equipment, sensor serial numbers, site and observational history, surroundings and panoramic photographs, etc. The metadata system also tracks dates of sensor installations and calibrations. It allows the generation of statistics and dynamic maps via various queries. The KMA’s National Meteorological Observation Environment Information System
3. Instruments, sensors, upgrade, maintenance, instrument intercomparisons and
traceability There are three distinct types of the KMA automatic weather observational stations. These include: (1) Automated Surface Observing System (ASOS) stations; (2) Automatic Weather System (AWS) stations, and (3) Agriculture Automated Observation Systems (AAOS). The distinct measurements made at each type of KMA automatic weather observational stations are detailed in Appendix 1. All AAOS stations are collocated with ASOS sites. The KMA has a checklist for the annual preventative maintenance visit that is made to each station (see Appendix 2). Sensors are checked for cleanliness and proper operation. On-site intercomparisons are performed once per year for AWS air temperature, rain, and wind sensors. The KMA owns a set of 44 Fluke portable temperature calibrators. This test equipment verifies that the air temperature thermistor is accurate to ±0.5°C. If the thermistor fails the test, the KMA staffer performing the intercomparison will adjust the settings on the logger to bring the thermistor within specification. To check the accuracy of the wind sensors in the field, the KMA staff person attaches a reference anemometer to the tower boom to ensure ±5% accuracy over a 3-min period.

143
The wind direction is tested by placing it on a template and checking accuracy at 45° increments. The wind direction must be within ±5°. Moisture is applied to the rain detector to ensure that it successfully indicates the presence of “rain”. The aspirator is audibly checked to ensure that the fan is running. During the final check, the rain gauge is tested to ensure it reports with ±5% accuracy. The KMA is planning to improve the surface observation and the accuracy of data. The contents of the plan are as follows;
- Substitution of the observational equipment type · Precipitation : Bucket gauge → weighing gauge · Wetness : Heating type → Poister type · Aspirator : Double pan type → Double circulation type (including tachometer) · Wind direction/speed : Propeller and Photo chopper type → Heated ultrasonic type · Tower : Triangular steel type → One-pole type (mechanical type) - Automation of the manual observation · Visibility, Present weather : Eye measurement → Forward scattering type · Cloud height/amount : Eye measurement → Laser type · Evaporation : Pan evaporation → Calculation with other variables
For doing these, the KMA is performing the following instrument intercomparisons and also planning to conduct other experiments
- Analysis of the effectiveness of the fence for precipitation gauge · Intercomparison of Pit gauge with others (3 types) - Analysis of solar radiation/duration · Intercomparison of the reference with others (22 sites) - Demonstration operating of weighing gauges · Intercomparison of Pit gauge (Pluvio) with DFIR (OTT) * DFIR : Double Fence Intercomparison reference
The KMA also expects to participate in the international instrument intercomparisons continuously. For the upper-air observation, the KMA will start to establish a few more stations and plan to observe the vertical profile with autosonde in the near future. The KMA is conducting the upper-air observation with GPS radiosondes, wind profilers, and microwave radiometer profilers. KMA will join the 8th WMO radiosonde intercomparison held in China in July 2010. The KMA has established the standard meteorological observation sites at Chupungnyeong and Boseong. Chupunyeong, one of the KMA’s synoptic observational stations, is located at the middle area of Korean Peninsula. It has been performing the synoptic observation since 1935, and was designated Korean Standard Weather Observatory for senor performance testing and intercomparison observation by the KMA in 2008. As part of its endeavor of Korea to participate in WMO Integrated Global Observing Systems (WIGOS) activities, the KMA has been creating an observing site at Boseong since 2008 in cooperation with the local government. The purpose of the site is to enhance standardization of meteorological observation. It aims at becoming one of best practices of standardization of meteorological observation for the WMO Member countries, and evolving into a global standardized weather station.
4. Quality assurance / quality control (real-time, non-real time)
The KMA is applying QC for the surface observational data at different levels. Firstly, real-time Automatic QC (AQC) is performed at AWS data logger on-site. It is simple QC provided by the manufacture. It inspects the errors of power, sensor, and communication system, and provides the errors for the maintenance staffs who manage the equipment.
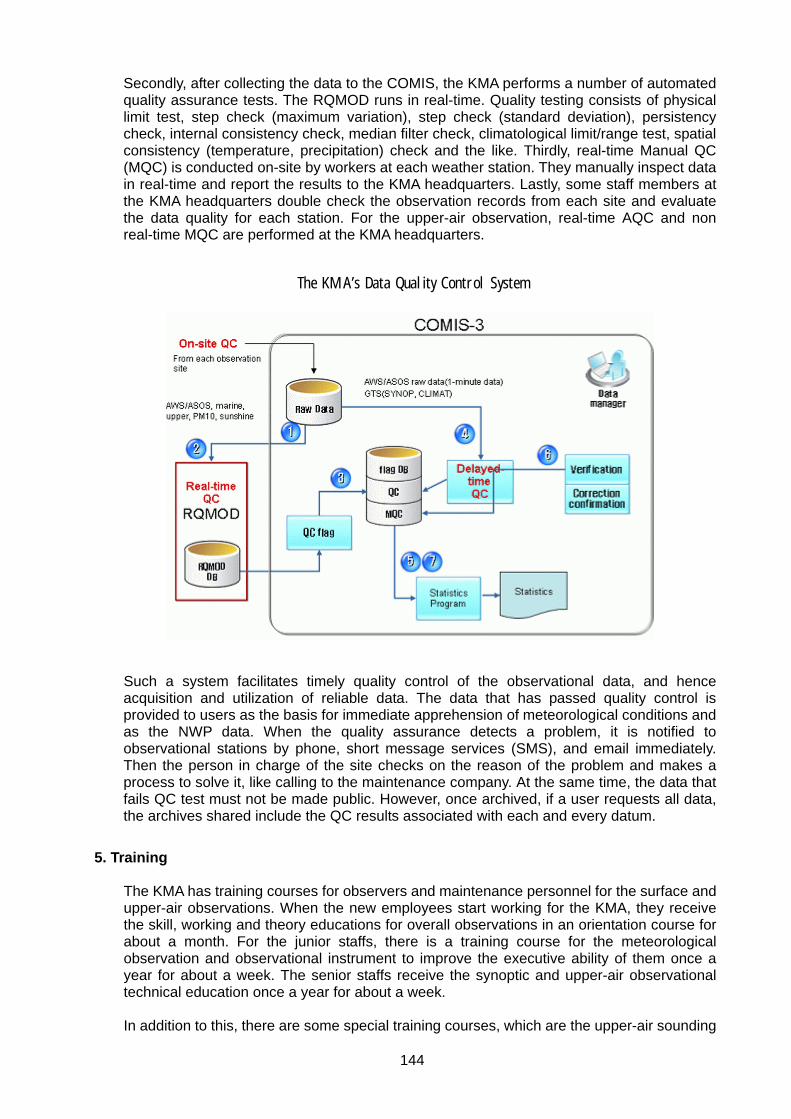
144
Secondly, after collecting the data to the COMIS, the KMA performs a number of automated quality assurance tests. The RQMOD runs in real-time. Quality testing consists of physical limit test, step check (maximum variation), step check (standard deviation), persistency check, internal consistency check, median filter check, climatological limit/range test, spatial consistency (temperature, precipitation) check and the like. Thirdly, real-time Manual QC (MQC) is conducted on-site by workers at each weather station. They manually inspect data in real-time and report the results to the KMA headquarters. Lastly, some staff members at the KMA headquarters double check the observation records from each site and evaluate the data quality for each station. For the upper-air observation, real-time AQC and non real-time MQC are performed at the KMA headquarters.
Such a system facilitates timely quality control of the observational data, and hence acquisition and utilization of reliable data. The data that has passed quality control is provided to users as the basis for immediate apprehension of meteorological conditions and as the NWP data. When the quality assurance detects a problem, it is notified to observational stations by phone, short message services (SMS), and email immediately. Then the person in charge of the site checks on the reason of the problem and makes a process to solve it, like calling to the maintenance company. At the same time, the data that fails QC test must not be made public. However, once archived, if a user requests all data, the archives shared include the QC results associated with each and every datum.
5. Training
The KMA has training courses for observers and maintenance personnel for the surface and upper-air observations. When the new employees start working for the KMA, they receive the skill, working and theory educations for overall observations in an orientation course for about a month. For the junior staffs, there is a training course for the meteorological observation and observational instrument to improve the executive ability of them once a year for about a week. The senior staffs receive the synoptic and upper-air observational technical education once a year for about a week. In addition to this, there are some special training courses, which are the upper-air sounding
The KMA’s Data Quality Control System

145
training course and the AWS operating technical training course. Also, the staffs are educated on the QA/QC for the data processing. When new instrument is installed, the contractor should conduct factory and on-site training for some of the KMA staffs concerning all contents required for the operation and maintenance of the new observational instrument system. In Korea, there are many agencies and public institutions that have conducting the meteorological observations for their own purposes, such as for the transportation and the agriculture. Korean government hopes for an integrated implementation of their meteorological observation system by standardizing meteorological observing facilities including the KMA, intensifying QC, and encouraging co-use of the observational data. With these facts in mind, the KMA instituted a framework for standardization and has launched organized efforts for its systematic implementation. The Meteorological Observation Standardization Law (MOSL) has as its goal the precision in meteorological observation on the basis of WMO. It was instituted so as to provide users with valuable meteorological data, through efficient operation of meteorological equipment and improvement of the observational environment and data quality. That is why Korea was designated as a demonstration country in RAII for WIGOS. The KMA is doing the WIGOS demonstration project and supporting the education for the people who are working for the meteorological observation of other agencies and public institutions, as well as providing practical observational skills and techniques. The KMA also hosts workshops periodically to gather the opinions and provide the training for the meteorological observation standardization.
6. Statistics and applications
After the QA/QC of the observational data, the data should go through the statistic analysis process. The KMA is operating the Meteorological Statistic Analysis System (MSAS). In the system, the KMA can make inquires about DB data retrieval using Structured Query Language (SQL), windrose, accumulated precipitation (moving), precipitation date, annual extreme value for weather element, extreme value for weather element and number of days of weather phenomenon. Monthly weather report, monthly report of AWS data, and annual climatological report would be made for publication through the system. The steps of this process are (1) Checking the observational data, (2) Making the statistic data, (3) Making the image and article, (4) Making the PDF file for contents, (5) Making publication, (6) Publishing and searching.
DB data retrieval in MSAS and the process of making publication
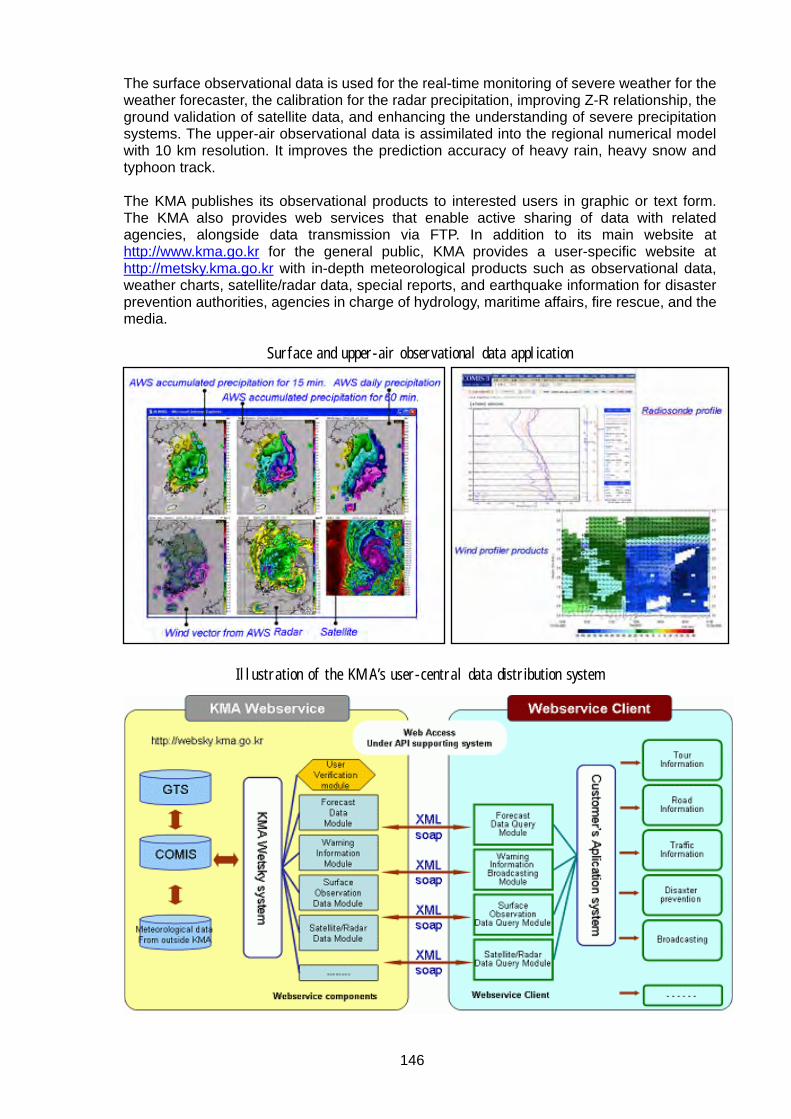
146
The surface observational data is used for the real-time monitoring of severe weather for the weather forecaster, the calibration for the radar precipitation, improving Z-R relationship, the ground validation of satellite data, and enhancing the understanding of severe precipitation systems. The upper-air observational data is assimilated into the regional numerical model with 10 km resolution. It improves the prediction accuracy of heavy rain, heavy snow and typhoon track. The KMA publishes its observational products to interested users in graphic or text form. The KMA also provides web services that enable active sharing of data with related agencies, alongside data transmission via FTP. In addition to its main website at http://www.kma.go.kr for the general public, KMA provides a user-specific website at http://metsky.kma.go.kr with in-depth meteorological products such as observational data, weather charts, satellite/radar data, special reports, and earthquake information for disaster prevention authorities, agencies in charge of hydrology, maritime affairs, fire rescue, and the media.
Surface and upper-air observational data application
Illustration of the KMA’s user-central data distribution system
147
7. Current issues and future plan One of the important issues in the KMA is the problem of the continuity of observational data regarding the environmental change of observational stations due to the urbanization. It is related to relocate the observational stations that have the environment getting worse to other appropriate location. Another is the replacement of observational instrument with different types according to the improvement of observational technique. For example, the KMA is planning to replace the bucket precipitation gauge and the propeller-type anemometer with the weighing gauge and the ultrasonic-type anemometer respectively, as the above-mentioned in chapter 4. In this connection, the KMA also has in mind to automate the manual observation including the eye measurement for some observational elements. The introduction of visibility and ceilometer gives a good example of it. To handle and resolve the issues, the KMA is trying to establish the standard meteorological observation sites for the weather sensor performance testing and field experiments, and performing parallel observations using various atmospheric profilers and rainfall micro-radar for the upper-air and in-situ observational equipment for the synoptic weather. And these efforts would like to contribute to the standardization of observing conditions and quality management of observational data and WIGOS project.
____________

148
Appendix 1: Measurments at KMA automatic weather observational stations
Variable Automatic Surface Observing System (ASOS)
Automatic Weather System (AWS)
Agriculture Automated Observation Systems (AAOS)
Air Temperature � O O (1.5 and 4.0 m) Cloud Height Manually
Observed
Cloud Amount Manually Observed
Dew Point Derived from air temperature and relative humidity
Derived at 0.5, 1.5, and 4.0 m
Grass Temperature O O Illumination O Pan Evaporation Manually
Observed
Present Weather Manually Observed
Pressure O Rainfall O O O Relative Humidity O O (0.5, 1.5 and 4.0
m) Skin Temperature Soil Moisture O (0.1, 0.2, 0.3, and
0.5 m) Soil Temperature O (0.0, 0.05, 0.1,
0.2, 0.3, 0.5, 1.0, 1.5, 3.0, 5.0 m)
O (0.0, 0.05, 0.1, 0.2, 0.3, 0.5, and 1.0 m)
Snow Depth At 40 sites Solar Duration O Solar Radiation At 22 sites Global and reflected
radiation Visibility Manually
Observed
Wetness (Rain Detection) O O Wind Direction O O O (1.5 and 4.0 m) Wind Speed and Gust O O O (1.5 and 4.0 m)

149
Appendix 2: KMA Maintenance Checklists Check List for ASOS Preventive Maintenance
□ Station ID : Data-logger Serial No. : Maintenance type: Routine/On demand
part element check points Result
(good○, bad×) remark
sensor
Wind direction Checking appearance status & A ball bearing
Wind speed Checking appearance status & A ball bearing
Temperature Checking sensor cleanliness & changing status of temperature data
Humidity
Checking sensor cleanliness &changing status of humidity data
Shelter
checking cleaning, painting and fixingof shelter
Checking fan operating(replace a fan per half-yearly)
Pressure
Checking and removing foreign substanceson sensor
Checking sensor cleanliness & changing status of pressure data
Solar radiation
/Sunshine
duration
Checking cleanliness and condensation onsensor dome and maintaining level
Checking status of a moisture absorbent Checking the number of rotations( in sunshine duration sensor(36 second per one time)
Precipitation
(0.1, 0.5mm)
Checking maintaining level of precipitationsensor
Checking sensor cleanliness of precipitation sensor
Checking a point of contact in rid switch
Test by Measuring cylinder 20 mm Less than ±1 ㎜
Rain detector Checking working status
Checking surface corrosion & cleanlinessof a sensor
Data-
logger Data-logger
Checking working status Of Keypad
Checking Data display status
acquisition
computer computer
Checking status of data acquisition & working
power
Battery Measuring input voltage(~13 V) DCV
Measuring battery voltage after cut off ACpower(12.5~13V)
DCV
Power Measuring input voltage of AC power(~220V) ACV
Checking working status of earth leakage breaker
Power supply
Measuring DC voltage(5V, 12V, -12V) V/ V/ V
Checking generation of heat Checking power supply working after cut offAC power
Additional
facilities
Data Monitoring
Display
Checking display status of data
Checking data change
tower, wire,
earthing
Checking fixation & corrosion status of additional facilities Measuring earthing resistance(per half-yearly
Checking data, power & communication lines
Lightning
protector
Lightning
protector
Checking status of serge protector for power line
Checking status of serge protector for dataline
The
others
Certifying the checking results.
Date:
Inspector info: company name position name (sign)
Confirmer: agency name position name (sign)

150
Russian Federation
JMA/WMO Workshop on Quality Management in Surface,
Climate and Upper-air Observations in RA II (Asia)
Tokyo, Japan 27-30 July 2010
Doc.
Country ________
( .VII.2010)
Upper-Air observations in the Russian Federation (Submitted by Alexander Kats, Central Aerological Observatory)
Summary and Purpose of Document
To present the current state, achievements and problems of upper-air observations in the Russian Federation

151
A GUIDE TO WRITING A COUNTRY REPORT AND PRESENTATION
Participants from RA II Members are kindly requested to provide written reports (about 8 pages) concerning the following key themes. In addition, participants are expected to give their presentations for specific subjects at the workshop (choose one of subjects, i.e., siting and metadata, sensors/Instruments, QA/QC, training,).
The following items are expected to be described in the country report.
1. Observation networks 1.1 Surface observations
1.1.1 Number of stations: RBSN, RBCN, GSN, manned stations and AWS*
Table 1 Number of stations
RBSN RBCN GSN Manned stations
AWS *
number An automatic weather station (AWS) is defined as a “meteorological station at which
observations are made and transmitted automatically”.
1.1.2 Station map A map showing locations of the RBSN, RBCN and GSN station is expected. A map showing locations of the manned station and AWS is also expected.
1.1.3 Time and frequency of observations
A description of time and frequency of surface observations is expected.
Reference: 2.3.2.11 At synoptic land stations the frequency of surface synoptic observations should be made and reported eight times per day at the main and intermediate standard times in extratropical areas and four times per day at the main standard times in the tropics. (WMO-No. 544) 1.1.4 Data flow to users and archives
Surface observation data flow to users and archives is expected to be described with an illustration.
1.2 Upper-air observations 1.2.1 Number of stations: RBSN, RBCN, GUAN, manned stations and automated system
stations According to the official RBSN and RBCN lists
(ftp://ftp.wmo.int/wmo-ddbs/RBSN_JUNE2010.xls and ftp://ftp.wmo.int/wmo-ddbs/RBCN_JUNE2010.xls) the Russian Federation has 68 RBSN, 39 RBCN and 10 GUAN upper-air stations in RA II. However, included into RBCN 25954 station at the moment is out of operation4:
RBSN RBCN GUAN Manned stations5
Automated system stations
RA II 68 38+14 10 80 None RA VI 25+16 10+16 1+16 31 None
4 RA II RBCN upper-station 25954 is mothballed and its revitalization remains so far unclear due to heavy damage in earthquake. 5 In operation 6 One RA VI upper-air station 27459, included to RBSN, RBCN and GUAN, is temporarily mothballed till 4th Qr. of 2010.

152
Total 93+1 49+1 11+1 111 None
Totally, observational program of the Russian continental upper-air network at the moment assumes operation of 111 upper-air stations. This amount doesn’t take into account 27459 station (RA VI, silent since August 2009), which is about to resume observations by the end of 2010. Three more mothballed stations in RAII are about to resume their operations by the end of 2010 as well due to installation of new ground systems owing to National Hydrometeorological Modernization Project (see later). Thus we expect our upper-air network to grow up to 115 stations by the end of 2010.
From those 111 stations, operational by June 2010, 106 have to send their data to GTS, but in the 2nd Qr. of 2010 two of them (1 RA II + 1 RA VI) were silent at all due to problems with hydrogen production, one more station in RA II was silent in June due to ground system failure. More details about the fulfillment of the program of observations are brought below,
As well, apart from continental network Russian Federation operates 2 Antarctic upper-stations (they both belong to RBSN, RBCN and GRUAN) and since 2007 organizes expeditionary upper-air observations on the Drifting station “North Pole” expeditions in Arctic. The latter one as well as resuming operation of several polar upper-air stations resulted from efforts undertaken by the Russian Federation during preparation to and implementation of the International Polar Year.
1.2.2 Station map Figure 1 provides an overall view of the Russian upper-air network, it shows operating (pink),
mothballed (light-blue) and closed after 1990 (crosses) upper-air stations.
Fig 1. The Russian Federation upper-air network.
Note variety of ground systems indicated by the legend. It’s may be worth to notice here that
typical Russian radiosonde system consists of secondary radar and a radiosonde, equipped with transponder; pressure is derived from temperature, humidity and radar height by integration of hydrostatic equation. At the moment there are three major types of radars in operation (with some of them having more than one modification). Each of them is able to operate MRZ-3 like radiosonde of four domestic manufacturers.
Following maps present the RBSN, RBCN and GUAN upper-air stations of the Russian
Federation (mothballed stations are shown with orange symbols):

153
Fig 2. The Russian Federation RBSN upper-air stations.
Fig 3. The Russian Federation RBCN upper-air stations.

154
Fig 4. The Russian Federation GUAN upper-air stations.
1.2.3 Time and frequency of observations Figure 5 presents observational program of The Russian Federation upper-air network. All
except two (in RA II) upper-air stations in the Russian Federation make their observations according to the rigid schedule twice per day, at 00 and 12 UTC. According to the national practice, the actual release of a radiosonde is carried out half an hour prior to nominal synoptic time, i.e. 23:30 and 11:30 UTC.
Fig 5. The Russian Federation upper-air network observational program.
Actual fulfillment of observational program (for 00 and 12 UTC) is presented on Figure 6.
Average percentage for the Russian Federation in the 2nd Quarter of 2010 is 95% (for 00 and 12 UTC and for both time). Total amount of observations within this period was 19031, i.e. 209.2

155
daily ascents. The main reasons of non-fulfillment of the plan are ground equipment failures and shortage of chemicals for hydrogen production (logistics issues).
Fig 6. The Russian Federation upper-air network observational program fulfillment.
As well the Russian Federation upper-air network took part in the experiment related to adaptive observation strategy: 37 upper-air stations of 11 Regional Roshydromet Administrations took part in the Winter T-PARC THORPEX field campaign during 07.01.2009 - 28.02.2009 and made totally 603 irregular adaptive ascents within 33 periods of intensive observations (IOPs).In each IOP an individually selected subset of the participating stations has been performing additional 06 and 18 UTC ascents following special DTS Observation requests.
Requests were sent by Senior Duty Meteorologist of NCEP NOAA Central Operations to WMC/RTH Moscow by e-mail ~30 hours prior to additional ascent 06 UTC and were promptly disseminated to upper-air stations via Roshydromet telecommunication network. Results of additional observation were transmitted operationally to the WMO GTS as conventional FM35 TEMP messages.
Upper-air network is a multi-purpose and expensive observing system. Its optimizing (unless reducing amount of sites would be justified by availability of alternative observing platforms) is very challenging task due to very high dimension and lot of imposed constrains. For many practical reasons a redesign with changing site locations seems almost unrealistic. Adaptive observation strategies, or targeting, are expected to be a solution by improving forecast skill and minimizing operational expenditures.
The experiment has proved the ability of the operational upper-air stations to perform adaptive observations on condition that proper logistics and procurement are provided. Nonetheless they require much more sophisticated organization and logistics. Therefore unless full launch automation isn’t implemented, labor component of expenditures remains significant and benefit from targeted observations must be clearly demonstrated.
1.2.4 Data flow to users and archives The backbone of upper-air observation data flow is the telecommunication network of
Roshydromet. Roughly streams of operational upper-air observation data look like on Figure 7. Beside of providing operational data to WMO GTS, WMC/RTH, two RTH and each regional/provincial communication centre provides data to local users such as Hydrometeorological centre of Russia (WMC “Moscow”), regional hydrometeorological centers and other organizations supplying end-users with various products. Russian Research Institute

156
for Hydrometeorological Information – World Data Center (RIHMI-WDC) in Obninsk, which is responsible for the maintaining of the Russian State Fund of data on hydrometeorology and monitoring of environment, as well has its own communication centre and receives all routine operational upper-air data (TEMP FM 35 and PILOT FM 32) in near real time. The system works rather fine and fluently in relation to traditional TEMPs and PILOTs but makes an obstacle for the further development.
Fig 7. Upper-air observation operational data flow.
The main shortcoming is the “last mile” bottle-neck – many stations still submit their observations using teletypes equipment. This prevents on many sites a migration to TDCF data representation which provides lot of advantages to data users as well as network operators. Now it’s the major challenge in maintaining data flow. One of possible solutions is using CREX upper-air data representation with same content as in TAC TEMPs and PILOTs where sending binary BUFR messages is impossible due to technical limitations. Another issue is inevitable introduction of typing errors.
Except one all stations have automatic data processing and from latter ones only 5 have no ability to save raw data and processed results on external storage, thus there is a potential possibility to obtain and transmit operationally high-resolution upper-air data using e.g. B/C 25 WMO TDCF template. However, until recently only limited size printouts were collected and these hardcopies were archived on monthly basis in the Regional hydrometeorological administrations. Of course, they have very limited value for the further processing. Therefore, since 2010 it was started quarterly “off-line” collection in CAO and RIHMI of all files, produced by PC-based automatic, to make a basis to create a national high-resolution upper-air data archive. Some positive experience in this respect was received in Winter T-PARC experiment with retrospective processing of collected for each IOP raw data files resulted in obtaining detailed upper-air profiles with vertical resolution about 100 m.
2. Siting and metadata
Although upper-air observations are generally less affected by an environmental change a site selection is not arbitrary. Apart from basic principles, there are specific requirements to Russian upper-air sites resulted from usage a radar like necessity to have low takeoff angles
RTH Khabarovsk
WMC/RTH Moscow
RTH Novosibirsk
Regional/provincial communication
centres
WMO GTS
Regional/provincial communication
centres Regional/provincial
communication center
Regional/provincial communication
centres Regional/provincial
communication centres
Regional/provincial communication
center
Regional/provincial communication
centres Regional/provincial
communication centres
Regional/provincial communication
center
Upper-air station Upper-air station
Upper-air station
Upper-air station Upper-air station
Upper-air station
Upper-air station Upper-air station
Upper-air station

157
(clear horizon); when station is located near a settlement it’s desirable for a radiosonde to move off from apartment buildings after release. As well, a place for radiosonde release should be selected so that under prevailing winds a radiosonde moves off from radar after release.
Upper-air instrumentation is quite volatile and WMO Code Table is not able to take into account all changes in radiosonde design, software upgrades, equipment modernization etc. Since 1998 till 2006 it was lot of equipment modernization and data-processing software upgrades on the Russian upper-air network, respective metadata information was collected but still is not published.
The optimal solution seems to be a keeping as much as possible metadata information (radiosonde serial ID, balloon type, free lift, software and firmware versions, angle adjustments and so on and so on) along with each sounding data archive. 3. Instruments, sensors, upgrade, maintenance, instrument intercomparisons and
traceability In 1989 AVK radar with MRZ-3 radiosonde successfully took part in the 3rd WMO
Radiosonde systems intercomparison and was recognized as meeting WMO requirements to upper-air data performance requirements.
Since the end of 80-s AVK radar remained a backbone of the Russian upper-air network. With design service time as long as 10 years many of them are still in operation (either as the only one or as reserve ground system) due to numerous modernization like replacing non-durable electro vacuum devices in receivers by solid-state microwave modules to ensure better telemetry reception and radiosonde tracking, replacing built-in firmwared minicomputer with PC-based data acquisition and processing system and some others less significant (There were several versions of hardware and software modifications from several manufacturers and it took lot of efforts to document all this variety and provide required support).
MRZ-3 now is not the only radiosonde in use, there are several alternative types with telemetry compatible to MRZ-3, same temperature and alternative humidity sensors. Although the type of thermistor, which serves as sensitive element of the temperature sensors, remains the same, it’s known that earlier used anti-radiation enamel is out of production. For temperature sensors from different manufacturers a calibration may differ as well as slight variations in the design of sensor mounting and anti-radiation coating may affect thermal equilibrium. Therefore, radiation correction may require modification. So, both temperature and humidity sensors again require intercomparison. Its worth to mention that around 1995-2005 it was in use an alternative radiosonde RF95 with temperature and humidity sensors of world-recognized Vaisala RS80 radiosonde. However, at the moment production of RS80 was ceased and new generation of Russian radiosonde with sensors of Vaisala RS92 radiosonde is not ready yet.
For investigation of compatibility of radiosonde temperature sensors from various Russian radiosonde manufacturers in free atmosphere it was developed a lightweight platform (see Figure 8) to be deployed as an autonomous piggy-back payload to high-altitude stratospheric balloons during various international research programs. It allows simultaneous registration of up to 16 thermistors during ascent, drift and descent of a balloon. As well, it can carry out a pair or two of Vaisala RS80 and RS92 radiosonde sensor. 5 test flight were undertaken during experiments with stratospheric balloons of 2009-2010 performed by CNES, France, in Swedish Space Corporation ESRANGE Space Center in Kiruna, Sweden. Totally 76 temperature sensors from two manufacturers (38 pcs from each one) were tested, the very first results will be presented on WMO TECO-2010 in Helsinki. It is considered a possibility to use the platform for intercomparison of humidity sensors.
Since around 2005 a new generation domestic upper-air radars MARL and Vektor became available. Owing to National Hydrometeorological Modernization Project, co-sponsored by International Bank for Reconstruction and Development and the Government of Russian Federation as well as to preparation to IPY new radars were installed at more than 60 stations (6 mothballed stations resumed their operations). Improved procurement resulted in increase in observational program fulfillment and soundings height. Not everything went smooth but the tendency is apparently positive. Major remaining issues regarding upper-air ground system are following:
1.1 Maintenance of worn-out AVK radars and further replacing them with new generation radars to make upper-air observations sustainable;

158
1.2 compatibility and skill of new radars data-processing software; 1.3 uncertain reliability of one of new upper-air radar.
a) b) Fig 8. System for Testing Aerological Sensors - on the ground (a) and in a flight (b).
Most of the Russian upper-air stations use chemical method for producing hydrogen and it’s desirable to replace them with electrolytic generator for many reasons. 12 new domestic electrolytic generators were delivered to the network however their reliability and safety were found to be insufficient and manufacturer was requested to remedy defects. 4. Quality assurance / quality control (real-time, non-real time)
Upper-air QC and quality management in the Russian Federation is a multi-tier system of near real-time observation error checks and medium- and long-range QC and performance monitoring:
At upper-air stations: - operational quality control during flight until message reporting; - next-day re-check; - cross-check by station engineer-aerolog. At Regional administrations – spot-check of observations raw and processed data,
connecting upper-air stations and lead centre (verification of rejected data), periodical site inspections.
At Hydrometeorological centre of Russia (WMC “Moscow”) – operational upper-air data QC within regular data assimilation cycles.
At Russian Research Institute for Hydrometeorological Information – World Data Center (RIHMI-WDC) in Obninsk – QC of archived upper-air data.
At Central aerological observatory – monthly and long-term upper-air network performance monitoring based on products from Hydrometeorological centre of Russia. The main function of Central aerological observatory in the QC/QM system is providing feedback to upper-air stations and requesting remedial actions: periodical inspections of upper-air observations in the Regional administrations, maintenance requests, site inspections, requests to radiosondes, ground equipment and software manufacturers, guidelines and consultations.
At the Roshydromet level: the yearly best stations national contest based on reports from the Regional administrations and Central aerological observatory.
Most sources of operational information used for national upper-air network performance monitoring in Central aerological observatory were recently upgraded and now include:
• 00 and 12 UTC de-coded radiosounding results from parts A, B, C and D of TEMP messages, there were added sections 3, 4 and 7;
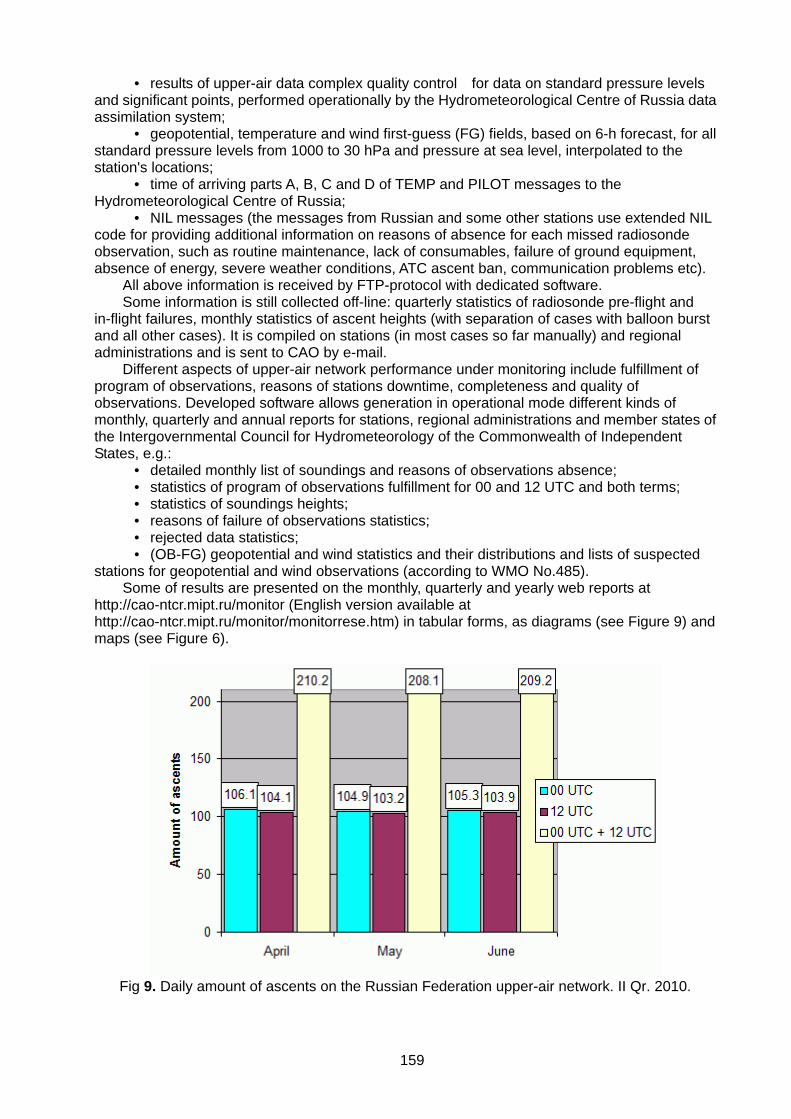
159
• results of upper-air data complex quality control for data on standard pressure levels and significant points, performed operationally by the Hydrometeorological Centre of Russia data assimilation system;
• geopotential, temperature and wind first-guess (FG) fields, based on 6-h forecast, for all standard pressure levels from 1000 to 30 hPa and pressure at sea level, interpolated to the station's locations;
• time of arriving parts A, B, C and D of TEMP and PILOT messages to the Hydrometeorological Centre of Russia;
• NIL messages (the messages from Russian and some other stations use extended NIL code for providing additional information on reasons of absence for each missed radiosonde observation, such as routine maintenance, lack of consumables, failure of ground equipment, absence of energy, severe weather conditions, ATC ascent ban, communication problems etc).
All above information is received by FTP-protocol with dedicated software. Some information is still collected off-line: quarterly statistics of radiosonde pre-flight and
in-flight failures, monthly statistics of ascent heights (with separation of cases with balloon burst and all other cases). It is compiled on stations (in most cases so far manually) and regional administrations and is sent to CAO by e-mail.
Different aspects of upper-air network performance under monitoring include fulfillment of program of observations, reasons of stations downtime, completeness and quality of observations. Developed software allows generation in operational mode different kinds of monthly, quarterly and annual reports for stations, regional administrations and member states of the Intergovernmental Council for Hydrometeorology of the Commonwealth of Independent States, e.g.:
• detailed monthly list of soundings and reasons of observations absence; • statistics of program of observations fulfillment for 00 and 12 UTC and both terms; • statistics of soundings heights; • reasons of failure of observations statistics; • rejected data statistics; • (OB-FG) geopotential and wind statistics and their distributions and lists of suspected
stations for geopotential and wind observations (according to WMO No.485). Some of results are presented on the monthly, quarterly and yearly web reports at
http://cao-ntcr.mipt.ru/monitor (English version available at http://cao-ntcr.mipt.ru/monitor/monitorrese.htm) in tabular forms, as diagrams (see Figure 9) and maps (see Figure 6).
Fig 9. Daily amount of ascents on the Russian Federation upper-air network. II Qr. 2010.

160
5. Training There are an institute and several technical schools providing higher and high
hydrometeorological education. Due to lack of resources for trainees travel and accommodation training activity is mainly
limited to episodic courses related to new equipment introduction. Last Roshydromet workshop on upper-air observation issues took place in 2004.
Web-conferencing is studied as a potential platform for discussions and training. The problem for communication is the amount of time zones in the Russian Federation, so a platform to choose must provide possibilities both for online and offline conversation.
6. Statistics and applications
RIHMI-WDC in Obninsk has the Aerological department dealing with all aspects of upper-air data processing. It has two thoroughly checked data sets of global upper-air data: the AEROSTAB data (uper-air observations obtained through communication channels) and the Comprehensive Aerological Reference Data Set (CARDS), developed in cooperation with NCDC in Asheville. Various derived products for boundary layer and free atmosphere are available: long term monthly means, variability and extremes, auto- and cross-correlations, trends and so on. 7. Current issues and future plan
Remaining major issues are: Out-of-repair ground systems at some stations, unstable performance of some new ground systems, unstable reliability of radiosondes, staff recruitment and motivation, manual input of upper-air messages to teletypes on many stations, sometimes lack of chemicals and power supply, radio interference (esp. with cellular networks) issues.
Problems for quality monitoring result from heterogeneity of the network (various ground systems and radiosondes could be in use at the particular station simultaneously). Now we realized separate monitoring of different ground systems (i.e. separate OB-FG statistics for a new and alternative ground systems) and are about to present to the public the first results for July. In plans there is also separate monitoring for various radiosonde type that will provide as a tool for feedback to procurement policy.
There is also a need to present our new ground systems to comprehensive intercomparison with world-wide modern upper-air systems.

161
Sri Lanka
JMA/WMO Workshop on Quality Management in Surface,
Climate and Upper-air Observations in RA II (Asia)
Tokyo, Japan 27-30 July 2010
Doc.
Country ________
( .VII.2010)
Meteorological Observations and Instrumental Systems for Meteorological services in Sri Lanka
(Submitted by M.D. Dayananda, Department of Meteorology, Sri Lanka)
Summary and Purpose of Document
This document contains an overview of the surface and upper-air observations in Sri Lanka, with respect to instruments, Data Network, quality assurance / quality control, training, and applications.
162
1. Indroduction 1.1 General Introduction About Sri Lanka: Sri Lanka is an island in the North Indian ocean, just south-east of the southern tip of the Indian sub continent, having an arial extent of 65,610 square kilometers. The highlands, mostly above 300 meters, occupy the south central part of Sri Lanka with numerous peaks (Pidurutalagala -2524 m, Kirigalpotte - 2396 m), high plateaus and basins and are surrounded by an extensive lowland area. There are twenty-five (25) Administration Districts in the Country with 246 sub-divisions. The population in Sri Lanka is about 20 million and the ethnic division of the population is: Sinhalese 74%, Tamil 18%, Moor 7%, Burgher, Malay, and Vedda 1%. Major languages are: Sinhala 74% (official and national), Tamil 18% (national), other 8%. English is commonly used in government and spoken competently by about 10% of people. Population density of Sri Lanka is 792 per square miles.
1.2 Meteorological Characteristics:
Due to its location within the tropics between 5o 55' to 9o 51' North latitude and between 79o 42' to 81o 53' East longitude, and in the Asiatic monsoon region, the climate of the island could be characterized as both tropical as well as monsoonal. Topographical features mentioned above influence strongly on spatial variation of climate in the island. The mean annual rainfall varies from under 1000mm in the southeastern and northwestern parts to over 5000mm in the western slopes of the central highlands. The mean annual temperature varies from 270C in the coastal lowlands to 160C at Nuwara Eliya, in the central highlands (1900m above mean sea level). This relatively unique feature manifesting as sunny beaches to rain forests inland is a tourist attraction. The island is seasonally affected by two regional scale wind regimes. The Southwest monsoon is from May to September and the Northeast monsoon from December to February. The intermonsoon periods, the transition periods between the two monsoons are, from March to April and from October to November. The rainfall during these intermonsoon periods is mainly due to convective thunderstorm activity. It is characteristic to have long spells of dry days over most parts of the country except in the north and east during January and February, with ground frost appearing in the central hills where vegetables are grown. During the months of November to December, depressions forming in the Bay of Bengal (and Arabian Sea) tend to intensify into cyclonic storms and move closer to Sri Lanka bringing much rain and wind; but chances of land fall along east coast are very low; only 13 out of some 1,300 storms since 1891. Devastation due to cyclones thus does not top the list of natural disasters. However gust of strong winds during the southwest monsoon period cause damage to houses and other building structures in the southwest quarter of the island. Another phenomenon that increasingly threats the life and property is lightning. Torrential rains too cause floods displacing people and, also in the other extreme, prolonged dry spells sometimes affect agriculture adversely. Landslides in the hill country are also on the increase as a natural calamity, during the recent years.

163
2. Organization
2.1 Present Situation The Directorate of Meteorology consists of The Director General of Meteorology as the Head with two Directors and five Deputy Directors: all are former Meteorologists except Dututy Director administration. Most divisions are under a Meteorologist-in-Charge with NMC and International Airport Meteorological Office having four additional Meteorologists each as Forecasters, for round the clock service. In the Department Head Office there are ten (10) main Branches (Divisions) viz., National Meteorological Centre (NMC), Agro-meteorology, Computer, Radar, Instrument, Rainfall, Climate , Data Divisions and Establishment & finance Divisions.
3. The current Status of Meteorological Instrument and Observational System 3.1 Meteorological Observation Network 3.1.1 Surface observations Department of Meteorology, Sri Lanka maintains 20 meteorological stations scattered throughout the Island, manned by trained meteorological observers. In addition to the department headquarters in Colombo, 19 outstation meteorological offices are operated.:
Surface observations at main standard time of observation (i.e 0000, 0600, 1200 and 1800 UTC) and at the intermediate time of observation (i.e. 0300, 0900, 1500 and 2100 UTC) are done at : 1). Anuradhapura (080 20' N 800 23'E) 2). Batticaloa (00 0' N 00 0' E) *3).Colombo (060 54' N 790 52' E) 4).Galle (060 02' N 800 13' E) *5).Hambantota (060 07' N 810 08' E) 6).Katugastota (070 20' N 800 38' E)
7).Katunayake (070 10' N 790 53' E) *8).Nuwara Eliya (060 58' N 800 46' E) *9).Puttalam (070 02' N 790 50' E) 10). Ratmalana (060 49' N 790 53' E) 11). Ratnapura (060 41' N 800 24' E) 12).Trincomalee. (00 0' N 00 0' E)
The following stations are done surface observations at 0300, 0600, 0900, 1200 and 1500 UTC. 1). Badulla (060 59' N 810 03' E) 2). Bandarawela (060 49' N 800 58' E) 3). Jaffna (00 0' N 00 0' E) *4). Kurunegala (070 28' N 800 22' E)
5). Maha Illupallama (080 07' N 800 28' E) 6). Mannar. (00 0' N 00 0' E) 7). Pottuvil. (00 0' N 00 0' E) 8). Vauniya (00 0' N 00 0' E)
* indicate RBCN. See the Table-1 and Fig. 1.
Table -1 Number of stations
RBSN RBCN GSN Manned stations
AWS *
number 20 05 20 20 33 Automatic Weather Stations (AWS)
Under the JICA granted project (“ the project for Improvement of Meteorological and Disaster Information Network “) Department has being received 38 AWS systems and 33 AWS’s already installed and these data is being used for

164
forecasting purposes and mitigation of disaster due to heavy rainfall even-though they are in experimental stage. National forecasting centre receive these data in every 10 minute period of time. The remaining 05 AWS system will be installed within this year.
3.1.1 Upper Air Observations Upper air observations are done at Hambantota in the extreme south, Puttalam in the west and Colombo in the southwest coast and Polonnaruwa(new station, still this station data not send to GTS). See the Table-2 and Fig.-2. Radar and Radiosonde Observations (upper air observation which give wind, temperature and pressure data up to about 20,000 metres or more) are done only at Colombo.
+ Table - 2 Number of stations
RBSN RBCN GSN Manned stations
Automated system stations
number 03 03 01 03 0
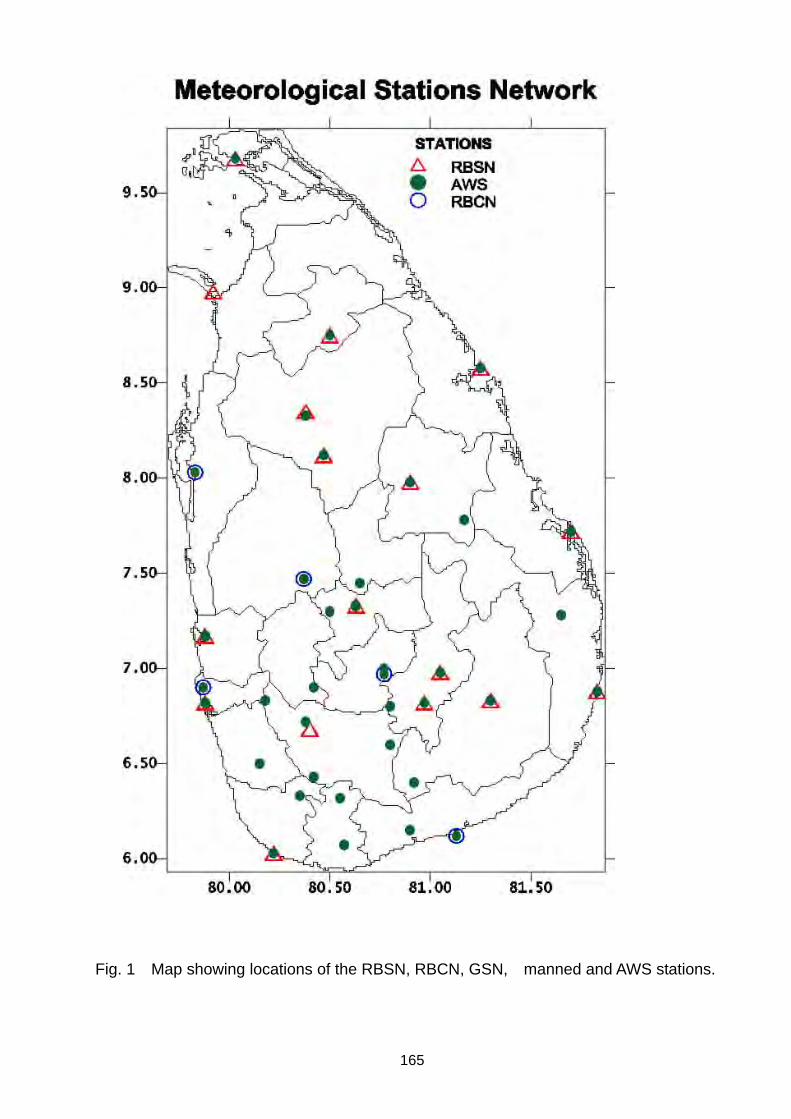
165
Fig. 1 Map showing locations of the RBSN, RBCN, GSN, manned and AWS stations.

166
Fig. 2 Map showing locations of the Upper Air Observation Network
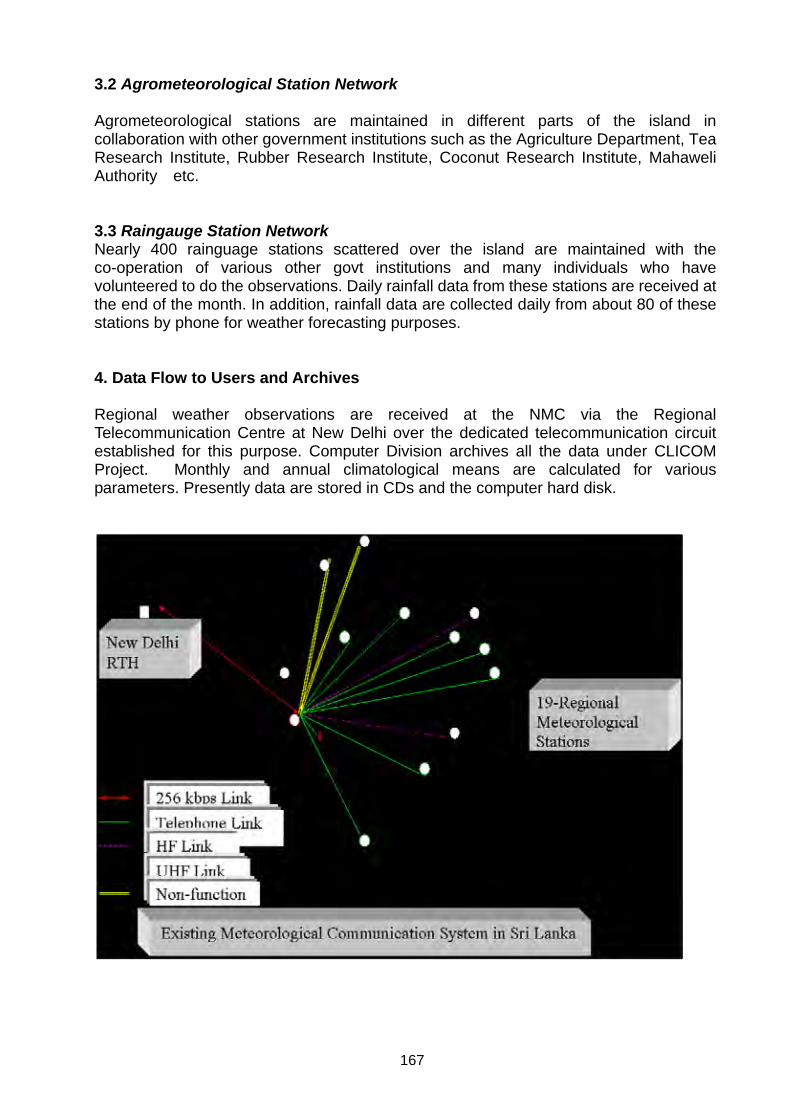
167
3.2 Agrometeorological Station Network
Agrometeorological stations are maintained in different parts of the island in collaboration with other government institutions such as the Agriculture Department, Tea Research Institute, Rubber Research Institute, Coconut Research Institute, Mahaweli Authority etc.
3.3 Raingauge Station Network Nearly 400 rainguage stations scattered over the island are maintained with the co-operation of various other govt institutions and many individuals who have volunteered to do the observations. Daily rainfall data from these stations are received at the end of the month. In addition, rainfall data are collected daily from about 80 of these stations by phone for weather forecasting purposes.
4. Data Flow to Users and Archives
Regional weather observations are received at the NMC via the Regional Telecommunication Centre at New Delhi over the dedicated telecommunication circuit established for this purpose. Computer Division archives all the data under CLICOM Project. Monthly and annual climatological means are calculated for various parameters. Presently data are stored in CDs and the computer hard disk.

168
4.1 Quality controll
4.1 Quality controlling of data Quality controlling of data is done subjectively at the observatory, NMC, Data branch and at the Climate branch. Following checking are carried out .
Check for coding errors Check for physical reasonableness of observation Check against it’s neighbours, spatial and temporal consistency Check against self recording charts
5. Utilization of Meteorological Observation and Instruments The NMC is responsible for the collection and processing of Meteorological Data received from field offices, and outside via GTS. Synoptic and Upper Air data are plotted and analyzed manually every six hourly (local data 3 hourly). The weather forecasts are issued using subjective methods by looking at the analyzed charts (synoptic & upper air), satellite images etc, by experienced meteorologists. The quality of the forecast certainly depends on the skill and the experience of the meteorologists. This Division is manned 24 hours by a Meteorologist for Weather Forecasting. All queries on current and forecast weather are dealt by this Division. One Meteorological (field) station serves for the International Aviation while another serves for the Domestic. Issue of weather warnings during Bad Weather periods is done by the NMC for general

169
public and by the Airport Meteorological Office for Aviation. Agro-meteorology Division collects data from the relevant stations and is to be examined and quality controlled by Observers. These data are then condensed as weekly values and used to calculate long-term means. Every type of data is supplied to Researchers and other interested parties such as Industrialists. . Instrument Branch attends to defects and deficiencies in instrumentation and also calibration. These services are extended to Agro-meteorological Stations too whenever possible. Rainfall Branch looks after deficiencies at rain gauge stations and keep records of timely reception of data monthly and checking for authenticity. Data and Climate Branches examine and quality control Meteorological data received from all the Meteorological Stations. Astronomical information to the general public, such as phases of moon, sunrise, sunset, eclipses, etc., are also provided by the Climate Division. The first step in the planning and designing of development projects like irrigation schemes, hydropower generation projects etc., is a feasibility study, which involves, inter alia, an analysis of climatological data. The Department of Meteorology plays an important role in these studies by supplying meteorological data, which have been systematically recorded over many years. Data are also sought for the designing of building, towers, factories, roadways, establishment of agricultural farms, designing of drainage systems, disaster mitigation studies, research studies etc. This responsibility is shared among the Data, Climate and Agro-meteorology Divisions. Meteorological Office at the International airport , Katunayake is responsible for all aeronautical met services. Half hourly METAR are done and necessary TAF, SIGMET are issued according to the ICAO regulations. WAFS products down loaded from SADIS are also provided with manually prepared windtemp and sigwx charts. Training courses on aeronautical Meteorology are also conducted for the airline personnel. . 6. Training Nearly once a year training programme is organized at the Head Office for observers for upgrade their knowledge and skill about the observations and to give proper knowledge to handle and maintenance of conventional and AWS instruments. 7. Current issues and future plans Most of the sensors (specially wind sensors) of the present AWS system (donated by Japanies Government - under JICA project) are malfunctioned very frequently. But the department is not having expertise to rectify this problem. Due to the system is under warranty period, suppler is helping to replace these sensors. Therefore department is needed external expertise assistance for maintenance of the system. Department is does not having proper archiving system, in future it is essential establish a proper system for data archiving. Organizing of Instrumentation training programme regionally will be used full for calibration of instruments and verification of data. The Quality managment system in Sri Lanka is not in WMO standard as such the Department of Meteorology is seeking the ways to improve the QMS. Firstly we are going to establish a quality core team with a quality Manager. This core group will prepare the required document. In the meantime discussion are going on with Aeronautical authorities to implement QMS for the Meteorological office at the Airport. Quality inspector will be nominated.
170
Thailand
JMA/WMO Workshop on Quality Management in Surface,
Climate and Upper-air Observations in RA II (Asia)
Tokyo, Japan 27-30 July 2010
Doc.
Japan ________
(10.VII.2010)
METEORLOGICAL OBSERVATIONS IN THAILAND (Submitted by Songkran Agsorn, Ph.D., Director, Weather Observation Bureau,
Meteorological Department, Bangkok, Thailand.)
Summary and Purpose of Document
This report reviews the present status of meteorological observing stations in Thailand. A total of 122 weather stations are employed throughout Thailand, mostly surface weather. Some stations are assigned for WMO-RBSN, RBCN, GSN and GUAN stations. Almost all surface stations are operated 8 synoptic times daily. Mixed standard manual and modern automatic weather instruments are used. Coded messages are sent from the observing stations manually. Data quality assurance/control is performed both real-time (on message programing) and non-real-time (by manually audits). Observers are directed to refreshing courses, training or seminar periodically.

171
1. Observation networks 1.1 Surface observations 1.1.1 Number of stations: RBSN, RBCN, GSN, manned stations and AWS Table 1. Number of stations
RSBN GSN Manned Stations AWS*
Number 87 6 122 ----
1.1.2 Site Map
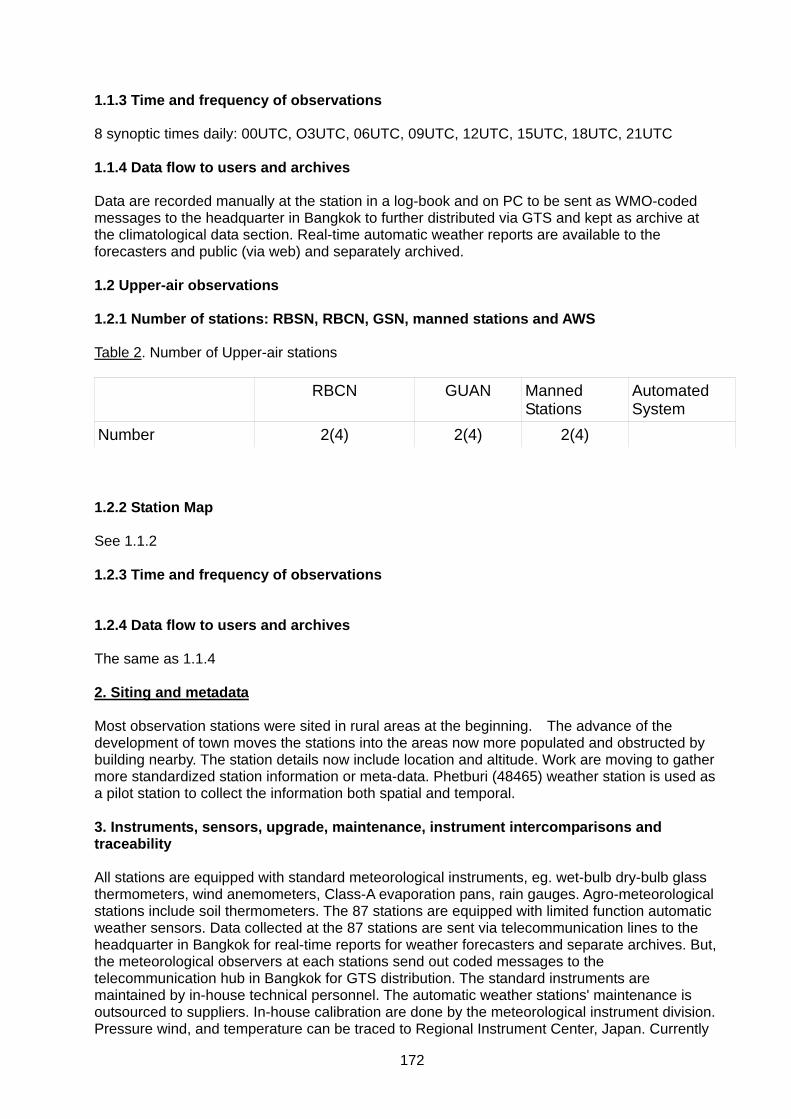
172
1.1.3 Time and frequency of observations 8 synoptic times daily: 00UTC, O3UTC, 06UTC, 09UTC, 12UTC, 15UTC, 18UTC, 21UTC 1.1.4 Data flow to users and archives Data are recorded manually at the station in a log-book and on PC to be sent as WMO-coded messages to the headquarter in Bangkok to further distributed via GTS and kept as archive at the climatological data section. Real-time automatic weather reports are available to the forecasters and public (via web) and separately archived. 1.2 Upper-air observations 1.2.1 Number of stations: RBSN, RBCN, GSN, manned stations and AWS Table 2. Number of Upper-air stations
RBCN GUAN Manned Stations
Automated System
Number 2(4) 2(4) 2(4)
1.2.2 Station Map See 1.1.2 1.2.3 Time and frequency of observations 1.2.4 Data flow to users and archives The same as 1.1.4 2. Siting and metadata Most observation stations were sited in rural areas at the beginning. The advance of the development of town moves the stations into the areas now more populated and obstructed by building nearby. The station details now include location and altitude. Work are moving to gather more standardized station information or meta-data. Phetburi (48465) weather station is used as a pilot station to collect the information both spatial and temporal. 3. Instruments, sensors, upgrade, maintenance, instrument intercomparisons and traceability All stations are equipped with standard meteorological instruments, eg. wet-bulb dry-bulb glass thermometers, wind anemometers, Class-A evaporation pans, rain gauges. Agro-meteorological stations include soil thermometers. The 87 stations are equipped with limited function automatic weather sensors. Data collected at the 87 stations are sent via telecommunication lines to the headquarter in Bangkok for real-time reports for weather forecasters and separate archives. But, the meteorological observers at each stations send out coded messages to the telecommunication hub in Bangkok for GTS distribution. The standard instruments are maintained by in-house technical personnel. The automatic weather stations' maintenance is outsourced to suppliers. In-house calibration are done by the meteorological instrument division. Pressure wind, and temperature can be traced to Regional Instrument Center, Japan. Currently

173
both standard (manual) and automated measurement data are collected for intercomparisons. Upper-air sondes are calibrated before sending up, according to manufacturer's instruction. 4. Quality assurance/quality control (real-time, non-real-time) Data quality assurance is first done on a computer program to send the coded messages by observers in real-time. Non-real-time qualty control is processed by central officials inspecting the observation reports send monthly and comparing with stored electronic messages from the stations and kept at the central computers. 5. Training Periodic refreshing training and seminars for the observers are done about 3-4 times a year. Correspondence between stations and the Observation Standard Sections have been continuously done in wake of misunderstanding of observation procedures or the new or changed WMO codes or procedures. New observers have to pass one-year program study of meteorological personnel offered by the department. 6. Statistics and applications Surface observations are used first-hand by the weather forecasters. They are also shown to the public in the official web-site of the Meteorological Department. Archived data, now computerized, are given out to the public for further applications. Upper-air data are used in the same way as the surface data; fewer upper-air data are requested by the public. Most upper-air data requested are used with environmental applications. 7. Current issues and future plan This coming fiscal year, the department intends to procure the three more radiosonde ground stations to be used at Phuket Airport (48565), Songkhla (48568) and Ubon Rachatani (48407) replaced the unusable Vailla ground stations that do not work with the newer sondes.
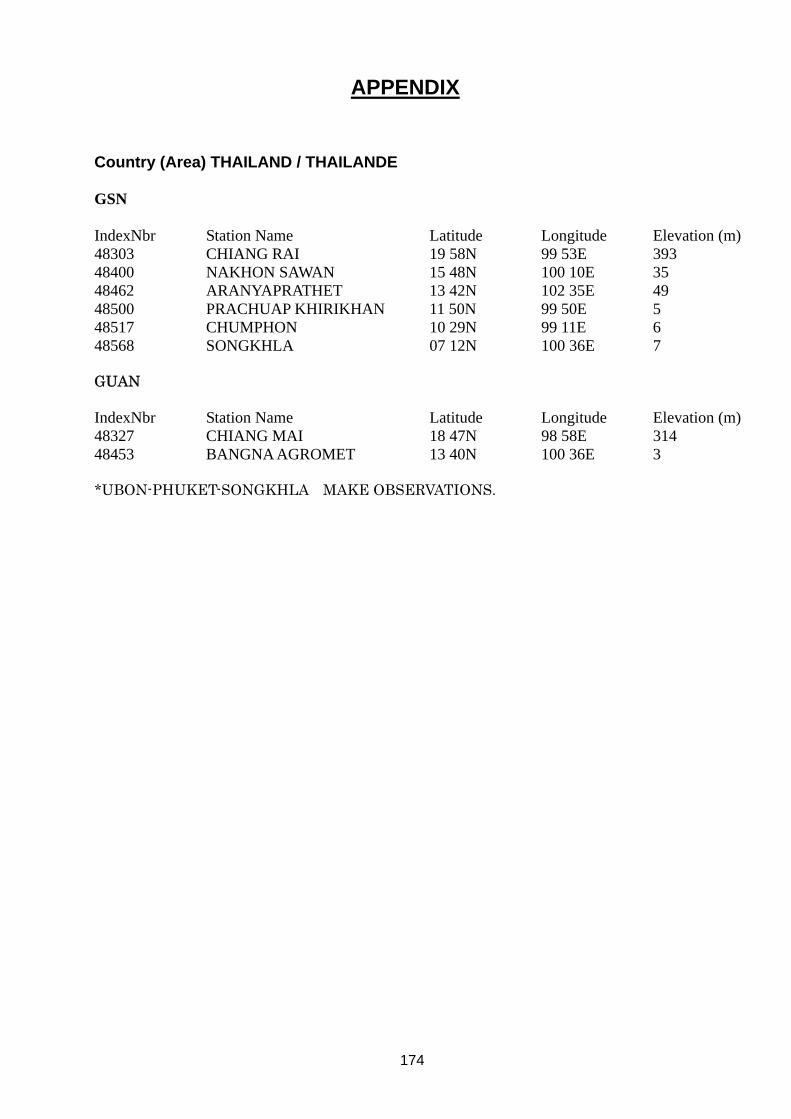
174
APPENDIX Country (Area) THAILAND / THAILANDE GSN IndexNbr Station Name Latitude Longitude Elevation (m) 48303 CHIANG RAI 19 58N 99 53E 393 48400 NAKHON SAWAN 15 48N 100 10E 35 48462 ARANYAPRATHET 13 42N 102 35E 49 48500 PRACHUAP KHIRIKHAN 11 50N 99 50E 5 48517 CHUMPHON 10 29N 99 11E 6 48568 SONGKHLA 07 12N 100 36E 7 GUAN IndexNbr Station Name Latitude Longitude Elevation (m) 48327 CHIANG MAI 18 47N 98 58E 314 48453 BANGNA AGROMET 13 40N 100 36E 3 *UBON-PHUKET-SONGKHLA MAKE OBSERVATIONS.

175
Uzbekistan
JMA/WMO Workshop on Quality Management in Surface,
Climate and Upper-air Observations in RA II (Asia)
Tokyo, Japan 27-30 July 2010
Doc.
Country ________
( .VII.2010)
Observational hydrometeorological network in Uzbekistan: Status , data acquisition and control
(submitted by Aleksandr Merkushkin, Uzhydromet, Uzbekistan)
Summary and Purpose of Document
The document given had been compiled in correspondence with requirement the ongoing pilot project to enhance the availability and quality management support for national meteorological and hydrological services in surface, climate and upper-air observations. The purpose of this document is to give brief information on status of existing observational ground hydrometeorological network in Uzbekistan as well as to outline the main principle of data acquisition and data control provided. Also the some issues related to improvement of existing data collecting, monitor and data dissimilation infrastructure are briefly discussed.

176
1. Observation networks Critical water management within the five central Asian republics (CAR) of the former Soviet Union requires access to reliable climate and hydrological data. Under the Soviet Union an extensive network of manual climate stations was operated within the region. This network provided some of the essential climate data required for water resource management and forecasting. The network included stations throughout most of the region including remote stations within critical precipitation accumulation areas. A significant reduction in capacity of the CAR governments to provide this vital data has followed the collapse of the Soviet Union. Many of the remote stations in significantly accumulated areas have been abandoned or are staff by minimally qualified observers. The snow survey program has been significantly reduced. Most remaining climate stations are concentrated outside of significant snow and precipitation accumulation areas. Quality control and maintenance procedures are difficult to enforce. The legacy radio, telephone and Teletype communication network is obsolete. Four principle period might be distinguished on the way of evolving observational hydrometeorological network in Uzbekistan. The first period is related to Tashkent’s astronomical and physical observatory establishment at 1870’s. Then the primary meteorological and hydrological network had been deployed and hydrometric department was established. Under umbrella of department given the hydrometric and meteorological services were united. The second period had been lasting from 1918 till 1945. During this period the centralized weather service had been established and some particular researches related to national economic interests had been initiated. Observational network was deployed including marginal and high-mountain sites and status of the operational observational stations was considerably raisen. During the third time period that lasted from 1945 till 1991 the hydromeorological network in Central Asia was significantly affected with technical progress fruits like new equipment and coming of the computers. The favourable economical and financial conditions were pushing incentives to observational network extension. The maximum population of the hydrometeorological station was namely related to the end of this period. The long-term degradation of observational hydrometeorological network is characteristic for the forth period. The stable degradation of hydrometeorological network had run at the end of 1990’s and being resulted in the collapse of the former socio-economical and political system is still ongoing. Spite of objective hassles on the way of observational network prevention Uzbekistan has overcome the situation with minimal losses in respect to other Central Asia countries (see table below)
Table 1The dynamic of population the meteorological stations in Central Asia for the
last decades
Country Number of meteorological stations
1985 1996 2004 Kyrgyzstan 95 62 31 Tajikistan 64 51 47 Turkmenistan 51 51 48 Uzbekistan 91 75 78
I t is remarkable that only Uzhydromet is the authorized body to collect, process and disseminate data have been gathering by its observational network in Uzbekistan so far. As well Uzhydromet accepts and bears the responsibilities on quality and timing of data service available. The observational networks of Uzhydromets consist of 79 meteorological stations and 130 hydrological water gages and stations. Also it includes 84 surface water quality control gages. Data come from 21 meteorological stations are included to the international data exchange cycle for World Weather Centres needs.

177
Nowadays the big project on development of Doppler radar facilities for such airports as Tashkent, Samarkand and Nukus is underway. 1.1 Surface observation (including AWS) 1.1.1 Number of station:RBSN,RBCN,GSN,manned stations and AWS
RBSN RBCN GSN Manned stations
AWS stations
number 78 78 78* 7*
*Seven AWS installed at operational climate stations that were staffed by NHS observers.
The territorial allocation of the both manned and automated weather observational networks is given on the Fig.1 and Fig.2 correspondingly.
1.1.2 Station map
Fig.1 Scheme of observational meteorological network of Uzbekistan

178
Fig.2 Scheme of observational automated weather stations network of Uzbekistan
1.1.3 Time and frequency of observations
Per WMO description on time and frequency of surface observation stated at cf. 2.3.2.11 .(WMO-No. 544) meteorological data are acquired on the regular 3 hours regular basis (8 times per 24 hours) over the all observational meteorological network in Uzbekistan The meteorological observations in Uzbekistan are conducted in accordance with the following observations timetable:
00 UTC □ 01 UTC □ 02 UTC 03 UTC □ 04 UTC □ 05 UTC 06 UTC □ 07 UTC □ 08 UTC 09 UTC □ 10 UTC □ 11 UTC 12 UTC □ 13 UTC □ 14 UTC 15 UTC □ 16 UTC □ 17 UTC 18 UTC □ 19 UTC □ 20 UTC 21 UTC □ 22 UTC □ 23 UTC
1.1.4 Data flow to users and archives
Meteorological data are acquired on the regular 3 hours regular basis (8 times per 24 hours) over the all observational meteorological network in Uzbekistan. Data come to Uzhydromet from observational network via short waves radio channels through the local centres of communication (so-called Bush CommCentres). Bush CommCentres send data to CommCentre where data pass preliminary data control and data processing. These data are stored with data storage CommCenter resources no longer then 3 days. Final data processed are stored as hard copies of tables (TMC-84) and monthly meteorological report in which the main meteorological characteristics are compiled . CommCenter provides the communication link to informational resources for end users of meteorological information and maintains the operational status of communication facilities. Servers and software of CommCentre provide data routing, preliminary data quality control and data storing. Operative Weather Service and the Hydrometeorological Data Support Service provide wide spectrum of services the hydrometeorological data provision for end users. There are agreed list of governmental bodies and organizations that are provided with free meteorological data. Users that are out of that list are provided with paid data.

179
On the inter-state level there occurs sharing by hydrometeorological information between NHMS of the region. 75 hydrological stations,water gages and 280 meteorological stations are included into the process of inter-state operational data exchange . 3 meteorological stations (Tashkent? Tamdy and Chimbay) are included into Global Observation System network that data are transmitted via CLIMAT cable to the GOS on the monthly basis. Per WMO request the NHMS of Uzbekistan had run data transmitting for 9 more stations to the GOS. Nowadays data for 12 stations are available not for WMO only but for all world informational centres since January1, 2001.
2. Siting and metadata Existing observational meteorological network is spatially imbalanced. The highest density of stations population is dated to territories with elevations in 0-1500 m.a.s.l. interval .Figure 3 shows the distribution of the numbers of meteorological stations by elevation intervals. From that it is obvious that there is insufficient coverage with meteorological observations high-mountain and the runoff forming zones.
63.3
26.6
3.8 6.3
0
10
20
30
40
50
60
70
80
90
100
500 1500 2000 >2001
Elevation inrevals, m.
Nu
mb
ers
of
stat
ion
fo
r g
iven
ele
vati
on
in
terv
al t
o t
ota
l nu
mb
ers
of
stat
ion
s,
per
cen
t
Fig.3 Distribution of the numbers of meteorological stations by elevation intervals.
As it was mentioned above the data processed are stored as hard copies of tables (TMC-84) and monthly meteorological report in which the following meteorological characteristics are compiled :
Content of ТМС-84
3 hours data observations 1 Air temperature, soil temperature, dew point temperature 2 Partial pressure of aqueous vapor 3 Relative humidity 4 Aqueous vapor saturation deficit 5 Atmospheric pressure 6 Rate of visibility and cloudness 7 Type of weather 8 Wind speed/direction 9 Precipitation (measured at 03 and 15 MGT)
Daily data 1 Air temperature: average,max, min, min of dew point 2 Soil temperature: average, max, min 3 Partial pressure of aqueous vapor

180
4 Relative humidity :average, min 5 Aqueous vapor saturation deficit: average, max 6 Atmospheric pressure 7 Wind speed:average, max 8 Totalized precipitation 9 Snow depth 10 Solar radiance duration (data on 20 stations available) 11 Soil temperature profile (data on 14 stations available) 12 Ice crust deposits 13 Type and duration of precipitation
Meteorological monthly and yearly books content
№ Type of observations
1 Air and soil temperature (average,max, min) 2 Humidity (relative, absolute) 3 Visibility&cloudness 4 Wind speed (average, max gust) 5 Wind direction due to 16 compass points 6 Wind direction due to 8 compass points Atmospheric pressure 7 Precipitation 8 Precipitation measured on the water gage stations ( it is published in the
meteorological monthly book) 9 Daily and by 10 days period totalized precipitation (it is published in the
meteorological monthly book) 10 Атмосферные явления, число дней, количество часов Atmospheric events
(number of days/hours) 12 Pluviograph records (data from 10 stations) 16 Hazardous phenomena 17 Snow depth and snow condition 18 Solar radiance duration (data on 20 stations available) 19 Soil temperature profile (data on 14 stations available) 25 Ice crust deposits (it is published in the meteorological monthly book)
3. Instruments, sensors, upgrade, maintenance, instrument intercomparisons and traceability As part of the effort to strengthen trans-boundary water resources management within the region, the US Agency for International Development’s (USAID) Natural Resources Management Program (NRMP) funded a pilot automated climate data collection network. Sixteen automated weather stations (AWS) were installed within Tajikistan, Kyrgyzstan, Kazakhstan, Uzbekistan and Turkmenistan during the period from February 2002 to September 2003. Similar equipment is deployed throughout the world. Ease of use, low operational cost, suitability for remote unmanned operation, proven reliable collection of high quality data and capability to electronically store and transfer data are the primary reasons for utilizing automated climate monitoring instrumentation. Most of these stations use the USAID sponsored meteor burst radio communications to provide real time data telemetry and acquisition. Two basic types of automated weather stations (AWS) were deployed within the five central Asian republics. Thirteen of the stations were designed to provide a complete array of typical climate parameters used for water resources management. These stations provide measurements needed for precipitation and evaporation estimation. In addition, the stations provide climate information typically provided for World Meteorological Organization synoptic observations. In addition, three of the stations were designed to also provide continuous monitoring of frozen precipitation. The stations were modeled after the SNOTEL monitoring

181
network located in the western United States and provide accumulated precipitation and snow water equivalent measurements in addition to the climate parameters provided by the other stations. Table 1 is a summary of the instrumentation that was installed at the stations.
Table 2 Measured meteorological parameters and deployed sensors for NRMP automatic weather
stations. Meteorological Parameter
Sensor Manufacture Reported Operating Range and Accuracy
Notes:
Data logger and Control Module
Campbell Scientific CR10X
-55..+85°C ±0.1 of Full Scale Range @ (-25 to 50 °C)
Air Tem-perature
Vaisala HMP45D w/ Pt 100 IEC 751 enclosed in RM Young 41003 Multi-Plate Radiation Shield
-40..+60°C ±0.2 °C @ 20 °C ±0.5 °C maximum within Range
Additional error is introduced due to heating of radiation shield and is dependent on wind speed and radiation intensity
Relative Humidity
Vaisala HMP45D w/ HUMICAP® 180
0..100% ±1% against factory references ±3% field calibration
Maximum error occurs between 90% and 100%
Atmo-spheric Pressure
Vaisala PTB100 Analog Barometer
600.. 1060 mb ±0.5 mb @ +20°C ±6 mb maximum within -40.. +60 °C Range
Measures absolute pressure and uses equation to calculate pressure at sea-level
Wind Speed and Direction
RM Young 05103 Wind Speed 0..60 m/s Gust survival 100 m/s ±0.3 m/s Wind Direction 0..355° ±3°
Solar Radiation
Kipp & Zonen CM3 0..2000 W/m2
±10% for daily sums Second Class thermopile type pyranometer Standard ISO 9060.
LiCOR LI200X 0..3000 W/m2 ±5% maximum absolute error in natural daylight ±3% typical
High stability silicon photovoltaic detector. Comparable to a first class thermopile pyranometer.
Preci-pitation (Rainfall)
Texas Electronics 525M Tipping Bucket Rain Gauge
0.1 mm resolution 1.0% < 25 mm/hr +0..-3% 25..50 mm/hr +0..-5% 50..75 mm/hr
Not suitable for measurement of snow. Heated tipping bucket rain gauges are not recommended by WMO.
Prec-ipitation (Accumulated)
Storage Gauge w/ Druck 1230 Submersible Pressure Transducer
7m H2O 2 cm H2O resolution
Requires annual recharge of antifreeze. Pressure transducers are subject to mechanical non-linear drift.
Snow Water Equivalent
3 meter Hypalon® Snow Pillow w/ Druck 1230 Pressure Transducer
7m H2O 2 cm H2O resolution
Extremely sensitive to placement. May be under representative because of snow bridging.
Ground Tempe-rature
CSI T-107/8 Thermistor T-107: -35°..+50°C ±0.4°C for range of –24°..48°C T-108: -5°..+95°C ±0.3°C for range of –3°..90°C
Sensitive to solar radiation heating when sensor exposed to sunlight
Over the last years of this pilot program the AWS stations have demonstrated the capacity to provide reliable and consistent climate observations. The devices have required minimal maintenance while providing high quality regular observations. It is not recommended that

182
automated monitoring replace historical manual climate observation stations. However, automated stations can provide a cost effective and sustainable means for establishing a more comprehensive climate-monitoring program in the Central Asian Republics. Electronic sensors evaluate the same physical phenomenon using different physical properties. For example, a liquid thermometer determines temperature by measuring the change in liquid volume where a Platinum Resistance Thermometer measures the change in electrical resistance. Sensor measurement time constants are different and the interaction of the sensor to site placement and enclosures will be different. Traditional calibration methods may not be suitable for calibration of electronic sensors. Field evaluation and calibration techniques are available for assessment of the operation of the sensor, but require a higher level of technical skill to perform than the more traditional sensors. Periodic calibration may require sophisticated offsite or lab evaluation. Electronic sensors require the inclusion of an analog to digital converter that may introduce additional error. Periodic maintenance and data quality evaluation will still need to be followed in order to assure the quality of the AWS data. Automatic operational alarms and periodic data quality review procedures must be implemented in order to assure the timely repair of equipment failure. Emergency maintenance trips may be warranted as review of the data indicates abnormal station operation. Because of the recognized differences, AWS instrumentation is not typically considered for replacement of manual instrumentation for historical climate stations. Simultaneous operation can help define some of the differences in the change of station, but simple correlation will not be sufficient for defining all of the differences due to the inherent noise in climatic data. Differences were evaluated between the simultaneously and automated collected data. Hourly data was compiled and compared at various time intervals for the four stations. In general, climate observations of the automated equipment over the approximately two-year operation agreed very well with the manual observations. Differences in the mean temperatures for the three-hour temperature ranged from 0.030 to 0.220 °C. Differences between the temperature extremes ranged from 0.049 to 0.595 °C. Relative humidity differences ranged from 1.2% to 0.5%. Atmospheric pressure ranged between 0.482 to 0.936 millibars. Except for temperature there appears to be no bias in the observations. Over the last two years of this pilot program the AWS stations have demonstrated the capacity to provide reliable and consistent climate observations. The devices have required minimal maintenance while providing high quality regular observations. The results of comparative statistical analysis say that:
1. Only daily averaged measurements by sensors look like as confident in terms of statistically proven homogeneity in respect to manual data series.
2. Data come from sensors with 3 hours resolution cannot be merged to the manual data series as being a replenishment of that data series without adequate data processing because the risk of heterogeneity.
3. Variance sensor data-manual data can be minimized via mitigation the ambient influences.
4. Quality assurance / quality control (real-time, non-real time)
. Per WMO requirements to data control Within the framework of the Global Observing System (GOS). (WMO-No. 544) the following successive data control are applied in operative Uzhydromet practice:
In situ level (before data transmitting to Communication Centre) : Observer’s preliminary data control doing per experience and logical considerations.
Communication centre level (before bulletin is formed and transmitted to GTS) : The data preprocessing of data received to check the compliance data coded with coding rules per WMO’s telegrams coding requirements.
Synoptic Operational Service level (within 1 hour after bulletin has been formed and transmitted to GTS) : Synoptic operational shift staff collates data after mapping and makes any amendments if need per its experience, logical current considerations and via immediate

183
feedback to observational network. Any reliable amendments are sent to GTS as delayed compliments to bulletin sent earlier.
Data processing centre level: Comprehensive data control and analysis doing before meteorological data monthly books publishing.For data processing the program modules of PERSONA-mis and PERSONA-IB are used.
5. Training
Two programs addressed to improvement the national meteorological service via installation three Doppler locators at main airports of Uzbekistan and to facilitate access to high resolution satellite images (purchase and installation of the High Resolution Picture Terminal for receiving satellite images processed by TERRA/MODIS) funded by government of Uzbekistan serial training programs are expected.
6. Statistics and applications
The major objectives of Uzhydromet are the development and improvement of the state system of hydrometeorological observations, hydrometeorological provision of the sectors of economy, scientific research activities, improvement of short-term and long-term weather forecasts, water availability of rivers, climate change.
The main meteorological characteristics measured or calculated are listed under item 2. Climate data as a product of processing the meteorological data that can mostly be derived from the available set of meteorological data. Post processed climate data had been published in the “Scientific applied climate handbook” and are available as only hard copies.
Operative data come from observational hydrometeorlogical network are mainly used for:
Provision of the state management bodies and branches of economy with the information on the condition of natural environment and climate, current and anticipated changes in hydrometeorological conditions.
Issuing the short-term (next day, with three-six days lead time weather forecasts)and long-term weather forecasts.
Data Input provision for climate scenarios design and modeling Warning on the anticipated risk of hydrometeorlogical disasters Compiling the “Weather reviews” and “Ecological bulletins” Publications, scientific researches and engineering.
7. Current issues and future plan The following issues as the main existing barriers on the way to full value use of data could be mentioned:
Insufficient representativeness of existing observational ground network from of
both spatial and informational view points. From that it is obvious that there is insufficient coverage with meteorological observations the runoff forming zones.
Data series gaps by different reasons like measuring instruments breakage, observer’s faults, radio communications jams, electricity outages etc.
There are some gaps in the hydrometeorological data series that break homogeneity and continuity of data series. Those gaps can be explained by different reasons. Mainly they appear as results of observers negligence, measuring instruments breakage and radio communication faults. The suspicious data that have the mentioned above nature just filtered out from proved data series during data processing procedure but they are not restored.

184
Data available as only hard copied. Data are storing as hard copies hinder the process of data preparation , process and control. It is really tiresome and laborious routine to transfer data from hard copies to electronic data storages. But it is to be proceeded anyway.
Insufficient data base design and existing data bases dissociation.The process of unification the data base storage formats that would enable easy reciprocal data conversion has not been completed. Mainly existing data bases are stored as operational files for DOS only. Moreover existing data bases need to be fused into integrated informational platform. These archaic data storage is not able to support fast and efficient data exchange for operational hydrometeorological service current needs.
Insufficient automated stations network development. Ongoing world wide progressive use of automated observational networks proves the beauties of this option of data acquisition and control . Rate of coverage the informational needs with data come from AMS is characteristic of readiness to meet advanced data acquisition and control requirements. There are only 7 sites equipped with AMS within observational hydrometeorological network of Uzhydromet that have’t been included into CAR ComCentres data exchange contour yet.
High resolution picture terminal receiving facilities to receive process and disseminate high resolution digital satellite data unavailable. To provide large scaled effective and reliable monitoring on glaciation change the high resolution satellite picture receiving facilities are to developed and installed. Uzhydromet has such facilities allow to gather information come from NOAA 18 with the best resolution as 1 km only. Such resolution doesn’t enable recognition of natural objects with dimension equal or less than 1 km. At the same time such dimension is characteristic for the main number of glaciers in the region. Other recourses with resolution 250 m and higher were available on the irregular basis only.
Radio sounding upper air stations unavailable. Upper air measurement got gradually stop after USSR collapse. There are no radio sounding upper air station now. That’s why the informational shortage on vertical profile of the main meteorological parameters negatively affect to processes of data ingestion by dynamic modeling of upper air processes. Such data provision helps to improve and calibrate the developed models.
Proposed steps forward to improve the current status data acquisition and data control system
Enhancing the spatial and informative capacities of the observational network.
Data transfer from hard copies to the electronic data storages.
Complete data statistical analysis to get reliable relationships to restore the existing data
gaps .
Improvement of existing data bases and ensure the integrated informational platform preconditions.
Provision of the activities addressed to the rehabilitation of the operational status of the automated meteorological stations network and including them to the CAR ComCentres data exchange contour.

185
Viet Nam
JMA/WMO Workshop on Quality Management in Surface,
Climate and Upper-air Observations in RA II (Asia)
Tokyo, Japan 27-30 July 2010
Doc.
Country ________
( .VII.2010)
CURRENT STATUS AND FUTURE PLAN OF SURFACE, CLIMATE AND UPPER-AIR OBSERVATIONS OF NATIONAL
HYDRO-METEOROLOGICAL SERVICE OF VIET NAM (Submitted by: Nguyen Dinh Luong,National hydro-Meteorological Service of Viet Nam)
Summary and Purpose of Document
This report introduces National Hydro-Meteorological Service of Viet Nam, its activities
and organisation. Current status and future plan related to surface, climate and upper-air
observations of Viet Nam are also presented.

186
The National Hydro-meteorological Service of Viet Nam (NHMS) is a body under the Ministry of Natural Resources and Environment of Viet Nam. The main responsibility of NHMS is to manage and operate network of meteorological, hydrological and environmental stations, conduct hydro-meteorological forecast and other services related to these field of operation for socio-economic development of the country.
1. Observation networks
1.1 Surface observation
In total, there are 174 surface meteorological stations in operation in the whole
territory of Viet Nam. All stations are manned stations. In the past, some stations were
equipped with automatic instruments but all of them are out of work at the present.
1.1.1 Number of stations: RBSN, RBCN, GSN, manned stations and AWS*
Table 1: Number of stations
RBSN RBCN GSN Manned stations AWS *
number 174 174 25 174 0
*An automatic weather station (AWS) is defined as a“meteorological station at which
observations are made and transmitted automatically”.

187
1.1.2 Station map
Figure 1: Map of Meteorological stations of Viet Nam
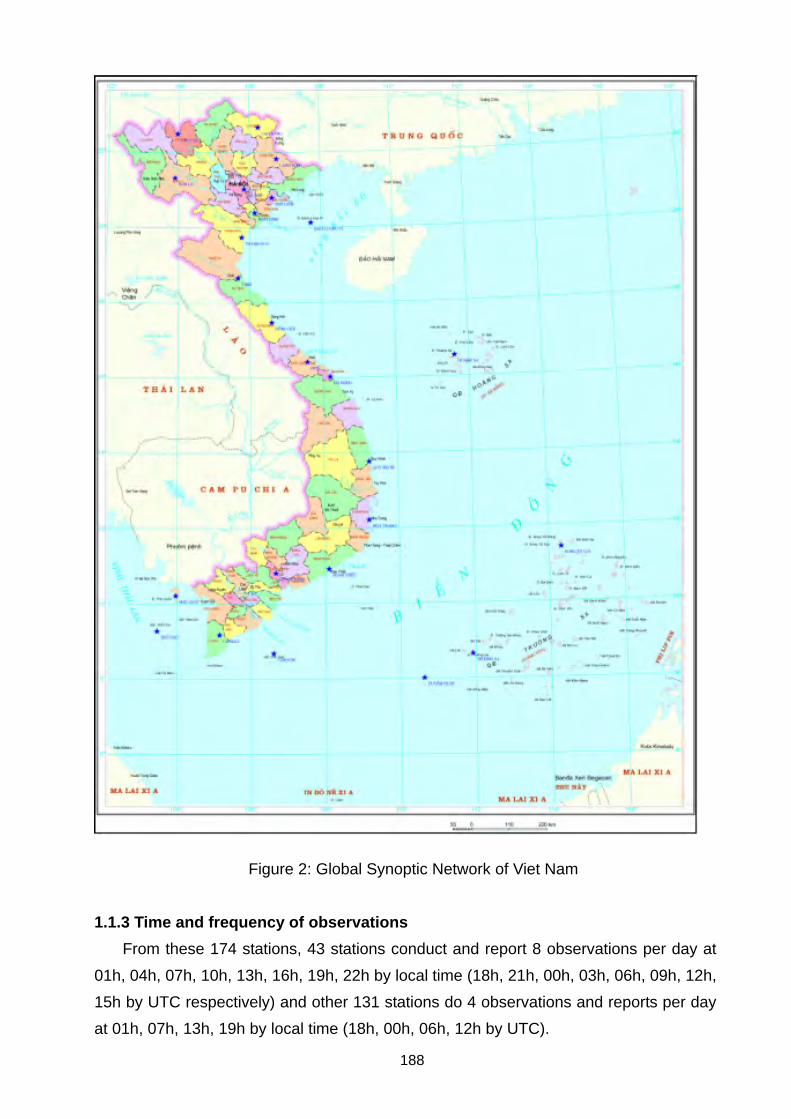
188
Figure 2: Global Synoptic Network of Viet Nam
1.1.3 Time and frequency of observations
From these 174 stations, 43 stations conduct and report 8 observations per day at
01h, 04h, 07h, 10h, 13h, 16h, 19h, 22h by local time (18h, 21h, 00h, 03h, 06h, 09h, 12h,
15h by UTC respectively) and other 131 stations do 4 observations and reports per day
at 01h, 07h, 13h, 19h by local time (18h, 00h, 06h, 12h by UTC).

189
For the stations affected by typhoon, during typhoon time the observation of wind speed
and direction, rain will be conducted and reported at least every hour. Except that, during
typhoon time forecasting bureau can request stations in the typhoon affected area to do
observation and report every 30 minutes.
1.1.4 Data flow to users and archives
Data collected at the stations will be transmitted to the forecasting center in near real
time by telephone or ICOM (for the stations where there is no telephone line). Hard copy
of collected data will be sent to the regional centers for primary processing and checking.
In the next step, after primary processing and checking at regional level, all data will be
sent to the National Center for final processing and checking before archiving. At the
present, all data are archived only in hard copy form (paper).
The users can get data in regional centers or in central data archive center.
1.2 Upper-air observation
1.2.1 Number of stations: RBSN, RBCN, GUAN, manned stations and automated
system stations
Table 2 Number of stations
RBSN RBCN GUAN Manned stations
Automatedsystem stations
number 13 13 13 13

190
1.2.2 Station map
Figure 3: location Map of the upper-air stations.
1.2.3 Time and frequency of observations
At the present, from 13 upper-air stations, 3 stations carry out observation and report
at 07h and 19h of local time (00 UTC and 12 UTC respectively), one station - at 13h of
local time (06 UTC) and others at 00 UTC.

191
1.2.4 Data flow to users and archives
Upper-air observation data collected at the stations will be transmitted to the
forecasting center in near real time by telephone or internet. Hard copy of collected data
will be sent to the regional centers for primary processing and checking. In the next step,
after primary processing and checking at regional level, all data will be sent to the
National Center for final processing and checking before archiving. At the present, all
data are archived only in hard copy form (paper).
The users can get data in regional centers or in central data archive center.
2. Siting and metadata
Technical documentation (station book) is created for all stations. There are two hard
copies of technical documentation for each station, one for station and one for network
management center.
The content of technical documentation consists:
- Siting specifications: location map, longitude, latitude, pictures (at least from two
sides), elevation above sea level, horizontal visibility.
- Station history and duty.
- Instruction how to go to the station.
- Description of landscape around the station in radius of 300m, 3000m, and
8000-10000m. Record all changes in landscape around the station.
- Description of garden and location of observing instruments in the garden.
- Description of horizon line at the station.
- Station staff: number of staff, education, staff change.
- Instrument: number of instruments in use and spare, technical specifications,
calibration time.
Every supervision visit to the station will be recorded in this book with comments
and recommendations of head of supervision team or expert.
3. Instruments, sensors, upgrade, maintenance, instrument intercomparisons and
traceability
In recent years, observing instrument and equipments used in the network are
improved and upgraded. Under NHMS of Viet Nam there are 3 calibration laboratories
(one central and two regional) that are located in the North, Central and South part of the
country. The regional laboratory is responsible for calibration of temperature, humidity
and air pressure sensors and simple maintenance and repairing work. Central laboratory
is responsible for calibration of wind, rain and other sensors that request experts of high

192
skill and modern equipment.
According to the cooperation program with China Meteorological Administration
(CMA), every two years Vietnamese experts bring air pressure standard to China for
conducting instrument intercomparisons.
4. Quality assurance / quality control (real-time, non-real time)
After each observation head of the station have to perform checking of collected data
before coding and transmitting to the forecasting center and on the Global
Telecommunication System.
Every station is provided with technical instruction and guide book and operators at the
station have to strictly follow all procedure related to observation and data processing
in this book.
Experts from regional centers regularly perform visits to the stations for looking at
operation of instruments, complying of technical regulation and guide and other issues
related to the operation of the station that can affect data quality.
By the regulation on station management and operation, each station will be visited
by experts from NHMS one time per three years.
Quality control of observational data will be performed at two levels: regional and
national prior to forwarding for archiving.
5. Training
The most of operators at the stations get their education in Colleges of Natural
Resource and Environment (There are two of them in Viet Nam that belong to the
Ministry of Natural Resources and Environment of Viet Nam).
NHMS of Viet Nam organises training activity for station operators when new
technical instruction and guide is issued or changed.
Every 5 years, NHMS organises 7-10 day training course for chief of stations where
they can get newest knowledge related to the station management and operation.
In addition, operators at the stations can get on the work training when experts from
national and regional centers have visits to the station.
6. Statistics and applications
Observation and collected data is used for forecasting, scientific research and in
many fields of national economic activities.
At the present, no any publication of observation and collected data is carried out. All
users can come to the data archive center or to the regional centers for getting

193
observation and collected data. At these centers they can make their request and
experts from these centers will provide them with requested data.
7. Current issues and future plan
At the present the number of stations is not enough to meet the need of national
socio-economic development. All stations are manned. The most of observation
Instruments and equipments are rather old and underdeveloped. The needs of network
expand and modernisation is very big.
Recently, in June 2010 Prime Minister of Viet Nam has approved Development
Strategy of Hydro-Meteorological Field to the year of 2020 and Modernisation Project for
Hydro-meteorological Forecasting and Observation Network for the period from 2010
to 2012.
The main objectives of these strategy and Project are as follow:
- To the year of 2015 the number of stations is increased in 50% and 75% 0f them are
automatic. All observation data is automatically processed and transmitted to the centers,
75% of observation and collected data are archived in digital form.
- To the year of 2020 the density of stations can be compared with which of developed
countries and 90% of them are automatic. All observation and collected data are
archived in digital form.