Jewish Poverty in the United States
17
Jewish Poverty in the United States: A Summary of Recent Research by Jonathan Hornstein for The Harry and Jeanette Weinberg Foundation February 2019 7 Park Center Court, Owings Mills, MD 21117 | 410-654-8500 | www.hjweinbergfoundation.org
Transcript of Jewish Poverty in the United States

Jewish Poverty in the United States:A Summary of Recent Research
by Jonathan Hornstein for The Harry and Jeanette Weinberg Foundation
February 2019
7 Park Center Court, Owings Mills, MD 21117 | 410-654-8500 | www.hjweinbergfoundation.org
Jewish Poverty in the United States: A Summary of Recent Research 1
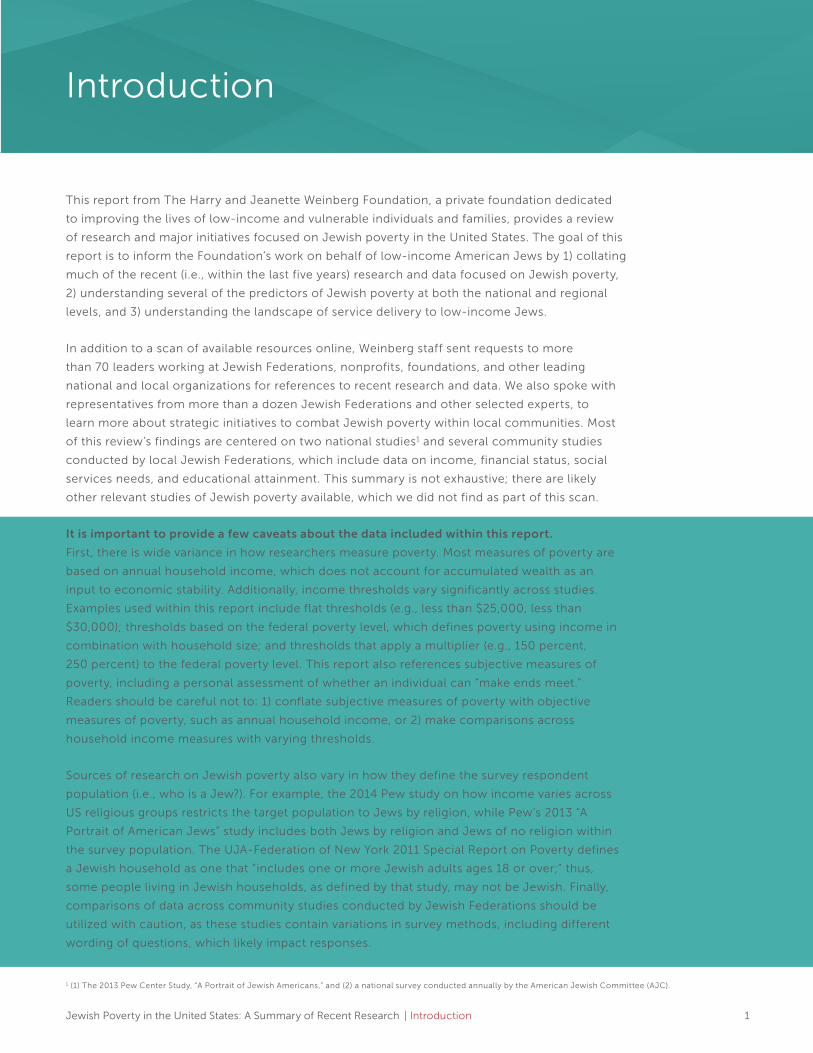
This report from The Harry and Jeanette Weinberg Foundation, a private foundation dedicated
to improving the lives of low-income and vulnerable individuals and families, provides a review
of research and major initiatives focused on Jewish poverty in the United States. The goal of this
report is to inform the Foundation’s work on behalf of low-income American Jews by 1) collating
much of the recent (i.e., within the last five years) research and data focused on Jewish poverty,
2) understanding several of the predictors of Jewish poverty at both the national and regional
levels, and 3) understanding the landscape of service delivery to low-income Jews.
In addition to a scan of available resources online, Weinberg staff sent requests to more
than 70 leaders working at Jewish Federations, nonprofits, foundations, and other leading
national and local organizations for references to recent research and data. We also spoke with
representatives from more than a dozen Jewish Federations and other selected experts, to
learn more about strategic initiatives to combat Jewish poverty within local communities. Most
of this review’s findings are centered on two national studies1 and several community studies
conducted by local Jewish Federations, which include data on income, financial status, social
services needs, and educational attainment. This summary is not exhaustive; there are likely
other relevant studies of Jewish poverty available, which we did not find as part of this scan.
It is important to provide a few caveats about the data included within this report.
First, there is wide variance in how researchers measure poverty. Most measures of poverty are
based on annual household income, which does not account for accumulated wealth as an
input to economic stability. Additionally, income thresholds vary significantly across studies.
Examples used within this report include flat thresholds (e.g., less than $25,000, less than
$30,000); thresholds based on the federal poverty level, which defines poverty using income in
combination with household size; and thresholds that apply a multiplier (e.g., 150 percent,
250 percent) to the federal poverty level. This report also references subjective measures of
poverty, including a personal assessment of whether an individual can “make ends meet.”
Readers should be careful not to: 1) conflate subjective measures of poverty with objective
measures of poverty, such as annual household income, or 2) make comparisons across
household income measures with varying thresholds.
Sources of research on Jewish poverty also vary in how they define the survey respondent
population (i.e., who is a Jew?). For example, the 2014 Pew study on how income varies across
US religious groups restricts the target population to Jews by religion, while Pew’s 2013 “A
Portrait of American Jews” study includes both Jews by religion and Jews of no religion within
the survey population. The UJA-Federation of New York 2011 Special Report on Poverty defines
a Jewish household as one that “includes one or more Jewish adults ages 18 or over;” thus,
some people living in Jewish households, as defined by that study, may not be Jewish. Finally,
comparisons of data across community studies conducted by Jewish Federations should be
utilized with caution, as these studies contain variations in survey methods, including different
wording of questions, which likely impact responses.
1 (1) The 2013 Pew Center Study, “A Portrait of Jewish Americans,” and (2) a national survey conducted annually by the American Jewish Committee (AJC).
| Introduction
Introduction
Jewish Poverty in the United States: A Summary of Recent Research 2
This summary provides the following information:
• National statistics on poverty, income status, and predictors of poverty within
the Jewish community
• Regional statistics on poverty, income status, predictors of poverty, and other
relevant statistics
• Selected strategic efforts to combat Jewish poverty within large Jewish
communities
• A listing of all research cited within this summary, included as an appendix
| Introduction

Jewish Poverty in the United States: A Summary of Recent Research 3| Executive Summary
Based on the available research, we can state the following findings about Jewish poverty in the United States:
• The percentage of Jewish households earning less than $30,000 is between 16 and 20 percent,
according to two major national studies; 7 percent of Jewish households earn less than $15,000.
• According to six recent community studies conducted within the last five years, the percentage of
households with incomes below the federal poverty level2 ranged between 1 and 4 percent in those
communities. Additionally, Jewish households with income below $25,000 ranged broadly between
3 and 28 percent, with most communities falling between 5 and 17 percent.
• Between 1 and 8 percent of Jewish households say that they “can’t make ends meet.” However,
there is a second layer of households—above 20 percent in many Jewish communities—that are
“ just managing” or “ just getting along,” illustrating a much larger base of households that require
assistance.
• New York City and the surrounding region has the largest number of low-income Jewish households
in the United States, and is an outlier when compared to the ranges included above. According to 2011
data, 20 percent of individuals in Jewish households in New York lived in a household with an income
below 150 percent of the federal poverty level3, accounting for 361,100 individuals.
• Identifying other areas of concentrated poverty with certainty is challenging, given the variability of
the community studies and length of time since many of these were completed. This is an opportunity
for future research.
• Jewish poverty is concentrated among older adults; Hasidic Jews; Jews with lower levels of
educational attainment; Jews who are employed part time; individuals with disabilities; single women;
immigrants; and Jews who identify as “Just Jewish” or secular, or have no Jewish denomination.
Specific communities reported higher concentrations of certain populations—Jewish poverty in New
York, for instance, is highly concentrated among Russian-speaking Jews, especially Russian-speaking
older adults (many of whom are Holocaust survivors), and Hasidic Jews.
• New strategic efforts to combat poverty in Jewish communities around the country include
comprehensive service delivery models, digital pantries, and financial literacy programs. These efforts
are concentrated in a few large Jewish communities, and there is potential to replicate successful
initiatives from within these Jewish communities, and among the field of human service delivery more
broadly, to other locations around the country.
2 These data use the 2015 definition of the federal poverty threshold. The household income threshold corresponding to the federal poverty level varies between $11,800 and $24,000 for a household size of one to four individuals. Some relevant examples: (1) one-person household: $11,800; (2) two-person household: $15,000; (3) three-person household: $20,000; (4) four-person household: $24,000.
3 According to the Special Report on Poverty by the UJA-Federation of New York, the household income in New York that corresponds to 150 percent of the federal poverty level varies between $15,000 and $33,000 for households of four individuals or less. The specific income level depends on the number of people in the household and whether there is an older adult living within the household. Some relevant examples: (1) one-person household (older adult): $15,000; (2) one-person household (not an older adult): $16,500; (3) two-person household, with at least one older adult: $19,000; (4) two-person household, with no older adults: $21,000; (5) three-person household: $27,000; (6) four-person household: $33,000.
Executive Summary

Jewish Poverty in the United States: A Summary of Recent Research 4
Percentage of American Jews that are low income
According to two Pew Research Center studies from
2013 and 20144, between 16 and 20 percent of Jews
reported annual household incomes of less than
$30,0005.
Additionally, according to a recent American Jewish
Committee (AJC) survey, these percentages have
remained consistent in 2016 (19 percent) and 2017
(18 percent)6. According to the AJC survey, 7 percent
of Jewish households earned less than $15,000
in 2017, 7 percent earned between $15,000 and
$25,000, and 4 percent earned between $25,000
and $30,000. It should be noted that, compared to
people of other religions and the country as a whole,
Jews exhibit a lower percentage of households
with income below $30,000, at 16 to 20 percent. In
contrast, this figure is 35 percent of all United States
households, 36 percent for Catholics, and 34 percent
for Muslims7. However, as already mentioned, there
are specific demographic groups, sub-populations,
and geographic regions (Russian-speaking Jewish
older adults in New York City, for example) that
exhibit higher levels of poverty.
National predictors of poverty within the Jewish community
Historically, predictors of poverty in the Jewish
community are consistent with those in the United
States at large. According to an analysis of the
2000-2001 National Jewish Population survey (the
precursor to the 2013 Pew study), older adults (i.e.,
65+); individuals without higher education; those
who are employed part time; those with disabilities
and unable to work; single women with and without
children (especially the latter); immigrants (both
those who have become citizens, and even more
so, those who haven’t); non-white Jews8; and Jews
who identify as “Just Jewish” or secular, or have no
Jewish denomination have all reported higher rates
of poverty9.
The 2013 Pew study states that “Jews with household
incomes less than $30,000 are concentrated
among young adults10 and those who have reached
retirement age.” The 2013 study also found that
Jews with less than a college education; single
adults with children; and divorced, separated, and
widowed respondents are more likely to be low
income. It is clear that employment is a driver of
poverty for older adults. According to the Pew study,
70 percent of this population is not employed (either
by choice or because individuals are unable to find
employment), a figure that is significantly higher
than other populations. Additionally, the Blue Card,
an aid organization serving Holocaust survivors,
estimates that 61 percent of the 100,000 survivors in
the United States live on less than $23,000 per year11.
One caveat for young adults is that these individuals
may receive unreported support from their parents,
so poverty in this demographic may be slightly
overstated.
Ultra-Orthodox Jews, or Haredi Jews, also exhibit
higher rates of living in or near poverty. The Pew
study found that 43 percent of ultra-Orthodox
Jews earn a household income below $50,000,
compared to 32 percent of Jews overall. One factor
that contributes to this dynamic is the level of
secular educational attainment. Just 25 percent of
ultra-Orthodox Jewish individuals have a bachelor’s
degree or higher, compared to 58 percent of Jews
overall, and 29 percent of the US general public12.
It should be noted that poverty in the Haredi
community is complex, as this community views
education and employment differently than other
segments of the Jewish population.
| National Research on Jewish Poverty
National Research on Jewish Poverty
4 It should be noted that these two studies focused on a slightly different target population. The 2013 Pew study surveyed both Jews by religion and Jews of no religion, while the 2014 study only surveyed Jews by religion. Jews of no religion tend to exhibit slightly lower levels of annual household income.
5 http://www.pewforum.org/2013/10/01/chapter-2-intermarriage-and-other-demographics/ and http://www.pewresearch.org/fact-tank/2016/10/11/how-income-varies-among-u-s-religious-groups/
6 http://www.jewishdatabank.org/Studies/downloadFile.cfm?FileID=3626 7 http://www.pewresearch.org/fact-tank/2016/10/11/how-income-varies-among-u-s-religious-groups/ 8 It should be noted that more recent studies have failed to corroborate the finding that non-white Jews exhibit higher rates of poverty.9 “Poor Jews: An Analysis of Low Income in the American Jewish Population” by Laurence Kotler-Berkowitz (https://link.springer.com/article/10.1007%2Fs12397-009-
9021-z)10 Per the 2013 Pew study: “38% of Jews under age 30 say they have family incomes of $30,000 or less.”11 https://forward.com/fast-forward/392955/1-3-of-american-holocaust-survivors-live-in-poverty-aid-group-says/ 12 http://www.pewforum.org/2015/08/26/a-portrait-of-american-orthodox-jews/

Jewish Poverty in the United States: A Summary of Recent Research 5
Overview and selected highlights of community studies by Jewish Federations
Aside from the national studies discussed previously, most research on Jewish
poverty is sourced through community studies conducted in the vast majority of
cases by local Jewish Federations. These studies, typically conducted every 10
years, are not singularly focused on income status but rather address a variety
of questions about the local Jewish population, including demographics, Jewish
identity, engagement (i.e., synagogue membership, annual giving), views on Israel,
and several other areas. Yet these studies generally contain information on income
status and subjective measures that gauge whether families are able to make ends
meet and may also include information on access to various benefits.
What follows is a set of comparisons of selected indicators of poverty across
different communities from community studies completed in the past five years.
Note that in some cases, communities were excluded from comparisons because
the study did not include a comparable question. Links to the full listing of
community studies can be found in the appendix.
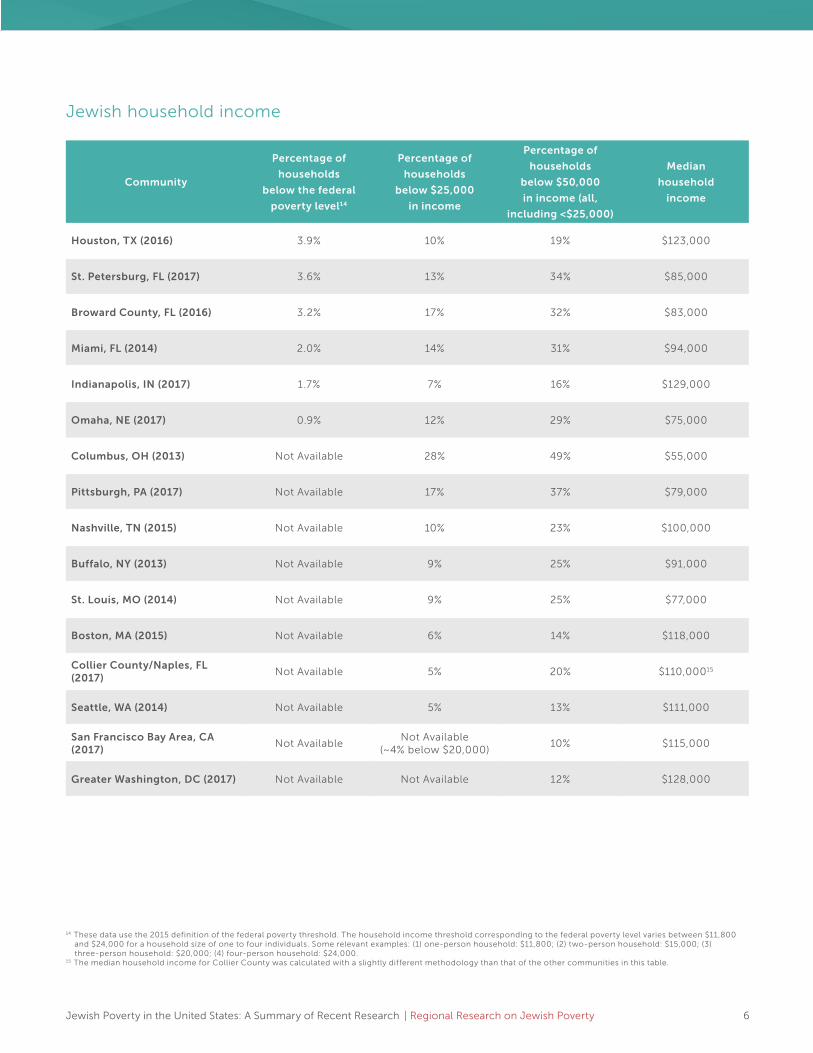
Jewish household income
Based on community studies from the past five years, federal poverty rates
varied across community studies between 1 and 4 percent. Additionally, reported
household income below $25,000 ranged broadly between 3 and 28 percent, with
most communities between 5 and 17 percent13.
Reported
household
income below
$25,000 ranges
broadly between
3% and 28%,
with most
communities
between 5%
and 17%.
| Regional Research on Jewish Poverty
Regional Research on Jewish Poverty
13 This information should be used with caution for several reasons: (1) many households choose not to disclose their household income–in some studies as many as one-third did not answer this question; (2) standard of living varies by community, so a $25,000 household income goes further in one city than it might in another; (3) not all of these community studies were conducted in the same year, so the national economic context may not be the same.
Jewish Poverty in the United States: A Summary of Recent Research 6
Jewish household income
Community
Percentage of
households
below the federal
poverty level14
Percentage of
households
below $25,000
in income
Percentage of
households
below $50,000
in income (all,
including <$25,000)
Median
household
income
Houston, TX (2016) 3.9% 10% 19% $123,000
St. Petersburg, FL (2017) 3.6% 13% 34% $85,000
Broward County, FL (2016) 3.2% 17% 32% $83,000
Miami, FL (2014) 2.0% 14% 31% $94,000
Indianapolis, IN (2017) 1.7% 7% 16% $129,000
Omaha, NE (2017) 0.9% 12% 29% $75,000
Columbus, OH (2013) Not Available 28% 49% $55,000
Pittsburgh, PA (2017) Not Available 17% 37% $79,000
Nashville, TN (2015) Not Available 10% 23% $100,000
Buffalo, NY (2013) Not Available 9% 25% $91,000
St. Louis, MO (2014) Not Available 9% 25% $77,000
Boston, MA (2015) Not Available 6% 14% $118,000
Collier County/Naples, FL (2017)
Not Available 5% 20% $110,00015
Seattle, WA (2014) Not Available 5% 13% $111,000
San Francisco Bay Area, CA (2017)
Not AvailableNot Available
(~4% below $20,000)10% $115,000
Greater Washington, DC (2017) Not Available Not Available 12% $128,000
14 These data use the 2015 definition of the federal poverty threshold. The household income threshold corresponding to the federal poverty level varies between $11,800 and $24,000 for a household size of one to four individuals. Some relevant examples: (1) one-person household: $11,800; (2) two-person household: $15,000; (3) three-person household: $20,000; (4) four-person household: $24,000.
15 The median household income for Collier County was calculated with a slightly different methodology than that of the other communities in this table.
| Regional Research on Jewish Poverty

Jewish Poverty in the United States: A Summary of Recent Research 7
New York: The largest population of low-income Jews
The most significant outlier is New York City and its surrounding region, the largest
Jewish community in the United States. UJA-Federation of New York completed
its last community study in 2011; therefore, the city is not included in the previous
comparison. But UJA-Federation of New York produced a special report on poverty
based on that year’s community study.
According to this special report, 564,900 individuals across nearly 196,900
households live in poverty (defined as below 150 percent of the federal poverty
level16) or near poverty (defined as household income between 150 and 250
percent of the federal poverty level17), concentrated in New York City (especially
Brooklyn). This means that 32 percent of people in Jewish households in New York
live in poverty (20 percent) or near poverty (12 percent). The number of people in
poor Jewish households in the greater New York area has doubled, growing 98
percent over the previous two decades, while the overall population of people in
Jewish households in New York has grown only marginally, by just 12 percent over
the same time period.
Selected identifiable populations that include higher proportions of poor Jewish
households are listed below, by order of magnitude:
To meet the growing needs of low-income individuals and families in New York, UJA-Federation of New
York has launched an anti-poverty effort that focuses on creating community resource hubs in Queens and
Brooklyn. More information on this initiative is included later in the report.
| Regional Research on Jewish Poverty
Population
Portion of poor Jewish households
in New York (adds to 90 percent of poor
households)18
Percentage of
population that is
poor
Notes
Russian-speaking older adult households
26% 72%
Largely in Brooklyn, many of whom have no history of work in the United States and cannot access Social Security and several critical benefits
Hasidic, or ultra-Orthodox, Jewish households
17% 45%
Constrained by low levels of secular education (in 62 percent of Hasidic households, the highest degree earned is a high school diploma or less) and large numbers of children per household
Non-Russian-speaking older adults
16% 10% About two-thirds of this group lives alone
Unemployed or underemployed households
13% 20%Excludes Russian-speaking households, Hasidic households, older adults, and households that include a person with a disability
Russian-speaking households (no older adults)
8% 20%In more than half of the households, no member of the house is employed
Households that include a person with a disability who is unable to work
8% 54%
Single-parent households 2% 14%
32% of Jews in
New York live in
poverty (20%)
or near poverty
(12%).
16 According to the Special Report on Poverty by the UJA-Federation of New York, the household income in New York that corresponds to 150 percent of the federal poverty level varies between $15,000 and $33,000 for households of four individuals or less. The specific income level depends on the number of people in the household and whether there is an older adult living within the household. Some relevant examples: (1) one-person household (older adult): $15,000; (2) one-person household (not an older adult): $16,500; (3) two-person household, with at least one older adult: $19,000; (4) two-person household, with no older adults: $21,000; (5) three-person household: $27,000; (6) four-person household: $33,000.
17 With the same source and methodology references in Note 14, the household income in New York that corresponds to 250 percent of the federal poverty level varies between $26,000 and $55,000 for households of four individuals or less. Some relevant examples: (1) one-person household (older adult): $26,000; (2) one-person household (not an older adult): $28,000; (3) two-person household, with at least one older adult: $32,000; (4) two-person household, with no older adults: $36,000; (5) three-person household: $45,000; (6) four-person household: $55,000.
18 The remaining 10 percent is a diverse group with no single identifying characteristic.
Jewish Poverty in the United States: A Summary of Recent Research 8
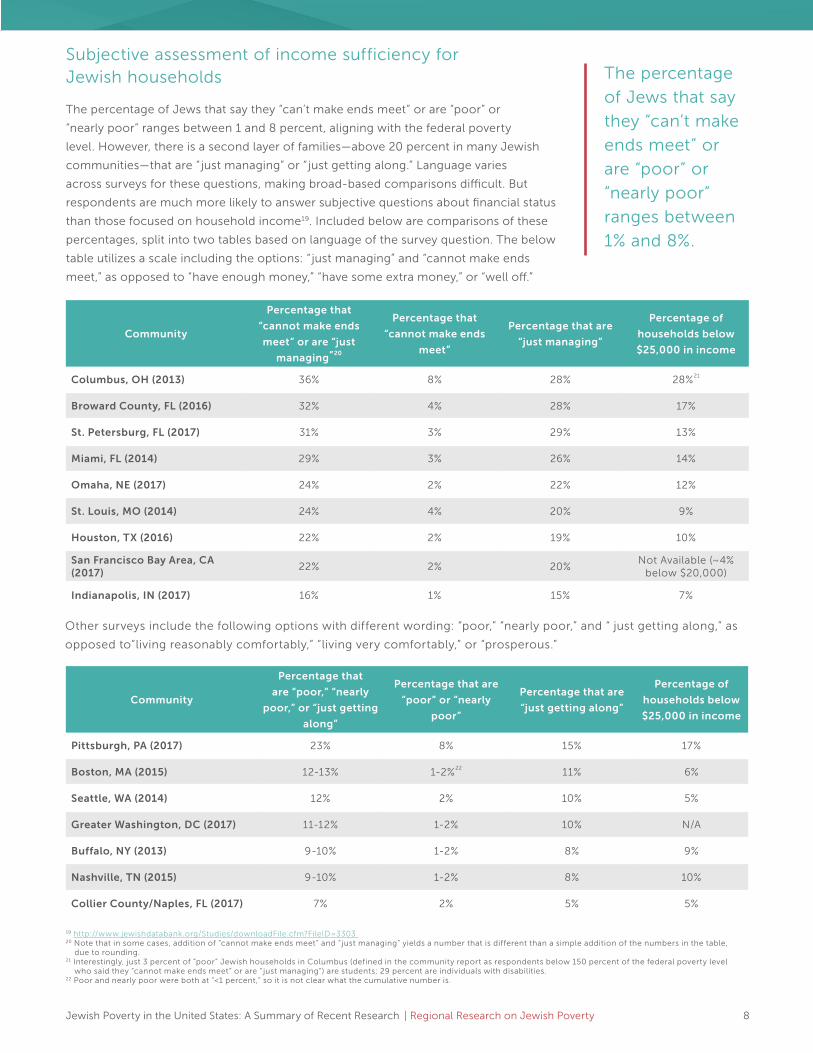
Subjective assessment of income sufficiency for Jewish households
The percentage of Jews that say they “can’t make ends meet” or are “poor” or
“nearly poor” ranges between 1 and 8 percent, aligning with the federal poverty
level. However, there is a second layer of families—above 20 percent in many Jewish
communities—that are “ just managing” or “ just getting along.” Language varies
across surveys for these questions, making broad-based comparisons difficult. But
respondents are much more likely to answer subjective questions about financial status
than those focused on household income19. Included below are comparisons of these
percentages, split into two tables based on language of the survey question. The below
table utilizes a scale including the options: “ just managing” and “cannot make ends
meet,” as opposed to “have enough money,” “have some extra money,” or “well off.”
Other surveys include the following options with different wording: “poor,” “nearly poor,” and “ just getting along,” as
opposed to“living reasonably comfortably,” “living very comfortably,” or “prosperous.”
| Regional Research on Jewish Poverty
Community
Percentage that
“cannot make ends
meet” or are “just
managing”20
Percentage that
“cannot make ends
meet”
Percentage that are
“just managing”
Percentage of
households below
$25,000 in income
Columbus, OH (2013) 36% 8% 28% 28%21
Broward County, FL (2016) 32% 4% 28% 17%
St. Petersburg, FL (2017) 31% 3% 29% 13%
Miami, FL (2014) 29% 3% 26% 14%
Omaha, NE (2017) 24% 2% 22% 12%
St. Louis, MO (2014) 24% 4% 20% 9%
Houston, TX (2016) 22% 2% 19% 10%
San Francisco Bay Area, CA (2017)
22% 2% 20%Not Available (~4%
below $20,000)
Indianapolis, IN (2017) 16% 1% 15% 7%
Community
Percentage that
are “poor,” “nearly
poor,” or “just getting
along”
Percentage that are
“poor” or “nearly
poor”
Percentage that are
“just getting along”
Percentage of
households below
$25,000 in income
Pittsburgh, PA (2017) 23% 8% 15% 17%
Boston, MA (2015) 12-13% 1-2%22 11% 6%
Seattle, WA (2014) 12% 2% 10% 5%
Greater Washington, DC (2017) 11-12% 1-2% 10% N/A
Buffalo, NY (2013) 9-10% 1-2% 8% 9%
Nashville, TN (2015) 9-10% 1-2% 8% 10%
Collier County/Naples, FL (2017) 7% 2% 5% 5%
The percentage
of Jews that say
they “can’t make
ends meet” or
are “poor” or
“nearly poor”
ranges between
1% and 8%.
19 http://www.jewishdatabank.org/Studies/downloadFile.cfm?FileID=3303 20 Note that in some cases, addition of “cannot make ends meet” and “ just managing” yields a number that is different than a simple addition of the numbers in the table,
due to rounding.21 Interestingly, just 3 percent of “poor” Jewish households in Columbus (defined in the community report as respondents below 150 percent of the federal poverty level
who said they “cannot make ends meet” or are “ just managing”) are students; 29 percent are individuals with disabilities.22 Poor and nearly poor were both at “<1 percent,” so it is not clear what the cumulative number is.

Jewish Poverty in the United States: A Summary of Recent Research 9
These tables illustrate that within most Jewish communities, there is a small
number of very low-income individuals as well as a much larger group of families
that might be above the poverty limit but are living paycheck to paycheck and
not able to accumulate savings. These families are often one event away—one
emergency, one home repair, perhaps a Jewish experience—from falling into
serious financial crisis.
Some community studies are beginning to capture this dynamic more explicitly.
In Pittsburgh, for instance, while 8 percent of families said they are “poor” or
“nearly poor,” 13 percent of families said they could not afford an emergency $400
purchase, and 25 percent said they had insufficient savings for three months of
expenses. In the Greater Washington, DC area, 1 to 2 percent of families said they
are “poor” or “nearly poor,” 3 percent of families said they could not afford an
emergency $400 purchase, and 13 percent said they had insufficient savings for
three months of expenses. Note that these locations are only the communities that
have collected data in this area—the dynamic likely applies in Jewish communities
around the country.
Jewish individuals and families receiving public benefits
More recent community studies have also tracked the percentage of households
receiving different forms of public benefits, including Supplemental Nutrition
Assistance Program (SNAP), Medicaid, subsidized housing, day care assistance,
Social Security Insurance (SSI), or Social Security Disability Insurance (SSDI). See
below for some relevant statistics from various communities (note that the same
questions are not asked consistently):
• Boston, MA (2015): 6 percent of households received SNAP, Medicaid,
subsidized housing, or day care assistance; 9 percent received SSDI or SSI.
• Collier County/Naples, FL (2017): 1 percent of households received
welfare benefits; 3 percent received SSDI or SSI.
• Greater Washington, DC (2017): 3 percent of households received
government benefits of some kind (i.e., SNAP, WIC, SSDI, Medicaid).
• Pittsburgh, PA (2017): 6 percent of households received SNAP, Medicaid,
subsidized housing, or day care assistance; 9 percent received SSDI or SSI.
• Seattle, WA (2014): 20 percent of households received SSDI; 1 percent
received subsidized housing benefits.
These families
are often one
event away—one
emergency, one
home repair,
perhaps a Jewish
experience—
from falling into
serious financial
crisis.
| Regional Research on Jewish Poverty

Jewish Poverty in the United States: A Summary of Recent Research 10
Educational attainment of Jewish individuals
One of the characteristics that is most highly correlated with income is educational
attainment23. Jewish communities overall are highly educated, with bachelor’s
degree attainment rates ranging from 60 to 92 percent for recent community
studies. This significantly outpaces the national average of 29 percent of the US
public. Note that the national rate of bachelor’s degree attainment among Jews is
between 58 and 62 percent, based on the 2013 Pew study and the 2017 American
Jewish Committee survey. This overall rate is likely heavily weighted by New York’s
percentage with a bachelor’s degree of 57 percent (not shown below, as it is not
within the past five years).
| Regional Research on Jewish Poverty
CommunityPercentage of individuals
that have a bachelor’s degree
Percentage of individuals
that have a graduate degree
Greater Washington, DC (2017) 92% 61%
Seattle, WA (2014) 89% 55%
Boston, MA (2015) 87% 61%
Buffalo, NY (2013) 86% 57%
Nashville, TN (2015)24 86% 54%
Collier County/Naples, FL (2017) 85% 55%
Pittsburgh, PA (2017)24 84% 56%
Indianapolis, IN (2017) 83% 45%
Houston, TX (2016) 79% 39%
San Francisco Bay Area, CA (2017) 76% 34%
Miami, FL (2014) 71% 32%
Columbus, OH (2013) 70% 35%
Omaha, NE (2017) 68% 30%
St. Louis, MO (2014) 63% 33%
Broward County, FL (2016) 61% 26%
St. Petersburg, FL (2017) 60% 29%
Jewish
communities
overall are highly
educated, with
bachelor’s degree
attainment rates
ranging from 60%
to 92%.
23 http://www.pewresearch.org/fact-tank/2016/10/11/how-income-varies-among-u-s-religious-groups/24 Respondent base is the overall population, rather than only individuals over 25 years old. Several community studies, including Nashville, note that a similar analysis
limited to only those over 25 years old produced nearly identical results.
Jewish Poverty in the United States: A Summary of Recent Research 11
Several Jewish communities throughout the United States have launched initiatives and programs to fight
poverty. See below for examples of Jewish agencies working to fight poverty in their own communities.
Note that the descriptions below are anecdotal, based on conversations with leaders at Jewish Federations
around the country, and are in no way exhaustive.
One-Stop Shop and No Wrong Door models: Easing access to service delivery
Recognizing that individuals seeking help usually require multiple services and interventions, agencies and
service providers throughout the United States have been developing No Wrong Door models of service
delivery for many years. These models ensure that no matter where an individual enters an ecosystem of
service providers, they are screened, referred to all services and providers for which they are eligible, and
are tracked over time. Many Jewish communities have undertaken to implement No Wrong Door and other
comprehensive service delivery models, but it is easier said than done, says Reuben Rotman, president and
CEO of the Network of Jewish Human Services Agencies (NJHSA). “My sense is that many communities might
think they’re practicing these principles but are not doing it in a comprehensive way,” he says. “Did the case
manager follow-up? Did they have the individual sign a release to have another agency reach out? Is the
organization proactively exploring other connections? At many organizations, there aren’t systems in place to
enable coordination of treatment for clients who might present themselves at multiple agencies.”
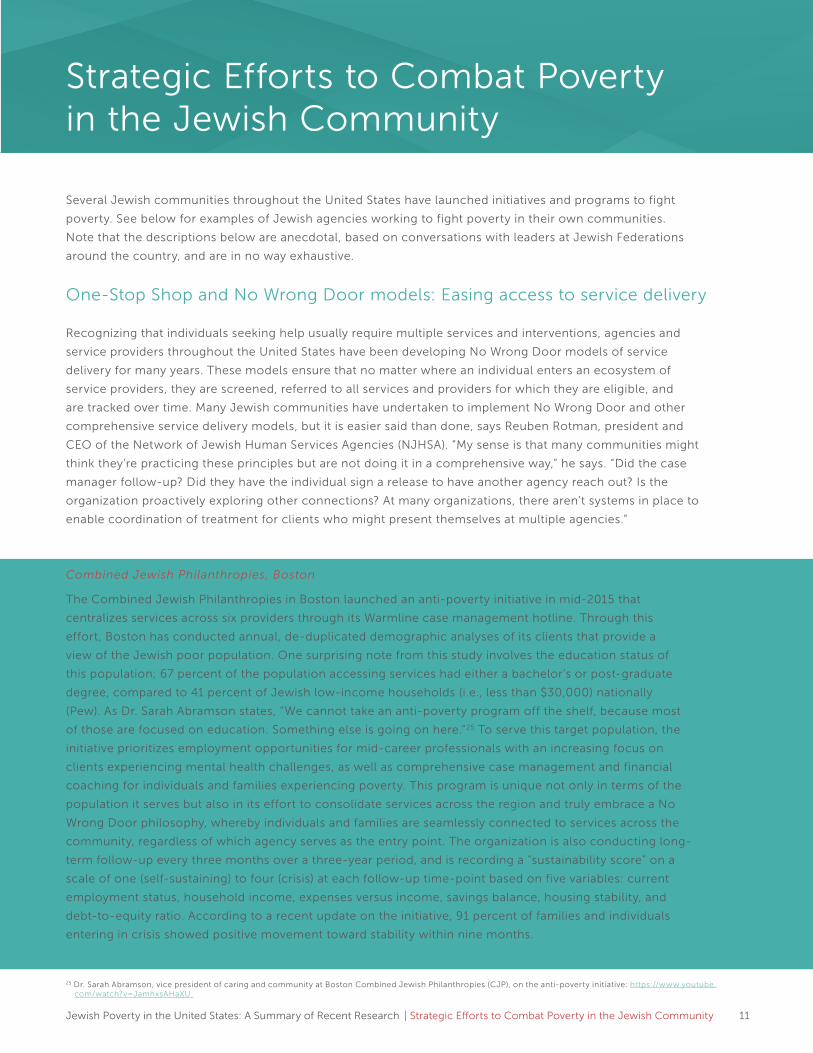
Combined Jewish Philanthropies, Boston
The Combined Jewish Philanthropies in Boston launched an anti-poverty initiative in mid-2015 that
centralizes services across six providers through its Warmline case management hotline. Through this
effort, Boston has conducted annual, de-duplicated demographic analyses of its clients that provide a
view of the Jewish poor population. One surprising note from this study involves the education status of
this population; 67 percent of the population accessing services had either a bachelor’s or post-graduate
degree, compared to 41 percent of Jewish low-income households (i.e., less than $30,000) nationally
(Pew). As Dr. Sarah Abramson states, “We cannot take an anti-poverty program off the shelf, because most
of those are focused on education. Something else is going on here.”25 To serve this target population, the
initiative prioritizes employment opportunities for mid-career professionals with an increasing focus on
clients experiencing mental health challenges, as well as comprehensive case management and financial
coaching for individuals and families experiencing poverty. This program is unique not only in terms of the
population it serves but also in its effort to consolidate services across the region and truly embrace a No
Wrong Door philosophy, whereby individuals and families are seamlessly connected to services across the
community, regardless of which agency serves as the entry point. The organization is also conducting long-
term follow-up every three months over a three-year period, and is recording a “sustainability score” on a
scale of one (self-sustaining) to four (crisis) at each follow-up time-point based on five variables: current
employment status, household income, expenses versus income, savings balance, housing stability, and
debt-to-equity ratio. According to a recent update on the initiative, 91 percent of families and individuals
entering in crisis showed positive movement toward stability within nine months.
| Strategic Efforts to Combat Poverty in the Jewish Community
Strategic Efforts to Combat Poverty in the Jewish Community
25 Dr. Sarah Abramson, vice president of caring and community at Boston Combined Jewish Philanthropies (CJP), on the anti-poverty initiative: https://www.youtube.com/watch?v=JamhxsAHaXU

Jewish Poverty in the United States: A Summary of Recent Research 12
UJA-Federation of New York
UJA-Federation of New York, aiming to serve the largest block of concentrated Jewish poverty in the
United States, is also significantly increasing its efforts to centralize services. Through its Centennial
Anti-Poverty Initiative26, UJA will be launching two community resource hubs, in partnership with the Met
Council and the Central Queens Y, in Brooklyn and Queens, respectively. These hubs are designed to be
one-stop shops that centralize the array of social services and supports available to low-income individuals
and families, including food access, employment training, help in applying for government benefits, legal
and financial counseling, emergency financial assistance, emotional support, and low-interest loans,
among other relevant services27.
Digital pantries: Leveraging technology to increase dignity
UJA-Federation of New York
Within its community resource hubs, UJA-Federation of New York is implementing a digital pantry food-
ordering system. The system will enable eligible clients to place food orders remotely from a computer, or
onsite via an iPad, instead of standing in line at pantry locations. This dignifies the food pantry experience,
reducing waits from up to 30 minutes to just a few minutes. Additionally, clients will have increased choice
in their food items, which both limits waste and provides families with the choice of food items that is
afforded to wealthier families. The system also leverages a points system that incentivizes individuals to
select healthier foods that “cost” fewer points. In its pilot phase (over the past six months), UJA-Federation
of New York’s digital pantry system has seen a 30 percent increase in clients accessing food and a 133
percent increase in the amount of protein that is available to clients. Other than UJA New York and Jewish
Federation of Greater Philadelphia, which has used a digital pantry for the past five years, we are not aware
of other Jewish communities that leverage the digital pantry model.
Of note, UJA’s anti-poverty efforts leverage effective practices and programs from around the social
services sphere. This digital pantry initiative was replicated from St. Johns Bread & Life, a social service
organization focused on alleviating hunger in Brooklyn and Queens that pioneered the model a decade
ago. Additionally, UJA’s community resource hubs are based on the one-stop shop model, pioneered by
the Robin Hood Foundation. There may be opportunities for other Jewish agencies to similarly leverage
effective practices from not only other Jewish communities but also leaders within the field of human
service delivery more broadly.
26 Overview of UJA New York Centennial Anti-Poverty Initiative: https://vimeo.com/265813193 27 http://jewishweek.times, ofisrael.com/uja-fed-to-launch-largest-anti-poverty-push-in-its-history/
| Strategic Efforts to Combat Poverty in the Jewish Community

Jewish Poverty in the United States: A Summary of Recent Research 13
28 https://d38k8tmwohgfyl.cloudfront.net/785173.pdf
Jewish Federation of Cleveland
Following its 2011 community study, which identified that 41 percent of families are either “ just managing
to make ends meet” or “cannot make ends meet,” the Jewish Federation of Cleveland set up a task force
on financial distress to identify unmet needs in the community. One trend this task force identified is that
the community was struggling to support families who were near poor, with modest income and savings,
but on the brink of falling back into poverty. Out of this finding came Forward Focus, an intensive self-
sufficiency intervention focusing on financial education, housing stabilization, and employment support,
serving more than 100 families annually in Cleveland.
Led by a former banker, the evidence-based program takes a holistic approach to help individuals achieve
financial stability, including budgeting, debt reduction, employment, transportation, child/older adult
care, savings and emergency accounts, and housing. The program targets families who are unemployed
or long-term underemployed and facing housing instability, with heads of households either being over
50 (i.e., baby boomers) or with dependents in the home. More than 270 households have participated
since program launch at the end of 2014. Outcomes for the first three-year pilot of the program are being
recorded in the framework of the Fenn-Jorstad Self Sufficiency Matrix (SSM), an assessment tool used to
determine a participant’s level of self-sufficiency, and will be released later this year.
The Jewish Federation of Greater Philadelphia
While the community studies are extraordinarily helpful in surfacing trends that can shape best-fit
programs to serve low-income individuals, these studies measure macro-level trends and unfortunately
lack the ability to find specific people in need. This limits services to those who reach out to an agency
or program. The Jewish Federation of Greater Philadelphia is trying to change this. The organization
has initiated a partnership with a data science firm, Civis Analytics, that can identify characteristics of
individuals likely to be both Jewish and low income and target services to those individuals. The firm
estimates that a sample exhibiting the characteristics of low-income Jews contains 6.7 times the number
of targets than a randomly selected list. The Federation plans to work with nonprofit Benefits Data Trust,
a close partner, to conduct targeted outreach based on a tailored list containing attributes of low-income
Jewish families and connect them with a myriad of benefits. This represents yet another way to expand
access to services for low-income Jews.
Financial literacy: Building assets toward sustainability
While the Jewish community (with the exception of New York and selected other communities) has a low
rate of families below the federal poverty level, there is a much larger population just above the poverty
limit, often described as the working poor or ALICE (Asset-Limited, Income-Constrained, Employed). Many
believe living in “near poverty” is just as serious because exceeding the federal poverty income threshold
can lead to loss of eligibility for several benefits28. As mentioned earlier, individuals and families who are
“ just managing” or “ just getting by” are one large expense away from not being able to support themselves.
These families often lack the financial literacy and personal budgeting knowledge to build savings and
continue the uphill climb out of poverty.
Targeted outreach: Finding those in need
| Strategic Efforts to Combat Poverty in the Jewish Community

Jewish Poverty in the United States: A Summary of Recent Research 14
These summarized research and data are helpful in understanding several facets of poverty in the
Jewish community. The percentage of Jewish households earning less than $30,000 in income is
between 16 and 20 percent. And based on several Jewish community studies completed by Jewish
Federations, there is a small group of Jewish households reporting that they can’t make ends meet,
with a much larger group of Jewish households (more than 20 percent in many communities) that are
barely managing to get by each day. New York, the largest Jewish community in the United States,
is an outlier to this dynamic, with almost a third of households living in poverty or near poverty.
Finally, the Jewish individuals and households struggling most with poverty are older adults; Hasidic
Jews; Jews with lower levels of educational attainment; those employed part time; individuals with
disabilities; single women; immigrants; and Jews who identify as “Just Jewish” or secular; or have no
Jewish denomination.
Many questions and areas for potential research remain. Other regions with large numbers of low-
income Jews outside of New York certainly exist but are difficult to pin down due to differences in
wording of questions and timing of completion across community studies. There is also much more
to learn about the makeup of poverty within most communities. Across all communities, it would
be helpful to further understand long-term patterns of poverty, including how long individuals and
households remain in poverty. These questions may be the focus of future research for funders,
Jewish Federations, leading nonprofits, foundations, and other organizations. Additionally, there
are opportunities for Jewish organizations to learn from the exemplary programs and services of
their peers, both within the Jewish community and among the field of human service delivery more
broadly.
Many thanks to everyone who spoke with us, or sent us research or data, in support of this effort. If
you have any questions regarding this report, please don’t hesitate to contact Jonathan Hornstein at
| Conclusion
Conclusion
Questions? Comments? Have info to share? Please contact us.
The Harry and Jeanette Weinberg Foundation
7 Park Center Court, Owings Mills, MD 21117
410-654-8500 | www.hjweinbergfoundation.org

Jewish Poverty in the United States: A Summary of Recent Research 15| Thank You to Partner Organizations
This report would not have been possible without the help of several organizations, which had one or more representatives speak with us about poverty in the Jewish community or send us data or research to contribute to the report. These organizations are listed below:
The Associated: Jewish Community Federation of Baltimore
Circle of Service Foundation
Combined Jewish Philanthropies of Greater Boston
Greater Miami Jewish Federation
Jewish Community Federation of San Francisco, the Peninsula, Marin
& Sonoma Counties
Jewish Federation of Cleveland
Jewish Federation of Greater Dallas
Jewish Federation of Greater Los Angeles
Jewish Federation of Greater Philadelphia
Jewish Federation of Greater Pittsburgh
Jewish Federation of Metropolitan Detroit
The Jewish Federations of North America
Jewish United Fund/Jewish Federation of Metropolitan Chicago
Leading Edge
Network of Jewish Human Service Agencies
One8 Foundation
Pew Research Center
UJA Federation of New York
On behalf of The Harry and Jeanette Weinberg Foundation, we thank you for your perspectives and contributions and for the work you do every day to improve the lives of low-income individuals and families.
Thank You to Partner Organizations

Jewish Poverty in the United States: A Summary of Recent Research 16
National studies
1. “A Portrait of Jewish Americans” by the Pew Center provides information on Jewish socioeconomic status,
including education, household income, employment status, and homeownership. (http://www.pewforum.
org/2013/10/01/chapter-2-intermarriage-and-other-demographics/)
2. “A Portrait of American Orthodox Jews: A Further Analysis of the 2013 Survey of US Jews” by the Pew Center
provides more detail on the Orthodox Jewish population, including differences in responses between Modern
Orthodox and Haredi Jews. (http://www.pewforum.org/2015/08/26/a-portrait-of-american-orthodox-jews/)
3. “Annual Survey of American Jewish Opinion” by American Jewish Committee includes a question on total annual
household income, comparing 2016 and 2017 results. (http://www.jewishdatabank.org/Studies/downloadFile.
cfm?FileID=3626)
4. “Comparisons of Jewish Communities: A Compendium of Tables and Bar Charts” by Ira Sheshkin includes
a chapter on Economic Factors, including household income, percentages of households living below
federal poverty levels, and other metrics. (https://www.bjpa.org/content/upload/bjdb/777/Section%2009%20
Economic%20Factors.pdf)
5. “Poor Jews: An Analysis of Low Income in the American Jewish Population” by Laurence Kotler-Berkowitz
discusses the characteristics of the low-income Jewish population based on data from the National Jewish
Population Survey in 2000-2001. (https://link.springer.com/article/10.1007%2Fs12397-009-9021-z)
6. “The Great Recession and American Jews: Evidence from Baltimore, Chicago and Cleveland” by Laurence Kotler-
Berkowitz discusses the experiences of Jews in three US communities as a result of the Great Recession. (http://
www.jewishdatabank.org/Studies/downloadFile.cfm?FileID=3128)
Regional studies
A full listing of US local community studies, conducted by Jewish Federations, can be found online at the Berman
Jewish Databank. Additionally, some other recent studies, conducted by the Steinhardt Social Research Institute,
can be found on its website. See below for relevant links:
1. http://www.jewishdatabank.org/Studies/us-local-communities.cfm
2. https://www.brandeis.edu/ssri/communitystudies/team.html
3. “2011 Special Report on Poverty” by UJA-Federation of New York, in consultation with Metropolitan Council on
Jewish Poverty, compares results of the community studies between 1991 and 2011. (https://d38k8tmwohgfyl.
cloudfront.net/785173.pdf)
| Appendix
Appendix Listing of research focused on Jewish poverty