January September 2018 - mb.cision.commb.cision.com/Main/66/2645514/927287.pdf · Adjusted EBITDA...
28
Q3 January–September 2018 INTERIM REPORT JANUARY–SEPTEMBER 2018 Quarterly data Net sales were SEK 6 054 million (5 544), an increase of 9% mainly as a result of increased sales prices and positive currency effects. EBITDA was SEK 881 million (1 051), a decrease of 16% mainly as a result of increased raw material costs. Adjusted EBITDA was SEK 893 million (1 080), a decrease of 17%. The adjusted operating margin was 9% (13%). Adjusted operating profit was SEK 540 million (717), a decrease of 25%. Earnings per share amounted to SEK 1.76 (2.48). Key highlights Solid sales performance in all business areas. Positive effects from increased sales prices and currency. Continued headwinds from higher raw material costs. Strategic investments progressing according to plan. Outlook Q4 Strong demand within all business areas is expected to continue. Limited possibilities for further sales price increases. Sharp increase in wood costs expected to continue. KEY FIGURES For key figures and a reconciliation of alternative performance measures, see pages 22-24. For further information, please contact: Susanne Lithander, CFO, +46 8 553 335 00 Christopher Casselblad, Investor Relations, +46 8 553 335 08 This information constituted inside information prior to publication. This is information that BillerudKorsnäs AB (publ) is obliged to make public pursuant to the EU Market Abuse Regulation. The information was submitted for publication, through the agency of the contact persons set out above, at 13.00 CET on 16 October 2018. Q3 Q3 Jan-Sep Jan-Sep SEKm 2018 2017 Change 2018 2017 Change Net sales 6 054 5 544 9% 17 849 16 780 6% EBITDA 881 1 051 -16% 2 149 2 837 -24% EBITDA, % 15% 19% 12% 17% Adjusted EBITDA 893 1 080 -17% 2 666 2 900 -8% Adjusted EBITDA, % 15% 19% 15% 17% Operating profit 513 681 -25% 1 016 1 720 -41% Operating margin, % 8% 12% 6% 10% Adjusted operating profit 540 717 -25% 1 578 1 804 -13% Adjusted operating margin, % 9% 13% 9% 11% Net profit/loss for the period 363 513 -29% 728 1 270 -43% Earnings per share, SEK 1.76 2.48 -29% 3.52 6.13 -43% Adjusted earnings per share, SEK 1.85 2.61 -29% 5.63 6.45 -13% Operating cash flow -350 -202 -1 867 -182 ROCE, % N/A N/A 7% 11% Adjusted ROCE, % N/A N/A 11% 13% Interest-bearing net debt / EBITDA, multiple 2.77 1.41 2.77 1.41 Interest-bearing net debt / Adjusted EBITDA, multiple 2.36 1.31 2.36 1.31
Transcript of January September 2018 - mb.cision.commb.cision.com/Main/66/2645514/927287.pdf · Adjusted EBITDA...
Q3 January–September 2018
INTERIM REPORT JANUARY–SEPTEMBER 2018
Quarterly data
Net sales were SEK 6 054 million (5 544), an increase of 9% mainly as a
result of increased sales prices and positive currency effects.
EBITDA was SEK 881 million (1 051), a decrease of 16% mainly as a
result of increased raw material costs.
Adjusted EBITDA was SEK 893 million (1 080), a decrease of 17%.
The adjusted operating margin was 9% (13%).
Adjusted operating profit was SEK 540 million (717), a decrease of 25%.
Earnings per share amounted to SEK 1.76 (2.48).
Key highlights
Solid sales performance in all business areas.
Positive effects from increased sales prices and currency.
Continued headwinds from higher raw material costs.
Strategic investments progressing according to plan.
Outlook Q4
Strong demand within all business areas is expected to continue.
Limited possibilities for further sales price increases.
Sharp increase in wood costs expected to continue.
KEY FIGURES
For key figures and a reconciliation of alternative performance measures, see pages 22-24.
For further information, please contact:
Susanne Lithander, CFO, +46 8 553 335 00
Christopher Casselblad, Investor Relations, +46 8 553 335 08
This information constituted inside information prior to publication. This is information that BillerudKorsnäs AB (publ) is obliged to make public pursuant to the EU Market Abuse Regulation. The information was submitted for publication, through the agency of the contact persons set out above, at 13.00 CET on 16 October 2018.
Q3 Q3 Jan-Sep Jan-Sep
SEKm 2018 2017 Change 2018 2017 Change
Net sales 6 054 5 544 9% 17 849 16 780 6%
EBITDA 881 1 051 -16% 2 149 2 837 -24%
EBITDA, % 15% 19% 12% 17%
Adjusted EBITDA 893 1 080 -17% 2 666 2 900 -8%
Adjusted EBITDA, % 15% 19% 15% 17%
Operating profit 513 681 -25% 1 016 1 720 -41%
Operating margin, % 8% 12% 6% 10%
Adjusted operating profit 540 717 -25% 1 578 1 804 -13%
Adjusted operating margin, % 9% 13% 9% 11%
Net profit/loss for the period 363 513 -29% 728 1 270 -43%
Earnings per share, SEK 1.76 2.48 -29% 3.52 6.13 -43%
Adjusted earnings per share, SEK 1.85 2.61 -29% 5.63 6.45 -13%
Operating cash flow -350 -202 -1 867 -182
ROCE, % N/A N/A 7% 11%
Adjusted ROCE, % N/A N/A 11% 13%
Interest-bearing net debt / EBITDA, multiple 2.77 1.41 2.77 1.41
Interest-bearing net debt / Adjusted EBITDA, multiple 2.36 1.31 2.36 1.31
2 INTERIM REPORT BILLERUDKORSNÄS AKTIEBOLAG (PUBL) JANUARY–SEPTEMBER 2018
COMMENTS BY CEO
Solid sales performance across all business
areas
“The strong demand for innovative and sustainable packaging continues, resulting
in positive sales performance in all business areas. Revenues in the third quarter
increased with 9% compared to the same period last year, fuelled by increased
sales prices. However, headwinds from increasing raw material costs and start-up
performance, continue to put pressure on our operating results.
We are proceeding on schedule towards the start-up of the new KM7 board
machine in March-April 2019. Our current focus is to prepare for a stable and
successful ramp-up. With the completion of our Next Generation investment
programme, we will be in an excellent position to grasp the market opportunities
and meet the strong demand for sustainable packaging.
A key enabler to unlock our potential is our new organisational structure,
consisting of three business divisions with full profitability responsibility, effective
as of October 1. Our new structure will increase speed, accountability and
customer focus, and pave the way for the continued successful implementation of
our strategy.”
The result
EBITDA for the quarter amounted to SEK 881 million, a decrease of 16% compared to the same period last year owing mainly to higher costs for pulpwood and chemicals. Fibre costs account for more than one-third of our total operating costs, which is why we are focusing on improving the sourcing balance.
Another main priority is production availability; we expect to see increased stability during 2019 and onwards measured by overall equipment efficiency (OEE).
The result was also affected by comparatively high prices on the pulp supply to our non-integrated mill in Jakobstad, due to a fixed rebate in the long-term pulp supply agreement. At current pulp prices, this gives a quarterly negative effect of approx. SEK 75 million compared to general market levels.
Market outlook
Strong demand within all business areas is expected to continue over the next quarters. We
will continue to increase sales prices where possible but at a slower pace than in previous
quarters. Wood costs are expected to increase further while the wood supply situation has
improved significantly.
Strategy
We will continue to pursue our strategy for sustainable solutions and profitable growth. To
unlock our full potential, we have implemented an agenda of prioritised activities aimed at
securing the successful ramp-up of KM7, safeguarding the wood supply, stabilising
production, enhancing effectiveness, and accelerating innovation and solutions.
Innovation is a key component of our strategy. We aim to improve our new product ratio and
introduce new materials with increased efforts throughout the organisation. By establishing a
division entirely focused on solutions, we intend to grow current packaging solutions and
business models as well as innovating new ones.
Petra Einarsson,
President and CEO
SEK 6 054 million Net sales
SEK 881 million EBITDA
15% EBITDA margin
INTERIM REPORT BILLERUDKORSNÄS AKTIEBOLAG (PUBL) JANUARY–SEPTEMBER 2018 3
Sales and results
Q3 2018 compared with Q2 2018 Market conditions remained good across the board and net sales were 3% higher than last
quarter. Improved prices mainly for sack and kraft paper as well as pulp mitigated the
somewhat negative currency effect.
Sales volumes increased with 5% compared with the previous quarter. The main reason for
the increase relates to the planned maintenance shutdowns at Gävle and Karlsborg, which
showed lower volume shortfalls, than those carried out at Gruvön and Skärblacka in the
previous quarter.
The wood supply situation has improved compared to Q2. The total impact on earnings from
the wood shortage in the third quarter was approximately SEK 40 million relating to
additional logistics costs, compared with the SEK 100 million in volume losses for the
previous quarter.
EBITDA increased by SEK 678 million, from SEK 203 million to SEK 881 million. The
increase was mainly related to the SEK 452 million provision the Group made in Q2 primarily
for workplace efficiency and environmental initiatives as well as for an acceleration of the
ongoing implementation of unified accounting principles on spare parts and consumables.
The negative earnings effect of the planned maintenance shutdowns was SEK 208 million as
compared to SEK 401 million in the previous quarter, although the ramp-up at Gävle after the
maintenance shutdown took longer than expected. An additional positive effect, besides the
lower cost for wood shortage, came from the seasonally lower personnel related costs over the
summer holiday period.
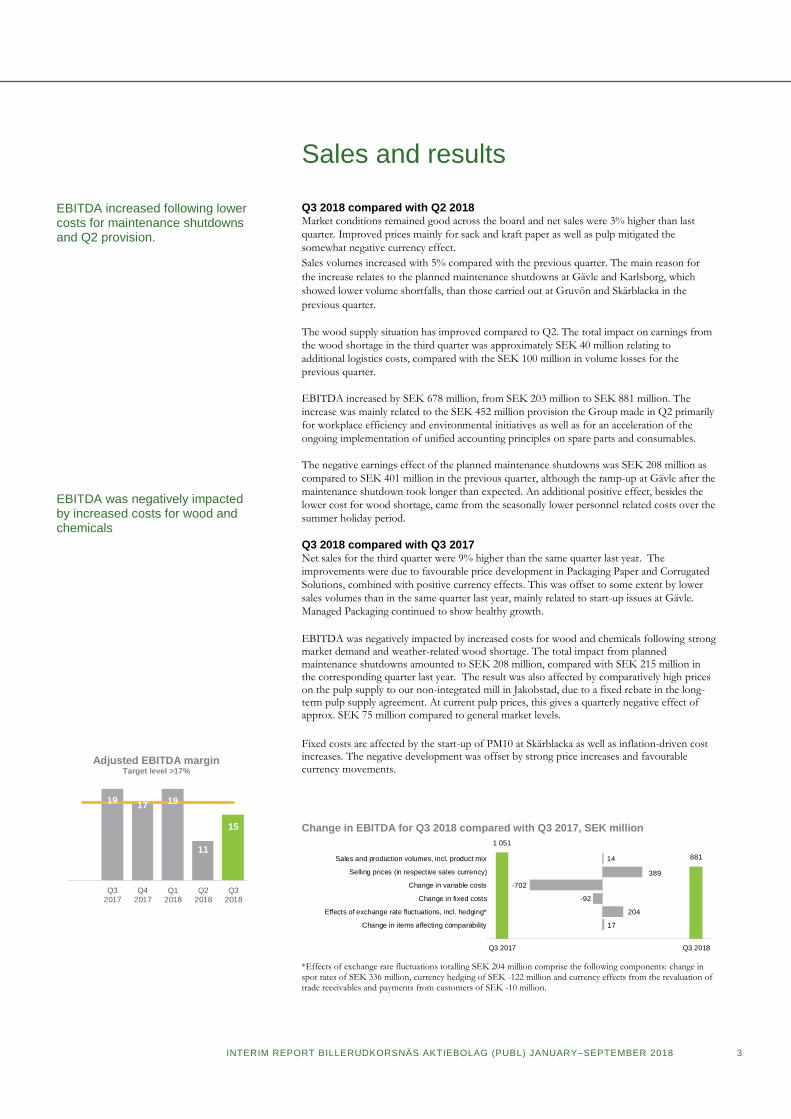
Q3 2018 compared with Q3 2017 Net sales for the third quarter were 9% higher than the same quarter last year. The
improvements were due to favourable price development in Packaging Paper and Corrugated
Solutions, combined with positive currency effects. This was offset to some extent by lower
sales volumes than in the same quarter last year, mainly related to start-up issues at Gävle.
Managed Packaging continued to show healthy growth.
EBITDA was negatively impacted by increased costs for wood and chemicals following strong market demand and weather-related wood shortage. The total impact from planned maintenance shutdowns amounted to SEK 208 million, compared with SEK 215 million in the corresponding quarter last year. The result was also affected by comparatively high prices on the pulp supply to our non-integrated mill in Jakobstad, due to a fixed rebate in the long-term pulp supply agreement. At current pulp prices, this gives a quarterly negative effect of approx. SEK 75 million compared to general market levels.
Fixed costs are affected by the start-up of PM10 at Skärblacka as well as inflation-driven cost increases. The negative development was offset by strong price increases and favourable currency movements.
Change in EBITDA for Q3 2018 compared with Q3 2017, SEK million
*Effects of exchange rate fluctuations totalling SEK 204 million comprise the following components: change in spot rates of SEK 336 million, currency hedging of SEK -122 million and currency effects from the revaluation of trade receivables and payments from customers of SEK -10 million.
881
1 051
Q3 2018Q3 2017
14
389
-702
-92
204
17
Sales and production volumes, incl. product mix
Selling prices (in respective sales currency)
Change in variable costs
Change in fixed costs
Effects of exchange rate fluctuations, incl. hedging*
Change in items affecting comparability
EBITDA increased following lower costs for maintenance shutdowns and Q2 provision. EBITDA was negatively impacted by increased costs for wood and chemicals
Adjusted EBITDA margin Target level >17%
1917 19
11
15
5
7
9
11
13
15
17
19
Q32017
Q42017
Q12018
Q22018
Q32018
4 INTERIM REPORT BILLERUDKORSNÄS AKTIEBOLAG (PUBL) JANUARY–SEPTEMBER 2018
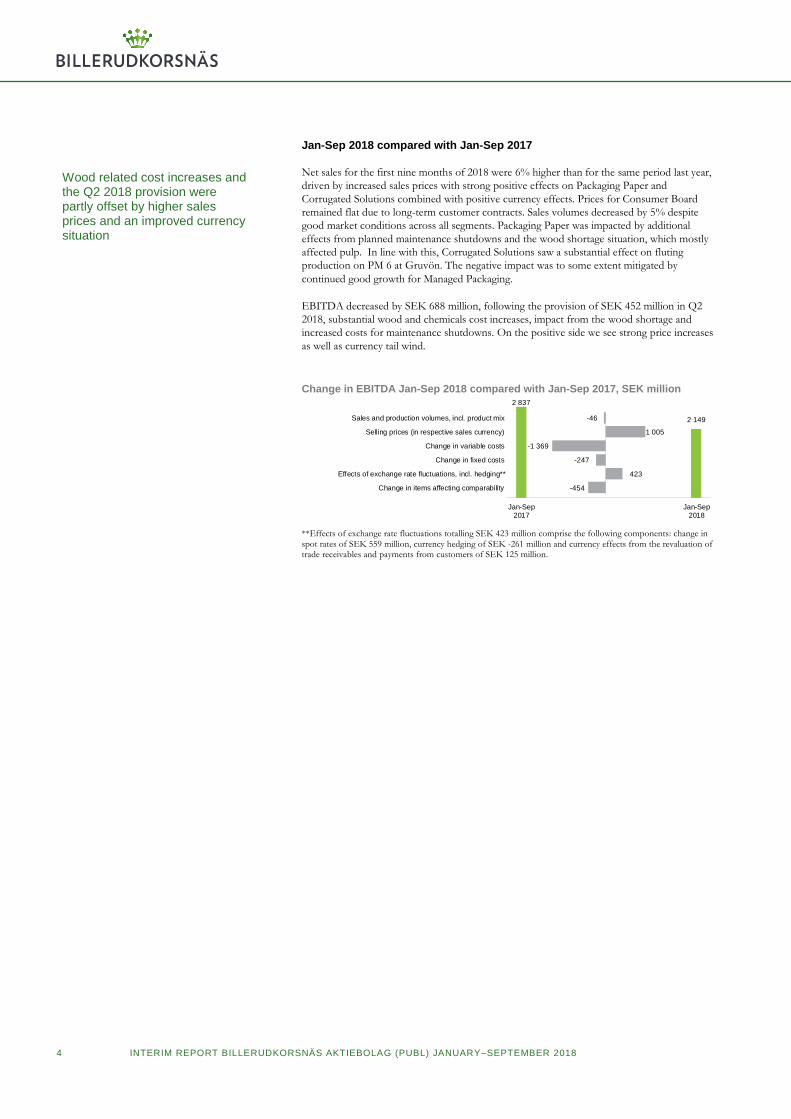
Wood related cost increases and the Q2 2018 provision were partly offset by higher sales prices and an improved currency situation
Jan-Sep 2018 compared with Jan-Sep 2017
Net sales for the first nine months of 2018 were 6% higher than for the same period last year,
driven by increased sales prices with strong positive effects on Packaging Paper and
Corrugated Solutions combined with positive currency effects. Prices for Consumer Board
remained flat due to long-term customer contracts. Sales volumes decreased by 5% despite
good market conditions across all segments. Packaging Paper was impacted by additional
effects from planned maintenance shutdowns and the wood shortage situation, which mostly
affected pulp. In line with this, Corrugated Solutions saw a substantial effect on fluting
production on PM 6 at Gruvön. The negative impact was to some extent mitigated by
continued good growth for Managed Packaging.
EBITDA decreased by SEK 688 million, following the provision of SEK 452 million in Q2
2018, substantial wood and chemicals cost increases, impact from the wood shortage and
increased costs for maintenance shutdowns. On the positive side we see strong price increases
as well as currency tail wind.
Change in EBITDA Jan-Sep 2018 compared with Jan-Sep 2017, SEK million
**Effects of exchange rate fluctuations totalling SEK 423 million comprise the following components: change in spot rates of SEK 559 million, currency hedging of SEK -261 million and currency effects from the revaluation of trade receivables and payments from customers of SEK 125 million.
2 149
2 837
Jan-Sep2018
Jan-Sep2017
-46
1 005
-1 369
-247
423
-454
Sales and production volumes, incl. product mix
Selling prices (in respective sales currency)
Change in variable costs
Change in fixed costs
Effects of exchange rate fluctuations, incl. hedging**
Change in items affecting comparability

INTERIM REPORT BILLERUDKORSNÄS AKTIEBOLAG (PUBL) JANUARY–SEPTEMBER 2018 5
Packaging Paper business area KRAFT AND SACK PAPER FOR CUSTOMERS WITH TOUGH DEMANDS
Packaging Paper offers premium-quality kraft and sack paper, plus smart solutions for customers in the industrial, medical equipment and consumer segments. The business area also sells any surplus of pulp that BillerudKorsnäs does not use in its own production. The Group’s net exposure in market pulp is estimated to approximately 100 ktonnes for 2018, 100 ktonnes for 2019 and 0 ktonnes in 2021.
KEY FIGURES
Q3 2018 compared with Q3 2017 Net sales in the third quarter of 2018 were 16 % higher than in the same quarter of 2017 as a
result of improved sales prices, a better sales mix and favourable currency effects.
EBITDA increased by 20 % compared with the corresponding quarter last year, due to higher
sales prices and a favourable product mix despite lower sales volumes.
Jan-Sep 2018 compared with Jan-Sep 2017 Net sales for the first nine months of 2018 increased by 10 % compared with the first nine
months of 2017 as a result of a favourable sales mix, higher prices in local currency and
favourable currency effects. Sales volumes were lower than the corresponding period due to
the wood shortage and a change in product mix at Gruvön.
EBITDA increased by 14 % compared with the same period last year, due to a better sales
mix, higher prices and favourable currency effects.
Market development Market conditions were strong during the quarter. Compared with the previous quarter, the
market remained favourable for all sack and kraft papers. Prices in local currencies increased
slightly for both sack papers and kraft papers.
The market for NBSK pulp remained positive, as in previous quarters. Prices were around
USD 1 230 per tonne at the end of the quarter compared with USD 1 190 at the end of the
previous quarter. At the end of the third quarter of 2017 the price was USD 910 per tonne.
Outlook
The market for kraft and sack paper is expected to remain strong with possibilities for limited
price increases.
Full year
SEKm Q3 -18 Q3 -17 2018 2017 2017
Net sales 2 424 2 090 6 992 6 382 8 529
of which kraft paper 978 899 2 849 2 792 3 685
of which sack paper 889 648 2 484 1 948 2 631
Net operating expenses, other -1 952 -1 696 -5 736 -5 284 -7 030
EBITDA 472 394 1 256 1 098 1 499
EBITDA, % 19% 19% 18% 17% 18%
Operating profit/loss 346 278 902 750 1 035
Operating margin, % 14% 13% 13% 12% 12%
Sales volumes, ktonnes 269 289 804 870 1 152
Quarter Jan-Sep
Share of Group’s net sales for Q3 2018
1EBITDA
40%
394 401467
317
472
19 1921
14
19
0
5
10
15
20
25
30
0
50
100
150
200
250
300
350
400
450
500
Q3 -17 Q4 -17 Q1 -18 Q2 -18 Q3 -18
6 INTERIM REPORT BILLERUDKORSNÄS AKTIEBOLAG (PUBL) JANUARY–SEPTEMBER 2018
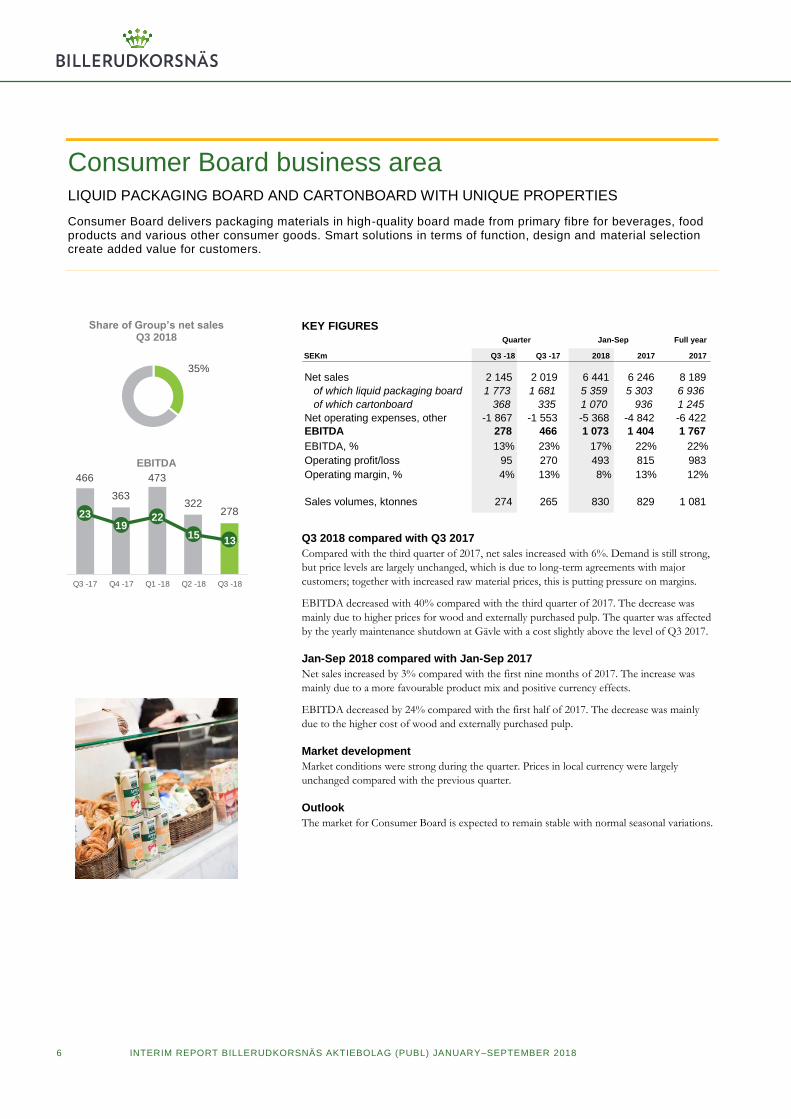
Consumer Board business area LIQUID PACKAGING BOARD AND CARTONBOARD WITH UNIQUE PROPERTIES
Consumer Board delivers packaging materials in high-quality board made from primary fibre for beverages, food products and various other consumer goods. Smart solutions in terms of function, design and material selection create added value for customers.
KEY FIGURES
Q3 2018 compared with Q3 2017
Compared with the third quarter of 2017, net sales increased with 6%. Demand is still strong,
but price levels are largely unchanged, which is due to long-term agreements with major
customers; together with increased raw material prices, this is putting pressure on margins.
EBITDA decreased with 40% compared with the third quarter of 2017. The decrease was
mainly due to higher prices for wood and externally purchased pulp. The quarter was affected
by the yearly maintenance shutdown at Gävle with a cost slightly above the level of Q3 2017.
Jan-Sep 2018 compared with Jan-Sep 2017
Net sales increased by 3% compared with the first nine months of 2017. The increase was
mainly due to a more favourable product mix and positive currency effects.
EBITDA decreased by 24% compared with the first half of 2017. The decrease was mainly
due to the higher cost of wood and externally purchased pulp.
Market development
Market conditions were strong during the quarter. Prices in local currency were largely
unchanged compared with the previous quarter.
Outlook
The market for Consumer Board is expected to remain stable with normal seasonal variations.
Full year
SEKm Q3 -18 Q3 -17 2018 2017 2017
Net sales 2 145 2 019 6 441 6 246 8 189
of which liquid packaging board 1 773 1 681 5 359 5 303 6 936
of which cartonboard 368 335 1 070 936 1 245
Net operating expenses, other -1 867 -1 553 -5 368 -4 842 -6 422
EBITDA 278 466 1 073 1 404 1 767
EBITDA, % 13% 23% 17% 22% 22%
Operating profit/loss 95 270 493 815 983
Operating margin, % 4% 13% 8% 13% 12%
Sales volumes, ktonnes 274 265 830 829 1 081
Quarter Jan-Sep
Share of Group’s net sales Q3 2018
EBITDA
35%
466
363
473
32227823
1922
1513
0
5
10
15
20
25
30
35
0
50
100
150
200
250
300
350
400
450
500
Q3 -17 Q4 -17 Q1 -18 Q2 -18 Q3 -18

INTERIM REPORT BILLERUDKORSNÄS AKTIEBOLAG (PUBL) JANUARY–SEPTEMBER 2018 7
Corrugated Solutions business area FLUTING AND LINER ADD VALUE
Corrugated Solutions supplies materials to corrugated board manufacturers and packaging solutions to brand owners. The strong and light materials – fluting and liner – are used in corrugated boxes for fragile goods and demanding distribution systems. Smart packaging is delivered via the Managed Packaging concept, which provides supply chain solutions and packaging optimisation for brand owners, with a view to challenging conventional solutions.
KEY FIGURES
Q3 2018 compared with Q3 2017 Net sales increased by 12% compared to the corresponding quarter in 2017 as a result of
improved prices in local currency, positive currency effects and strong sales within Managed
Packaging. Together this offset the effect from lower sales volumes.
EBITDA decreased with 1% compared to the third quarter of 2017. Higher sales prices and
favourable currency effects almost compensated for lower sales volumes, higher raw material
costs as well as higher costs in Managed Packaging.
Jan-Sep 2018 compared with Jan-Sep 2017 Net sales increased in the first nine months of 2018 with 9% compared to the same period in
2017 owing to stronger sales in Managed Packaging and higher prices in local currency.
EBITDA decreased by 4% as a result of higher variable costs linked to wood costs and lower
sales and production volumes owing to the wood shortage and additional maintenance
shutdowns. This was offset by higher sales prices, and improved Managed Packaging earnings.
Market development
The liner and fluting market remained good with stable prices and high demand in the third
quarter, particularly in Europe but also on other markets. Managed Packaging continued to
deliver strong sales growth in the quarter compared to last year but seasonally lower than in
the previous quarter.
Outlook
Order levels for fluting and liner are expected to remain stable at a high level. Managed
Packaging is expected to continue delivering strong growth.
Full year
SEKm Q3 -18 Q3 -17 2018 2017 2017
Net sales 1 135 1 012 3 090 2 845 3 856
of which fluting 498 475 1 364 1 320 1 779
of which liner 397 363 1 059 1 051 1 389
of which Managed Packaging 219 172 614 464 662
Net operating expenses, other -869 -743 -2 494 -2 223 -3 022
EBITDA 266 269 596 622 834
EBITDA, % 23% 27% 19% 22% 22%
Operating profit/loss 219 226 463 488 656
Operating margin, % 19% 22% 15% 17% 17%
Sales volumes, ktonnes 132 145 371 410 542
Quarter Jan-Sep
Share of Group’s net sales Q3 2018
EBITDA
19%
269
212 210
120
266
2721 22
12
23
0
5
10
15
20
25
30
35
40
45
0
50
100
150
200
250
300
Q3 -17 Q4 -17 Q1 -18 Q2 -18 Q3 -18
8 INTERIM REPORT BILLERUDKORSNÄS AKTIEBOLAG (PUBL) JANUARY–SEPTEMBER 2018
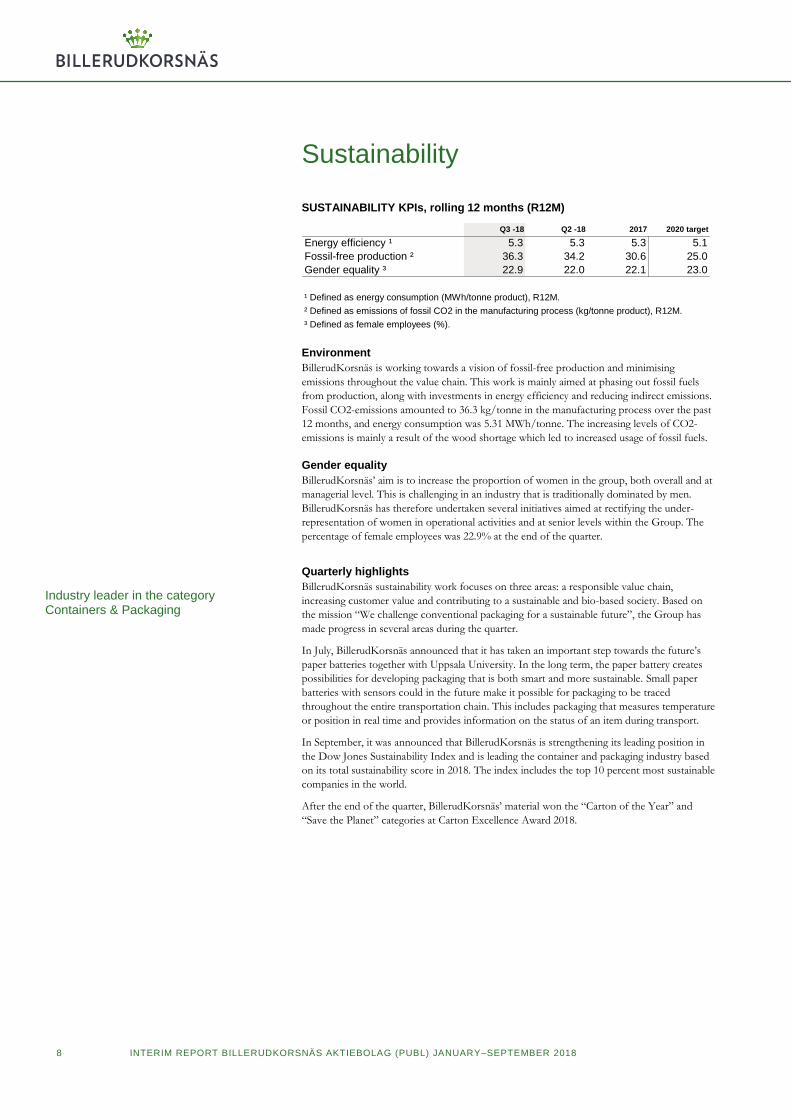
Sustainability
SUSTAINABILITY KPIs, rolling 12 months (R12M)
Environment
BillerudKorsnäs is working towards a vision of fossil-free production and minimising
emissions throughout the value chain. This work is mainly aimed at phasing out fossil fuels
from production, along with investments in energy efficiency and reducing indirect emissions.
Fossil CO2-emissions amounted to 36.3 kg/tonne in the manufacturing process over the past
12 months, and energy consumption was 5.31 MWh/tonne. The increasing levels of CO2-
emissions is mainly a result of the wood shortage which led to increased usage of fossil fuels.
Gender equality
BillerudKorsnäs’ aim is to increase the proportion of women in the group, both overall and at
managerial level. This is challenging in an industry that is traditionally dominated by men.
BillerudKorsnäs has therefore undertaken several initiatives aimed at rectifying the under-
representation of women in operational activities and at senior levels within the Group. The
percentage of female employees was 22.9% at the end of the quarter.
Quarterly highlights
BillerudKorsnäs sustainability work focuses on three areas: a responsible value chain,
increasing customer value and contributing to a sustainable and bio-based society. Based on
the mission “We challenge conventional packaging for a sustainable future”, the Group has
made progress in several areas during the quarter.
In July, BillerudKorsnäs announced that it has taken an important step towards the future’s
paper batteries together with Uppsala University. In the long term, the paper battery creates
possibilities for developing packaging that is both smart and more sustainable. Small paper
batteries with sensors could in the future make it possible for packaging to be traced
throughout the entire transportation chain. This includes packaging that measures temperature
or position in real time and provides information on the status of an item during transport.
In September, it was announced that BillerudKorsnäs is strengthening its leading position in
the Dow Jones Sustainability Index and is leading the container and packaging industry based
on its total sustainability score in 2018. The index includes the top 10 percent most sustainable
companies in the world.
After the end of the quarter, BillerudKorsnäs’ material won the “Carton of the Year” and
“Save the Planet” categories at Carton Excellence Award 2018.
Q3 -18 Q2 -18 2017 2020 target
Energy efficiency ¹ 5.3 5.3 5.3 5.1
Fossil-free production ² 36.3 34.2 30.6 25.0
Gender equality ³ 22.9 22.0 22.1 23.0
¹ Defined as energy consumption (MWh/tonne product), R12M.
² Defined as emissions of fossil CO2 in the manufacturing process (kg/tonne product), R12M.
³ Defined as female employees (%).
Industry leader in the category Containers & Packaging
INTERIM REPORT BILLERUDKORSNÄS AKTIEBOLAG (PUBL) JANUARY–SEPTEMBER 2018 9
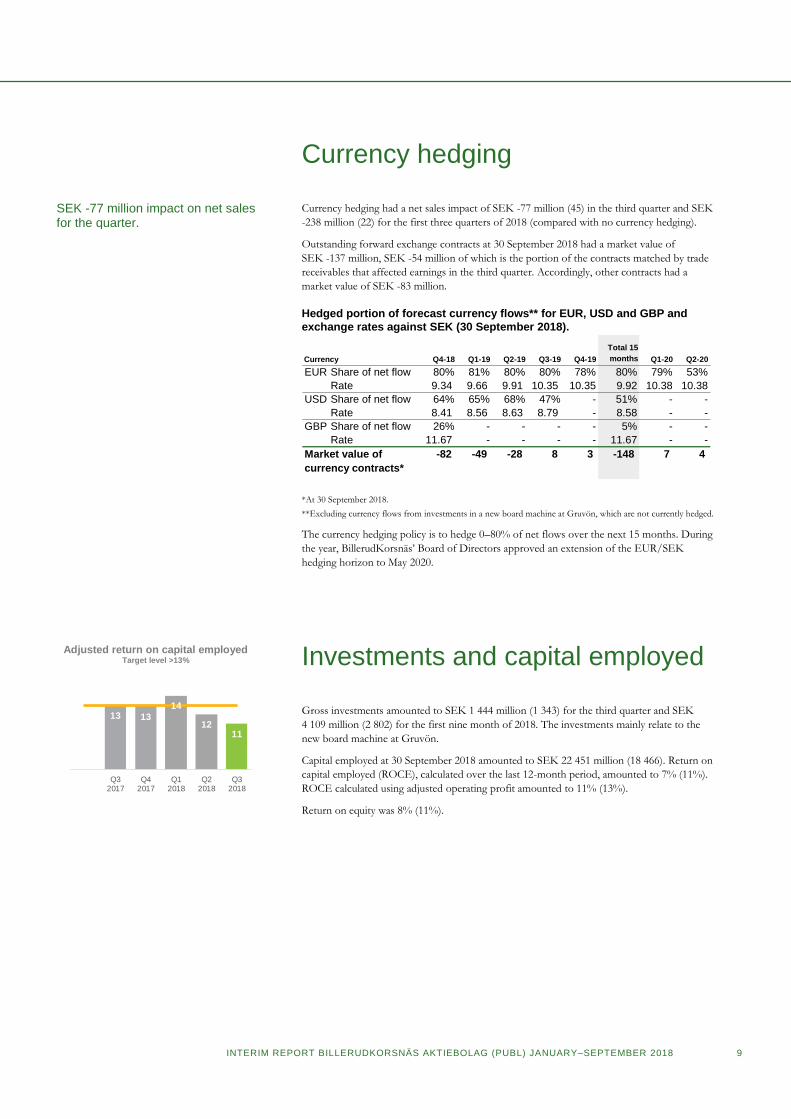
Currency hedging
Currency hedging had a net sales impact of SEK -77 million (45) in the third quarter and SEK
-238 million (22) for the first three quarters of 2018 (compared with no currency hedging).
Outstanding forward exchange contracts at 30 September 2018 had a market value of
SEK -137 million, SEK -54 million of which is the portion of the contracts matched by trade
receivables that affected earnings in the third quarter. Accordingly, other contracts had a
market value of SEK -83 million.
Hedged portion of forecast currency flows** for EUR, USD and GBP and
exchange rates against SEK (30 September 2018).
*At 30 September 2018.
**Excluding currency flows from investments in a new board machine at Gruvön, which are not currently hedged.
The currency hedging policy is to hedge 0–80% of net flows over the next 15 months. During
the year, BillerudKorsnäs’ Board of Directors approved an extension of the EUR/SEK
hedging horizon to May 2020.
Investments and capital employed
Gross investments amounted to SEK 1 444 million (1 343) for the third quarter and SEK
4 109 million (2 802) for the first nine month of 2018. The investments mainly relate to the
new board machine at Gruvön.
Capital employed at 30 September 2018 amounted to SEK 22 451 million (18 466). Return on
capital employed (ROCE), calculated over the last 12-month period, amounted to 7% (11%).
ROCE calculated using adjusted operating profit amounted to 11% (13%).
Return on equity was 8% (11%).
Currency Q4-18 Q1-19 Q2-19 Q3-19 Q4-19
Total 15
months Q1-20 Q2-20
EUR Share of net flow 80% 81% 80% 80% 78% 80% 79% 53%
Rate 9.34 9.66 9.91 10.35 10.35 9.92 10.38 10.38
USD Share of net flow 64% 65% 68% 47% - 51% - -
Rate 8.41 8.56 8.63 8.79 - 8.58 - -
GBP Share of net flow 26% - - - - 5% - -
Rate 11.67 - - - - 11.67 - -
-82 -49 -28 8 3 -148 7 4Market value of
currency contracts*
SEK -77 million impact on net sales for the quarter.
Adjusted return on capital employed Target level >13%
13 13
14
1211
6
14
Q32017
Q42017
Q12018
Q22018
Q32018

10 INTERIM REPORT BILLERUDKORSNÄS AKTIEBOLAG (PUBL) JANUARY–SEPTEMBER 2018
Cash flow and financial position
Summary cash flow statement
Operating cash flow amounted to SEK – 350 million (-202) in the third quarter and SEK
-1 867 million (-182) in the first nine months of 2018. Changes in cash flow were mainly due
to the investments at Gruvön. Working capital in relation to sales was 8% for the quarter,
which was a decrease from 9% in the second quarter of 2018.
Interest-bearing net debt at 30 September 2018 amounted to SEK 8 520 million (4 982). The
Group’s net interest-bearing debt in relation to EBITDA at the end of the period was 2.77
(1.41). If adjusted EBITDA were used in the calculation, the ratio would be 2.36. The target is
to have a ratio below 2.5.
Financing
On 30 September 2018, interest-bearing debt amounted to SEK 8 131 million, an increase of
SEK 385 million compared with the previous quarter. The change was mainly due to the
additional issue of SEK 400 million in commercial papers.
Compared with the same period last year, interest-bearing debt increased by
SEK 3 003 million.
SEKm Q3 -18 Q3 -17 2018 2017
Operating surplus, etc. 840 1 022 2 449 2 754
Change in working capital, etc. 305 201 82 174
Net financial items, taxes, etc. -52 -83 -296 -310
Cash flow from operating activities 1 093 1 140 2 235 2 618
Current net investments -1 443 -1 342 -4 102 -2 800
Operating cash flow -350 -202 -1 867 -182
Jan-SepQuarter
Total
Loan Limit, SEKm 0-1 1-2 2- utilised
Syndicated credit facilities 5 500 -
Term loans 228 256 1 489 1 973
Bond loans within MTN program 7 000 400 4 300 4 700
Commercial paper 3 000 1 000 1 000
Term loan, Bomhus Energi AB 47 46 365 458
Group total 1 275 702 6 154 8 131
Maturity, years
Net debt/EBITDA target level <2.5
Dividend policy Target level 50%
1,41 1,53 1,55
2,522,77
0, 00
0, 50
1, 00
1, 50
2, 00
2, 50
3, 00
Q32017
Q42017
Q12018
Q22018
Q32018
2,00 2,25
3,15
4,25 4,30 4,30
6169
51 49
5954
0, 00
0, 10
0, 20
0, 30
0, 40
0, 50
0, 60
0, 70
0, 80
0
1
2
3
4
5
6
7
2012 2013 2014 2015 2016 2017
Dividend payout ratio, %

INTERIM REPORT BILLERUDKORSNÄS AKTIEBOLAG (PUBL) JANUARY–SEPTEMBER 2018 11
Taxes
The tax cost for the first nine months of 2018 amounted to SEK 186 million (345), equal to
approximately 20% (21%) of profit before tax.
Parent company
The parent company BillerudKorsnäs AB includes the sales organisation for the Nordic
market and markets outside Europe, and head office functions.
Operating loss for the first nine months of 2018 was SEK -284 million compared with
SEK -95 million for the first nine months of 2017. Operating loss reflects the effects of
hedging contracts and revaluations of trade receivables.
The parent company hedges both its own and the Group’s net currency flows. The parent
company’s earnings include the results of these hedging measures. These earnings were SEK
- 238 million (22) for the first nine months.
The average number of employees was 114 (107). Cash and bank balances, and short-term
investments amounted to SEK 192 million (726).

12 INTERIM REPORT BILLERUDKORSNÄS AKTIEBOLAG (PUBL) JANUARY–SEPTEMBER 2018
Seasonal effects
BillerudKorsnäs’ business is subject to seasonal fluctuations to a relatively limited extent.
Periodical maintenance shutdowns have the largest impact, as they involve each unit stopping
production for around one week. The loss of production results in somewhat lower deliveries
over an extended period before, during and after the shutdown. It should also be noted that
the Group usually has a somewhat higher cost level in the fourth quarter than in previous
quarters.
Planned maintenance shutdowns
In addition to ongoing maintenance during production, BillerudKorsnäs’ production units
normally also require more extensive maintenance at some time during the year. Maintenance
requires the production of pulp, paper and board to stop. The principal cost items in a
maintenance shutdown are loss of volumes arising from the shutdown and fixed costs, mainly
maintenance and overtime costs, as well as a certain portion of variable costs including higher
consumption of electricity and wood when production is restarted. The effects of shutdowns
on earnings vary depending on the extent of the measures carried out, their nature and the
actual length of the shutdown. The estimated cost of shutdown involves an assessment of the
impact on earnings of a normal shutdown compared with a quarter during which no periodic
maintenance shutdown takes place.
In the third quarter of 2018 planned maintenance shutdowns were carried out at Gävle and
Karlsborg. The total cost amounted to approximately SEK 208 million, which was SEK 13
million more than estimated.
Estimated maintenance shutdown cost
¹Maintenance shutdowns at Beetham have an insignificant effect on BillerudKorsnäs’ total earnings. *In addition to the planned maintenance shutdown at Gruvön in 2018, a prolonged maintenance shutdown due to rebuilds in connection with the new KM7 board machine was carried out at an estimated cost of SEK 75 million. **Maintenance shutdown in Gävle 2019 has an estimated cost of SEK 150 million.
Production
units
Estimated
shutdown cost ¹
SEKm Packaging Consumer Corrugated 2019 2018 2017
Paper Board Solutions
Gävle** ~ 140 ~ 5% ~ 80% ~ 15% Q2 | Q3 | Q3
Gruvön* ~ 140 ~ 40% ~ 10% ~ 50% Q3 | Q2 | Q2
Frövi ~ 90 0% 100% 0% Q4 | Q4 | Q4
Skärblacka ~ 150 ~ 85% 0% ~ 15% Q2 | Q2 | Q2
Skärblacka ~ 20 100% 0% 0% - - | Q3
Karlsborg ~ 55 100% 0% 0% Q3 | Q3 | Q3
Pietarsaari ~ 15 100% 0% 0% - | Q4 | Q2
Rockhammar ~ 15 0% 100% 0% Q4 | Q4 | Q4
Estimated breakdown of shutdown cost by
business area
Planned dates of
maintenance shutdown

INTERIM REPORT BILLERUDKORSNÄS AKTIEBOLAG (PUBL) JANUARY–SEPTEMBER 2018 13
Largest shareholders
BillerudKorsnäs’ 10 largest shareholders (30 September 2018)
Distribution of shares
Distribution of shares (30 September 2018)
Significant risks and uncertainties
BillerudKorsnäs’ products are generally dependent on the business cycle, in terms of both
price development and potential sales volumes. The Group is exposed to currency
fluctuations, since most revenues are invoiced in foreign currency, while a large part of
operating expenses are in SEK. A more detailed description of risks and a sensitivity analysis is
provided on pages 68-75 of the 2017 Annual and Sustainability Report.
Related-party transactions
No transactions took place between BillerudKorsnäs and related parties that significantly
affected the Group’s position and earnings.
Number of Number of
Shareholder shares votes, %
FRAPAG Beteiligungsholding AG 31 300 000 15.1
AMF Insurance & Funds 20 224 371 9.8
Fourth Swedish National Pension Fund 12 569 771 6.1
Swedbank Robur Funds 12 192 005 5.9
AllianceBernstein 10 517 178 5.1
Schroders 10 207 037 4.9
Alecta 7 266 200 3.5
Vanguard 4 562 497 2.2
Nordea Funds 4 234 957 2.1
Dimensional Fund Advisors 3 707 842 1.8
Total 10 largest shareholders 116 781 858 56.5
Total number of shares in the market 207 035 643 100.0
Registered number of shares 208 219 834
Bought back shares -1 184 191
Total number of shares in the market 207 035 643
14 INTERIM REPORT BILLERUDKORSNÄS AKTIEBOLAG (PUBL) JANUARY–SEPTEMBER 2018
Events after the end of the quarter
On October 8, BillerudKorsnäs announced that Helene Biström has been appointed Senior
Vice President for Paper, one of the company’s three divisions in the new organisation that
came into effect on 1 October. Helene Biström will start at the latest during April 2019.
2019 Annual General Meeting
The Annual General Meeting will be held in Stockholm on 9 May 2019. Shareholders wishing
to have matters considered at the Annual General Meeting should submit their proposals in
writing to BillerudKorsnäs AB (publ), Att: Andreas Mattsson, General Counsel, Box 703, 169
27 Solna, Sweden, at least seven weeks before the Annual General Meeting, to ensure the
matter can be included in the convening notice for the Meeting. Notified matters can be
included on the agenda of the Annual General Meeting only if they are suitable for decision by
the Meeting and if notification is provided in due time. Further details on how and when to
provide notification of participation at the Annual General Meeting will be published in
advance of the Meeting.
Financial calendar
Q4 2018 – 29 January 2019
Q1 2019 – 17 April 2019
Q2 2019 – 16 July 2019
Q3 2019 – 17 October 2019

INTERIM REPORT BILLERUDKORSNÄS AKTIEBOLAG (PUBL) JANUARY–SEPTEMBER 2018 15
Solna, 16 October 2018
BillerudKorsnäs AB (publ)
Petra Einarsson
President and CEO
This information constituted inside information prior to publication. This is information that
BillerudKorsnäs AB (publ) is obliged to make public pursuant to the EU Market Abuse
Regulation. This report has been prepared in both a Swedish and an English version.
16 INTERIM REPORT BILLERUDKORSNÄS AKTIEBOLAG (PUBL) JANUARY–SEPTEMBER 2018
Translation of the Swedish original
Review report
To the Board of Directors of BillerudKorsnäs AB (publ)
Corp. id. 556025-5001
Introduction
We have reviewed the summary interim financial information (interim report) of BillerudKorsnäs AB (publ) as of 30 September 2018 and the nine-
month period then ended. The Board of Directors and the Managing Director are responsible for the preparation and presentation of this interim report
in accordance with IAS 34 and the Annual Accounts Act. Our responsibility is to express a conclusion on this interim report based on our review.
Scope of review
We conducted our review in accordance with International Standard on Review Engagements ISRE 2410 Review of Interim Financial Information
Performed by the Independent Auditor of the Entity. A review of interim financial information consists of making inquiries, primarily of persons
responsible for financial and accounting matters, and applying analytical and other review procedures. A review is substantially less in scope than an audit
conducted in accordance with International Standards on Auditing and other generally accepted auditing practices and consequently does not enable us
to obtain assurance that we would become aware of all significant matters that might be identified in an audit. Accordingly, we do not express an audit
opinion.
Conclusion
Based on our review, nothing has come to our attention that causes us to believe that the interim report is not prepared, in all material respects, for the
Group in accordance with IAS 34 and the Annual Accounts Act, and for the Parent Company in accordance with the Annual Accounts Act.
Stockholm 16 October 2018
KPMG AB
Ingrid Hornberg Román
Authorized Public Accountant
INTERIM REPORT BILLERUDKORSNÄS AKTIEBOLAG (PUBL) JANUARY–SEPTEMBER 2018 17
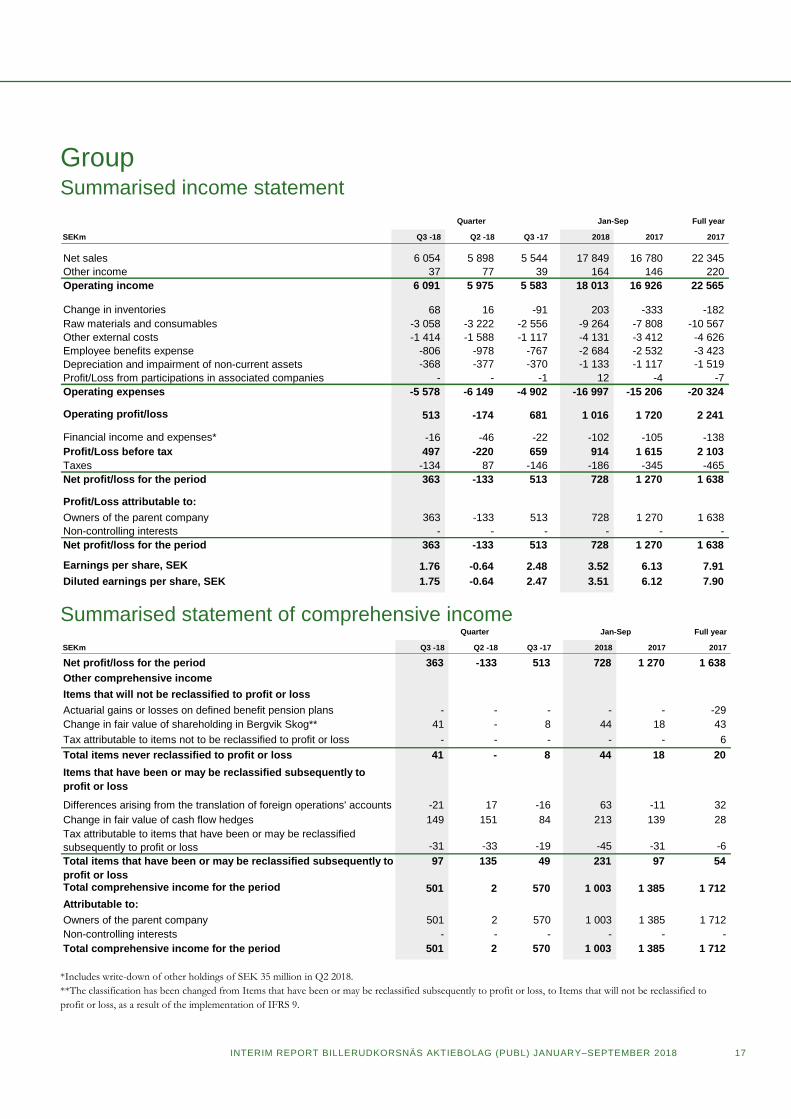
Group Summarised income statement
Summarised statement of comprehensive income
*Includes write-down of other holdings of SEK 35 million in Q2 2018.
**The classification has been changed from Items that have been or may be reclassified subsequently to profit or loss, to Items that will not be reclassified to
profit or loss, as a result of the implementation of IFRS 9.
Full year
SEKm Q3 -18 Q2 -18 Q3 -17 2018 2017 2017
Net sales 6 054 5 898 5 544 17 849 16 780 22 345
Other income 37 77 39 164 146 220
Operating income 6 091 5 975 5 583 18 013 16 926 22 565
Change in inventories 68 16 -91 203 -333 -182
Raw materials and consumables -3 058 -3 222 -2 556 -9 264 -7 808 -10 567
Other external costs -1 414 -1 588 -1 117 -4 131 -3 412 -4 626
Employee benefits expense -806 -978 -767 -2 684 -2 532 -3 423
Depreciation and impairment of non-current assets -368 -377 -370 -1 133 -1 117 -1 519
Profit/Loss from participations in associated companies - - -1 12 -4 -7
Operating expenses -5 578 -6 149 -4 902 -16 997 -15 206 -20 324
Operating profit/loss 513 -174 681 1 016 1 720 2 241
Financial income and expenses* -16 -46 -22 -102 -105 -138
Profit/Loss before tax 497 -220 659 914 1 615 2 103
Taxes -134 87 -146 -186 -345 -465
Net profit/loss for the period 363 -133 513 728 1 270 1 638
Profit/Loss attributable to:
Owners of the parent company 363 -133 513 728 1 270 1 638
Non-controlling interests - - - - - -
Net profit/loss for the period 363 -133 513 728 1 270 1 638
Earnings per share, SEK 1.76 -0.64 2.48 3.52 6.13 7.91
Diluted earnings per share, SEK 1.75 -0.64 2.47 3.51 6.12 7.90
Quarter Jan-Sep
Full year
SEKm Q3 -18 Q2 -18 Q3 -17 2018 2017 2017
Net profit/loss for the period 363 -133 513 728 1 270 1 638
Other comprehensive income
Items that will not be reclassified to profit or loss
Actuarial gains or losses on defined benefit pension plans - - - - - -29
Change in fair value of shareholding in Bergvik Skog** 41 - 8 44 18 43
Tax attributable to items not to be reclassified to profit or loss - - - - - 6
Total items never reclassified to profit or loss 41 - 8 44 18 20
Items that have been or may be reclassified subsequently to
profit or loss
Differences arising from the translation of foreign operations' accounts -21 17 -16 63 -11 32
Change in fair value of cash flow hedges 149 151 84 213 139 28
Tax attributable to items that have been or may be reclassified
subsequently to profit or loss -31 -33 -19 -45 -31 -6
Total items that have been or may be reclassified subsequently to
profit or loss
97 135 49 231 97 54
Total comprehensive income for the period 501 2 570 1 003 1 385 1 712
Attributable to:
Owners of the parent company 501 2 570 1 003 1 385 1 712
Non-controlling interests - - - - - -
Total comprehensive income for the period 501 2 570 1 003 1 385 1 712
Quarter Jan-Sep
18 INTERIM REPORT BILLERUDKORSNÄS AKTIEBOLAG (PUBL) JANUARY–SEPTEMBER 2018
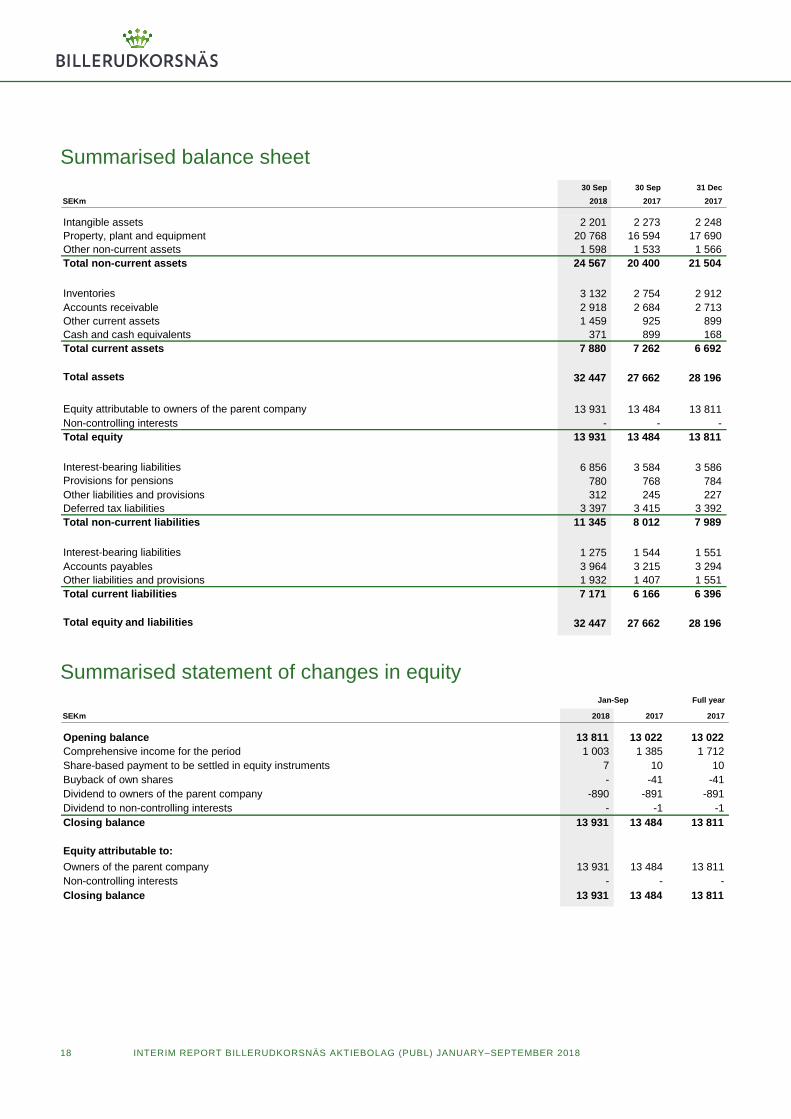
Summarised balance sheet
Summarised statement of changes in equity
30 Sep 30 Sep 31 Dec
SEKm 2018 2017 2017
Intangible assets 2 201 2 273 2 248
Property, plant and equipment 20 768 16 594 17 690
Other non-current assets 1 598 1 533 1 566
Total non-current assets 24 567 20 400 21 504
Inventories 3 132 2 754 2 912
Accounts receivable 2 918 2 684 2 713
Other current assets 1 459 925 899
Cash and cash equivalents 371 899 168
Total current assets 7 880 7 262 6 692
Total assets 32 447 27 662 28 196
Equity attributable to owners of the parent company 13 931 13 484 13 811
Non-controlling interests - - -
Total equity 13 931 13 484 13 811
Interest-bearing liabilities 6 856 3 584 3 586
Provisions for pensions 780 768 784
Other liabilities and provisions 312 245 227
Deferred tax liabilities 3 397 3 415 3 392
Total non-current liabilities 11 345 8 012 7 989
Interest-bearing liabilities 1 275 1 544 1 551
Accounts payables 3 964 3 215 3 294
Other liabilities and provisions 1 932 1 407 1 551
Total current liabilities 7 171 6 166 6 396
Total equity and liabilities 32 447 27 662 28 196
Full year
SEKm 2018 2017 2017
Opening balance 13 811 13 022 13 022
Comprehensive income for the period 1 003 1 385 1 712
Share-based payment to be settled in equity instruments 7 10 10
Buyback of own shares - -41 -41
Dividend to owners of the parent company -890 -891 -891
Dividend to non-controlling interests - -1 -1
Closing balance 13 931 13 484 13 811
Equity attributable to:
Owners of the parent company 13 931 13 484 13 811
Non-controlling interests - - -
Closing balance 13 931 13 484 13 811
Jan-Sep

INTERIM REPORT BILLERUDKORSNÄS AKTIEBOLAG (PUBL) JANUARY–SEPTEMBER 2018 19
Summarised cash flow statement
*The amount for the period January‒September 2018 takes into account operating profit of SEK 1 016 million, reversed depreciation of SEK 1 133 million, earnings from associated companies of SEK -12 million, decrease in pension liabilities of SEK -19 million, increase in other provisions of SEK 190, unified accounting principles regarding spare parts and consumables of SEK 177 million, net of produced and sold electricity certificates and sold emission rights of SEK -50 million, incentive programmes of SEK 7 million, scrapping of fixed assets of SEK 35 million, revaluation of current holdings related to business combinations
of SEK -30 million, capital loss from sales of business of SEK 2 million. The amount for the period January‒September 2017 takes into account operating profit of SEK 1 720 million, reversed depreciation of SEK 1 117 million, earnings from the sale of businesses of SEK -5 million, earnings from sales of fixed assets of SEK 6 million, earnings from associated companies SEK 4, decrease in pension liabilities of SEK -25 million, other provisions of SEK -46 million, net of produced and sold electricity certificates and sold emission rights of SEK -27 million and incentive programmes of SEK 10 million.
Full year
SEKm Q3 -18 Q2 -18 Q3 -17 2018 2017 2017
Operating surplus, etc.* 840 559 1 022 2 449 2 754 3 650
Change in working capital, etc. 305 -140 201 82 174 242
Net financial items, taxes, etc. -52 -83 -83 -296 -310 -576
Cash flow from operating activities 1 093 336 1 140 2 235 2 618 3 316
Investments in intangible assets, property, plant and equipment -1 444 -1 527 -1 314 -4 093 -2 739 -4 196
Acquisition of financial assets / contribution associated companies - -6 -29 -16 -63 -65
Disposal of financial assets - 5 - 5 - -
Sale of subsidiary - - - - 15 15
Acquisition of subsidiary - -36 - -36 - -
Disposal of property, plant and equipment 1 1 1 2 2 2
Cash flow from investing activities -1 443 -1 563 -1 342 -4 138 -2 785 -4 244
Change in interest-bearing receivables -3 - -1 -3 -1 -
Change in interest-bearing liabilities 387 1 389 419 2 970 1 300 1 308
Buy-back of own shares - - -41 - -41 -41
Dividend to owners of the parent company - -890 - -890 -891 -891
Dividend to non-controlling interests - - -1 - -1 -1
Cash flow from financing activities 384 499 376 2 077 366 375
Total cash flow (=change in cash and cash equivalents) 34 -728 174 174 199 -553
Cash and cash equivalents at start of period 349 1 068 732 168 708 708
Translation differences in cash and cash equivalents -12 9 -7 29 -8 13
Cash and cash equivalents at the end of the period 371 349 899 371 899 168
Quarter Jan-Sep

20 INTERIM REPORT BILLERUDKORSNÄS AKTIEBOLAG (PUBL) JANUARY–SEPTEMBER 2018
Note 1 Accounting policies The interim report for the Group is prepared in accordance with IAS 34 Interim Financial Reporting and the Swedish Annual Accounts Act. The
accounting policies applied in this interim report are the same as those used in the most recent annual report for 2017, except for IFRS 9 and IFRS 15
which are described below, see pages 84-90 and page 127 for definitions of key figures. The interim report for the parent company is prepared in
accordance with the Swedish Annual Accounts Act. Key figure definitions are provided on page 25 of this report.
In addition to the financial measures defined in IFRS, certain key figures, which qualify as alternative performance measures (APMs) are presented to
reflect the underlying business performance and enhance comparability from period to period. These APMs should not be considered as a substitute for
measures defined under IFRS.
IFRS 9 Financial Instruments
BillerudKorsnäs applies IFRS 9 - Financial Instruments from January 1 2018. The new accounting standard involves changes to how financial assets are
classified and measured, the new classification are presented in Note 2 Financial assets and liabilities. IFRS 9 has also implied that an impairment model
based on expected credit losses is to be introduced instead of losses incurred and changes to hedge accounting policies, in part to simplify and increase
consistency with companies’ internal risk management strategies. The implementation of IFRS 9 has not had any significant effect on BillerudKorsnäs
financial reports.
IFRS 15 Revenue from Contracts with Customers
IFRS 15 Revenue from Contracts with Customers is a comprehensive standard for determining how revenues should be recognised and when such revenues
should be recognised. BillerudKorsnäs applies IFRS 15 from January 1 2018. The new accounting standard has not had any effects in the Group or the
parent company’s earnings or financial position, so a choice of transition method is not applicable.
The performance obligation in a contract mainly consists of providing goods and the revenues from sales of products are recognised when the
performance obligation is fulfilled and control over the product is transferred to the customer. The revenue is recognised at the amount to which
BillerudKorsnäs expects to be entitled in exchange for the transfer of goods.
BillerudKorsnäs have chosen to disclose revenues for larger product groups and the information is presented on page 5-7 where the business areas are
described.
IFRS 16 Leases
This standard will replace IAS 17 Leases, IFRIC 4 Determining Whether an Arrangement Contains a Lease, with application from the financial year starting 1
January 2019. For lessees this means that all contracts that meet the definition in this standard of a lease must be recognised as an asset and liability in the
balance sheet, with recognition of amortisation and interest expense in profit and loss, with a few exceptions. During 2018, BillerudKorsnäs continues to
analyse existing leasing contracts to determine which contracts should be converted by IFRS 16, and is implementing system support for accounting of
lease contracts. No updated assessment has yet been made of the impact of the introduction of this standard in terms of amount.

INTERIM REPORT BILLERUDKORSNÄS AKTIEBOLAG (PUBL) JANUARY–SEPTEMBER 2018 21
Note 2 Financial assets and liabilities
1 Short-term investments are classified as ‘Cash and cash equivalents’ where the duration is less than three months and exposure is only to insignificant risk of fluctuations in value.
Note 3 Other disclosures
Other disclosures in accordance with IAS 34.16A can be found on the pages prior to the income statement and the statement of comprehensive income. Information regarding business areas/segments can be found on pages 5–7, information regarding financing on page 10, seasonal effects on page 12 and events after the end of the quarter on page 14.
Fair value
through profit
or loss
Amortised
cost
Fair value through
other compre-
hensive income
Financial liabilities
measured at
amortised costs
Total
carrying
amount
Fair
value
Valuation classification Level 2 Level 3
Group 30 September 2018
Other shares and participations - - 1 437 - 1 437 1 437
Long-term receivables 188 25 - - 213 213
Accounts receivable - 2 918 - - 2 918 2 918
Other receivables 222 735 - - 957 957
Cash and cash equivalents¹ - 371 - - 371 371
Total 410 4 049 1 437 - 5 896 5 896
Non-current interest-bearing liabilities - - - 6 856 6 856 6 874
Current interest-bearing liabilities - - - 1 275 1 275 1 275
Accounts payables - - - 3 964 3 964 3 964
Other liabilities 225 - - 239 464 464
Total 225 - - 12 334 12 559 12 577
Fair value
through profit
or loss
Amortised
cost
Fair value through
other compre-
hensive income
Financial liabilities
measured at
amortised costs
Total
carrying
amount
Fair
value
Valuation classification Level 2 Level 3
Group 31 December 2017
Other shares and participations - - 1 429 - 1 429 1 429
Long-term receivables - 22 - - 22 22
Accounts receivable - 2 713 - - 2 713 2 713
Other receivables 150 449 - - 599 599
Cash and cash equivalents¹ - 168 - - 168 168
Total 150 3 352 1 429 - 4 931 4 931
Non-current interest-bearing liabilities - - - 3 586 3 586 3 594
Current interest-bearing liabilities - - - 1 551 1 551 1 573
Accounts payables - - - 3 294 3 294 3 294
Other liabilities 115 - - 142 257 257
Total 115 - - 8 573 8 688 8 718
22 INTERIM REPORT BILLERUDKORSNÄS AKTIEBOLAG (PUBL) JANUARY–SEPTEMBER 2018
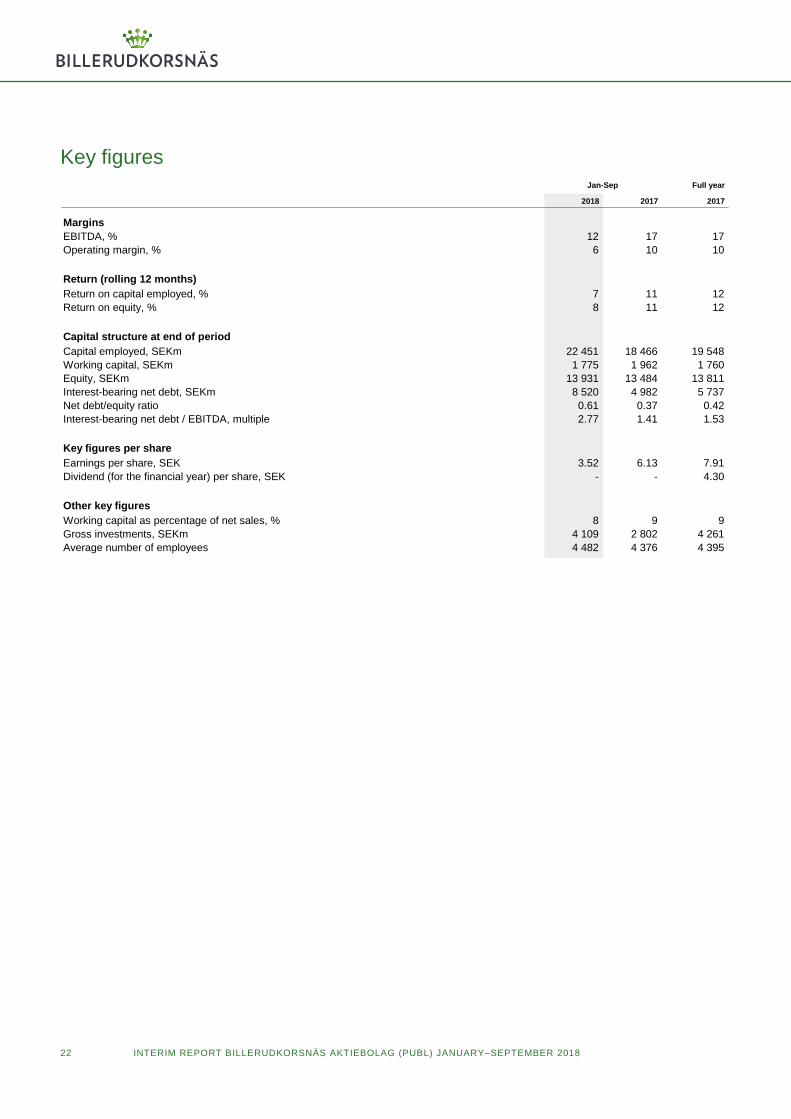
Key figures
Full year
2018 2017 2017
Margins
EBITDA, % 12 17 17
Operating margin, % 6 10 10
Return (rolling 12 months)
Return on capital employed, % 7 11 12
Return on equity, % 8 11 12
Capital structure at end of period
Capital employed, SEKm 22 451 18 466 19 548
Working capital, SEKm 1 775 1 962 1 760
Equity, SEKm 13 931 13 484 13 811
Interest-bearing net debt, SEKm 8 520 4 982 5 737
Net debt/equity ratio 0.61 0.37 0.42
Interest-bearing net debt / EBITDA, multiple 2.77 1.41 1.53
Key figures per share
Earnings per share, SEK 3.52 6.13 7.91
Dividend (for the financial year) per share, SEK - - 4.30
Other key figures
Working capital as percentage of net sales, % 8 9 9
Gross investments, SEKm 4 109 2 802 4 261
Average number of employees 4 482 4 376 4 395
Jan-Sep
INTERIM REPORT BILLERUDKORSNÄS AKTIEBOLAG (PUBL) JANUARY–SEPTEMBER 2018 23
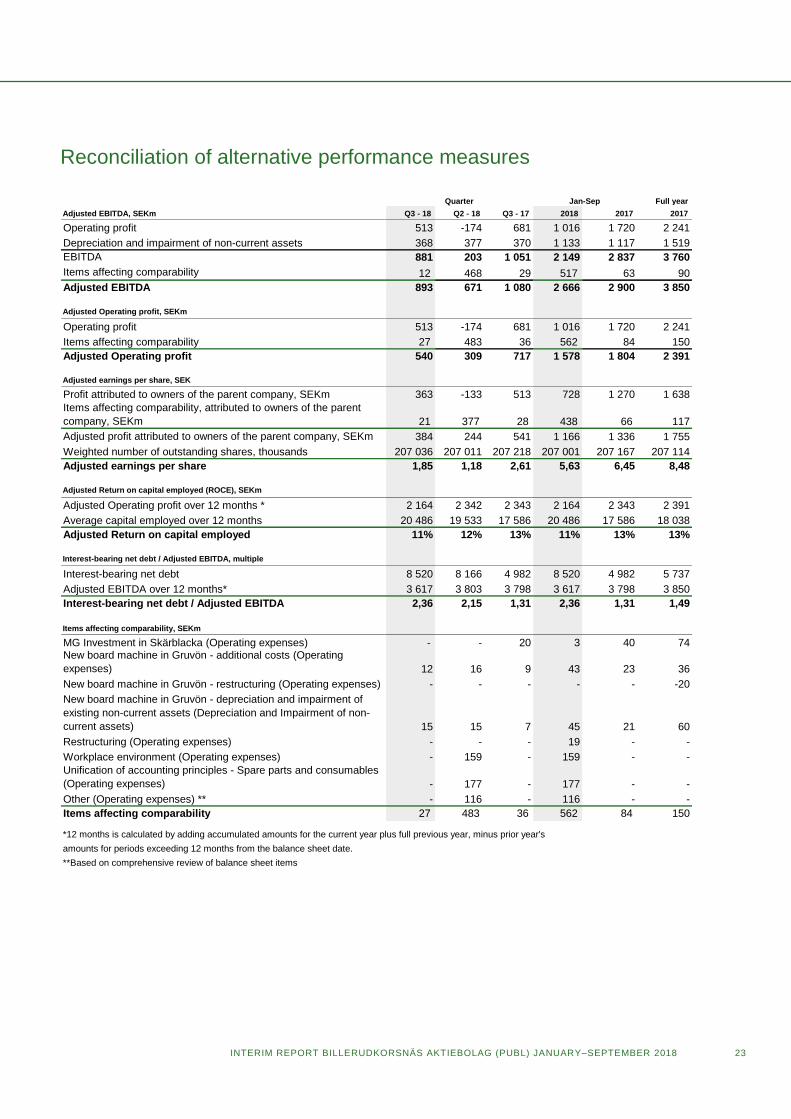
Reconciliation of alternative performance measures
Full year
Adjusted EBITDA, SEKm Q3 - 18 Q2 - 18 Q3 - 17 2018 2017 2017
Operating profit 513 -174 681 1 016 1 720 2 241
Depreciation and impairment of non-current assets 368 377 370 1 133 1 117 1 519
EBITDA 881 203 1 051 2 149 2 837 3 760
Items affecting comparability 12 468 29 517 63 90
Adjusted EBITDA 893 671 1 080 2 666 2 900 3 850
Adjusted Operating profit, SEKm
Operating profit 513 -174 681 1 016 1 720 2 241
Items affecting comparability 27 483 36 562 84 150
Adjusted Operating profit 540 309 717 1 578 1 804 2 391
Adjusted earnings per share, SEK
Profit attributed to owners of the parent company, SEKm 363 -133 513 728 1 270 1 638
Items affecting comparability, attributed to owners of the parent
company, SEKm 21 377 28 438 66 117
Adjusted profit attributed to owners of the parent company, SEKm 384 244 541 1 166 1 336 1 755
Weighted number of outstanding shares, thousands 207 036 207 011 207 218 207 001 207 167 207 114
Adjusted earnings per share 1,85 1,18 2,61 5,63 6,45 8,48
Adjusted Return on capital employed (ROCE), SEKm
Adjusted Operating profit over 12 months * 2 164 2 342 2 343 2 164 2 343 2 391
Average capital employed over 12 months 20 486 19 533 17 586 20 486 17 586 18 038
Adjusted Return on capital employed 11% 12% 13% 11% 13% 13%
Interest-bearing net debt / Adjusted EBITDA, multiple
Interest-bearing net debt 8 520 8 166 4 982 8 520 4 982 5 737
Adjusted EBITDA over 12 months* 3 617 3 803 3 798 3 617 3 798 3 850
Interest-bearing net debt / Adjusted EBITDA 2,36 2,15 1,31 2,36 1,31 1,49
Items affecting comparability, SEKm
MG Investment in Skärblacka (Operating expenses) - - 20 3 40 74New board machine in Gruvön - additional costs (Operating
expenses) 12 16 9 43 23 36
New board machine in Gruvön - restructuring (Operating expenses) - - - - - -20
New board machine in Gruvön - depreciation and impairment of
existing non-current assets (Depreciation and Impairment of non-
current assets) 15 15 7 45 21 60
Restructuring (Operating expenses) - - - 19 - -
Workplace environment (Operating expenses) - 159 - 159 - -
Unification of accounting principles - Spare parts and consumables
(Operating expenses) - 177 - 177 - -
Other (Operating expenses) ** - 116 - 116 - -
Items affecting comparability 27 483 36 562 84 150
**Based on comprehensive review of balance sheet items
*12 months is calculated by adding accumulated amounts for the current year plus full previous year, minus prior year's
accumulatedamounts for periods exceeding 12 months from the balance sheet date.
Quarter Jan-Sep
24 INTERIM REPORT BILLERUDKORSNÄS AKTIEBOLAG (PUBL) JANUARY–SEPTEMBER 2018
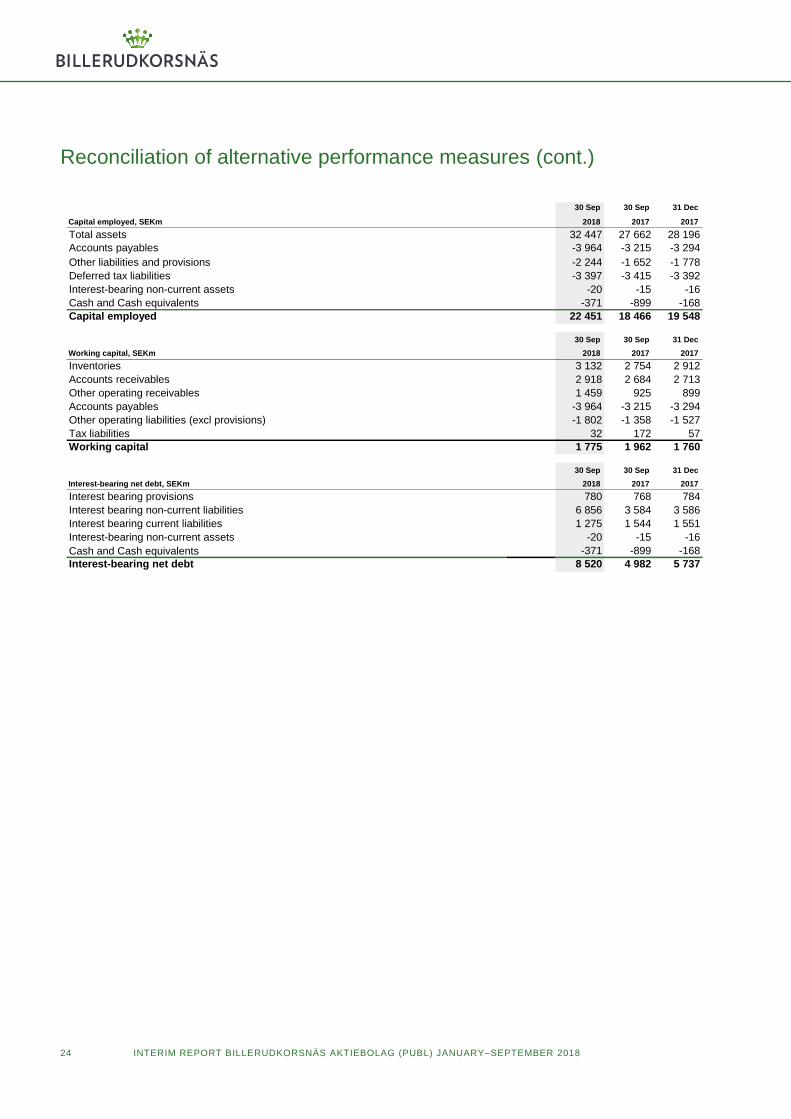
Reconciliation of alternative performance measures (cont.)
30 Sep 30 Sep 31 Dec
Capital employed, SEKm 2018 2017 2017
Total assets 32 447 27 662 28 196
Accounts payables -3 964 -3 215 -3 294
Other liabilities and provisions -2 244 -1 652 -1 778
Deferred tax liabilities -3 397 -3 415 -3 392
Interest-bearing non-current assets -20 -15 -16
Cash and Cash equivalents -371 -899 -168
Capital employed 22 451 18 466 19 548
30 Sep 30 Sep 31 Dec
Working capital, SEKm 2018 2017 2017
Inventories 3 132 2 754 2 912
Accounts receivables 2 918 2 684 2 713
Other operating receivables 1 459 925 899
Accounts payables -3 964 -3 215 -3 294
Other operating liabilities (excl provisions) -1 802 -1 358 -1 527
Tax liabilities 32 172 57
Working capital 1 775 1 962 1 760
30 Sep 30 Sep 31 Dec
Interest-bearing net debt, SEKm 2018 2017 2017
Interest bearing provisions 780 768 784
Interest bearing non-current liabilities 6 856 3 584 3 586
Interest bearing current liabilities 1 275 1 544 1 551
Interest-bearing non-current assets -20 -15 -16
Cash and Cash equivalents -371 -899 -168
Interest-bearing net debt 8 520 4 982 5 737

INTERIM REPORT BILLERUDKORSNÄS AKTIEBOLAG (PUBL) JANUARY–SEPTEMBER 2018 25
Definitions
ADJUSTED KEY FIGURES
Adjusted key figures on EBITDA, Operating
profit, Return on capital employed and
Earnings per share provide a better
understanding of the underlying business
performance and enhance comparability from
period to period, when the effect of items
affecting comparability are adjusted for. Items
affecting comparability include additional
project costs for major projects, as well as
significant earnings effects from acquisition
and disposals.
ADJUSTED EBITDA
Operating profit before depreciation and
amortisation adjusted for items affecting
comparability.
ADJUSTED EARNINGS PER SHARE
Earnings per share adjusted for items
affecting comparability after tax attributable
to owners of the parent company.
ADJUSTED OPERATING PROFIT
Operating profit adjusted for items affecting
comparability.
CAPITAL EMPLOYED
Total assets less non-interest bearing
liabilities, non-interest bearing provisions and
interest-bearing assets. The measure is used to
quantify the net total assets used in the
operating business, and is used as a
component in measuring operating
profitability.
EARNINGS PER SHARE
Profit for the period, attributable to owners of
the parent, divided by the average number of
shares in the market.
EQUITY
Equity at the end of the period.
EBITDA
Operating profit before depreciation and
amortisation (EBITDA = Earnings before
Interest, Taxes, Depreciation and
Amortisation). EBITDA is a measure of
operating performance. It is a profit measure
that is close to the operating cash flow.
EBITDA, %
Operating profit before depreciation
(EBITDA = Earnings before Interest, Taxes,
Depreciation and Amortisation) as a
percentage of net sales. The measure is used
in business review as well as for
benchmarking with peer companies.
INTEREST-BEARING NET DEBT
Interest-bearing provisions and liabilities less
interest-bearing assets. The measure is used to
quantify the debt financing, taken the amount
of financial assets into account. The measure
is used as a component in measuring financial
risk.
INTEREST-BEARING NET DEBT/ EBITDA
Interest bearing net debt at the end of the
period divided by EBITDA for the last twelve
months. The measure shows the size of the
interest-bearing net debt compared to the
repayment capacity. A higher (lower) ratio
indicates a higher (lower) risk.
INTEREST-BEARING NET DEBT/ADJUSTED EBITDA
Interest bearing net debt at the end of the
period divided by EBITDA for the last twelve
months adjusted for items affecting
comparability.
MF KRAFT PAPER
Machine Finished kraft paper.
MG KRAFT PAPER
Machine Glazed kraft paper.
NBSK
Northern Bleached Softwood Kraft.
NET DEBT/EQUITY RATIO
Interest-bearing net debt divided by equity.
The ratio shows the mix between interest-
bearing net debt and equity financing. A
higher ratio means higher financial leverage
and may have positive effects on return on
equity, but imply a higher financial risk.
OPERATING CASH FLOW
Cash flow from operating activities including
net investments in property, plant and
equipment, intangible assets and acquisition of
financial assets. The measure shows cash flow
generated in the operating business, which
provides the amount of cash flows available
to repay debt and pay dividends to the
shareholders.
OPERATING MARGIN
Operating profit as a percentage of net sales.
Operating margin shows the percentage of
revenue remaining as operating profit after
deducting all operating expenses. The measure
is used in business review as well as for
benchmarking with peer companies.
RETURN ON CAPITAL EMPLOYED (ROCE)
Operating profit calculated over 12 months as
a percentage of average capital employed
calculated per quarter. The return on capital
employed is a measure that shows how
effectively total net operating assets are used
in order to generate return in the operating
business. The measure takes capital invested
in the operating activities into account and is
used in business review and benchmarking
with peer companies.
RETURN ON EQUITY
Profit calculated over 12 months, attributable
to owners of the parent company, as a
percentage of average shareholders’ equity
calculated per quarter, attributable to owners
of the parent company. The measure
represents total profitability compared to the
equity invested by the parent company’s
shareholders.
WORKING CAPITAL
Inventories, accounts receivables and other
operating receivables less accounts payables
and other operating liabilities. The measure
shows the amount of current net assets that is
tied up in the business. Together with non-
current assets, working capital constitutes the
operating capital employed to generate
operating returns.
WORKING CAPITAL AS PERCENTAGE OF NET SALES
Average working capital for the last three
months, divided by annual net sales at year
end or annualised net sales during interim-
quarter (net sales for the quarter multiplied by
four). Working capital in relation to net sales
shows how effectively the working capital is
used. A lower percentage means less capital is
tied up to generate a given amount of
revenue, and an increased ability to internally
finance growth and return to shareholders.

26 INTERIM REPORT BILLERUDKORSNÄS AKTIEBOLAG (PUBL) JANUARY–SEPTEMBER 2018
Parent company Summarised income statement
Summarised balance sheet
Full Year
SEKm Q3 -18 Q3 -17 2018 2017 2017
Operating income* -8 115 165 282 402
Operating expenses -154 -111 -449 -377 -523
Operating profit/loss -162 4 -284 -95 -121
Financial income and expenses -13 25 -162 -64 -123
Profit/Loss after financial income and expenses -175 29 -446 -159 -244
Appropriations - - - - 2 635
Profit/loss before tax -175 29 -446 -159 2 391
Taxes 41 7 89 50 -511
Net profit/loss for the period -134 36 -357 -109 1 880
Quarter Jan-Sep
30 Sep 30 Sep 31 Dec
SEKm 2018 2017 2017
Non-current assets 10 743 10 744 10 748
Current assets 10 105 7 030 10 358
Total assets 20 848 17 774 21 106
Shareholders' equity 7 011 6 262 8 251
Untaxed reserves 1 586 1 031 1 586
Provisions 259 199 208
Liabilities 11 992 10 282 11 061
Total equity and liabilities 20 848 17 774 21 106
*Includes Currency hedging, etc.

INTERIM REPORT BILLERUDKORSNÄS AKTIEBOLAG (PUBL) JANUARY–SEPTEMBER 2018 27
Quarterly data The Group’s business is managed and reported according to BillerudKorsnäs’ three business areas. Other include results from wood supply, Nine AB
(until Q4-17), Scandfibre Logistics AB, rental operations, dormant companies, result of sale of businesses, items affecting comparability and costs due to
larger investments in the production structure. Other also include group-wide functions, Group eliminations and profit/loss from participation in
associated companies. Currency hedging etc. includes results from hedging of the Group’s net currency flows and revaluation of trade receivables and
payments from customers. The part of the currency exposure that relates to changes in exchange rates for invoicing is included in the business area's
profit/loss.
Net sales quarterly per business area and for the Group
EBITDA quarterly per business area and for the Group
EBITDA1 quarterly per business area and for the Group
EBITDA-margin1 quarterly per business area and for the Group
Sales volumes quarterly per business area and for the Group
1 EBITDA and margin are adjusted for the effects of periodical maintenance shutdowns and for items affecting comparability.
SEKm Q3 -18 Q2 -18 Q1 -18 Q4 -17 Q3 -17 Q2 -17 Q1 -17 Q4 -16
Jan-Sep
2018
Jan-Sep
2017
Packaging Paper 2 424 2 292 2 276 2 147 2 090 2 151 2 141 2 067 6 992 6 382
Consumer Board 2 145 2 132 2 164 1 943 2 019 2 099 2 128 1 988 6 441 6 246
Corrugated Solutions 1 135 1 002 953 1 011 1 012 902 931 989 3 090 2 845
Other 447 510 502 437 422 483 465 463 1 459 1 370
Currency hedging, etc. -97 -38 2 27 1 -35 -29 -39 -133 -63
Total Group 6 054 5 898 5 897 5 565 5 544 5 600 5 636 5 468 17 849 16 780
SEKm Q3 -18 Q2 -18 Q1 -18 Q4 -17 Q3 -17 Q2 -17 Q1 -17 Q4 -16
Jan-Sep
2018
Jan-Sep
2017
Packaging Paper 472 317 467 401 394 312 392 421 1 256 1 098
Consumer Board 278 322 473 363 466 498 440 336 1 073 1 404
Corrugated Solutions 266 120 210 212 269 163 190 241 596 622
Other -37 -517 -87 -78 -80 -75 -70 -267 -641 -225
Currency hedging, etc. -98 -39 2 25 2 -35 -29 -38 -135 -62
Total Group 881 203 1 065 923 1 051 863 923 693 2 149 2 837
SEKm Q3 -18 Q2 -18 Q1 -18 Q4 -17 Q3 -17 Q2 -17 Q1 -17 Q4 -16
Jan-Sep
2018
Jan-Sep
2017
Packaging Paper 531 534 467 428 469 482 420 421 1 532 1 371
Consumer Board 412 347 473 478 596 506 446 471 1 232 1 548
Corrugated Solutions 281 279 210 212 284 212 231 241 770 727
Other -25 -49 -50 -53 -56 -56 -55 -62 -124 -167
Currency hedging, etc. -98 -39 2 25 2 -35 -29 -38 -135 -62
Total Group 1 101 1 072 1 102 1 090 1 295 1 109 1 013 1 033 3 275 3 417
Costs for maint. shutdowns -208 -401 - -140 -215 -227 -75 -135 -609 -517
Items affecting comparability -12 -468 -37 -27 -29 -19 -15 -205 -517 -63
EBITDA 881 203 1 065 923 1 051 863 923 693 2 149 2 837
% Q3 -18 Q2 -18 Q1 -18 Q4 -17 Q3 -17 Q2 -17 Q1 -17 Q4 -16
Jan-Sep
2018
Jan-Sep
2017
Packaging Paper 22 23 21 20 22 22 20 20 22 21
Consumer Board 19 16 22 25 30 24 21 24 19 25
Corrugated Solutions 25 28 22 21 28 24 25 24 25 26
Group 18 18 19 20 23 20 18 19 18 20
ktonne Q3 -18 Q2 -18 Q1 -18 Q4 -17 Q3 -17 Q2 -17 Q1 -17 Q4 -16
Jan-Sep
2018
Jan-Sep
2017
Packaging Paper 269 257 278 282 289 288 293 285 804 870
Consumer Board 274 275 281 252 265 279 285 257 830 829
Corrugated Solutions 132 112 127 132 145 121 144 147 371 410
Total Group 675 644 686 666 699 688 722 689 2 005 2 109

This is BillerudKorsnäs BillerudKorsnäs is one of the world’s leading suppliers of high-
quality, packaging materials based on renewable raw material. Our
wood raw material comes from sustainable managed forests and
manufacturing takes place at resource-efficient, integrated production
units.
Our customers are packaging manufacturers, brand owners and large retail and supermarket
chains. Through close collaboration with customers and partners all over the world, we are
able to offer a customised and broad product portfolio that features a high degree of
innovation.
Demand is driven by global megatrends, particularly rising urbanisation, a greater focus
on sustainability and changing consumption patterns. Consumer segments, primarily food
and beverages, account for 76% of sales. While Europe is the core market, BillerudKorsnäs
is gradually strengthening its presence in the leading growth markets of Asia.
Smart packaging solutions using paper or board from BillerudKorsnäs reduce the impact
on the climate, cut the use of resources along the whole value chain and contribute to a
sustainable future.
BUSINESS MODEL
Our business model is based on high-performance materials from forests in the north, advice, service and the collective
knowledge held by a global network of machine suppliers, packaging manufacturers, researchers and design agencies.
Innovative packaging solutions are developed in close collaboration with customers all over the world that demand the
highest standards of quality, performance and sustainability.
STRATEGIC FOCUS
BillerudKorsnäs’ overall objective is sustainable and profitable growth. The target is to grow by 3–4% a year. Our
strategy is based on five areas that all interact: Position, Innovation, Sustainability, Efficiency and Employees. Find
out more at billerudkorsnas.com
VALUE DRIVERS
High-performance materials based on renewable raw material from responsibly managed forests. Smarter solutions that
optimise our customers’ business. Leading positions in the growing global packaging market. A holistic approach to the
entire packaging value chain from raw material all the way to the end-customer and recycling.
BillerudKorsnäs Aktiebolag (publ) • Postal address: Box 703, SE-169 27 Solna, Sweden • Visitors’ address: Frösundaleden 2b
Company reg. no. 556025-5001 • Tel +46 8 553 335 00 • [email protected]
www.billerudkorsnas.com