January, May 2003 The next generation iSeries … this time, our intent is to expand iSeries...
158
IBM eServerJ iSeriesJ © 2000-2003 IBM Corporation GP02 V5R2 Performance Update Part 2: Performance Management The next generation iSeries... simplicity in an on demand world January, May 2003
Transcript of January, May 2003 The next generation iSeries … this time, our intent is to expand iSeries...

IBM eServerJ iSeriesJ
© 2000-2003 IBM Corporation
GP02 V5R2 Performance Update Part 2:Performance ManagementThe next generation iSeries...simplicity in an on demand world
January, May 2003

IBM eServer iSeries
© 2000-2003 IBM Corporation
AgendaPerformance Update (Part 1)
HardwareDatabase EnhancementsHTTP web servingIntegrated xSeries Server File BackupMiscellaneous Enhancements
Performance Management (Part 2)Management Central monitors and Graph HistoryPerformance Tools for iSeriesBMC software, inc. Patrol for iSeries - PredictWorkload Estimator, PM eServer iSeriesMiscellaneous performance tools
For latest performance information, refer to http://www.ibm.com/eserver/iseries/perfmgmt

IBM eServer iSeries
© 2000-2003 IBM Corporation
Notes: AgendaThe Performance Update is separated into two parts:
Performance Update (facts, test results, tips, and so forth)Management (various performance measurement , sizing, and capacity planning tools)
Note that in January 2003 PM/400 was renamed PM eServer iSeries.

IBM eServer iSeries
© 2000-2003 IBM Corporation
Performance Management Topics Work with System Status - from iSeries Navigator
New Monitors
Collection Services
Performance Tools for iSeries
PM eServer iSeries (PM/400)
Workload Estimator
Performance explorer
BMC Software, Inc Patrol for iSeries - Predict
iDoctor for iSeries

IBM eServer iSeries
© 2000-2003 IBM Corporation
WRKSYSSTSAdded to iSeries NavigatorAccess related system values

IBM eServer iSeries
© 2000-2003 IBM Corporation
Notes: WRKSYSSTSSupport for core work management functions is provided in iSeries Navigator V5R2M0. While not all work management functions are supported at this time, our intent is to expand iSeries Navigator support for work management functions in future releases. V5R2 provides the support needed for a typical system operator to control and manage the work on the system. For this release, you can take advantage of iSeries Navigator to complete typical daily operational tasks. Our intent is to provide support for work management setup and configuration in future releases.
Use the System Status pages to view different status values such as the number of jobs and processors, the amount of memory on a system, and the amount of disk space on a system. You can also access areas on your iSeries system where system storage and jobs system values can be changed.
What can I do with System Status?
Check system statusMonitor system status using Management Central View processor statusView the amount of memory on a systemView disk (storage) space on a systemView the percent of addresses used on a system
IBM eServer iSeries
© 2000-2003 IBM Corporation
Jobs
Memory Pools
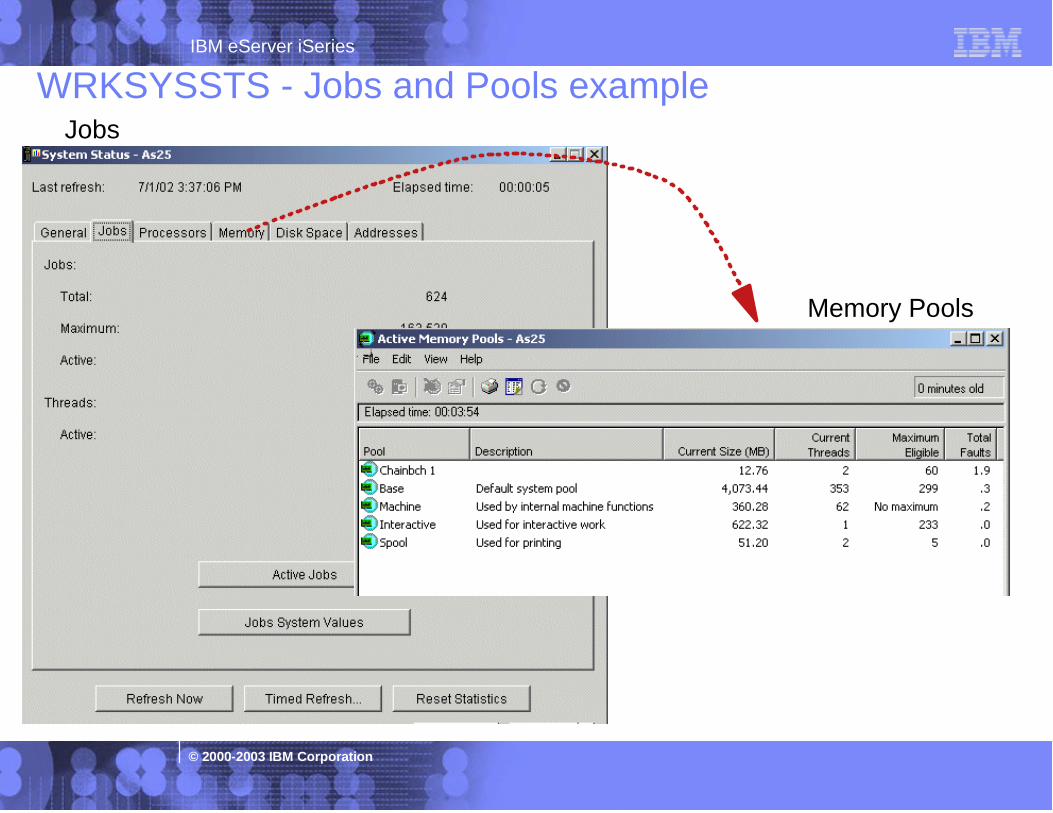
WRKSYSSTS - Jobs and Pools example

IBM eServer iSeries
© 2000-2003 IBM Corporation
Notes: WRKSYSSTS - Jobs and Pools exampleshowing all active storage pools on the system.
If you selected the Active Jobs button you would see information that includes, the number of currently active jobs on the systems, the "maximum active jobs allowed on the system, and other information.
If you selected the Jobs System Values you can see (and change certain values) job-related system values, such as those related to inactive jobs (inactive time out, disconnect job actions, maximum number of active jobs allowed, active job storage allocation values and more.
For memory pools you see first a summary set of information on a window not shown. In this example you see pool information that includes pool size, total page faults per second, and the current number of active threads in each pools, along with the "maximum activity level" value for that pool.

IBM eServer iSeries
© 2000-2003 IBM Corporation
New monitorsSystem monitor enhancements
File monitorB2B activity monitor

IBM eServer iSeries
© 2000-2003 IBM Corporation
Notes: New monitorsManagement Central provides monitors for checking on your system performance, your jobs and servers, your message queues, changes to selected files, and B2B transaction activity.
V5R1 introduced the Message and Job Monitors and the Graph History functions. Graph History is a powerful aid in reviewing historically several performance metrics whose statistics can be saved for longer than 1 year. We have a Graph History foil later in this presentation as a reminder of what you can do with this function.
Starting in V5R1 both the System Monitor support and Collection Services shared the same implementation so you can perform view Graph History data for any time periods you ran Collection Services or a System Monitor.
You can use a system monitor to see detailed graphs that monitor the real-time performance of multiple iSeries servers.
In the Graph History window, you can see a graphical view of the metrics that have been collected for an extended period of time by Collection Services. You can contrast this data with the real-time data for the last hour shown in a system monitor window.
You can monitor your jobs and servers with a job monitor. For example, you might want to monitor a job's CPU usage, job status, or job log messages.
You can create a message monitor to take action on a list of messages that are important to you. For example, when the message monitor detects CPI0953 (threshold of a disk pool is exceeded), you could specify to run a command that would delete objects that you no longer need from the disk pool.
You can use a new with V5R2 file monitor to monitor for specified text strings or for a specified size. Or, you can monitor for any modification to one or more selected files. You can monitor files across multiple endpoint systems.
You can use a B2B activity monitor to view a graph of active transactions over time, and you can run commands automatically when thresholds are triggered. You can search for and display a specific transaction as well as view a bar graph of the detailed steps of that specific transaction.
We discuss the enhancements to the system monitors and the new file monitor and the new B2B-monitor on the following pages.

IBM eServer iSeries
© 2000-2003 IBM Corporation
System Monitor EnhancementsPoint-to-Point Protocol information included
Several metrics were added to the CPU utilization properties File systemsStream filesJournal operations, and counter sets.
Auto-restart of monitors at system startup

IBM eServer iSeries
© 2000-2003 IBM Corporation
Notes: System Monitor EnhancementsThe system monitor metrics now include information associated with the Point-to-Point Protocol. Several metrics were added to the CPU utilization properties. These new metrics relate to file systems, stream files, journal operations, and counter sets.
Additional function has been provided to auto-restart monitors at system startup.

IBM eServer iSeries
© 2000-2003 IBM Corporation
V5R2 Details
System Monitor - V5R2 job details example
IBM eServer iSeries
© 2000-2003 IBM Corporation
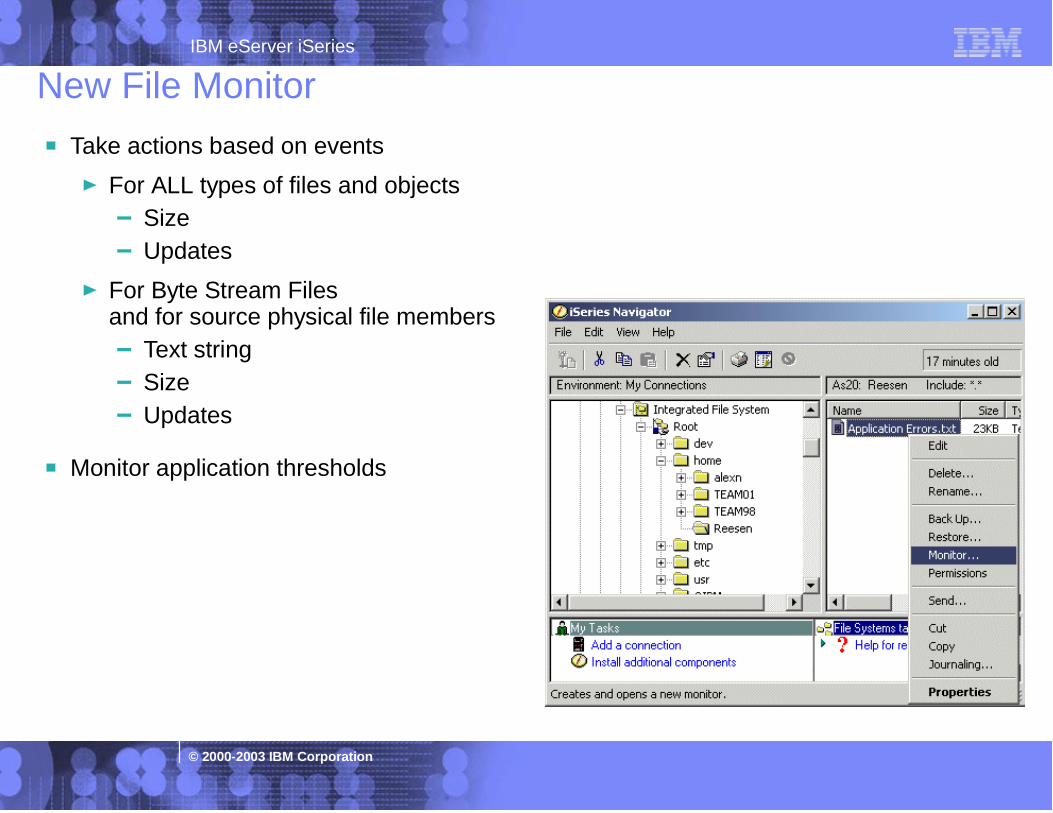
New File MonitorTake actions based on events
For ALL types of files and objectsSizeUpdates
For Byte Stream Filesand for source physical file members
Text stringSizeUpdates
Monitor application thresholds

IBM eServer iSeries
© 2000-2003 IBM Corporation
Notes: New File MonitorYou can use a file monitor to monitor all system logs (the QHST log), or you can select a set of specific files to monitor. You can monitor for a specified size or for specified text strings. Or, you can select to trigger an event whenever a specified file has changed.
For example, you might want to monitor all problem logs across multiple servers. Or you might want to monitor a database file to see if it has changed or if its size has exceeded a particular limit. Some log files may cause the server to shut down when they get too large. You can monitor the size of the file and run a command to split up the file or clear it when it reaches a certain size.
Monitoring for a text string added to the file with the file monitor's text metric will only work on byte stream files and source physical file members. The Text metric does not work on database files. The other File Monitor metrics (Size and Status) will work for ALL types of files and objects.
The new file monitor with V5R2 does NOT support "threshold parameters" available to the threshold trigger command as there are for system, job, and message monitors. For example, send a message that could identify the file, time of trigger, and so forth. This support maybe added in a future release.
Application thresholds
You could use the new file monitor to monitor for entries or thresholds in application log files. Good understanding of the application would be required.

IBM eServer iSeries
© 2000-2003 IBM Corporation
New File MonitorMonitor application messages and thresholds

IBM eServer iSeries
© 2000-2003 IBM Corporation
Notes: New File MonitorYou can create file monitors to notify you about specific changes to a file. You can choose to monitor all system logs, or you can select a set of specific files to monitor. You can monitor for specified text strings or for a specified size. Or, you can select to trigger an event whenever a specified file is modified in any way. You can choose to be notified or to run commands when important thresholds have been reached.
If you are the owner of the monitor, you can change which metrics are being collected by a monitor and the values for the thresholds that are being monitored for each metric. You can change the name, description, files to monitor, systems and groups, sharing value, collection interval, and actions that occur whenever a threshold is triggered or reset.
You can change the properties of any monitor whether it is started or stopped. If you change the properties of a monitor while it is stopped, the changes take effect immediately. If you change the properties while the monitor is running, the changes take effect immediately, although changes to the selected files or to the selected metrics are not reflected in the data until the next collection interval. The data collected by the monitor is always based on the properties that were in effect when the collection interval started.
You can monitor a specified file and run a command to clear the file whenever it reaches a specified size.
You can monitor a specified file and ask to be notified whenever any change has been made to the file.
You can monitor all problem logs across multiple servers.
You can use a file monitor to monitor for a specific text string in the problem logs, and you can even select to log one or more lines of text that appear before and after the specified string when it is found. You can see the text string and any additional logged lines when you open the file monitor.
You can monitor the problem logs for a specified size or you can select to trigger an event whenever one of the problem logs has changed.
When you are using a file monitor to monitor for a text string that may have different meanings depending on the context in which it appears, you may select to log one or more lines of text that appear before and after the specified string when it is found. The text string and any additional logged lines are shown when you view the trigger event.
When you are using a file monitor to monitor for a text string that may have different meanings depending on the context in which it appears, you may select to log one or more lines of text that appear before and after the specified string when it is found. You can see the text string and any additional logged lines when you open the file monitor.
IBM eServer iSeries
© 2000-2003 IBM Corporation
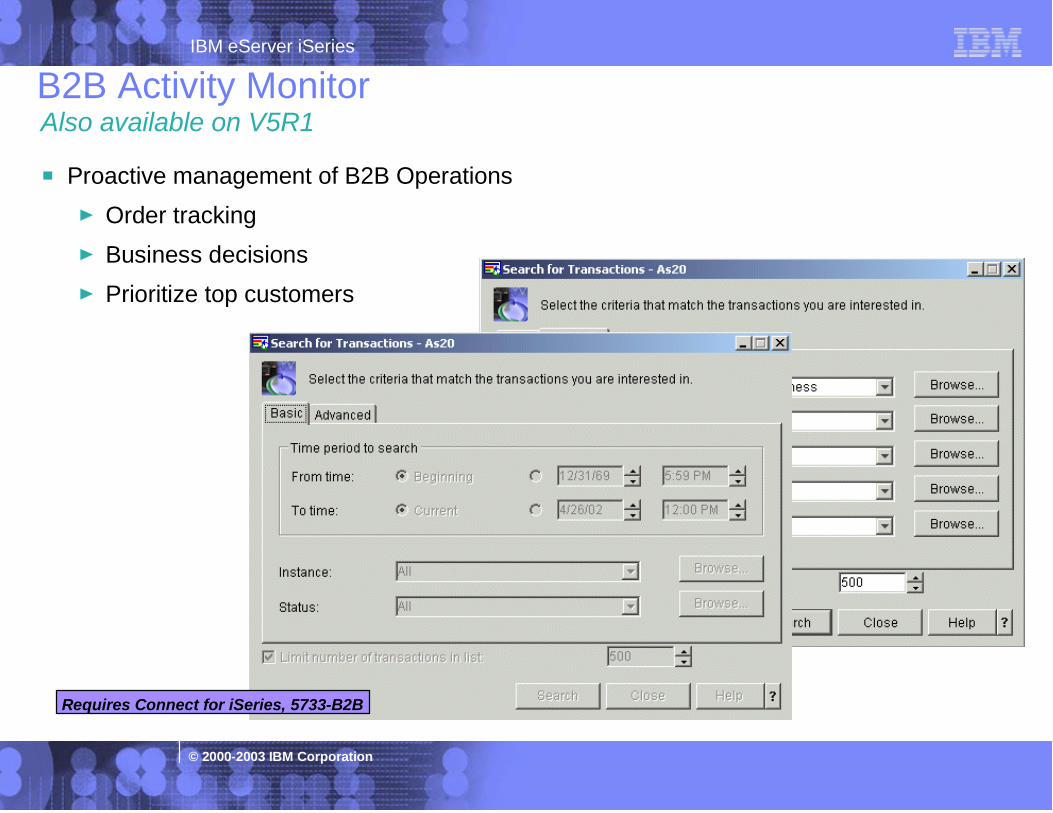
B2B Activity MonitorAlso available on V5R1
Proactive management of B2B OperationsOrder trackingBusiness decisionsPrioritize top customers
Requires Connect for iSeries, 5733-B2B

IBM eServer iSeries
© 2000-2003 IBM Corporation
Notes: B2B Activity MonitorIn V5R2 transaction management capability has been added for B2B transactions.
This allows the customer to track their B2B transactions across multiple iSeries systems in their network to determine the # of transactions, if a transaction is taking too long, is waiting on an action, or is in another status. The customer is also able to monitor their B2B environment and tell at a glance if everything is going okay. Automated actions can be triggered when there is a problem.
Thus, the new B2B activity monitor is an activity monitor that allows you to view transaction data with detailed information on the specified consolidated system and to automatically run OS/400 commands to control the overall transaction count or the duration of a transaction.
For a B2B activity monitor, available metrics include active transaction count and active transaction duration.
A transaction is a specific instance of the electronic buying, selling, or exchanging of products or information. It is a single business-to-business request for a specific product or information.
For example: If you are a wholesale supplier of pencils, and you send out an electronic request to another supplier for 200 pencils, that request is considered a transaction. Each specific transaction is made up of multiple steps, and these steps are different for each kind of transaction. You can use the activity monitor to view a graph and monitor the status of this transaction, (the request for 200 pencils), to determine if the transaction is active or complete. You can also view a bar graph of the detailed steps of each specific transaction. The graph displays transactions collected from data that you have logged to the specified consolidated endpoint system.
A consolidated system is an endpoint system that contains logged transaction data. Because B2B activity can take place across many different systems, it is necessary to consolidate all B2B data on one endpoint system: the consolidated system. To view transactions with a B2B activity monitor, you must first configure another application to log transaction data to a specified endpoint system.
For example: You might configure Connect for iSeries so that a record of all transactions processed with this application, both active and complete, is stored on a specified endpoint system. You can now specify this endpoint system as your consolidated system when setting up a new B2B activity monitor, and you can monitor the logged transaction data stored on the specified consolidated system.
Note: You cannot edit the consolidated system field from the activity monitor properties; a consolidated system can only be created by adding an endpoint system in Management Central. Once you have added an endpoint system, make sure that you have configured an application like Connect for iSeries to log transaction data to that specified endpoint system.
This new B2B activity monitor became available for V5R1 with Client Access Express Service Pack SI02795 (February 2002). For additional information, see: http://www-1.ibm.com/servers/eserver/iseries/btob/connect/activitymonitorannounce.html

IBM eServer iSeries
© 2000-2003 IBM Corporation
B2B Activity Monitor
IBM eServer iSeries
© 2000-2003 IBM Corporation
Notes: B2B Activity MonitorIf you have an application like Connect for iSeries, 5733-B2B configured, you can use a B2B activity monitor to monitor your B2B transactions. You can view a graph of active transactions over time, and you can run commands automatically when thresholds are triggered. You can search for and display a specific transaction as well as view a bar graph of the detailed steps of that specific transaction.
You can use a B2B activity monitor to view a graph of active transactions over specified intervals of time. A graph displays transaction data that has been logged to a user-specified endpoint system called a consolidated system. The graph provides a real-time display of activity so that problems can be identified and corrected. You can set up thresholds to trigger, and you can specify OS/400 commands for automated handling of triggered events. You can search for and display transaction data with basic and advanced searches, and view a bar graph of the detailed steps of each specific transaction.
This chart shows a sample B2B Activity Monitor which collects data applications such as Connect for iSeries. With this new monitors, problem detection, analysis and avoidance can be enhanced through the following capabilities of this tool:
Graphical view of the active request count over time (updated in real-time) Drill-down to the details for each request Graphical view of the step execution (order and duration) of any request Automatic notification/action when the quantity of active requests exceeds a user specified limit Automatic notification/action when any request is active longer than a user specified limit Search, sort and export capabilities

IBM eServer iSeries
© 2000-2003 IBM Corporation
Review "collected performance summary data"
Collection services or system monitor collected data
Graph (detailed) metrics
Summary metrics
V5R1 Graph History Review

IBM eServer iSeries
© 2000-2003 IBM Corporation
Notes: V5R1 Graph History ReviewGraph History became available in V5R1 - when both the System Monitor support and Collection Services support shared the same implementation. This enables you to historically review detailed graphs (shows job information) and summary graphs (no job information) over long periods of time to see if there is any thing you should look into.
Note, the starting Collection Services functions iSeries Navigator interface has the parameters for specifying how long to keep the detailed graph and summary graph information. To specify longer than 6 days for retaining detailed graph history data, PM/400 must be installed and active on your system. Note that base, no charge PM/400 functions come with OS/400 V5R1. So you do not need to register for one of its additional cost reporting services to merely start PM/400 on your iSeries system.
The V5R1 detailed performance presentation contains more complete information on all of Graph History support and user interface capabilities.
In this example we show how to view Graph History data on system AS80. Right clicking Collection Services is one of the ways to enable you to select the Graph History function. In the right window we have already selected the total system CPU utilization metric to be displayed from June 24, 2002 through July 1, 2002.
You specify how long to keep detailed history data (contains active jobs information) and summary data on the Start Collection Services window.
In the next foil we have used the "Graph bar handle" to zoom into the time span June 24 - June 26.
Note: The gaps in the line graph indicate there was no "collection services" active for those time periods.
IBM eServer iSeries
© 2000-2003 IBM Corporation
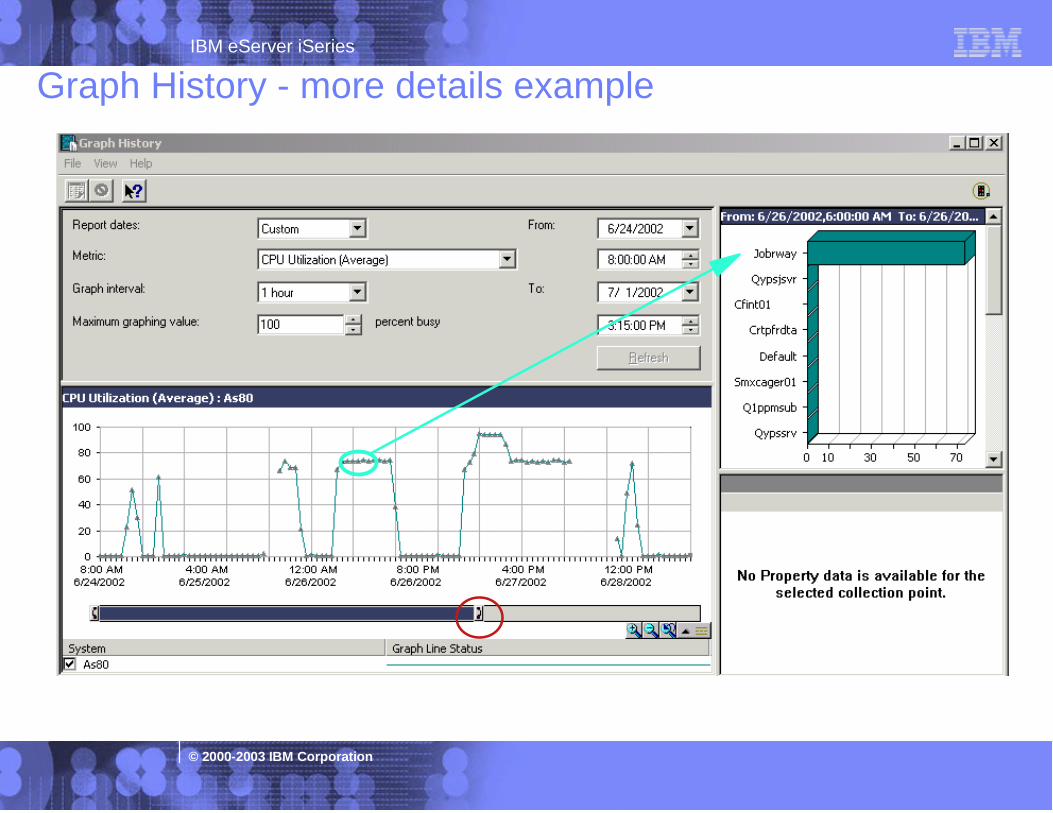
Graph History - more details example

IBM eServer iSeries
© 2000-2003 IBM Corporation
Notes: Graph History - more details example In this window we have expanded the Graph History time period to show detailed "points" (triangle icon) in the period between June 24 and June 28. We left clicked one of the triangle icon for the time period starting at June 26, 6:00 AM. to get the "top 20 jobs" consuming the CPU utilization metric. In this example, we see job Jobrway was consuming over 70 percent of total CPU utilization.
Depending on your working environment this may be normal or indicate additional investigation is required.

IBM eServer iSeries
© 2000-2003 IBM Corporation
Starts automatically at IPL
New V5R2 Metrics:User-defined categories HTTP (HTTP Server Powered by Apache only) statisticsDomino R6 statistics
User-defined transactions
Performance database files
Collection Services

IBM eServer iSeries
© 2000-2003 IBM Corporation
The iSeries Navigator interface for starting Collection Services has several parameters that are not addressed in this V5R2 Update presentations.. More details on Collection Services can be found at several places, including:
Information CenterRedbooks:
Managing OS/400 with Operations Navigator V5R1 Volume 1: Overview and More, SG24-6226Managing OS/400 with Operations Navigator V5R1 Volume 5: Performance Management, SG24-6565
V5R1 Technical Overview, Performance Update presentation
Note, the starting of Collection Services functions iSeries Navigator interface has the parameters for specifying how long to keep detailed performance data, and detailed graph and summary graph information. To specify longer than 6 days for retaining detailed graph history data, PM/400e must be installed and active on your system. Note that base, no charge PM/400 functions come with OS/400 V5R1. So you do not need to register for one of its additional cost reporting services to merely start PM/400 on your iSeries system.
Notes: Collection Services

IBM eServer iSeries
© 2000-2003 IBM Corporation
Measure user applicationsAdd User CategoriesExamples
Domino R6iSeries HTTP server
(powered by Apache)See Infocenter for example and QAPMcccc file field definitions
User Defined Categories
New

IBM eServer iSeries
© 2000-2003 IBM Corporation
Notes: User Defined CategoriesPrior to V5R2, all performance collection categories were predefined, and all data collection programs were shipped with the system. Beginning in V5R2, you can define your own performance collection categories. The user-defined performance collection categories allow you to:
Add new performance collection categories to the collector. The Register Collector Data Category (QypsRegCollectorDataCategory) adds a user-defined data category to one or more collector definitions of the Collection Services function of Management Central.
Provide a data collection program for the new category to collect the data Stores data that is collected for the category in a management collection object Schedule and run data collection for the category in the same way as for system-defined categories Access data that is collected for the new category in a management collection object with the Management Collection Object APIs.
Domino and HTTP server (powered by Apache) utilize this new feature to integrate their performance data into Collection Services. As shown, the Standard plus protocol profile (the default used by Collection Services) automatically collects User-defined transaction, HTTP server powered by Apache, and Domino statistics if Collection Services detects these application servers are active on the system. As with all Collection Services "collection object data," the new statistics are placed into the following files via the currently available Operations Navigator (iSeries Navigator in V5R2) "create performance database files" function or the OS/400 Create Performance Data (CRTPFRDTA) command:
QAPMDOMINO QAPMHTTPB QAPMHTTPD
We refer you to V5R2 Information Center for details on the contents of these files and associated data fields, though the next foil does summarize the fields of QAPMDOMINO.
The V5R2 Performance Tools for iSeries, 5722-PT1, has new sections in the System and Component Reports for HTTP statistics. See the Performance Tools for iSeries section later in this presentation.
At the time of general V5R2 availability, 5722-PT1 does not use any of the QAPMDOMINO data. It is the responsibility of a person with Domino performance expertise to write the appropriate queries against this file to provide statistics for performance analysis.
For an example on how to create a user application category, see Customizing data collections in the iSeries Information Center.

IBM eServer iSeries
© 2000-2003 IBM Corporation
QAPMDOMINO Fields SummaryStandard Collection Services fields: Interval time information, server job name, and associated subsystem
Domino Database and Pool buffer and cache statistics
Logical disk information
Peak number of users information
Document operation statistics (create, open, edit, ....)
Domino request counts and related statistics
Domino session statistics (bytes sent and received, sessions started and ended per port used by Domino)
Write your own queries
Use APIs to retrieve corresponding Domino statistics
IBM eServer iSeries
© 2000-2003 IBM Corporation
Notes: QAPMDOMINO Fields SummaryWith Domino 6 and OS/400 V5R2, a new performance statistics capability becomes available as part of iSeries Collection Services (which can run continuously and store broad statistics about your iSeries performance. New in V5R2 is the ability for Domino 6 to store Domino statistics within this system repository - the collection object that can be accessed from iSeries Navigator and the Create Performance Data function. These Domino statistics are included with all the other Collection Services metrics and QAPMcccc "performance database files." As with all these metrics, you can specify, through the Start Collection Services window, how long to keep - "permanent" or summary data.
This new Domino data can be "created into" the QAPMcccc performance database files. With queries you can cross reference this data (stored in the QAPMDOMINO file) with other Collection Services data such as CPU utilization, disk I/O counts, disk arm busy, and more.
This new with OS/400 V5R2 and Domino R6 performance data is a subset of the complete set of Domino statistics, as shown by the 'show stat' function on the Domino console. The compete set of performance data is also available programmatically through new APIs in V5R2.
Documentation on how to use this data can be found in Domino R6 notes, at http://www.lotus.com/ldd/notes6
The next few foils show the QAPMDOMINO fields.

IBM eServer iSeries
© 2000-2003 IBM Corporation
Field Name DescriptionITMNUM Interval number: the nth sample database interval based on the start
time specified in the CRTPFRDTA command.DTETIM Interval date (yymmdd) and time (hhmmss): The date and time of the
sample interval.INTSEC Elapsed interval seconds: The number of seconds since the last
sample interval.DTECEN Century digit: where 0 indicates 19XX and 1 indicates 20XX.
DMSUBS Server Subsystem
DMJNAM Server Job name
DMJUSR Server job user
DMJNBR Server job number
DMSRVN Server Name (first 25 characters if the name is longer than this field)
DMSSDT Server start date time (yyyymmddhhmmss):
DMDBPM Database.BufferPool.Maximum.Megabytes: The configured maximum size for database control pools that may be used.
DMDBPP Database.BufferPool.Peak.Megabytes:Maximum amount of the buffer pool that has been used by Domino over the life of the server.
DMDBPR Database.Database.BufferPool.PerCentReadsInBuffer: Percentage of database reads present in buffer pool
DMDBCH Database.DbCache.Hits: Number of hits to the database cache
DMDBCL Database.DbCache.Lookups: Number of lookups to the database cache
DMNLCH Database.NAMELookupCacheHits: Number of cache hits when doing name lookups in the server’s name and address book.
QAPMDOMINO Fields - details 1 of 4

IBM eServer iSeries
© 2000-2003 IBM Corporation
Field Name Description
DMNLCL Database.NAMELookupCacheLookups: Number of lookups in the server’s name and address book.
DMASPN Platform.LogicalDisk.1.AuxStoragePool: The number of the Auxiliary Storage Pool that includes the Domino data directory.
DMASPU Platform.LogicalDisk.1.PctUsed: Percent of total disk space used in the ASP that includes the Domino data directory.
DMASPB Platform.LogicalDisk.1.PctUtil: Percent of time the drives are busy reading or writing in the ASP that includes the Domino data directory.
DMTRNS Server.Trans.Total: Number of transactions DMUSRO Server.Users: Number of users with open sessions on the server.
(this is the current value at time data was sampled)DMUSRP Server.Users.Peak: Peak number of concurrent users since server
was started. DMUSRT Server.Users.Peak.Time: Time that last peak users occurred
(YYYYMMDDHHMMSS). DMMLCP Mail.TotalPending: Number of outbound mail messages in this
server's MAIL.BOX waiting to be processed by the Domino Router job. Mail will be pending until the Router job wakes up and moves outgoing mail from MAIL.BOX to the destination mail servers. If a mail server cannot be contacted, the message will remain pending in the mail box. This is the value at the time data was sampled.
DMMLWR Mail.WaitingRecipients: Number of inbound mail messages in this server's MAIL.BOX waiting to be processed by the Domino Router job. Mail will be waiting until the Router job wakes up and moves incoming mail from MAIL.BOX into user mail files. This is the current value at the time the data was sampled.
DMMLBX Mail.Delivered: Combined number of inbound and outbound mail messages placed into this server's MAIL.BOX.
DMCMCD Domino.Command.CreateDocument: Count of 'CreateDocument' URLs that have come into the server
QAPMDOMINO Fields - details 2 of 4

IBM eServer iSeries
© 2000-2003 IBM Corporation
Field Name Description
DMCMDD Domino.Command.DeleteDocument: Count of 'DeleteDocument' URLs that have come into the server
DMCMED Domino.Command.EditDocument: Count of 'EditDocument' URLs that have come into the server
DMCMOA Domino.Command.OpenAgent: Count of 'OpenAgent' URLs that have come into the server
DMCMOB Domino.Command.OpenDatabase: Count of 'OpenDatabase' URLs that have come into the server
DMCMOD Domino.Command.OpenDocument: Count of 'OpenDocument' URLs that have come into the server
DMCMOF Domino.Command.OpenForm: Count of 'OpenForm' URLs that have come into the server
DMCMOI Domino.Command.OpenImageResource: Count of 'OpenImageResource' URLs that have come into the server
DMCMOV Domino.Command.OpenView: Count of 'OpenView' URLs that have come into the server .
DMCMSD Domino.Command.SaveDocument: Count of 'SaveDocument' URLs that have come into the server
DMCMTU Domino.Command.Total: Count of all URLs that have come into the server
QAPMDOMINO Fields - details 3 of 4

IBM eServer iSeries
© 2000-2003 IBM Corporation
Field Name Description
DMRQ1M Domino.Requests.Per1Minute.Total: Total requests over the past minute. Value as recorded at sample time.
DMNPT1 NET.*.Port 1: Domino port ( 1 of 4) for which data is being reported
DMNBR1 NET.*.BytesReceived 1: Number of network bytes received for this port
DMNBS1 NET.*.BytesSent 1: Number of network bytes sent for this port
DMNSI1 NET.*.SessionsEstablished.Incoming 1: Number of Incoming sessions established for this port
DMNSO1 NET.*.SessionsEstablished.Outgoing 1: Number of Outgoing sessions established for this port.
DMN* Note: the above 5 fields are repeated for ports 2, 3, and 4
QAPMDOMINO Fields - details 4 of 4

IBM eServer iSeries
© 2000-2003 IBM Corporation
User Defined TransactionsDefine your own transactions
Use Collection Services to collect the performance data
Controlled by the user Transaction category in Collection Services
Instrument your application onceCollection Services and Performance Explorer use the same API calls to gather different types of performance data.
Start transaction: QYPESTRTEnd transaction: QYPEENDTLog transaction: QYPELOGT (Used only by performance explorer) Add trace point: QYPEADDT (Used only by performance explorer)
You can find C++ and Java examples in the iSeries Information Center

IBM eServer iSeries
© 2000-2003 IBM Corporation
Notes: User Defined TransactionsYou can define your own transactions and use Collection Services to collect the performance data on an interval basis. By defining your own transaction, you can collect data based on your particular application rather than collecting transaction data which is traditionally defined by IBM.
The API defines the fields for which data can be collected. For more information about what data is collected, see the QAPMUSRTNS performance database file in the iSeries Information Center.
To define your transactions, use the Start Transaction (QYPESTRT,qypeStartTransaction) API and End Transaction (QYPEENDT,qypeEndTransaction) API in your application.
Data collection is controlled by the User Transaction category that is available in Collection Services. For more information about these APIs, see the Start Transaction API and the End Transaction API in the iSeries Information Center.
Collection Services and performance explorer can now collect performance data that you define in your applications.
With the provided APIs, you can integrate transaction data into the regularly scheduled sample data collections using Collection Services, and get trace-level data about your transaction by running performance explorer.
For detailed descriptions and usage notes, refer to the following API descriptions:Start transaction: QYPESTRT, qypeStartTransaction End transaction: QYPEENDT, qypeEndTransaction Log transaction: QYPELOGT, qypeLogTransaction (Used only by performance explorer) Add trace point: QYPEADDT, qypeAddTracePoint (Used only by performance explorer)
Note: You only need to instrument your application once. Collection Services and Performance Explorer use the same API calls to gather different types of performance data.
In the iSeries Information Center you can find examples on how to integrating user-defined transaction data into Collection Services and Collecting trace information for user-defined transactions with the OS/400 Performance Explorer commands.

IBM eServer iSeries
© 2000-2003 IBM Corporation
Performance Database FilesAll the database files are now interactive
Sort the text in the columns alphabeticallySearch for specific words in the tableWith the exception of QAPMAPPN
New QAPMHTTPB (basic), QAPMHTTPD (detailed), and QAPMDOMINO files
Several new QAPMcccc files and fields within previously available QAPMcccc files
Conversion when upgrading to a new releaseContinue to convert with the CVTPFRDTA commandYou can use the new automatic data collection supportIf you do not convert, Collection Services is started and you create database files automatically
Then a library for the prior release files is created, performance database files are moved to that libraryThis preserves the existing data files from the previous release level
Visit the iSeries Information Center for all the new and changed database files

IBM eServer iSeries
© 2000-2003 IBM Corporation
Notes: Performance Database FilesAll the database files, with the exception of QAPMAPPN, are now interactive, which means that you can sort the text in the columns alphabetically and you can search for specific words in the table. The following table shows the new and changed database files. For more information and field level details, please refer to the iSeries Information Center.
Database file Description
QAPMJOBWT New file that contains data for job, task, and thread wait conditions.
QAPMJOBWTD New file that contains a description of the counter sets found in file QAPMJOBWT.
QAPMHTTPB New file that contains the basic data for IBM HTTP Server (powered by Apache).
QAPMHTTPD New file that contains detailed data for IBM HTTP Server (powered by Apache).
QAPMDOMINO New file that contains data for Domino for iSeries.
QAPMPPP New file that contains data for the Point-to-Point Protocol.
QAPMUSRTNS New file that contains data for user-defined transactions.
QAPMSYSTEM New fields that support file system counters and journal counters.
QAPMSYS New field that provides a way to determine the difference between the system clocks on different partitions of a single system.
QAPMECL New field that reports the number of discarded frames from unsupported protocols.
QAPMETH New field that reports the number of discarded frames from unsupported protocols.
QAPMCONF New record keys.
QAPMIOPD New fields that support I/O adapter data.
QAPMMIOP New fields that support processing time.
QAPMJOBMI New fields that support file system counters and journal counters.
QAPMDISK New and changed fields that support independent ASP-related changes.
QAPMJOBOS New fields that support file system counters.
You have several choices as to how to handle your performance data when upgrading to a new release. You can continue to convert the data in your collection library with the Convert Performance Data (CVTPFRDTA) command. You can use the new automatic data collection support. If you do not convert your performance database files, and if Collection Services is started and you specified the option to create database files automatically, a performance library for the prior release files is created. The performance database files are moved to that library. This action allows new files to be created and preserves the existing data files from the previous release level. Finally, if you do not convert your performance database files and do not run Collection Services, you can delete the QAPMxxxx files with the Delete File (DLTF) command (DLTF library/QAPM*).
IBM eServer iSeries
© 2000-2003 IBM Corporation
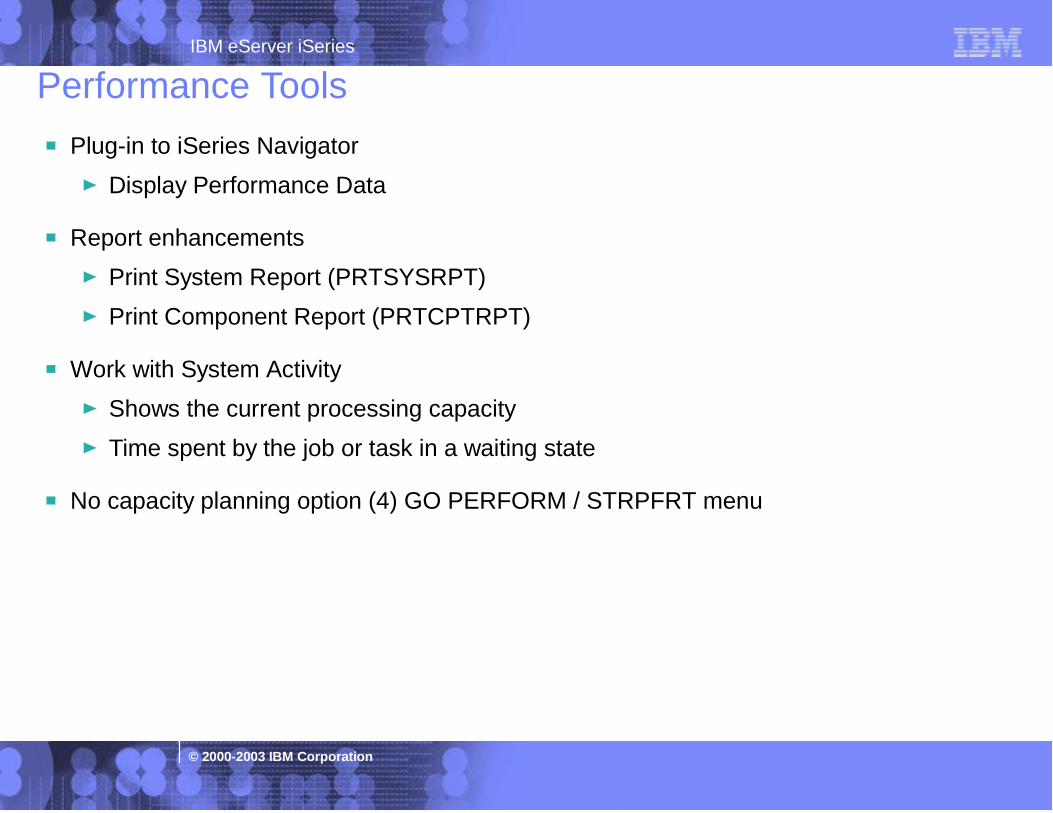
Performance ToolsPlug-in to iSeries Navigator
Display Performance Data
Report enhancementsPrint System Report (PRTSYSRPT)Print Component Report (PRTCPTRPT)
Work with System ActivityShows the current processing capacityTime spent by the job or task in a waiting state
No capacity planning option (4) GO PERFORM / STRPFRT menu

IBM eServer iSeries
© 2000-2003 IBM Corporation
Similar to the Display Performance Data (DSPPFRDTA) command - but uses graphical displays!
Plug-in to iSeries Navigator

IBM eServer iSeries
© 2000-2003 IBM Corporation
Notes: Plug-in to iSeries NavigatorThe function associated with the Display Performance Data (DSPPFRDTA) command is now available from iSeries Navigator as the Performance Tools plug-in. The interface provides function that is nearly equivalent to the DSPPFRDTA command. It allows you to generate and view a subset of the Performance Tools licensed program reports.
Note: Performance Tools (5722-PT1) manager feature must be installed.

IBM eServer iSeries
© 2000-2003 IBM Corporation
Display Performance DataNearly equivalent to the DSPPFRDTA command capabilities - with a graphical view of performance information
Summarize data into reports
Analyze your system performanceLook at details using the mouse, control key
Uses performance database filesIF: using active collection and you specified create performance database filesTHEN: You can update view at collection interval time period

IBM eServer iSeries
© 2000-2003 IBM Corporation
Notes: Display Performance DataStarting with V5R2, the Performance Tools for iSeries, 5722-PT1, provides graphical display of performance data contained in the performance database files (QAPMcccc) used by the various V5R2 5722-PT1 reports (such as the System and Component reports) and the 5250 workstation-based functions available with the Display Performance Data (DSPPFRDTA) command . This new graphical representation enables you to more quickly (compared to reviewing the printed performance tools reports) identify exceptionally high or low resource utilizations and compare several different performance metrics to each other during the same collection time period.
This graphics support displays line graphs for the following performance metrics:(5250) Transaction Count(5250) TransactionTotal CPU UtilizationInteractive CPU UtilizationBatch CPU UtilizationHigh Disk Utilization (identifies busiest disk arm and it utilization (per cent busy)Machine Pool Faults per SecondUser Pool Faults per SecondTotal Exception CPU Utilization
You can also view the active jobs and microcode tasks during the collection period on one side of the window with the line graphs shown on the other side of the window. You can sequence the jobs and tasks being displayed according to specific columns of information.
You select the QAPMcccc performance database files member name whose data you wish to graph. You can select the performance data member generated from already "cycled" collections or the from the performance member associated with the currently active collection. This member exists for the currently active collection object only if you specified "Create database files during collection" when you started the active collection.
From the graphical window you can print the System, Component, Job, Pool, and Resources report and view the associated spool file (AFP viewer used). You cannot print the graphic image using this iSeries Navigator interface.
The next foils show more details on what can be graphed and ways to control different views of the graphed data.

IBM eServer iSeries
© 2000-2003 IBM Corporation
Display Performance Data - selecting membersSelect collection services object or select all performance data on the system
Displays associated member name of QAPMcccc files

IBM eServer iSeries
© 2000-2003 IBM Corporation
Notes: Display Performance Data - selecting membershis foil shows how to choose the graphical display of collected performance data.
On the right pane, we have already opened (double clicked) the Collection Services folder to show all available performance data collection objects on the system. Note the various library names shown - Qmpgdata, V51pfrdta8. Actually the associated collection object Q281090912 was created on a V5R1 system (As80). We used Management Central Package support to restore this object onto As25.
Right clicking one of these collection objects and selecting Performance Tools -> Performance Data, you get the Performance Data window (next foil). That window lists all the performance database file member names created (if any) from this collection object.
Alternatively, as shown in the left pane, you can right click the Collection Services folder and directly select Performance Tools -> Performance Data. The Performance Data window shown will include all the performance database file member names on the entire system.

IBM eServer iSeries
© 2000-2003 IBM Corporation
Display Performance Data - selecting a specific member
Displays available members (QAPMcccc files) Display, Convert, Delete QAPMcccc filesRefresh a "currently active" collection object

IBM eServer iSeries
© 2000-2003 IBM Corporation
Notes: Specific Performance Database File MembersThis window shows all the existing performance database file "members" on the system. You must scroll right to see all the information for each member (we used 2 screens, the lower screen represents the scroll to the right data. Column information includes member name, member library, associated collection object, origin system, release level, and file level. Levels 18-22 require no conversion.
After selecting a member item you can:Display (show the performance data graphically)Convert to a file level 22, if necessaryDelete the member (in each of the QAPMcccc performance database files)
Note the origin system, release level (V4R5, V5R1, and V5R2) and file level values in our example. Graphing V5R1 (unconverted) and V5R2 performance data is supported.
For a currently active V5R2 collection object, you can graphically display its "current" performance data member information provided you have specified "create performance files during collection". The supported QAPMcccc database files with this member name contains performance data from the start of the collection until the most recent collection time interval specified when starting that collection. The examples used in the following foils used a 5 minute interval.
Remember you could have created more than one "member" for the same collection object. For example one member could be from the start and end of "cycle" times of the collection object and another member for a shorter time period within the limits of the collection objects start and end cycle time stamps. For example, one of your members is for 2:00 pm through 05:00 pm, which is your typical busy time.
When using a currently active collection object, you must come back to this window and do a Refresh when you want to extend the ending time of graph data you are already viewing - to include a later time interval. For example, at the time you selected a member on this window, the associated QAPMccc files contained data up to 8:45:00 AM. You have viewed graphs of various performance metrics up through 8:45:00 AM. You then want to view graphs of performance data up through 09:15 am. You must use the Refresh button on this window to be able to "see" that new data.

IBM eServer iSeries
© 2000-2003 IBM Corporation
Notes: Specific Performance Database File Members -2Notes:
You can print a report (such as the System Report) while viewing a graphic display, the report includes the start and stop times of the performance database files. Any changed start and stop times shown graphically do not affect the printed report start and end times.
In addition to the Delete performance member function from this Display Performance Data graphics window you can delete the associated QAPMccc member FILES using:
Use the Start Collection Services window "Detail Data" parameter (delete after nn hours or yy days)Use the PM/400 (GO PM400 menu) Work with PM/400 Customization 5250 interface Performance data purge" parameterUse the Performance Tools for iSeries Configuration and manage 5250 interface.

IBM eServer iSeries
© 2000-2003 IBM Corporation
Display Performance Data - Graphs, Data View Options

IBM eServer iSeries
© 2000-2003 IBM Corporation
Notes: Display Perf. Data - Graphs, Data View OptionsBy default the entire list of supported performance metrics have been selected to be graphed. You use the middle scroll up/down bar to view the different line graph supported. You can select Graphs from the menu bar and deselect or select the metrics graphed.
Also by default the right pane displays all active jobs and LIC tasks active during the time period. You can select alternative "View" options as shown in the pull down menu overlaid in the right details pane.
Your selection of graphs to be displayed is remembered across iSeries Navigator sessions.
All points on a graph are selected by default, and the Details and Summary panes display information based on the selected time interval.
By default, the default time period graphed is the entire time period previously specified for the specific member selected.
In the window area just under the toolbar you can modify beginning and end of the time interval to be graphed, within the limits of the performance database file member's start and end times.
If you had previously selected a currently active collection object, you cannot specify an end time past the last time interval shown on the previous window. To extend the end time you must go back to the previous Performance Data window and do a Refresh.
In the All Jobs view option selected, by default, the jobs and tasks are shown in descending order of CPU utilization.
You can click various column headings to reorder the list of information shown. You also can use the left mouse button to drag a column heading to the right or left to reorder the left to right sequence of column information.
Note the area at the bottom of this window, which contains summary information for the time interval being displayed.

IBM eServer iSeries
© 2000-2003 IBM Corporation
Display Perf. Data - Graphs: Time Changes Example

IBM eServer iSeries
© 2000-2003 IBM Corporation
Notes: Display Perf. Data - Graphs: Time ChangesIn this example we have specified different beginning and ending times to show only the time period where work was actually being done. We have also changed to show the total CPU utilization and interactive job CPU utilization data graphically.
Selecting a specific point on the graph with your mouse updates the information being displayed in both the Details pane and the Summary pane, and causes the selected point to turn black. To select multiple points, you can hold down the Ctrl key while selecting points, or you can hold down the left mouse button while moving the mouse across the time intervals. To select all points again, just click the Update button.

IBM eServer iSeries
© 2000-2003 IBM Corporation
Display Perf. Data - Graphs: Time Intervals Example

IBM eServer iSeries
© 2000-2003 IBM Corporation
Notes: Display Perf. Data - Graphs: Time Intervals In this foil we have changed from viewing by All Jobs to viewing by Time Interval. This example is a nice way to easily see some performance metrics that may need some further investigating.
In this example, note that the total CPU utilization increases and decreases along with Interactive (5250 jobs) utilization . In this example, there is no problem indicated.
Note the time interval information in the right pane. Time intervals 8:45 AM and 8:50 AM has 204 and 142 second average response times when CPU utilizations were quite reasonable.
further investigation would include scrolling through the other graphs to note any other "abnormal" resource utilizations, such as high disk arm (busy) utilizations.

IBM eServer iSeries
© 2000-2003 IBM Corporation
Using Performance Graphs with Graph History, ...Performance Graphs views detailed performance metrics based upon the associated collection object and performance database files. Can show more details more quickly than other OS/400 "performance tools"
Graphed metrics can be "near real time" when using an active collection object. No threshold automated actions can be specified.
Graph History is intended for viewing performance metrics from a historical perspective - over several months or years.
When selecting an active collection object, the "end time" viewed can be "near real time, but the start/beginning time can before the start time of any selected collection object. Thresholds can be "applied," but no threshold automated actions can be specifiedPer Start Collection Services can see detailed job information
System monitor monitors specific metrics real time and can specify automated threshold actions. Up to most recent 60 minutes can be viewed.
Can show job details real time

IBM eServer iSeries
© 2000-2003 IBM Corporation
System Report EnhancementsPrint System Report (PRTSYSRPT)
The Communications Summary now includes the Point-to-Point Protocol (PPP) informationA new section was added that shows information about transactions processed by HTTP Server jobsMore detail about non-interactive server jobs
Supports V5R1 and V5R2 performance database files

IBM eServer iSeries
© 2000-2003 IBM Corporation
Notes: System Report EnhancementsThe Print System Report (PRTSYSRPT) output has been updated to reflect several enhancements, which include the following:
The Communications Summary now includes the Point-to-Point Protocol (PPP) information. The PPP protocol is also shown in the Communications Detail section of the Resource Report. The Display Performance Data (DSPPFRDTA) command also shows Point-to-Point Protocol information from the Display Communications Line Detail display. A new section was added that shows information about transactions processed by HTTP Server jobs. This information is presented for each interval with a summary and average line at the bottom of the report. New categories were included in the Workload, Resource Utilization, and Resource Utilization Expansion sections to show more detail about non-interactive server jobs.
Notes for V5R2:You can use the STRPFRT menu to print the 5722-PT1 reportsYou can use the PRTSYSRPT , PRTCPTRPT, PRTJOBRPT, PRTPOLRPT, PRTRSCRPT, etc. commandsYou can, as shown on this foil, use the new Performance Tools Display Performance Data iSeries Navigator built-in to print the reports listed on this foil. When using the iSeries Navigator, you can use the AFP Viewer to view the spooled output.

IBM eServer iSeries
© 2000-2003 IBM Corporation
Non-Interactive WorkloadJob Number Logical DB ------ Printer --------- Communications CPU Per LogicalType Of Jobs I/O Count Lines Pages I/O Count Logical I/O I/O /Second
---------- ------- ------------- ------------- ----------- -------------- ----------- ---------Batch 61 4,125,978 7 1 0 .0004 2,292.2HTTP 5 0 0 0 0 .0000 .0DOMINO 14 28 0 0 0 3.4523 .0COLLECTION 1 49 0 0 0 .0100 .0DIRSRV 4 14 0 0 0 .7041 .0SQL 8 11,694 0 0 0 .0004 6.4SMTP 2 0 0 0 0 .0000 .0MGMTCENTRAL 3 6,847 0 0 0 .0056 3.8OS400 3 0 0 0 0 .0000 .0NETSERVER 1 0 0 0 0 .0000 .0Total 118 4,144,610 7 1 0Average .0008 2,302.5
Average CPU Utilization . . . . . . . . . . . .: 29.6CPU 1 Utilization . . . . . . . . . . . . . . .: 24.3CPU 2 Utilization . . . . . . . . . . . . . . .: 29.3CPU 3 Utilization . . . . . . . . . . . . . . .: 31.8CPU 4 Utilization . . . . . . . . . . . . . . .: 33.3Total CPU Utilization (Interactive Feature) . .: 3.2Total CPU Utilization (Database Capability) . .: 20.4
System Report: Non-interactive Workload
Note: Starting January 2003 the word "interactive" should be specifically recognized as meaning jobs/threads doing I/O to 5250 (emulators, 3270 emulators).

IBM eServer iSeries
© 2000-2003 IBM Corporation
Notes: System Report: Non-interactive WorkloadStarting with V5R2 various System Report sections include a more granular grouping of non-interactive job statistics.
In this example you can see resources utilized by several groups of functions, including:HTTP serversCollection ServicesSQL serversManagement Central functionsOS/400NetServerand more....

IBM eServer iSeries
© 2000-2003 IBM Corporation
Notes: System Report: Non-interactive Workload 2One way to validate these new groupings of "server work" in this report is to run a query over the Collections Services QAPMcccc database file
QAPMJOBL. We grouped together job records associated with the Management Central category as indicated in field JBSVRT:
Task
Job Server Job Job Task type Job
name type type subtype type extender flagQYPSGETINV QIBM_MGMTCENTRAL_AGENT B 03 RP <<<<<<<<
QYPSJSVR QIBM_MGMTCENTRAL B 03 RP
QYPSSRV QIBM_MGMTCENTRAL B 03 RP

IBM eServer iSeries
© 2000-2003 IBM Corporation
Tns Active ------------------------------ Disk I/O Per Second -----------------------------Job CPU /Hour Jobs Per Total ----------- Synchronous ----------- ----------- Asynchronous ---------Type Util Rate Interval I/O DBR DBW NDBR NDBW DBR DBW NDBR NDBW-------- ---- --------- -------- --------- -------- -------- -------- -------- -------- -------- -------- -------PassThru 3.5 162 1 .8 .0 .0 .1 .0 .5 .0 .0 .Batch 22.9 2 30 151.9 3.3 7.3 1.1 9.1 55.3 75.2 .0 .HTTP .0 0 0 .1 .0 .0 .1 .0 .0 .0 .0 .DOMINO 1.3 0 0 1.3 .0 .0 .3 .7 .0 .0 .0 .COLLECTION .0 0 0 .2 .0 .1 .0 .0 .0 .1 .0 .DIRSRV .1 0 0 15.1 .0 .0 .2 11.8 .0 .0 .0 3.SQL .0 0 0 3.3 .6 .4 .5 .5 .0 .5 .0SMTP .0 0 0 .0 .0 .0 .0 .0 .0 .0 .0 .TELNET .0 0 0 .0 .0 .0 .0 .0 .0 .0 .0 .MGMTCENTRAL .5 0 0 3.6 .1 .0 2.2 .5 .0 .1 .0 .OS400 .0 0 0 .0 .0 .0 .0 .0 .0 .0 .0 .NETSERVER .0 0 0 .0 .0 .0 .0 .0 .0 .0 .0 .
Average 28.6 164 31 176.8 4.1 7.9 4.8 22.9 56.0 76.1 .0 4.
System Report: Resource Utilization

IBM eServer iSeries
© 2000-2003 IBM Corporation
Non-Interactive Resource Utilization Expansion--------------------------------------------- Average Per Second -------------------------------------------------------------------- Physical Disk I/O -------------------------- -------- Logical --------- -Communications-
Job ----------- Synchronous ----------- ---------- Asynchronous ----------- ----- Data Base I/O ------ I/OType DBR DBW NDBR NDBW DBR DBW NDBR NDBW Read Write Other Get Put
----------- -------- -------- -------- -------- -------- -------- -------- -------- -------- -------- -------- ----- -----Batch 3.3 7.3 1.1 9.1 55.3 75.2 .0 .3 975.5 341.2 975.3 .0 .0HTTP .0 .0 .1 .0 .0 .0 .0 .0 .0 .0 .0 .0 .0DOMINO .0 .0 .3 .7 .0 .0 .0 .1 .0 .0 .0 .0 .0COLLECTION .0 .1 .0 .0 .0 .1 .0 .0 .0 .0 .0 .0 .0DIRSRV .0 .0 .2 11.8 .0 .0 .0 3.1 .0 .0 .0 .0 .0SQL .6 .4 .5 .5 .0 .5 .0 .4 .0 .8 5.5 .0 .0SMTP .0 .0 .0 .0 .0 .0 .0 .0 .0 .0 .0 .0 .0TELNET .0 .0 .0 .0 .0 .0 .0 .0 .0 .0 .0 .0 .0MGMTCENTRAL .1 .0 2.2 .5 .0 .1 .0 .5 2.7 .0 1.0 .0 .0OS400 .0 .0 .0 .0 .0 .0 .0 .0 .0 .0 .0 .0 .0NETSERVER .0 .0 .0 .0 .0 .0 .0 .0 .0 .0 .0 .0 .0Average 3.3 7.3 1.1 9.1 55.3 75.2 .0 .3 975.5 341.2 975.3 .0 .0
System Report: Resource Utilization Expansion

IBM eServer iSeries
© 2000-2003 IBM Corporation
System Report 060302 12:39:4HTTP Server Summary Page 001
HTTP, Int, Bch, ODBC, MCInventoryMember . . . : HIBODBCMC Model/Serial . : 720/10-394TM Main storage . . : 5120.0 MB Started . : 06/03/02 12:00:0Library . . : V52PFRDTA5 System name . . : AS25 Version/Release : 5/ 2.0 Stopped . : 06/03/02 12:30:0
Partition ID : 000 Feature Code . : 208D-2064-1505Server Server job Server job Server start ------- Threads ------- -- Inbound Connections -- Requests Responsesname user number date/time Active Idle Non-SSL SSL received sent---------- ---------- ---------- -------------- ---------- ---------- ------------ ------------ ----------- -----------ADMIN QTMHHTTP 009159 06/03/02 08:53 0 80 1 0 3 3JIMCSVR01 QTMHHTTP 009190 06/03/02 10:53 0 80 0 0 99 99Server name -- The server job name. Identify the child job for the server.Server job user -- The server job user. Identify the child job for the server.Server job number -- The server job number. Identify the child job for the server.Server start date/time -- The most recent start or restart time in format mm/dd/yy hh:mm:ssThreads active -- The number of threads doing work when the data was sampled.Threads idle -- The number of idle threads when the data was sampled.Non-SSL Inbound Connect -- The number of non-SSL inbound connections accepted by the server.SSL Inbound Connections -- The number of SSL inbound connections accepted by the server.Requests received -- The number of requests of all types received by the server.Responses sent -- The number of responses of all types sent by the server.
System Report: HTTP Server Summary

IBM eServer iSeries
© 2000-2003 IBM Corporation
Component Report EnhancementsPrint Component Report (PRTCPTRPT)
New selection category to select the job types to print Helpful for analyzing interactive work on a server model
New selection category to select which job priorities to include in your report Helpful for getting totals of the high priority work
The Database Journaling Summary sectionIncludes a new subsection that shows information related to journal counters and operations
New HTTP details statistics section

IBM eServer iSeries
© 2000-2003 IBM Corporation
Notes: Component Report EnhancementsThe Print Component Report (PRTCPTRPT) command was updated to reflect several enhancements, which include the following:
A new selection category allows you to select the job types to print. This selection is helpful for analyzing interactive work on a server model. A new selection category allows you to select which job priorities to include in your report. This selection is helpful for getting totals of the high priority work and finding all priority 00 work when a system has high overhead. A new column reports the percentage of write cache overruns (% write cache overruns). The Database Journaling Summary section includes a new subsection that shows information related to journal counters and operations. The data for the new counters are stored in the QAPMJOBMI file.There is also a planned section showing detailed HTTP statistics. At the time this presentation was published only a simple example was available. See the example report foil later in this presentation.

IBM eServer iSeries
© 2000-2003 IBM Corporation
Component ReportComponent Interval Activity
Contains I,B,ODBC, HTTP, MCInventory workMember . . . : IBHOMCDTA Model/Serial . : 170/10-3DT9M Main storage . . : 2816.0 MB Started . .
Library . . : V52PFRDTA System name . . :AS20 Version/Release : 5/ 2.0 Stopped . .Partition ID : 000 Feature Code . :2388-2388
Int DB ----- Disk I/O ------ HighItv Tns Rsp DDM -CPU Utilization- Feat Cpb ----- Per Second ---- -Utilization- ---End /Hour /Tns I/O Total Inter Batch Util Util Sync Async Disk Unit Mch
----- ----------- ----- ---------- ----- ----- ----- ----- ----- ---------- ---------- ---- ---- ---06:20 0 .00 0 3.0 .0 1.9 .0 .0 2.0 .8 3 0006 006:25 216 .16 0 3.0 .0 2.0 .2 .0 4.3 1.0 4 0006 006:30 322 1.25 0 45.6 22.3 2.5 133.5 6.0 18.1 26.2 5 0006 006:35 228 16.94 0 82.5 11.1 22.7 109.9 18.6 53.3 60.0 26 0007 2806:40 500 .97 0 90.6 8.4 48.2 107.1 35.3 86.5 40.3 73 0007 306:45 698 29.63 0 49.5 4.0 42.0 24.5 33.6 116.4 13.9 93 0006 1006:50 0 .00 0 18.3 .0 15.5 .0 .1 51.7 7.0 77 0001 406:55 59 .40 0 5.6 .0 4.0 .0 .0 3.8 .8 21 0001 0----------------------------------------------------------------------------------------------------------
Component Report Interval Activity - Interactive Feature
Note: Starting January 2003 the word "interactive" should be specifically recognized as meaning jobs/threads doing I/O to 5250 (emulators, 3270 emulators).

IBM eServer iSeries
© 2000-2003 IBM Corporation
Notes: Comp. Report Interval Activity - Interactive FeatureNot new in V5R2, but notice the peak Interactive Feature utilization during certain intervals.
Interactive Feature utilization of over 100 percent over a 15 minute time period as shown was impacting the 5250 job response times as shown in the long response time values in the time periods ending 06:35 and 06:45. Remember the values shown are the average over the time intervals.
In the time period ending 06:45 the 5250 jobs consuming high utilization values started the downward transition to reasonable utilization.

IBM eServer iSeries
© 2000-2003 IBM Corporation
Component Report 6/03/02 12:39:4Job Workload Activity Page
HTTP, Int, Bch, ODBC, MCInventoryMember . . . : HIBODBCMC Model/Serial . : 720/10-394TM Main storage . . : 5120.0 MB Started . : 06/03/02 12:00:0
Library . . : V52PFRDTA5 System name . . :AS25 Version/Release : 5/ 2.0 Stopped . : 06/03/02 12:30:0Partition ID : 000 Feature Code . :208D-2064-1505
T P DBJob User Name/ Job y t CPU Cpb Tns -------- Disk I/O --------- Cmn PAGName Thread Number p Pl y Util Util Tns /Hour Rsp Sync Async Logical I/O Fault
---------- ---------- ------ -- -- -- ----- ----- ------ --------- ------- -------- -------- -------- -------- -----ADMIN QTMHHTTP 009159 B 02 25 .00 .0 0 0 .000 0 0 0 0 0ADMIN QTMHHTTP 009160 B 02 25 .00 .0 0 0 .000 0 0 0 0 0ADMIN QTMHHTTP 009161 B 02 25 .00 .0 0 0 .000 2 0 0 0 0
JIMCSVR01 QTMHHTTP 009190 B 02 25 .00 .0 0 0 .000 0 0 0 0 0JIMCSVR01 QTMHHTTP 009191 B 02 25 .00 .0 0 0 .000 0 0 0 0 0JIMCSVR01 QTMHHTTP 009192 B 02 25 .00 .0 0 0 .000 4 3 0 0 0JIMCSVR01 QTMHHTTP 009193 B 02 25 .00 .0 0 0 .000 208 0 0 0 0JIMCSVR01 QTMHHTTP 009194 B 02 25 .00 .0 0 0 .000 0 0 0 0 0JO-EVALUAT L 02 00 .00 .0 0 0 .000 1 1620 0 0 0JO-TUNING- L 02 00 .00 .0 0 0 .000 0 0 0 0 0JOB240323 AS0323 009248 B 05 50 14.18 12.5 0 0 .000 4427 70628 1292806 0 0JOB240324 AS0324 009246 B 05 50 13.96 12.3 0 0 .000 3980 70324 1335056 0 0JOB240325 AS0325 009245 B 05 50 12.69 10.5 0 0 .000 20757 77184 1451560 0 0
Component Report Job Workload Activity: HTTP jobs

IBM eServer iSeries
© 2000-2003 IBM Corporation
Notes: Comp. Report Job Workload Activity: HTTP jobsThere is nothing new for V5R2 in this report. Note the HTTP server jobs that appear on an earlier foil showing the new HTTP summary section in the V5R2 System Report.

IBM eServer iSeries
© 2000-2003 IBM Corporation
Component Report - HTTP statistics Per server job
Statistics shown for each interval and request type within interval:SR: Requests handled internally by server itself - no program processing SL: Requests of all types received via SSL (Reports activity that occurred over an SSL connection even though that activity is also reported with other applicable request types) PX: Proxy requests CG: CGI requests WS: WebSphere requests JV: IBM Java Servlet Engine requests UM: Requests handled by user modules FS: Static requests handled by FRCA (Fast Response Cache Accelerator) FX: Requests proxied by FRCA

IBM eServer iSeries
© 2000-2003 IBM Corporation
Notes: Component Report - HTTP statistics This foils lists the HTTP server "request types" that are accounted for in the new for V5R2 HTTP statistics section of the Component Report. The first sort criteria is by interval and then by request type.
IBM eServer iSeries
© 2000-2003 IBM Corporation
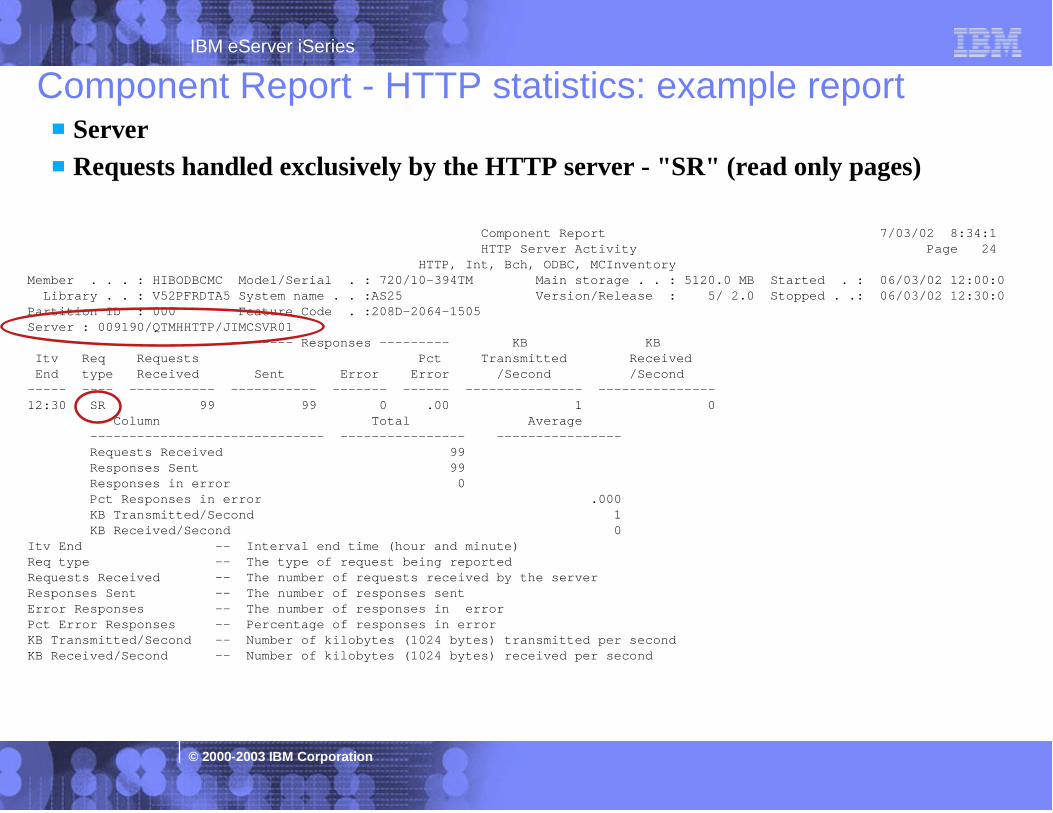
ServerRequests handled exclusively by the HTTP server - "SR" (read only pages)
Component Report 7/03/02 8:34:1HTTP Server Activity Page 24
HTTP, Int, Bch, ODBC, MCInventoryMember . . . : HIBODBCMC Model/Serial . : 720/10-394TM Main storage . . : 5120.0 MB Started . : 06/03/02 12:00:0
Library . . : V52PFRDTA5 System name . . :AS25 Version/Release : 5/ 2.0 Stopped . .: 06/03/02 12:30:0Partition ID : 000 Feature Code . :208D-2064-1505Server : 009190/QTMHHTTP/JIMCSVR01
-------- Responses --------- KB KBItv Req Requests Pct Transmitted ReceivedEnd type Received Sent Error Error /Second /Second
----- ---- ----------- ----------- ------- ------ --------------- ---------------12:30 SR 99 99 0 .00 1 0
Column Total Average------------------------------ ---------------- ----------------Requests Received 99Responses Sent 99Responses in error 0Pct Responses in error .000KB Transmitted/Second 1KB Received/Second 0
Itv End -- Interval end time (hour and minute)Req type -- The type of request being reportedRequests Received -- The number of requests received by the serverResponses Sent -- The number of responses sentError Responses -- The number of responses in errorPct Error Responses -- Percentage of responses in errorKB Transmitted/Second -- Number of kilobytes (1024 bytes) transmitted per secondKB Received/Second -- Number of kilobytes (1024 bytes) received per second
Component Report - HTTP statistics: example report

IBM eServer iSeries
© 2000-2003 IBM Corporation
Notes: Comp. Report - HTTP statistics: example report This is a simple example of a page of the new Component Report section - showing only the number of SR requests processed completely by the HTTP Server. It does not show a realistic workload. At the time this presentation was being published a meaningful example was not yet available.
However, this example does show you the kinds of summary statistics available from this report.

IBM eServer iSeries
© 2000-2003 IBM Corporation
Work with System ActivityCurrent processing capacity
Useful in a dynamic LPAR and shared processor environment
Time spent by the job or task in a waiting stateWait detail categories: CPU, disk, journal entry
Work with System Activity AS2504/29/02 14:10:59
Automatic refresh in seconds . . . . . . . . . . . . . . . . . . . 5Elapsed time . . . . . . : 00:00:02 Average CPU util . . . . : 42.3Number of CPUs . . . . . . : 4 Maximum CPU util . . . . . : 87.1Overall DB CPU util . . . : 53.4 Minimum CPU util . . . . . : .1
Current processing capacity: 4.00Type options, press Enter.
1=Monitor job 5=Work with job 6=Wait detail
Job or --------Storage--------- TotalOpt Task User Number Thread Allocated Deallocated Wait
JOB0302H AS0302 002201 00000001 0 0 .0JOB0301H AS0301 002200 00000001 0 0 .0IOPI-HRI-P 0 0 .0
BottomF3=Exit F10=Update list F11=View 1 F12=Cancel F19=Automatic refreshF24=More keys
View 4
IBM eServer iSeries
© 2000-2003 IBM Corporation
Notes: Work with System ActivityWith V5R2 the Work with System Activity (WRKSYSACT) command display shows the current processing capacity on all views. This information is useful in shared processor environments, especially in cases where the capacity of the partition changes but the number of virtual processors does not change.
By selecting "View 4", the Work with System Activity display also shows the total percent of time spent by the job or task in a waiting state. You can view a list of the wait categories with option 6 (Wait detail).
Wait (percent) details are included for:CPU consumed within thread or taskCPU queuing DASD (regular I/O operations) DASD (other) Journal
Several fields that relate to the wait time accounting data are added to the QAITMON file, which is created by the WRKSYSACT command.

IBM eServer iSeries
© 2000-2003 IBM Corporation
Performance Explorer Now requires *SERVICE authority.
Reduces the amount of data that you captureNew CL commands to create a filter
New events added to the Add PEX Definition (ADDPEXDFN) command
New Work with PEX Definitions (WRKPEXDFN) command.
New database files

IBM eServer iSeries
© 2000-2003 IBM Corporation
Notes: Performance Explorer This is an overview of the Performance Explorer enhancements, you can also find these in the iSeries Information Center.
Performance explorer commands now require that users have *SERVICE authority. New CL commands allow you to create a filter to reduce the amount of data that you capture.
Add PEX Filter (ADDPEXFTR): Defines the program/module/procedure whose entry/exit detailed performance data should be kept. Work with PEX Filter (WRKPEXFTR) Remove PEX Filter (RMVPEXFTR)
The STRPEX command was enhanced to support filters. Performance explorer now uses the management collection object (*MGTCOL) to convert collected data into its database files. The Create PEX Data (CRTPEXDTA) command performs the conversion. The following events were added to the Add PEX Definition (ADDPEXDFN) command:
Application events (APPEVT) Portable Application Solution Environment (PASE) events (PASEEVT) Journal events (JRNEVT) iSeries NetServer, File Server, and Network File System Server and Client events (FILSVREVT) Synchronization events (SYNCEVT) Expert cache events (EXPCCHEVT)
A new value was added to the Operating System events (OSEVT) parameter, *HOSTSVRCNN, on the ADDPEXDFN command. This value is the same as the *DBSVRCNN value. *HOSTSVRCNN is the recommended value. A new command is provided that allows you to work with your performance explorer definitions: Work with PEX Definitions (WRKPEXDFN) command. A new collection state of incomplete can be displayed when ending a performance explorer session. This state means that the collection ended unexpectedly. The iSeries Information center shows an overview of all the new and deleted files for this release.
See the section on iDoctor for iSeries for other ways t o use the Performance Explorer options

IBM eServer iSeries
© 2000-2003 IBM Corporation
Trending, Sizing, Capacity Planning tools update
IBM eServer iSeries
© 2000-2003 IBM Corporation
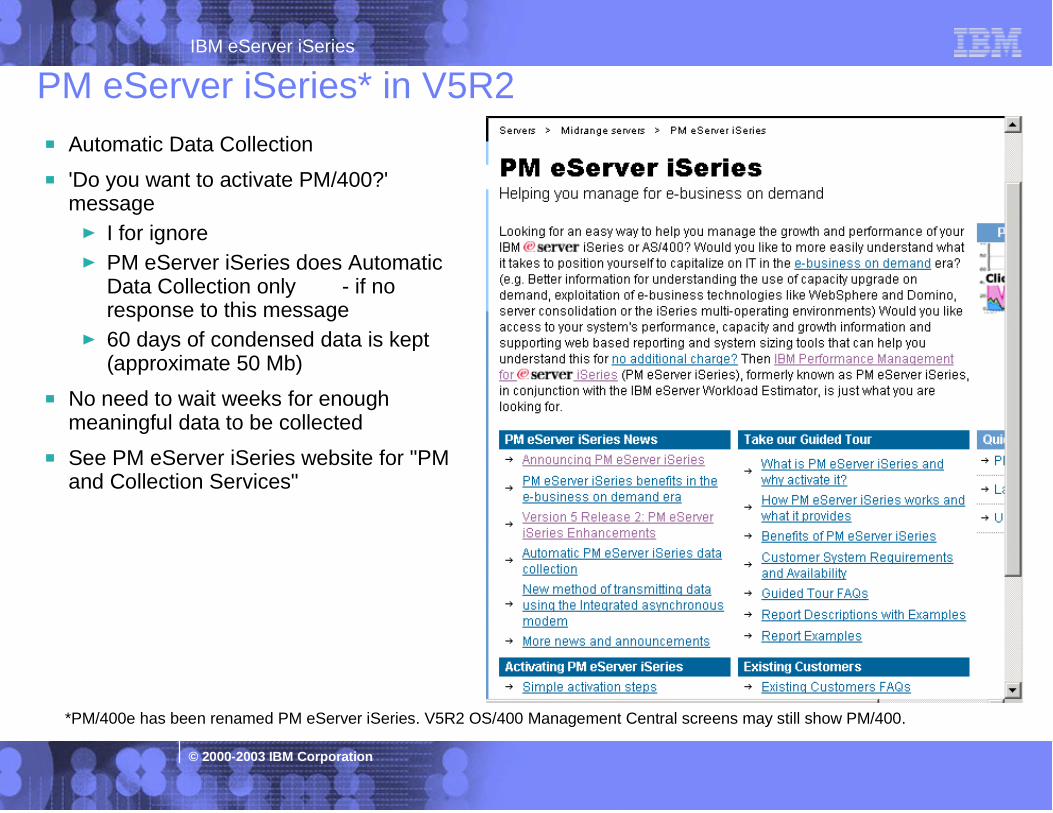
PM eServer iSeries* in V5R2Automatic Data Collection'Do you want to activate PM/400?' message
I for ignorePM eServer iSeries does Automatic Data Collection only - if no response to this message60 days of condensed data is kept (approximate 50 Mb)
No need to wait weeks for enough meaningful data to be collectedSee PM eServer iSeries website for "PM and Collection Services"
*PM/400e has been renamed PM eServer iSeries. V5R2 OS/400 Management Central screens may still show PM/400.

IBM eServer iSeries
© 2000-2003 IBM Corporation
Notes: PM eServer iSeries* in V5R2PM eServer iSeries automatically collects performance data, unless you upgrade from a previous release and turn off PM eServer iSeries performance data collection on the previous release. The data is not transmitted to IBM until you give permission to send it to IBM. The benefit of automatically collecting performance data is that you have the data when you need it and you can receive the PM/400 reports sooner after you activate PM/400. For the most current information about the PM eServer iSeries reports, go to the PM eServer iSeries Web site.
In summary:
Basically, PM eServer iSeries has an autostart job under the QSYSWRK subsystem. This is not new. PM eServer iSeries has not yet been activated, the PM eServer iSeries job issues the message 'Do you want to activate PM/400?' In the past, it waited for an answer to this message before starting collection services.
Today, collection services is started prior to receiving an answer to this message. The data will not be transmitted until the answer to the question is positive. If the response is 'G' for Go, then PM eServer iSeries is setup for synchronous transmission. If the response is 'I' for ignore, PM/400 keeps collecting data only. If the response is 'C' for cancel, all of the PM eServer iSeries jobs are just ended and will not start collection services again or ask the question again.
PM/400 will not end collection services, even if PM eServer iSeries was the one that started it. Collection services is started at IPL.
The purpose is for those customers that haven't said they didn't want PM eServer iSeries, we'll start collecting the data. We keep 60 days condensed data.
Whenever the customer decides they do want data transmitted, they only need to activate the product (through an API or CFGPM400 command) and then the 60 days of data that was already collected will be sent to IBM.
In the past, once they activated the product they started collecting data and there was no history, so they had to wait weeks for enough meaningful data to be collected.
How do Collection Services and PM eServer iSeries work together? (Not new for V5R2 but relevant for the new automatic collection)
PM/400 automates the collection of performance data by triggering Collection Services. Even if you are collecting your own performance data, you can still use PM eServer iSeries. PM eServer iSeries will make the following changes to Collection Services:
By default Collection Services will be started after IPL and configured to create the performance database files (QAPM*) during collection. You can run your tools against these files or you can do your own CRTPFRDTA against the collection object. By default the collection library will be changed to the QMPGDATA library. Both collection objects and files will be created into this library. You can modify the library that PM eServer iSeries uses by GO PM400, 'Work with PM/400 Customization' option, Performance Data Library. Changing this library value will change where PM/400 instructs Collection Services to write the database files and where PM/400 will look for the data. Since PM eServer iSeries is initiating the collecting of the data, PM eServer iSeries will also remove the data from the QAPM* database files.
Note: Basic PM eServer iSeries (formerly PM/400e) functions are free of charge. For detailed chart functions there are additional reports and graphs. You do not need these additional charge functions just to start PM eServer (PM/400e) on your system.
IBM eServer iSeries
© 2000-2003 IBM Corporation
Notes: PM eServer iSeries in V5R2 -2PM eServer iSeries automatically collects performance data, unless you upgrade from a previous release and turn off PM eServer iSeries performance data collection The number of days of data that is kept defaults to 0, which is the current day's data. If you want to keep more data for your own use, this purge value can be changed by GO PM400, 'Work with PM/400 Customization' option, Performance data purge days. PM eServer iSeries will collect data with the *STANDARDP category by default. The Collector Definition *ENHCPCPLN will also be allowed. If Collection Services is set to a Collector Definition of something other than *STANDARDP or *ENHCPCPLN, the collector definition will be changed to *STANDARDP. This is required to get a complete set of data that will be useful to PM/400 and WorkLoad Estimator (WLE). PM/400 will not change the Collection Services Interval Value or any other collection attributes. The default and recommended value is 15 minutes. Intervals less than 15 minutes are allowed and will result in more space being used on your system.
PM eServer iSeries, the powerful, automated OS/400 function that provides the necessary iSeries or AS/400 utilization data needed to help more easily manage the growth and performance of your system, has minor improvements in V5R2. V5R2 comes with the functions originally made available with V5R1 PTF number SI02609. This V5R1/V5R2 support will automatically start collecting a rolling 60 day summary file of PM eServer iSeries history information for your later use as needed.
Access to this vital information can help you better understand your system's current utilization and growth, where potential bottlenecks might be now or later, and help you determine (size) what your next required system upgrade might be (through the integration of your PM eServer iSeries data with the IBM Workload Estimator).

IBM eServer iSeries
© 2000-2003 IBM Corporation
Notes: PM eServer iSeries* in V5R2 in V5R2 -3You have several of choices of using PM eServer iSeries* in V5R2:
As always, you can optionally activate and transmit PM eServer iSeries* in V5R2 data at system set up and begin viewing your capacity and performance reports within 3-4 weeks on the web, or If you elect not to activate and transmit PM eServer iSeries* in V5R2 data at system set up time, you can be assured, with this PTF, your system is collecting a small file of critical PM eServer iSeries* in V5R2 performance data that you can elect to transmit to IBM at any time via the CFGPM400 command or through the Universal Connection*. Once transmitted, you and your IBM Representative or IBM Business Partner, will quickly be able to see meaningful graphs reflecting your systems most recent performance, utilization and growth. No more waiting for 3-4 weeks for critical data to be collected; it will be ready for transmission. The choice to not have PM eServer iSeries* in V5R2 active at all on your system by taking option "C" for cancel at the PM eServer iSeries* in V5R2 activate prompt during OS/400 set up or by you running the Q1PENDPM API remains. But the question to ask yourself is, 'why wouldn't I want the assurance that the critical data needed for helping understand utilization, performance and capacity requirement issues is being routinely transmitted to IBM or, with this PTF, at least being automatically collected for future transmission as needed?'.
For a more detailed explanation on how to work with this new function, how it can coexist with Collection Services data for use with the IBM Performance Tools, etc., see the FAQ titled "How do Collection Services and PM eServer iSeries* in V5R2 work together?" on the PM eServer iSeries* in V5R2 homepage.
* If you have previously inactivated PM/400e (PM eServer iSeries), no data will be collected.

IBM eServer iSeries
© 2000-2003 IBM Corporation
Workload EstimatorUpdated to include the new iSeries 800, i810, i825, 870, and i890 series of systems; #2757 Disk Controller, 15K RPM disk support added Mar, 2003
Include support for OS/400 V5R2Support for V4R5 within the Estimator has been dropped
Logical Partitioning (LPAR)Check out the new tutorial "Logical Partitioning"
Workload Updates
Operational Assumptions Updated
"Processor on Demand" sizing updated
Growth Solution updated

IBM eServer iSeries
© 2000-2003 IBM Corporation
Notes: Workload EstimatorApril 2002, January 2003 servers: The Estimator has been updated to include the new iSeries 800, i810, i825, i870, and i890 series of systems.
OS/400 V5R2: The Estimator has also been updated to include support for OS/400 V5R2. At the same time support for V4R5 within the Estimator has been dropped.
Logical Partitioning (LPAR): The Estimator has been updated to support the sizing in a Logical PARtitioning (LPAR) environment. LPAR is a mode of machine operation where multiple copies of operating systems run on a single physical machine. The support within the Estimator allows you to decide the mode of LPAR (Dedicated or shared processors) and assign workloads to these Partition. Check out the new tutorial "Logical Partitioning" for information on utilizing this new feature.
Workload Updates: For workload updates, see the following foils.
Operational Assumptions Updated - The operational assumptions (Options) have been updated to allow the target utilization to vary according to the number of processors on the system.
"Processor on Demand" sizing updated: In prior versions of the Estimator, when the Estimator was searching for available systems, the Estimator would only look at the processing power of a POD model with the fewest processors activated. Thus if the CPU requirements of the workloads was greater than the minimum CPW rating, the model would be ignored. Starting in the 2002.2 version, the Estimator will look at the number of processors available within a POD and attempt to determine the number of processors that would need to be activated.
Growth Solution updated: In versions of the Estimator prior to v2002.2, the growth percentage that was specified on the Selected System page would have been applied to all workloads (except PM/400 which uses its own growth factors based on historical data). Starting in v2002.2, each workload has its own individual growth factor. Hence for those estimations that have multiple workloads, it is now possible for each workload specified to grow at a different rate.
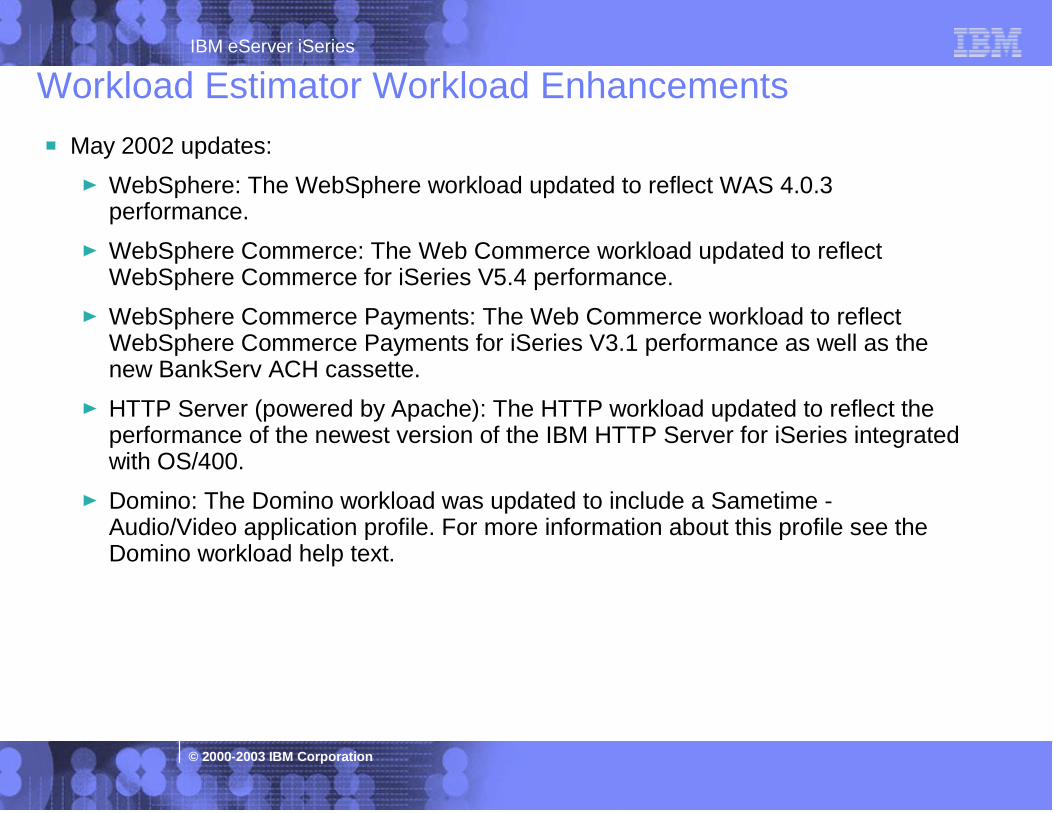
IBM eServer iSeries
© 2000-2003 IBM Corporation
Workload Estimator Workload EnhancementsMay 2002 updates:
WebSphere: The WebSphere workload updated to reflect WAS 4.0.3 performance. WebSphere Commerce: The Web Commerce workload updated to reflect WebSphere Commerce for iSeries V5.4 performance. WebSphere Commerce Payments: The Web Commerce workload to reflect WebSphere Commerce Payments for iSeries V3.1 performance as well as the new BankServ ACH cassette. HTTP Server (powered by Apache): The HTTP workload updated to reflect the performance of the newest version of the IBM HTTP Server for iSeries integrated with OS/400. Domino: The Domino workload was updated to include a Sametime - Audio/Video application profile. For more information about this profile see the Domino workload help text.

IBM eServer iSeries
© 2000-2003 IBM Corporation
Workload Estimator Workload Enhancements -2November 2002 updates:
Notes Domino 6 - The Estimator has been updated to include support for Lotus Notes Domino 6, including improved estimations and reflect new versions of the various Lotus products. Highlights of these enhancements are: Sametime 3.0 and QuickPlace 3.0 application updatesThe ability to size Inbound Cluster Replication workloadsSeparate Mail and Application Clustering definitionsa 3x Heavy type for mail usersAdditional LPAR specifications for DominoThe ability to size Transaction Logging processingProcessing adjustment based on mail database size

IBM eServer iSeries
© 2000-2003 IBM Corporation
Workload Estimator Workload Enhancements -3January 2003:
Linux web and file servingWebSphere Application Server 5.0WebSphere AS 5.0 ExpressWebSphere Commerce WebServing updateWebSphere Portal ServerWebfacingNew servers

IBM eServer iSeries
© 2000-2003 IBM Corporation
Workload Estimator Workload List Example
January 2003:Linux web and file servingWebSphere Application Server 5.0WebSphere AS 5.0 ExpressWebSphere Commerce WebServing updateWebSphere Portal ServerWebFacing

IBM eServer iSeries
© 2000-2003 IBM Corporation
WebFacing Application
Run both 5250 Version and WebFaced Version

IBM eServer iSeries
© 2000-2003 IBM Corporation
Notes: WebFacing ApplicationEstimating a WebFacing workload has been added in the January 2003 update to the WLE. We show a series of screen flows estimating a 5250 to WebFace application sizing.
This screen appears after selecting to model a WebFacing workload named WebFacing #1.
We entered 5000 5250 "enter keys" during the busiest hour (note the text "one 5250 screen is a transaction").
We also specified the average number of fields processed per screen transaction as 30 and estimated there are 100 unique 5250 screens served by the WebFacing server code on the iSeries.
Optionally you can choose to model the original 5250 application at the same time. Note the help text window on the right.
You need to watch an existing 5250 application and collect performance data to determine the values to enter.

IBM eServer iSeries
© 2000-2003 IBM Corporation
WebFacing Application -2 - existing 5250 application
Run measured 5250 application

IBM eServer iSeries
© 2000-2003 IBM Corporation
Notes: WebFacing Application: existing 5250 applicationHere you enter performance and hardware data that you collected while running the actual 5250 application on an existing system.
We selected a "top of the line 270-2253 with 70 interactive CPW.
Additional Characteristics include Domino and Low end Compatible. At the time this presentation was created additional details on the Additional Characteristics was not available.
Note, the "Yes" already filled in by WLE for "will this workload be changed to use WebFacing Support?."

IBM eServer iSeries
© 2000-2003 IBM Corporation
WebFacing Application -3: Selecting a system
Use supported upgrade path or select a target server

IBM eServer iSeries
© 2000-2003 IBM Corporation
Notes: WebFacing Application -3: Selecting a systemThis window shows the existing system we previously selected.
You can tell WLE to use the supported upgrade paths to select a system as a possible target system for growth or specify that a system should be selected regardless or any supported upgrade path. In other words, you would buy a new system and not worry about upgrading an existing system for this exercise.
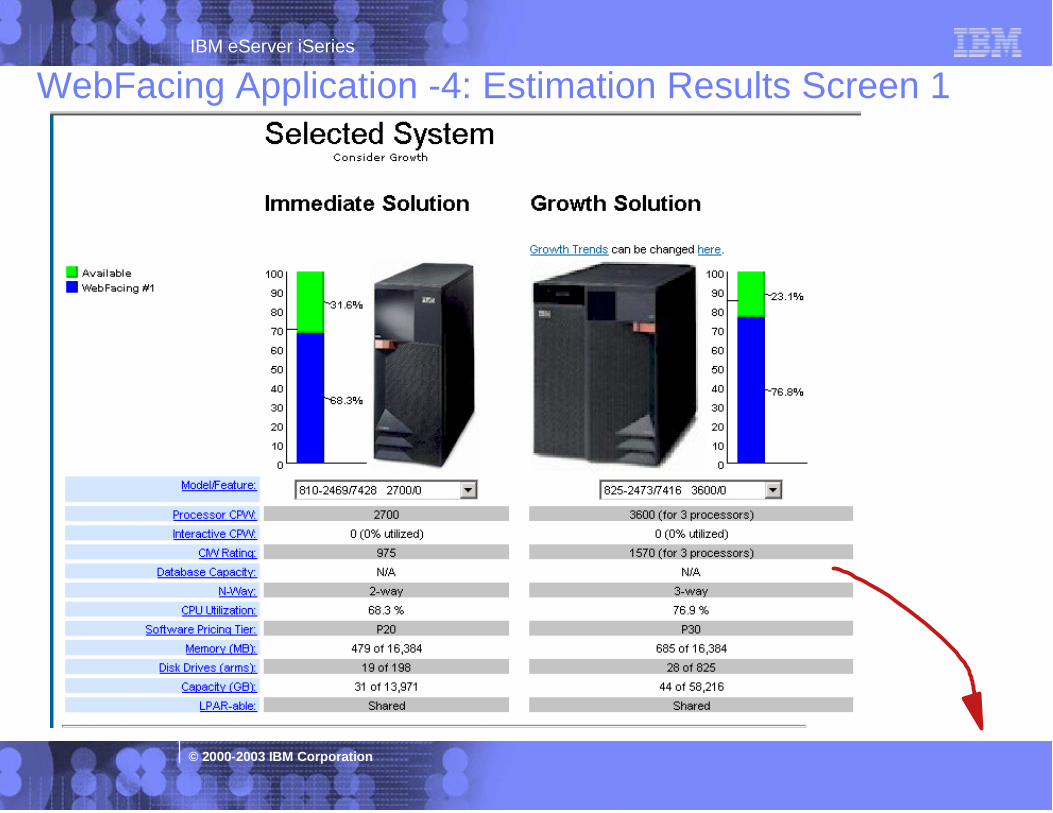
IBM eServer iSeries
© 2000-2003 IBM Corporation
WebFacing Application -4: Estimation Results Screen 1

IBM eServer iSeries
© 2000-2003 IBM Corporation
Notes: WebFacing Appl. -4: Estimation Results Screen 1This shows the first of 2 screens of estimate results.
The immediate system (can handle current workload) and a growth solution system are shown.
You can see an i810 and an i825 and listed below each system is tabular information that includes CPU utilization, Software Pricing Tier and LPAR capability.
The next foil shows the text that appears under the system graphics and tabular information.
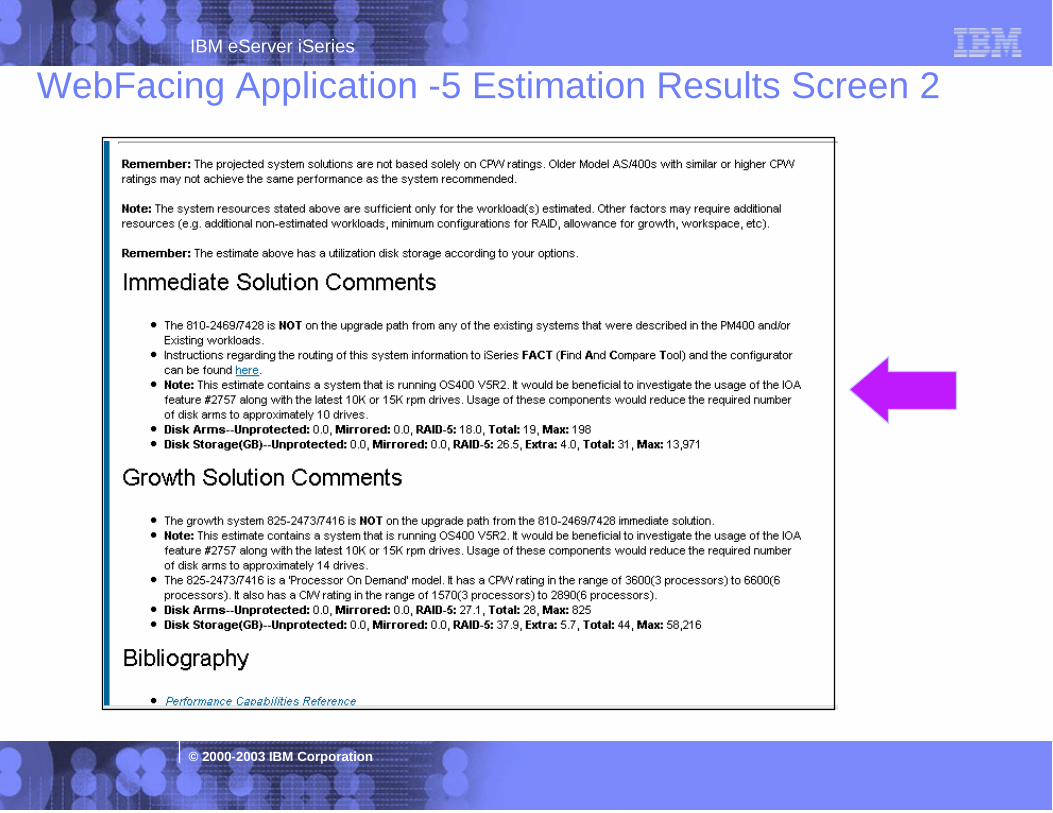
IBM eServer iSeries
© 2000-2003 IBM Corporation
WebFacing Application -5 Estimation Results Screen 2

IBM eServer iSeries
© 2000-2003 IBM Corporation
Notes: WebFacing Appl. -5 Estimation Results Screen 2This window shows the typical text for any estimation done by WLE. It summarizes considerations for the Immediate Solution and the Growth Solution systems shown.
In our example, it indicates neither the i810 nor the i825 are in the supported upgrade path and points out that you should consider using the newer #2757 Ultra RAID5 disk controller and newer 10K and 15K rpm disk drives.
You also get a link to the Performance Capabilities Reference documentation.

IBM eServer iSeries
© 2000-2003 IBM Corporation
WLE: #2757 IOA, 15K RPM disk modeling example
Use "original IOA", 10K RPM disks or new #2757, 15K RPM disks (requires 5095, 5094 PCI-X tower)

IBM eServer iSeries
© 2000-2003 IBM Corporation
Notes: WLE: #2757 IOA, 15K RPM disk exampleStarting March 5, 2003, WLE added explicit modeling of the 2757 Disk Controller (IOA) and the 15K RPM disks. The WLE user, of course, is responsible for ordering a new PCI-X 5095, or 5094 I/O tower.

IBM eServer iSeries
© 2000-2003 IBM Corporation
WLE: #2757 IOA, 15K RPM disk example results

IBM eServer iSeries
© 2000-2003 IBM Corporation
Patrol for iSeries - Predictfrom BMC Software, Inc.

IBM eServer iSeries
© 2000-2003 IBM Corporation
PATROL - Predict* provides a powerful graphical analysis tool for Capacity Planning
Uses OS/400 performance data (QAPMccc files)V4R2 or later
Runs on V4R4 or later
Comprehensive graphical analysis,"what-if" modeling
Two "components:"Analyze: Create model runs on iSeries
Predict: Capacity planning on PC workstation
1. Open Model
2. Evaluate Model
5. Plan for futuregrowth
3. View Reports
4. View Charts
* Can be ordered through iSeries e-config or BMC. This is not an IBM product. Know as 5620-FIF on iSeries.
BMC PATROL for iSeries - Predict

IBM eServer iSeries
© 2000-2003 IBM Corporation
Notes: BMC PATROL for iSeries - PredictWith V5R1 and previous releases, Performance Tools for iSeries, 5722-PT1, included display and printed reports of collected performance data, management of that data as database files, plus the BEST/1 capacity planning tool. BEST/1 is not supported in V5R2.
BMC Patrol for iSeries - Predict is an alternative tool for doing capacity planning for iSeries that becomes available during the last half of 2002. The "create model" component runs on iSeries under OS/400 V4R4 or later. Patrol for iSeries - Predict is a separately priced product produced and support by BMC Software, Inc. Patrol for iSeries - Predict functions and user interface are based upon corresponding Predict for UNIX and NT operating systems products from BMC Software, Inc..
Collection Services used for collecting performance data, used by PM eServer iSeries in V5R2 and Performance Tools for iSeries, is part of OS/400, and enabled through iSeries Navigator. Customers will continue to use the existing Performance Tools for iSeries licensed program product (5722-PT1) to analyze or print performance reports.
IBM's web based tool, Workload Estimator, or BEST/1 running on V5R1 can be used for new workloads such as Domino or WebSphere or to evaluate upgrades on i270, i820, i830, and the i840 servers. Workload Estimator has been updated with 890 support. It includes recommendations for incremental processor capacity enabling customers to take advantage of the Capacity Upgrade on Demand options on iSeries.
In screen captures on the right, you can see:
In the upper window, an example of the PC workstation component's navigation tree structure. Looking closely you can see:Components (folders) on a Predict model created on the iSeries that is worked with on the PC workstation. You can see the "default workloads" - CLIENTAC4 and INTERACTIV (5250 workstation jobs), NONINTER and QDEFAULT that correspond to equivalent BEST/1 default workloads. When using default workloads you specify to BEST/1 or Patrol - Predict, to automatically assign the jobs that have Client Access Express (iSeries Access in V5R2) attributes and jobs with interactive 5250 attributes to the CLIENTAC4 and INTERACTIV workloads. Other user non-5250 job work is automatically assigned to NONINTER. This would include HTTP server, Domino server, Management Central, and "traditional batch jobs" work. QDEFAULT contains other OS/400 work, such as OS/400 Work Management subsystem jobs and microcode tasks work that cannot be assigned to any of the other default workloads.Logical Volumes folder represents any ASP groups of disks

IBM eServer iSeries
© 2000-2003 IBM Corporation
Notes: BMC PATROL for iSeries - Predict -2In the lower window shown, you can see:
The model name - CIRCUSREST, in our exampleThe Disk folder expanded to show all disk drives on the system as recorded in the QAPMcccc database files used to create the modelSeveral "red x" icons that indicate some disk resource usage (disk utilization - percent busy) threshold has been detected. This is also summarized in the indicated in the task pad - messages area.
The lower window, right side pane shows the 5 actions you can perform on the created model:Open: Open the model and view its contentsEvaluate the Model: This means validate the model against collected performance dataView Reports: View results of the most recent "what-if" capacity planning parametersView Charts: View the reports in graphical (for example, bar charts) formatPlan for future growth: Enter the capacity planning growth parameters and do the "what-if" processing.

IBM eServer iSeries
© 2000-2003 IBM Corporation
Notes: BMC PATROL for iSeries - Predict -3IBM and BMC have negotiated a reseller agreement for the new capacity planning product so that it can be ordered from IBM iSeries channels and BMC channels. (FYI for our IBM Business Partners, PATROL Predict will be supported by the iSeries Configurator.) And, regardless of whom you order it from, BMC will provide one year of warranty and support. After that initial period, technical support and maintenance renewals will be available through BMC.
You can access the BMC Software web site at http://www.bmc.com or contact BMC Software Inc. at:
BMC Software Inc.
2101 City West Blvd.
Houston TX 77042-2827
USA
Tel: 713 918 8800
800 841 2031
Fax: 713 918 8000
BMC Software, the BMC Software logos, and all other BMC Software Products and Services are registered trademarks of BMC Software Inc.

IBM eServer iSeries
© 2000-2003 IBM Corporation
Patrol for iSeries - PredictUse instead of BEST/1 starting with V5R2
Developed by BMC Software (BEST/1 developers)Not part of Performance Tools for iSeriesSupported by BMC as 5620-FIF
Model created on iSeries with 5250 workstation BEST/1-like command interface
"What-if" capacity planning performed through GUI on Windows 2000/NT PC workstation - "Predict Console"
General availability in 09/02
BEST/1 and Patrol - Predict are different:Does not have some of BEST/1's limitationsDoes not have some of BEST/1's capabilities

IBM eServer iSeries
© 2000-2003 IBM Corporation
Notes: Patrol for iSeries - Predict This foil is a quick summary of Patrol for iSeries - Predict from the BMC Corporation, that corresponds to the first foil.
Patrol - Predict is not part of the Performance Tools for iSeries, 5722 product . It will be composed of two components:On the iSeries: BEST/1-like Create Model functions for identifying OS/400 jobs and assigning work to Workloads based upon user id, job name, OS/400 subsystem and other BEST/1 categories. The familiar default workloads for interactive, non-interactive, pass-through, and Client Access, and Default are supported as derived from the familiar QAPMcccc performance database files. QAPMccc database files from V4R2 and later are supported for input to creating the model.On the PC Windows operating system: This new to iSeries users product using a PC workstation-based GUI for validating the model and doing "what if" capacity planning functions. The growth by period is supported and there are many more "analysis reports" than BEST/1 had. These reports are all in HTML format and can be printed.
There will be separate prices for each of the two components. Product support is provided by BMC.
The following charts show the modeling process flow and some more details.
Note: If you are an IBM representative or IBM Business Partner there is a Geographical contact to obtain this software. In the US, it is James Cioffi/Dallas/IBM@IBMUS. For other r contacts, see:
US: Steve Miedema at [email protected] Pacific: James C Chia at [email protected]: Petter Sommerfelt at [email protected]

IBM eServer iSeries
© 2000-2003 IBM Corporation
Notes: Patrol for iSeries - Predict -2Note: Regarding V5R1 Performance Tools for iSeries, 5722-PT1 - support for the following commands or menu options have been withdrawn from the Performance Tools licensed program effective with V5R2:
Start BEST/1 (Start BEST/1) Analyze BEST/1 Model (ANZBESTMDL) Create BEST/1 Model (CRTBESTMDL) Convert MDLSYS File (CVTMDLSYSF) Delete BEST/1 Model (DLTBESTMDL) Print BEST/1 File (PRTBESTF) Check Version of Specified Performance Data Member (QCYCHKV) Convert System/36 Files from MDLSYS to BEST/1 (QCYCVTBD) Find First and Last Date of Specified Performance Data Member (QCYFLDT) Receive Messages from Previous Layer and Resend to Invoking Layer (QCYRSNDM) Start MDLSYS (MDLSYS)
The Capacity planning/modeling option (4) has been removed from the V5R2 PERFORM menu.

IBM eServer iSeries
© 2000-2003 IBM Corporation
Ordering PATROL for iSeries - Predict (5620-FIF)Ordered from
All iSeries ChannelsThe iSeries ConfiguratorAll BMC Channels
PackagingOne year warranty and one year support are included Support and maintenance renewals available through BMC
Licensing Required for each managed iSeries-AS/400 (Serial Number)
Technical SupportBMC will assume all levels of support
IBM routes call to BMC
Product Ordering/Support

IBM eServer iSeries
© 2000-2003 IBM Corporation
Notes: Product Ordering/Support While Predict is sold and supported by BMC, IBM will support the sale of the product through the iSeries Configurator as 5622-FIF, enabling customers to order the product through IBM and its Business Partners.
The price of a PATROL for iSeries - Predict license includes a 1-year service and support warranty.
A license from BMC is required for each PC on which the Predict modeling is performed and each iSeries System serial number whose performance data is used to create a model.
All technical support including defect support is provided by BMC. Calls to IBM for support will be directed to contact BMC Support personnel.
If you want to be registered to receive e-mail providing important Patrol for iSeries - Predict information, register at this BMC web site:http://www.bmc.com/register/subscribe.cfm
Fixes will be made available on the support web site: http://www.bmc.com/support_home
To obtain the Patrol-Predict software, IBMers can access an internal web site at System Sales in the iSeries Sales Kit: http://w3-1.ibm.com/sales/systems/ibmsm.nsf/docnames/ipatrol
For IBMers who wish use the product for "Non-Fee" activity, you should go to the IBM Internal website at: http://w3-1.ibm.com/sales/systems/ibmsm.nsf/mainframeset?readform&geo=AM&cdoc=ipatrol
Country-specifc BMC support example:BrazilTel: 0800-177-262, Fax: (+55) 11-3443-6072E-mail: [email protected]: 9:00am - 6:00pm

IBM eServer iSeries
© 2000-2003 IBM Corporation
Notes: Product Ordering/Support -2While Predict is sold and supported by BMC, IBM will support the sale of the product through the iSeries Configurator as 5622-FIF, enabling Note: If you are an IBM representative or IBM Business Partner there is a Geographical contact to obtain this software. Contact:
US: Steve Miedema at [email protected] Pacific: Jim Chia at [email protected]: Petter Sommerfelt at [email protected]

IBM eServer iSeries
© 2000-2003 IBM Corporation
Product Ordering/Support While Predict is sold and supported by BMC, IBM will support the sale of the product through the iSeries Configurator as 5622-FIF, enabling customers to order the product through IBM and its Business Partners.
The price of a PATROL for iSeries - Predict license includes a 1-year service and support warranty.
A license from BMC is required for each PC on which the Predict modeling is performed and each iSeries System serial number whose performance data is used to create a model.
All technical support including defect support is provided by BMC. Calls to IBM for support will be directed to contact BMC Support personnel.
If you want to be registered to receive e-mail providing important Patrol for iSeries - Predict, register at this BMC web site:http://www.bmc.com/register/subscribe.cfm
Fixes will be made available on the support web site: http://www.bmc.com/support_home
To obtain the Patrol-Predict software, IBMers can access an internal web site at System Sales in the iSeries Sales Kit: http://w3-1.ibm.com/sales/systems/ibmsm.nsf/docnames/ipatrol

IBM eServer iSeries
© 2000-2003 IBM Corporation
BMC Patrol for iSeries - Predict: sample web page
http://www.bmc.com/supportu/proddoc.cfm?product_seq_id=9688
Sally Smith

IBM eServer iSeries
© 2000-2003 IBM Corporation
Performance
Data
Patrol for iSeries - Predict
Create Patrol - Predict model xxxxxx.mdbyte streamfile in IFS
OS/400
Windows NT/2000
PATROL for iSeries - Predict(Console component for model evaluation)
iSeries capacity studiesPredict trending“What-if” scenarios
Analyze
Predict
(QAPMccc files)
Patrol - Predict components, capacity planning process

IBM eServer iSeries
© 2000-2003 IBM Corporation
BEST/1 FilesQACYJBCL - Job ClassificationQACYMDLS - BEST/1 Models QACYWKLS - WorkloadsQACYMDLE - Ext Desc File for model
*MGTCOL"Universal Data Repository"
iSeriesCollectionServices
BuildModel
MD
iSeriesCRTPFRDATA
QAPM*
Predict(Agent)
Predict
Predict(Console)
OS/400
~"QACYMDLS"~"QACYWKLS"
Model File (.md)
Predict Process Overview

IBM eServer iSeries
© 2000-2003 IBM Corporation
Notes: Predict Process OverviewThis is another overview of the create model to analyze model flow showing more details than the previous foil.

IBM eServer iSeries
© 2000-2003 IBM Corporation
Predict: SummaryCreate Model (very similar to BEST/1)
Supports older releases:Supports QAPMccc data from V4R2 and later; Runs on V4R4 or later
Job Classifications like BEST/1 (user id, job type, job name, subsystem, account code....)
Capacity planningCPU, disk, ASP (logical volume) Interactive feature utilization, variable interactive CPW for LPAR partitionPercent growth per "time period" relative to original base or previous time period (BEST/1)HTML-based graphical displays for "reports" and bar chartsMany more reports than BEST/1Validate model (predicted compared to measured)Change computer, add disksTask pads for status messages, icons to indicate warning (threshold reached), and guideline reached per resource

IBM eServer iSeries
© 2000-2003 IBM Corporation
Predict: First Release Advancements over BEST/1Create model
Job Classifications like BEST/1 but with multi-category selection (for example, job name and subsystem name)
Intuitive menu interface for "what-if" planning exercises
Can support more than one "computer" Workloads may span multiple computers/partitions
Can support dependent transactionsIf transaction xxx grows by 20% than transaction yyy grows by ....
No hardware processor - I/O configuration tablesBEST/1 would not create a model if it determined there was an invalid configuration
Improved graphical representation of planning exercise results

IBM eServer iSeries
© 2000-2003 IBM Corporation
Edit Job Classifications
Enter workload names and category values which are assigned to each workload,press Enter. Jobs with unassigned values become part of workload QDEFAULT.
AccountWorkload User ID Job Type Job Name Code SubsystemINTER01 USER01 *INTERACTVINTER01 SALESBATCH01 ENDOFDAY SPECBTC
BottomF3=Exit F4=Prompt F6=Insert line F11=Display more categoriesF12=Cancel
Edit Job Classifications
Enter workload names and category values which are assigned to each workload,press Enter. Jobs with unassigned values become part of workload QDEFAULT.
ControlWorkload Pool Unit Comm Line Job NumberINTER01 03 _______ _________ __________INTER01 ___ _______ _________ ___________BATCH01 ___ _______ _________ ___________
BottomF3=Exit F4=Prompt F6=Insert line F11=Display more categoriesF12=Cancel
eg: INTER01All Interactive Jobs for User USER01 running in Pool #03All jobs in Subsystem SALES
Create Model: Multi-Category Classification
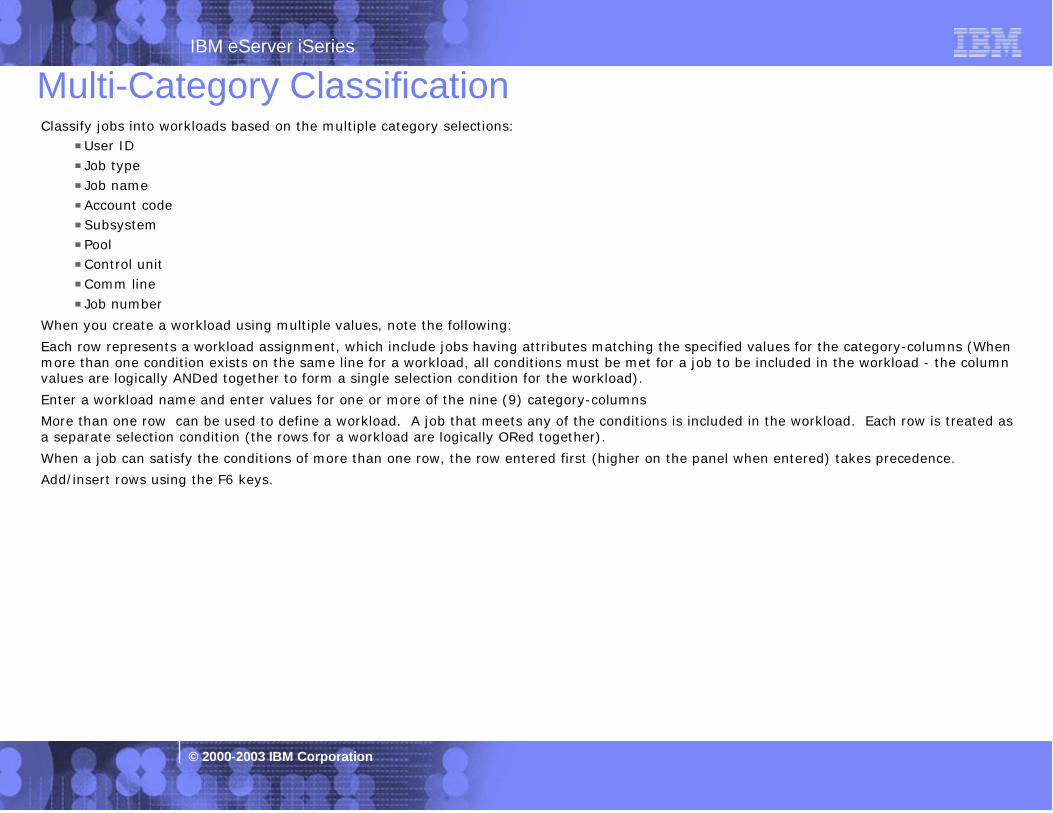
IBM eServer iSeries
© 2000-2003 IBM Corporation
Multi-Category ClassificationClassify jobs into workloads based on the multiple category selections:
User ID Job type Job name Account code Subsystem Pool Control unit Comm line Job number
When you create a workload using multiple values, note the following:
Each row represents a workload assignment, which include jobs having attributes matching the specified values for the category-columns (When more than one condition exists on the same line for a workload, all conditions must be met for a job to be included in the workload - the column values are logically ANDed together to form a single selection condition for the workload).
Enter a workload name and enter values for one or more of the nine (9) category-columns
More than one row can be used to define a workload. A job that meets any of the conditions is included in the workload. Each row is treated as a separate selection condition (the rows for a workload are logically ORed together).
When a job can satisfy the conditions of more than one row, the row entered first (higher on the panel when entered) takes precedence.
Add/insert rows using the F6 keys.

IBM eServer iSeries
© 2000-2003 IBM Corporation
Predict: First Release Limitations Compared to BEST/1Limited batch modeling (no *BATCHJOB attribute)
Non-interactive transactions, CPU utilization, Disk utilization supported as with BEST/1
No modeling of individual storage pools
No configuration validation or recommendations
Limited RAID modeling details
No "release-level adjustment," CISC, "application-type," or individual communication line modeling
IBM eServer iSeries
© 2000-2003 IBM Corporation
Notes: Predict: First Release Limitations Comp. to BEST/1his foil shows known limitations in the first release of BMC Patrol - Predict.
The limited RAID and no IOP and IOA, recommendations, and configuration validation (you attempt to add a disk controller not supported on a specific iSeries system) are the most noticeable limitations. Please note that since V4R5 the hardware table used by BEST/1 for its configuration validation has not kept up with newer I/O attachments. As a result the BEST/1 configuration validation function was frequently not helpful.
The horizontal line separating the bottom limitations is used to indicate, very few BEST/1 users use these functions. So they are not considered important limitations.

IBM eServer iSeries
© 2000-2003 IBM Corporation
Patrol - Predict model componentsNetwork
Computers
Workloads
Transactions
Disks
Logical Volumes (Disk ASPs)
Plans
Reports
Charts
Logical Volumes

IBM eServer iSeries
© 2000-2003 IBM Corporation
Notes: Patrol - Predict model componentsThis foil shows the Predict navigation tree with the primary folder - components.
Note that the network component rolls all iSeries communication's data traffic-related information into a single network component - as if the system has one communications line.
In this example, CIRCUSREST is the model name. RESORT is the computer name.
You can see this model used the same "default workloads" that BEST/1 had: CLIENTAC4, INTERACTIV, NONINTER, and QDEFAULT.
Transactions have similar attributes as in BEST/1, such as CPU and disk I/Os and, within a workload containing 5250 jobs, you will see interactive transactions and non-interactive transactions (parts of total system activity apportioned to the INTERACTIV workload.
Plans is where you do the growth and other "what-if" processing.
Charts are graphic representation of the reports. The reports are a superset of the BEST/1 model analysis Results reports.

IBM eServer iSeries
© 2000-2003 IBM Corporation
Open Model
Evaluate Model
ViewResults
ViewCharts
Plan forFuture Growth
Patrol - Predict: the primary window

IBM eServer iSeries
© 2000-2003 IBM Corporation
Notes: Patrol - Predict: the primary window This foil shows the 5 categories of functions associated with each model.
In this example we have expanded Computers (RESORT), Workloads and Disks.
Under Disks you can see:JournalsDisks DD001-DD004 have exceeded a utilization guidelineDisks DD005 - DD010 are RAID protected disks (double disk icon)
At summary levels you can see that some guideline has been reached for the computer, Transactions, and Disks
In the task pad area, warning messages for each disk that has exceeded the threshold.
The guideline and threshold exceeded "indications" are the result of already completed an "analyze model" or "growth exercise."

IBM eServer iSeries
© 2000-2003 IBM Corporation
62.61
10068.33
2.76
2.64
Patrol - Predict: Example Workload Results
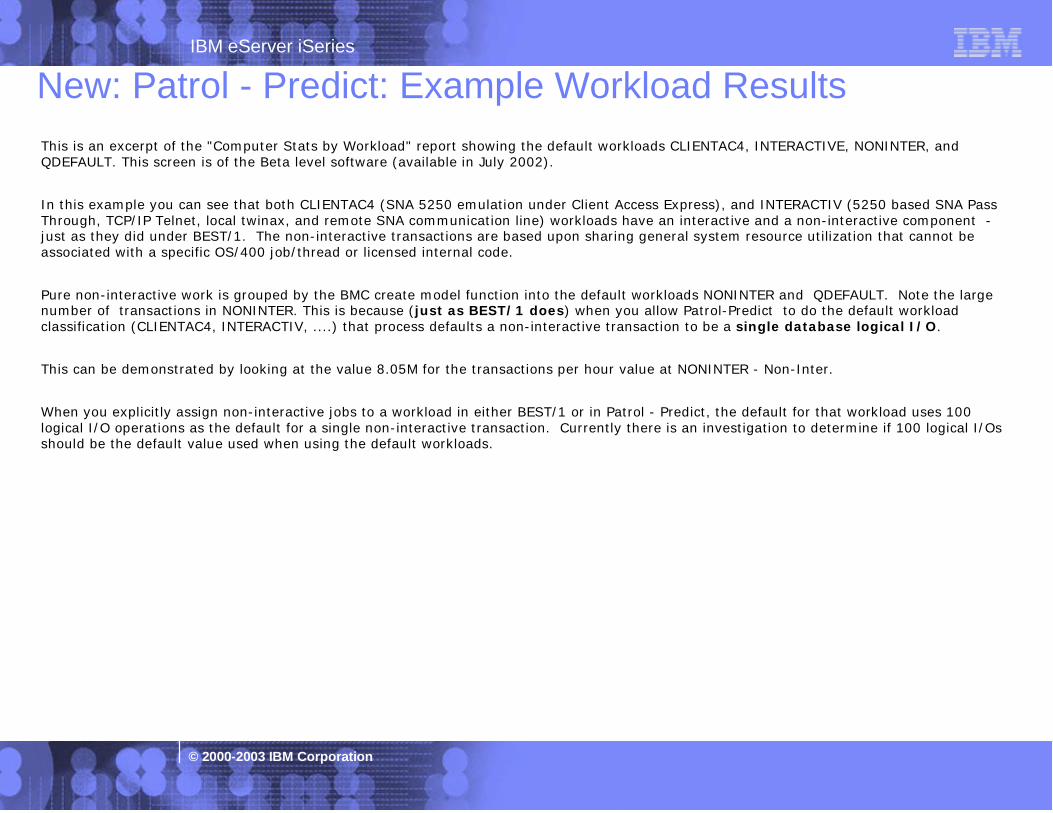
IBM eServer iSeries
© 2000-2003 IBM Corporation
New: Patrol - Predict: Example Workload ResultsThis is an excerpt of the "Computer Stats by Workload" report showing the default workloads CLIENTAC4, INTERACTIVE, NONINTER, and QDEFAULT. This screen is of the Beta level software (available in July 2002).
In this example you can see that both CLIENTAC4 (SNA 5250 emulation under Client Access Express), and INTERACTIV (5250 based SNA Pass Through, TCP/IP Telnet, local twinax, and remote SNA communication line) workloads have an interactive and a non-interactive component - just as they did under BEST/1. The non-interactive transactions are based upon sharing general system resource utilization that cannot be associated with a specific OS/400 job/thread or licensed internal code.
Pure non-interactive work is grouped by the BMC create model function into the default workloads NONINTER and QDEFAULT. Note the large number of transactions in NONINTER. This is because (just as BEST/1 does) when you allow Patrol-Predict to do the default workload classification (CLIENTAC4, INTERACTIV, ....) that process defaults a non-interactive transaction to be a single database logical I/O.
This can be demonstrated by looking at the value 8.05M for the transactions per hour value at NONINTER - Non-Inter.
When you explicitly assign non-interactive jobs to a workload in either BEST/1 or in Patrol - Predict, the default for that workload uses 100 logical I/O operations as the default for a single non-interactive transaction. Currently there is an investigation to determine if 100 logical I/Os should be the default value used when using the default workloads.

IBM eServer iSeries
© 2000-2003 IBM Corporation
Charts: Graphical representation of results

IBM eServer iSeries
© 2000-2003 IBM Corporation
Notes: Charts: Graphical representation of results This is an example of the Charts folder graphical view of CPU Utilization by workload. This uses the same model but a different computer (RESORT), which has 4 processors..

IBM eServer iSeries
© 2000-2003 IBM Corporation
Patrol - Predict: Manipulating the Computer example

IBM eServer iSeries
© 2000-2003 IBM Corporation
Notes: Patrol - Predict: Manipulating the Computer This is just one example showing you the current Computer's (TSI) CPU model, active processors, interactive percentage, and other parameter values, that you can change in your "what-if" exercise.
In the Properties window you can see the current computer is a 730 - 2066 (Processor CPW of 1050) with Interactive Feature 1508 (Interactive CPW of 240). In the lower right window we are in the processing of doing a "what-if" we changed the computer to an iSeries 830 with increased Processor CPW (1850) and Interactive CPW (1050).

IBM eServer iSeries
© 2000-2003 IBM Corporation
Additional tools, services

IBM eServer iSeries
© 2000-2003 IBM Corporation
Service offering for analyzing detailed performance bottlenecks
Picks up where other performance tool "point to"
Performance Explorer Trace-based tools driven by graphical workstation interface
Java Watcher
PTDV
iDoctor for iSeries

IBM eServer iSeries
© 2000-2003 IBM Corporation
Notes: iDoctor for iSeries You call on iDoctor for iSeries when the more commonly used iSeries performance tools are not able to identify the cause of a performance bottleneck.
In a generalized scenario you may Management Central monitors to identify high resource utilizations and the combination of Collection Services and the Performance Tools for iSeries, licensed product 5722-PT1 capabilities to identify high resource utilizations and point to jobs that appear to be related to the problem. At the job level you can use Performance Explorer (PEX) and the associated 5722-PT1 reports to zero in on programs within one or more jobs. In many cases all of these tools provide sufficient problem identification information.
When these tools cannot identify the problem the set of iSeries tools available under iDoctor need to be considered.
To access iDoctor for iSeries, perform the following from your browser:Enter http://www.ibm.com/eserver/iseries/support Select iSeries Tools -> Performance Analysis (iDoctor for iSeries)
iDoctor is both a service and a set of "detail level" performance tools (used by the service) for analyzing OS/400-provided Performance Explorer trace data, which includes a "higher than PEX trace data analyzer level" tool called Job Watcher.
Performance Explorer trace data (provided by OS/400) is "condensed" into summary reports and graphs to help isolate performance issues that other tools were not able to do for you.
The Basic Performance Assessment is a fee-based service. By clicking a web link, an IBM representative will contact you with a no obligation price quote to assess your business need. You can get a copy of the iDoctor support for a trial period. Consult the web site for details.

IBM eServer iSeries
© 2000-2003 IBM Corporation
iDoctor“plug in” service tools that Collect & Analyze iSeries run time performance data
PEX Analyzer
Job/System Watcher
iDoctor
JAVA Watcher…
iDoctor framework
PC Client framework that provides an end-user interface to iSeries plug-in Service Tools data analysis capabilities

IBM eServer iSeries
© 2000-2003 IBM Corporation
Notes: iDoctor framework iDoctor provides iSeries side "performance data collection" functions and a PC-side tool for analyzing the collected data. The data collected under iDoctor tools is separate from and independent of Collection Services performance data collection. Although you would not want to do it for extended periods of time both Collection Services and iDoctor performance data collection can be active at the same time.

IBM eServer iSeries
© 2000-2003 IBM Corporation
Real-time performance information for selected jobs, job threads, SLIC tasks
Picks up where Work with System Activity (WRKSYSACT) leaves offJob wait informationShows any SQL statements run information
Trigger threshold action to call a program or run an API
Job Watcher

IBM eServer iSeries
© 2000-2003 IBM Corporation
Notes: Job Watcher Job Watcher is a new iDoctor for iSeries service that includes a software tool that returns real-time information about a selected set of jobs, threads and/or SLIC tasks. The data is collected by a server job, stored in DB2/400 files, and displayed on a client via the dynamic, iDoctor for iSeries GUI. Job Watcher is similar in sampling function to the OS/400 Work with Active Jobs (WRKACTJOB) command and the Performance Tools for iSeries (5722PT1) licensed program Work with System Activity (WRKSYSACT) command.
Each window "refresh" computes delta information for the ending snapshot interval. Refreshes can be set to occur automatically, as frequently as every 50 milliseconds (not recommended during initial problem analysis). The Job Watcher takes advantage of patented technology that provides new job wait accounting information developed in V5R1 (some corresponding data appears in the V5R2 QAPMcccc performance database files) and therefore surfaces important job detail information not available with other performance collection data on the iSeries. The Job Watcher harvests the data from the jobs/threads/tasks being watched in a totally non-intrusive manner. The Job Watcher is available for systems running V5R1 level of OS/400 and is being tested for support with V5R2.
The "watch" data that is created by the tool is summarized in many different types of reports and graphs via the GUI client. The client provides a quick picture of what is happening on a per thread basis when multiple different threads are being watched. The user has the flexibility to select a job or an interval and then drill down for the details while the watch is in progress or after the watch has ended.
One of the details collected is information on each SQL statement ran during the monitoring period.
Somewhat like the Management Central System monitors and Job monitors, Job Watcher has a built-in trigger mechanism, which allows calls to API's or user programs based on predefined conditions. Prompt action can be taken for virtually any circumstance. These triggers are setup via the Job Watcher wizard included in the GUI workstation client.
The following shows how Job Watcher detailed performance information differs from other performance tools, such as Collection Services and the Performance Tools for iSeries, 5722-PT1 product.
Standard WRKSYSACT type info: CPU, DASD I/O breakdown, DASD space consumption, and so forth. Data currently only seen via Collection Services: "real" user name, seize time, breakdown of what types of waits (all waits) that occurred. Data not available anywhere else in real time: details on the current wait (duration, object, conflicting job information, specific SLIC block point id), 50 deep invocation stack including LIC stack frames, and even more information.

IBM eServer iSeries
© 2000-2003 IBM Corporation
Is there a problem?What potential for improvement is there?What areas would we have to address to improve performance?
the first step in detailed Performance Investigation
running waiting
DASDexample #1
Blocksexample #2
CPU Q’ingexample #3
Job Watcher - job or multiple jobs
*
* Blocks generically refer to instances such as object locks, table/file index locks, waits on message or data queues, and so forth

IBM eServer iSeries
© 2000-2003 IBM Corporation
Job Watcher - example - 1Job Run Time -- Resource Usage Signature
The job’s CPU use (red) and CPU (yellow) queuing was interrupted by occasional waits (light blue & green) and almost stopped by another wait (blue)

IBM eServer iSeries
© 2000-2003 IBM Corporation
Notes: Job Watcher - example - 1We are now viewing the run/wait components by 5 second intervals.
We can easily see that a dramatic change occurred in the signature at interval number 31.
Placing the cursor over the dark blue of interval 31 shows the description and amount of that component.
A right click on interval 31 shows a menu of options to inspect further details on interval 31.

IBM eServer iSeries
© 2000-2003 IBM Corporation
shows how time and resources are being spent
allows comparison with throughput (user work requests)
Expanded view - Logical I/O rates

IBM eServer iSeries
© 2000-2003 IBM Corporation
Job Watcher example - real time display of "blocks"
Job Watcher can show, in real time, what job/task was holding up the job’s throughput…and why!
JW Reports
Basic job statistics: Holding jobs/tasksObjects waited on:SQL statements

IBM eServer iSeries
© 2000-2003 IBM Corporation
Job Watcher modes
two modes of operation - JW (job specific) and JWsw (system wide)
JW - user selects the job(s) to watcha limit of up to 10 jobs/tasks or 500 threads per JW, multiple JWs can be started
JWsw - a "system wide" job watch one watch but over all jobs and tasks, or just jobs, or just tasksthe "action" for a JWsw "rule“ can be to start a JW over the "rule breaker"

IBM eServer iSeries
© 2000-2003 IBM Corporation
There are two ways to run the Job Watcher.
If you know what jobs you are interested in (the source of user complaints or where changes have been made, etc.) and you want to know more detail about the job characteristics, then you would likely start with the JW.
You can even use the Job Watcher's WRKSYSACT like feature to assist in locating the jobs (see if they are running or on job queues and their current status, if running).
On the other hand, if you don't know specific jobs (and the Job Watcher's WRKSYSACT like feature is not adequate in locating them), but you do know the general characteristics of the jobs that you're looking for, use the JWsw mode to look at all jobs running on the system for those specific characteristics.
In other words, a rule could be defined that would describe the characteristics of interest for any job. And, an action could be set up to call a short duration, detailed JW over the "rule breaker" job or the "holder" job of a blocked, "rule breaker" job.
Notes: Job Watcher modes

IBM eServer iSeries
© 2000-2003 IBM Corporation
Job Watcher modes - purposestwo specialties/purposes, both non-intrusive to the jobs being watched
JW - gather details user sets the frequency of snapshot taking and the options for the depth/type of detail to collect
JWsw - report exceptions/candidates user sets the options and rules to write exceptions, and if requested, all "active" and "blocked" jobs to DB files for real-time or post-watch inspection

IBM eServer iSeries
© 2000-2003 IBM Corporation
Notes: Job Watcher modes - purposesThe JW, or job-specific Job Watcher, is used for detail data drilling. The purpose is to take snapshots frequently. Since a lot of data can be retrieved per snapshot, a limit was set on the number of threads that can be watched during a job-specific watch. Even though there is a limit of 10 jobs and 500 threads, multiple Job Watches can be running at the same time.
The JWsw, or "system wide" Job Watch, was designed to watch and report on all jobs running on the system. The user can elect to record just exceptions or all jobs that use CPU resources or are "blocked" waiting for resources (or a software control point) during a snapshot interval. Idle jobs during the interval (jobs using no CPU and waiting for work) are not recorded to a DB file for that snapshot interval.
The user can specify what makes up an exception by defining rules that trigger a job to be written to the exception DB file. These files can be inspected either real-time or anytime during of after the watch.

IBM eServer iSeries
© 2000-2003 IBM Corporation
the user defined rules
JWsw - define what's an exception
- and direct what action should be taken (if any) write to a DB file
write to a DB file andcall a user command or a short duration JW over the current job (or holder if blocked)
JW - when to start collecting and
how long to collect
- or when to stop collecting andcall a user defined program
Job Watcher automation

IBM eServer iSeries
© 2000-2003 IBM Corporation
Notes: Job Watcher automationThere are rules that can act as triggers in both modes of the Job Watcher.
There is a rule wizard to assist the user in defining the rules for both modes.
The purpose of the rules is slightly different for each mode, however. For the job-specific version, rules can be set to start and stop job watch data collection.
In the system wide mode, the watch is always running and the rules are used to identify exceptions.
Rules can be assigned (or associated with) actions (optionally). An action could be to initiate a short duration JW over the current job (if the job is a "rule breaker", culprit type of job) or over the "holder" job if the current job is blocked (a victim) and the holder is known. Another action could be to call a user defined command.

IBM eServer iSeries
© 2000-2003 IBM Corporation
the "system wide" Job Watcherview, analyze any time during the watch
the job(s) of interest
1. startsystem wide Job
Watch
2. interval deltas
3. current statusat snapshot
actionstart a detailed, job-specific watch over
"rule breakers" or "holders"
5. actions
4. rules
file #2(all active/blocked)
file #1 (exceptions)
System wide Job Watcher example

IBM eServer iSeries
© 2000-2003 IBM Corporation
Notes: System wide Job Watcher exampleAs discussed the Job Watcher can be extended to watch all jobs running on the system using the non-intrusive, snapshot technology developed for the original Job Watcher. And we want to be able to view and analyze the data during and/or post collection.
When starting the system wide Job Watcher, you specify the number and duration of intervals to collect.
The Jobs of interest may not be known by name or time of execution. They could be victims or culprits. We will identify them by investigating their performance components or current status.
At each snapshot interval we'll check the performance components of all active or blocked jobs as well as the current status of the job at the time of the snapshot.
We can optionally record this information for all active and blocked jobs to a data base file. We can choose to just record the exceptions in order to reduce the volume of data that must be stored.
In addition rules can defined that trigger actions. The "rule break" job's will be logged in the exceptions DB file. If the "rule breaker" job was a victim of a blocked wait, the action could be to start automatically, another detailed, job-specific Job Watch over the "holder" job.
This is the end of the Job Watcher overview information. The next foil overviews PEX Analyzer.

IBM eServer iSeries
© 2000-2003 IBM Corporation
Real-time performance information for:Disk I/Os by thread, program, disk, ...Database logical I/Os by thread, program, file, library/file, ... DASD I/O response time Data Queue usageData Area usageFull database open and closesmore ....
PEX Analyzer

IBM eServer iSeries
© 2000-2003 IBM Corporation
Notes: PEX AnalyzerThe iDoctor for iSeries PEX Analyzer Service includes a software tool specifically geared towards pinpointing issues affecting system and application performance. The detailed analysis it provides picks up where the PM/400 and Performance Tools products leave off. It supplies a drill down capability that provides low-level summary of disk operations, CPU utilization, file opens, MI (Machine Interface) programs, wait states, DASD space consumption and much more.
The PEX Analyzer client allows a user to create, delete, copy, save, FTP, and analyze PEX collections and create, change or delete PEX definitions. The client allows the user to graphically display PEX collection data to help quickly identify performance problems.
Examples of some of the real-time performance information that can be collected and displayed include :Disk I/Os by thread, program, disk, ...Database logical I/Os by thread, program, file, library/file, ... DASD I/O response time Data Queue usageData Area usageFull database open and closes
This foil shows an example of disk I/Os by program according to disk I/O count and percentage of total disk I/Os for which performance data was collected.
Note, there is a 4 day class on "iDoctor Tools" - IBM Learning Services course code AS048: iSeries Advanced Performance Analysis Workshop. Contact John Harvey at [email protected]

IBM eServer iSeries
© 2000-2003 IBM Corporation
Performance Documentation and Web SitesV5R2 Performance Capabilities Reference
Available via public Web site, Adobe Acrobat Latest Java, WebSphere, Linux, MQSeries, DASD, Save/Restore ..internal test results and tips
Performance Monthly Newsletter and Website for IBMershttp://ca-web.rchland.ibm.com/perform/perfmenu.htm
Public Performance Management Web site for Customers and BPshttp://www.ibm.com/eserver/iseries/perfmgmtIncludes access to Performance Capabilities Reference manuals V5R2 - V4R3sizing tips, access to Workload Estimator, ...
Workload Estimator and PM eServer iSeries via Web sitehttp://www.ibm.com/eserver/iseries/support/estimatorhttp://www.ibm.com/eserver/iseries/pm400
iSeries performance management and using Performance Tools for iSeries, 5722-PT1http://www.ibm.com/eserver/iseries/infocenter
Systems management -> Performance
PM eServer iSeries (Performance Manager/400e)http://www.ibm.com/eserver/iseries/pm400/
Examples using iSeries Navigator performance management functionsManaging OS/400 with Operations Navigator V5R1: Performance Management, SG24-6565 (contains appendix on V5R2 functions)
V5R2

IBM eServer iSeries
© 2000-2003 IBM Corporation
Trademarks
8 IBM Corporation 1994-2002. All rights reserved.References in this document to IBM products or services do not imply that IBM intends to make them available in every country.The following terms are trademarks or registered trademarks of International Business Machines Corporation in the United States, other countries, or both:
cc:Mail, Domino.Doc, Freelance, LearningSpace, Lotus, Lotus Domino, Lotus Notes, iNotes, QuickPlace, Sametime, and Word Pro are trademarks of Lotus Development Corporation in the United States, other countries, or both.Tivoli and NetView are trademarks of Tivoli Systems Inc. in the United States, other countries, or both.C-bus is a trademark of Corollary, Inc. in the United States, other countries, or both. Java and all Java-based trademarks and logos are trademarks or registered trademarks of Sun Microsystems, Inc. in the United States, other countries, or both. Microsoft, Windows, Windows NT, and the Windows logo are trademarks of Microsoft Corporation in the United States, other countries, or both. PC Direct is a trademark of Ziff Communications Company in the United States, other countries, or both and is used by IBM Corporation under license. ActionMedia, LANDesk, MMX, Pentium and ProShare are trademarks of Intel Corporation in the United States, other countries, or both. IBM's VisualAge products and services are not associated with or sponsored by Visual Edge Software, Ltd.Linux is a registered trademark of Linus Torvalds.UNIX is a registered trademark of The Open Group in the United States and other countries.SET and the SET Logo are trademarks owned by SET Secure Electronic Transaction LLC. Other company, product and service names may be trademarks or service marks of others.
Information is provided "AS IS" without warranty of any kind.
All customer examples described are presented as illustrations of how those customers have used IBM products and the results they may have achieved. Actual environmental costs and performance characteristics may vary by customer.Information in this presentation concerning non-IBM products was obtained from a supplier of these products, published announcement material, or other publicly available sources and does not constitute an endorsement of such products by IBM. Sources for non-IBM list prices and performance numbers are taken from publicly available information, including vendor announcements and vendor worldwide homepages. IBM has not tested these products and cannot confirm the accuracy of performance, capability, or any other claims related to non-IBM products. Questions on the capability of non-IBM products should be addressed to the supplier of those products.All statements regarding IBM future direction and intent are subject to change or withdrawal without notice, and represent goals and objectives only. Contact your local IBM office or IBM authorized reseller for the full text of the specific Statement of Direction.Some information in this presentation addresses anticipated future capabilities. Such information is not intended as a definitive statement of a commitment to specific levels of performance, function or delivery schedules with respect to any future products. Such commitments are only made in IBM product announcements. The information is presented here to communicate IBM's current investment and development activities as a good faith effort to help with our customers' future planning. Performance is based on measurements and projections using standard IBM benchmarks in a controlled environment. The actual throughput or performance that any user will experience will vary depending upon considerations such as the amount of multiprogramming in the user's job stream, the I/O configuration, the storage configuration, and the workload processed. Therefore, no assurance can be given that an individual user will achieve throughput or performance improvements equivalent to the ratios stated here.Photographs shown are of engineering prototypes. Changes may be incorporated in production models.
400 BRMS Host Integration Series JustMail Payment Manager Stylized ADSTAR Client Series Host on Demand MQSeries Payment Server SystemViewAdvanced Function Printing ClusterProven Host Publisher MQSeries Integrator PCOM VisualAge for JavaAFP CODE/400 HTTP Server for AS/400 Net.Commerce PowerPC VisualAge for RPGAIX DataGuide IBM Net.Data PowerPC AS WebSphereAnyNet DB2 IBM Logo Netfinity Print Service Facility WebSphere Advanced EditionApplication Development DB2 Extenders IBM Network Station NetView pSeries WebSphere Commerce SuiteAPPN DB2 UDB for AS/400 Information Warehouse NUMA-Q PSF WebSphere Development Tools for AS/400AS/400 DB2 Universal Integrated Language Environment OfficeVision S/390 WebSphere Standard EditionAS/400e e-business logo Intelligent Printer Data Stream OS/2 San Francisco WorkpadAT e(logo) Server, IPDS Operating System/400 Screen Publisher xSeriesBrioQuery Enterprise Storage Server iSeries OS/400 SmoothStart