January 2017 - Richmond Valley Council · to 16 January 2017 ... One is located in Salty Lagoon at...
15
Salty Lagoon Monitoring: Pre-Post Closure of Artificial Channel Project Management and Ecosystem Health Report January 2017 PO Box 119 Lennox Head NSW 2478 T 02 6687 7666 PO Box 1446 Coffs Harbour NSW 2450 T 02 6651 7666 [email protected] Prepared for: Richmond Valley Council © GeoLINK, 2017
Transcript of January 2017 - Richmond Valley Council · to 16 January 2017 ... One is located in Salty Lagoon at...

Salty Lagoon M o n i t o r i n g : P r e - P o s t C l o s u r e o f
A r t i f i c i a l C h a n n e l Project Management and Ecosystem Health Report
January 2017
PO Box 119 Lennox Head NSW 2478
T 02 6687 7666
PO Box 1446 Coffs Harbour NSW 2450
T 02 6651 7666
Prepared for: Richmond Valley Council © GeoLINK, 2017

UPR Description Date Issued Issued By 1731-1239 First issue 02/03/2017 David Andrighetto

Salty Lagoon Project Management & Ecosystem Health Monthly Report, January 2017 i 1731-1239
Table of Contents
1. Introduction 1 2. Methodology 2
2.1 Discrete Sampling 2 2.2 Permanent Water Quality Monitoring Stations 2
3. Results 5
3.1 Water Quality Samples 5 3.2 Permanent Water Quality Monitoring Stations 5
4. Discussion 8
4.1 Water Quality 8 4.2 Other Observations 9 4.3 Adaptive Management Response 9
5. Key Points 10
Illustrations Illustration 2.1 Discrete Water Sampling Site Locations ...................................................................... 4 Illustration 3.1 Salty Lagoon Rainfall and Water Quality Monitoring Station Data 7 December 2016
to 16 January 2017 ........................................................................................................ 6 Illustration 3.2 Salty Creek Rainfall and Water Quality Monitoring Station Data 7 December 2016
to 16 January 2017 ........................................................................................................ 7 Illustration 4.1 TN Concentrations at all Sites Since January 2016 Plotted against the Salty Lagoon
Guiding Value ................................................................................................................ 9 Illustration 4.2 TP Concentrations at all Sites Since January 2016 Plotted against the Salty Lagoon
Guiding Value ................................................................................................................ 9
Tables Table 2.1 Locations of Water Quality Sample Sites in Salty Lagoon and Salty Creek (WGS84) ..... 2 Table 2.2 YSI Sonde Status on 16 January 2017 ............................................................................. 3 Table 3.1 Results of Discrete Samples Collected 16 January 2017 ................................................. 5
Plates Plate 5.1 The closed entrance to Salty Creek on 16 January 2017 ............................................... 10 Plate 5.2 A Black-necked Stork on the edge of Salty Lagoon ........................................................ 10

Salty Lagoon Project Management & Ecosystem Health Monthly Report, January 2017 1 1731-1239
Introduction 1.The following report provides an evaluation of the continuously recorded and discrete sample data collected from Salty Lagoon and Salty Creek as part of the Salty Lagoon Ecosystem Recovery Monitoring Program; Pre-Post Closure of Artificial Channel (MPPC) (Hydrosphere Consulting 2010).
This report is for the monitoring period 7 December 2016 to 16 January 2017.

Salty Lagoon Project Management & Ecosystem Health Monthly Report, January 2017 2 1731-1239
Methodology 2.2.1 Discrete Sampling
The site visit, including routine maintenance of permanent water quality monitoring stations and discrete water quality sampling, was undertaken on 16 January 2016. Water quality samples were collected between the hours of 9:30 am and 12:30 pm on that day. A high tide of 1.76 metres was forecast for 12.59 pm.
Discrete water quality samples were taken from surface water (approx. depth of 0.2 metres) at four sites in Salty Lagoon and a single site (S5) in Salty Creek. An additional quality assurance (QA) replicate sample was collected at S3. The specific locations of all sites sampled are presented in Table 2.1 and displayed in Illustration 2.1.
Table 2.1 Locations of Water Quality Sample Sites in Salty Lagoon and Salty Creek (WGS84)
Site S 1 S 2 S 3 S 4 S 5 Eastings 0542064 0541799 0542037 0541738 0542187 Northings 6782801 6782669 6783013 6783033 6783665 Site Description
Lagoon monitoring station
SE of Drainage Channel
NE area of lagoon
NW area of lagoon
Creek monitoring station
Physico-chemical water quality parameters were measured with an HORIBA U-52 hand held water quality meter. Samples were collected from the surface, and at depth intervals of one metre where water levels allowed.
Samples were collected in jars for analysis of chemical and biological parameters at the Coffs Harbour Laboratory (CHL). Sterile jars were used for collection of samples for bacteriological analysis and brown glass jars were used for collection of samples for analysis of chlorophyll-a and blue green algal (BGA) content. Samples were placed upon ice in an esky and delivered to CHL on the following day.
In addition to water quality samples, photos were taken showing the environment to the north, east, south and west of each water quality sample site. An additional photo monitoring site is located on the in-filled artificial channel.
2.2 Permanent Water Quality Monitoring Stations
There are two permanent water quality monitoring stations (PWQMS) in place for the duration of the MPPC, measuring water level, temperature, pH, conductivity, turbidity and dissolved oxygen (DO) concentrations. One is located in Salty Lagoon at S1 and one in Salty Creek at S5. Data from the PWQMS is sent to a Richmond Valley Council (RVC) server via a telemetry system. This data was accessed once during the reporting period, checked for errors and outlying data, and incorporated into a database for the current reporting period. The water level data was adjusted, using surveyed levels of the measuring boards, prior to being included in this report so that levels could be reported relative to Australian Height Datum (AHD).
Salty Lagoon Project Management & Ecosystem Health Monthly Report, January 2017 3 1731-1239
Routine maintenance of the permanent water quality monitoring stations involved the following steps:
■ Removal of the YSI sondes from their protective sleeve to remove built up fouling;■ Check the integrity of the dissolved oxygen (DO) membrane and turbidity wiper mechanism;■ Check all connections for signs of corrosion or leaks;■ Check the desiccant capacity;■ Visual check of modem function; and■ Remove the sonde from Salty Creek and replace with a spare, serviced and calibrated sonde.
The status of the three YSI sondes on 16 January 2017 is displayed in Table 2.2.
Climate information was sourced from the Evans Head bombing range weather station on the Bureau of Meteorology website (BoM 2017). Evans Head Sewage Treatment Plant (STP) facility routine sampling information was provided by RVC, as was data from the PWQMS.
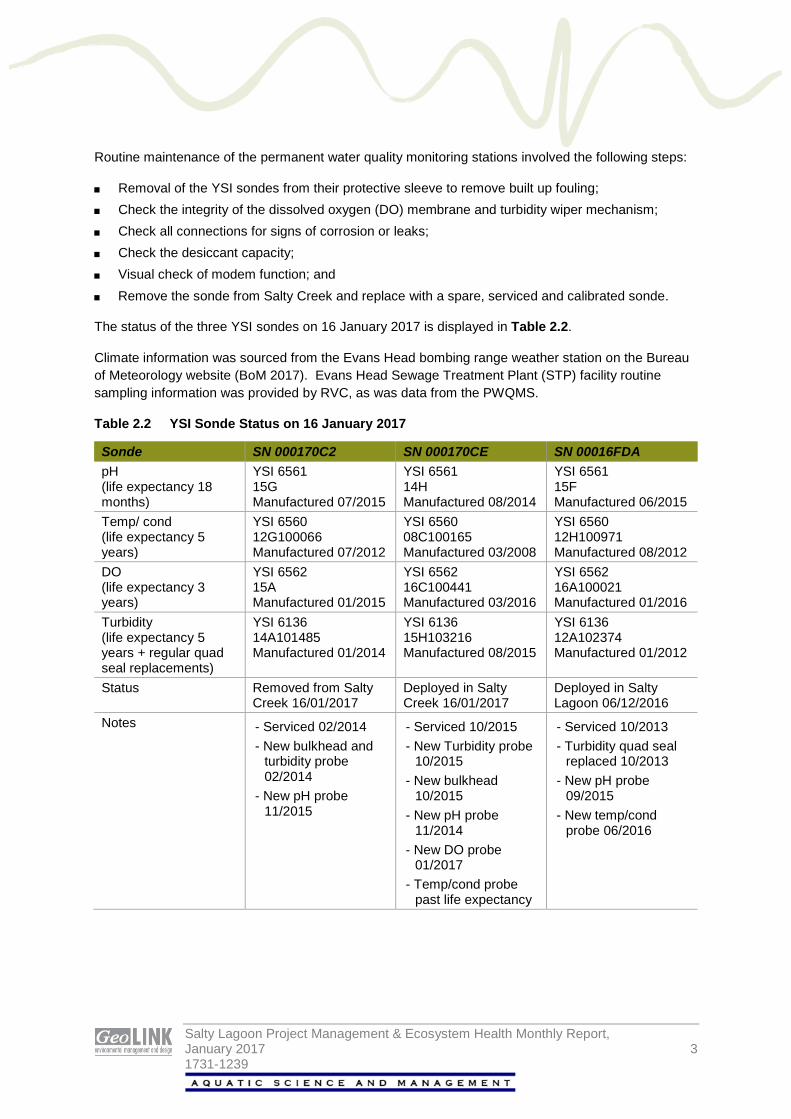
Table 2.2 YSI Sonde Status on 16 January 2017
Sonde SN 000170C2 SN 000170CE SN 00016FDA pH (life expectancy 18 months)
YSI 6561 15G Manufactured 07/2015
YSI 6561 14H Manufactured 08/2014
YSI 6561 15F Manufactured 06/2015
Temp/ cond (life expectancy 5 years)
YSI 6560 12G100066 Manufactured 07/2012
YSI 6560 08C100165 Manufactured 03/2008
YSI 6560 12H100971 Manufactured 08/2012
DO (life expectancy 3 years)
YSI 6562 15A Manufactured 01/2015
YSI 6562 16C100441 Manufactured 03/2016
YSI 6562 16A100021 Manufactured 01/2016
Turbidity (life expectancy 5 years + regular quad seal replacements)
YSI 6136 14A101485 Manufactured 01/2014
YSI 6136 15H103216 Manufactured 08/2015
YSI 6136 12A102374 Manufactured 01/2012
Status Removed from Salty Creek 16/01/2017
Deployed in Salty Creek 16/01/2017
Deployed in Salty Lagoon 06/12/2016
Notes - Serviced 02/2014 - New bulkhead and
turbidity probe 02/2014
- New pH probe 11/2015
- Serviced 10/2015 - New Turbidity probe
10/2015 - New bulkhead
10/2015 - New pH probe
11/2014 - New DO probe
01/2017 - Temp/cond probe
past life expectancy
- Serviced 10/2013 - Turbidity quad seal
replaced 10/2013 - New pH probe
09/2015 - New temp/cond
probe 06/2016

!(
!(
!(
!(
!(
Salty Lagoon
Closed artificial channel (closed June 2012)
Salty Creek entrance
Salty Creek
Broadwater Road
Drainage line
Evans Head Transfer Station
S5
S4
S2
S1
S3
0 200
Salty Lagoon Project Management & Ecosystem Health Monthly Report, January 2017 1731-1118
IllustrationLocation of Water Quality Sites
North 2.1
Drawn by: TJP Checked by: MVE Reviewed by: GJM Date: August 2014Source of base data: Richmond Valley CouncilInformation shown is for illustrative purposes only
L E G E N D !( S1!( S2!( S3!( S4!( S5

Salty Lagoon Project Management & Ecosystem Health Monthly Report, January 2017 5 1731-1239
Results 3.3.1 Water Quality Samples
Results of the water quality monitoring undertaken on 16 January 2017 are reported in Table 3.1.
Table 3.1 Results of Discrete Samples Collected 16 January 2017
Parameter S1 S2 S3
S3* (QA)
S4 S5
Blue Green Algae ID (cells/mL) Nil Nil Nil Nil Nil Nil Nitrite Nitrogen (mg/L) <0.01 <0.01 <0.01 <0.01 - <0.01 Nitrate Nitrogen (mg/L) <0.01 <0.01 <0.01 <0.01 - <0.01 Oxidized Nitrogen (mg/L) <0.01 <0.01 <0.01 <0.01 - <0.01 Ammonia Nitrogen (mg/L) <0.01 0.034 <0.01 <0.01 - <0.01 Total Kjeldahl Nitrogen (mg/L) 2.65 5.16 2.6 2.54 - 0.71 Total Nitrogen (mg/L) 2.65 5.16 2.6 2.54 - 0.71 Total Phosphorus(mg/L) 0.08 1.71 0.08 0.07 - <0.03 Orthophosphate (mg/L) <0.01 1.3 <0.01 <0.01 - <0.01 Chlorophyll-a (µg/L) 15 4 14 14 - 17 Enterococcus (CFU/100mL) 10 645 0 0 - 0 Faecal Coliforms (CFU/100mL) 45 10 25 15 - 1600 Temp (˚C) 26.99 27.13 27 ns - 27.41 pH 7.6 8.2 7.77 ns - 7.17 ORP (mV) 152 161 140 ns - 145 Cond (mS/cm) 1.13 1.25 1.11 ns - 48.2 Turbidity (NTU) 9.1 15.6 7.7 ns - 0.6 DO (mg/L) 8.13 9.79 8.86 ns - 4.37 DO (% sat) 103.7 125.1 113 ns - 67.2 TDS (mg/L) 0.723 0.8 0.71 ns - 29.4 Sal (ppt) 0.6 0.6 0.5 ns - 31.5
Depth (m) Surface Surface Surface Surface No Sample Surface
Note: * = randomly selected quality assurance sample. red text = not compliant with MPPC guiding values (see GeoLINK 2012). levels below detection limits will be incorporated into databases as 0 for the purpose of statistical analyses. TNTC = Too numerous to count, and will be assigned a numerical value for later statistical analyses.
3.2 Permanent Water Quality Monitoring Stations
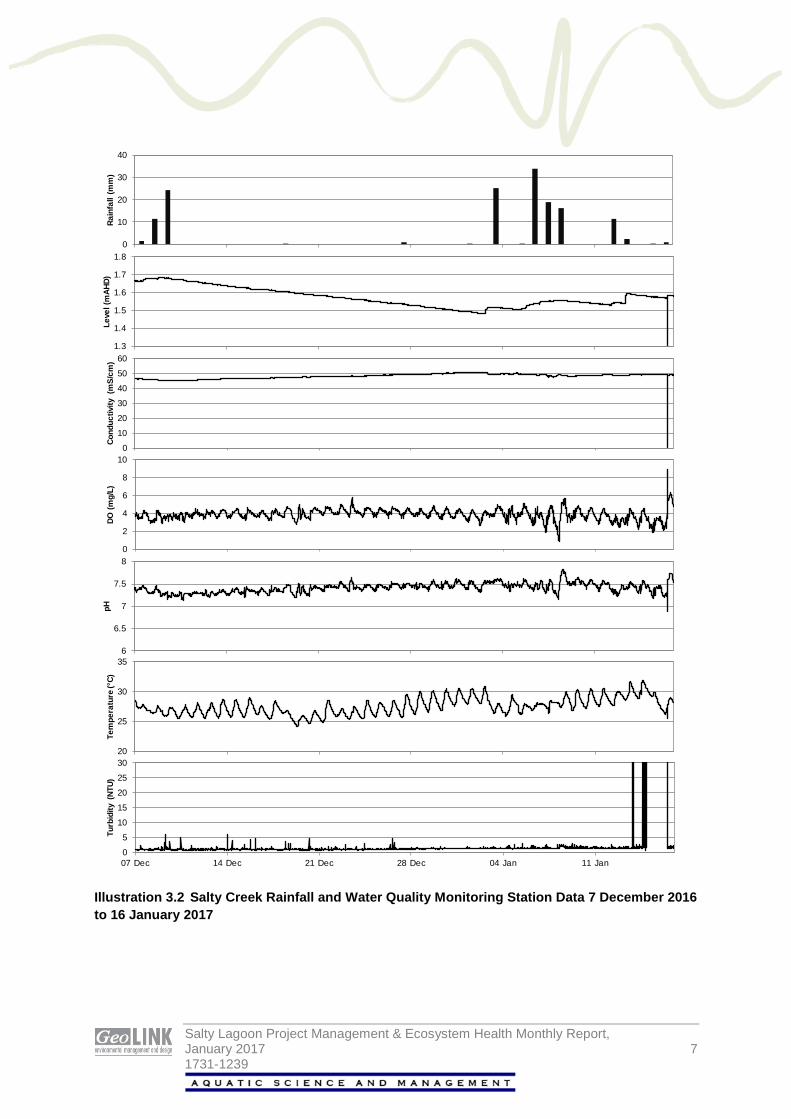
The data collected by the permanent water quality monitoring stations, and rainfall data correlating to the same period are presented in Illustration 3.1 and Illustration 3.2.

Salty Lagoon Project Management & Ecosystem Health Monthly Report, January 2017 6 1731-1239
Illustration 3.1 Salty Lagoon Rainfall and Water Quality Monitoring Station Data 7 December 2016 to 16 January 2017
0
10
20
30
40
Rain
fall
(mm
)
1.3
1.4
1.5
1.6
1.7
Leve
l (m
AHD)
0
0.2
0.4
0.6
0.8
1
1.2
Cond
uctiv
ity (
mS/
cm)
0
2
4
6
8
10
DO (m
g/L)
6
6.5
7
7.5
8
pH
20
25
30
35
40
Tem
pera
ture
(°C)
0
5
10
15
20
25
30
07 Dec 14 Dec 21 Dec 28 Dec 04 Jan 11 Jan
Turb
idity
(NT
U)
Salty Lagoon Project Management & Ecosystem Health Monthly Report, January 2017 7 1731-1239
Illustration 3.2 Salty Creek Rainfall and Water Quality Monitoring Station Data 7 December 2016 to 16 January 2017
0
10
20
30
40
Rain
fall
(mm
)
1.3
1.4
1.5
1.6
1.7
1.8
Leve
l (m
AHD)
0
10
20
30
40
50
60
Cond
uctiv
ity (
mS/
cm)
0
2
4
6
8
10
DO (m
g/L)
6
6.5
7
7.5
8
pH
20
25
30
35
Tem
pera
ture
(°C)
0
5
10
15
20
25
30
07 Dec 14 Dec 21 Dec 28 Dec 04 Jan 11 Jan
Turb
idity
(NT
U)

Salty Lagoon Project Management & Ecosystem Health Monthly Report, January 2017 8 1731-1239
Discussion 4.4.1 Water Quality
This reporting period was the fifth in succession to be drier than average. There were several small and moderate rainfall events but water levels in both Salty Lagoon and Salty Creek were lower at the end of the reporting period than at the start. Water levels in Salty Lagoon were very low at the time of the site inspection and conductivity at the Salty Lagoon PWQMS increased throughout the reporting period, indicating that evaporation was a key driver of changes in water quality since the last month. The water levels were so low that there was no water to sample at site S4. The water level in Salty Creek reduced overall throughout the reporting period. The entrance to Salty Creek was closed at the beginning of the reporting period and at the time of the site inspection on 16 January 2017 and appears to have been closed for the interim period. There was no drainage from Salty Lagoon into Salty Creek during this reporting period because of low water levels.
Conductivity measurements from the Salty Lagoon PWQMS increased slightly during this reporting period as a result of evaporation exceeding precipitation. The measurements from the Salty Creek PWQMS show that evaporation increased the conductivity slightly and that rainfall had little impact. The conductivity measurements from discrete samples collected on 16 January 2017 complied with guiding values at all sites in Salty Lagoon, but not in Salty Creek.
Dissolved oxygen measurements from the Salty Lagoon PWQMS fluctuated mostly in response to light availability for the majority of the reporting period. The strength of the observed fluctuations is likely to be associated with increased algal activity, which changes from photosynthesis (O2 production) in the day to respiration (O2 consumption) at night. At the Salty Creek PWQMS the DO concentrations fluctuated increasingly in response to light availability as the reporting period progressed, indicating an increasingly stable saline environment. The DO concentrations in discrete samples collected on 16 January 2017 complied with guiding values at all sites with the exception of S5. The low DO concentration measured at S5 reflects the natural changes to the system resulting from the highly saline environment.
Many of the total nutrient concentrations measured on 16 January 2017 did not comply with guiding values. The TN concentrations at all sites in Salty Lagoon and the TP and orthophosphate concentrations at the western site in Salty Lagoon all increased significantly in comparison with last month’s results (Illustration 4.1 and Illustration 4.2). The key influence on increased nutrients, particularly TN concentrations, was evaporation. Interestingly, the chlorophyll-a concentrations decreased at most sites in comparison with last month and complied with guiding values at one of the four sites sampled. At S1, S3 and S5, where the chlorophyll-a concentrations did not comply with guiding values, they indicated low level algal blooms. There were no blue-green algae detected in any samples.
The temperature measurements at all Salty Lagoon sites, and the pH measurements from all sites, did not comply with guiding values this month. The normally high temperatures measured at this time of year are exacerbated by low water levels and more concentrated tannins and the unusually high pH measurements are associated with evaporation and low levels of catchment inputs.

Salty Lagoon Project Management & Ecosystem Health Monthly Report, January 2017 9 1731-1239
Illustration 4.1 TN Concentrations at all Sites since January 2016 plotted against the Salty Lagoon Guiding Value
Illustration 4.2 TP Concentrations at all Sites since January 2016 plotted against the Salty Lagoon Guiding Value
4.2 Other Observations
The entrance to Salty Creek was closed on 16 January 2017 (Plate 5.1). The growth of Pacific Azolla (Azolla filiculoides) and Duckweed (Lemna sp.) on the water surface in the western part of Salty Lagoon was negligible again this month. The headcut located to the east of the in-filled artificial channel was also relatively stable during this reporting period (no photos this month).
4.3 Adaptive Management Response
No adaptive management response was required during this reporting period.
0123456789
TN (m
g/L) S1
S2
S3
S4
S5
GV
00.20.40.60.8
11.21.41.61.8
TP (m
g/L) S1
S2
S3
S4
S5
GV

Salty Lagoon Project Management & Ecosystem Health Monthly Report, January 2017 10 1731-1239
Key Points 5.1. Water levels in Salty Lagoon have continued to drop and were very low at the time of the site visit.
Site S4 was dry and no water sample was collected from there. 2. Total nutrient concentrations increased in comparison to last month. TN concentrations increased
and did not comply with guiding values at any sites in Salty Lagoon. The TN concentration at S2 was extremely high. The TP concentration at S2 was also extremely high.
3. Chlorophyll-a concentrations did not comply with guiding values at any sites except S2. The chlorophyll-a concentrations from the open water sites in Salty Lagoon were typical of a low level algal bloom. No blue-green algae were detected in any samples.
4. The erosive headcut to the east of the old channel between Salty Lagoon and Salty Creek was stable.
Plate 5.2 A Black-necked Stork on the edge of Salty Lagoon
Plate 5.1 The closed entrance to Salty Creek on 16 January 2017

Salty Lagoon Project Management & Ecosystem Health Monthly Report, January 2017 11 1731-1239
References Bureau of Meteorology (2017). http://www.bom.gov.au/. Accessed 4/02/2017
GeoLINK (2011). Salty Lagoon Monitoring: Pre-Post Closure of Artificial Channel – Project Management and Ecosystem Health Monthly Report – November 2011. Report to Richmond Valley Council.
GeoLINK (2012). Salty Lagoon Monitoring: Pre-Post Closure of Artificial Channel – Project Management and Ecosystem Health Monthly Report – September 2012. Report to Richmond Valley Council.
GeoLINK (2014). Salty Lagoon Monitoring: Pre-Post Closure of Artificial Channel – Annual Report 2014. Report to Richmond Valley Council.
Hydrosphere Consulting (2010). Salty Lagoon Monitoring Program Pre/Post Closure of the Artificial Channel. Report to Richmond Valley Council.

Salty Lagoon Project Management & Ecosystem Health Monthly Report, January 2017 12 1731-1239
Copyright and Usage GeoLINK, 2017
This document, including associated illustrations and drawings, was prepared for the exclusive use of Richmond Valley Council. It is not to be used for any other purpose or by any other person, corporation or organisation without the prior consent of GeoLINK. GeoLINK accepts no responsibility for any loss or damage suffered howsoever arising to any person or corporation who may use or rely on this document for a purpose other than that described above.
This document, including associated illustrations and drawings, may not be reproduced, stored, or transmitted in any form without the prior consent of GeoLINK. This includes extracts of texts or parts of illustrations and drawings.