Janet Currie Princeton University and NBER Maya Rossin...
50
1 Weathering the Storm: Hurricanes and Birth Outcomes Janet Currie Princeton University and NBER Maya Rossin-Slater Columbia University March, 2012 We are grateful for financial support from the MacArthur Foundation. We thank seminar participants at Princeton University, UCLA, and Duke for helpful comments. We also thank Janice Jackson, Steven Lowenstein, Gene Willard, and the Committee on Requests for Personal Data (CORPD) at the Texas Department of State Health Services for access to the data. The project described was supported by Award Number R24HD058486 from the Eunice Kennedy Shriver National Institute of Child Health & Human Development. The content is solely the responsibility of the authors and does not necessarily represent the official views of the Eunice Kennedy Shriver National Institute of Child Health & Human Development or the National Institutes of Health. We are solely responsible for all views expressed.
Transcript of Janet Currie Princeton University and NBER Maya Rossin...

1
Weathering the Storm: Hurricanes and Birth Outcomes
Janet Currie
Princeton University and NBER
Maya Rossin-Slater
Columbia University
March, 2012
We are grateful for financial support from the MacArthur Foundation. We thank seminar participants at Princeton University, UCLA, and Duke for helpful comments. We also thank Janice Jackson, Steven Lowenstein, Gene Willard, and the Committee on Requests for Personal Data (CORPD) at the Texas Department of State Health Services for access to the data. The project described was supported by Award Number R24HD058486 from the Eunice Kennedy Shriver National Institute of Child Health & Human Development. The content is solely the responsibility of the authors and does not necessarily represent the official views of the Eunice Kennedy Shriver National Institute of Child Health & Human Development or the National Institutes of Health. We are solely responsible for all views expressed.

2
Abstract
A growing literature suggests that stressful events in pregnancy can have negative effects on birth outcomes. Some of the estimates in this literature may be affected by small samples, omitted variables, endogenous mobility in response to disasters, and errors in the measurement of gestation, as well as by a mechanical correlation between longer gestation and the probability of having been exposed. We use millions of individual birth records to examine the effects of exposure to hurricanes during pregnancy. The data allow us to measure outcomes precisely and to follow the same mother over time; we also suggest estimation methods that correct for omitted unobserved fixed characteristics of the mother, endogenous moving in response to storms, and the above mentioned correlation between gestation length and exposure. We find that exposure to a hurricane during pregnancy increases the probability of complications of labor and delivery, and of abnormal conditions of the newborn such as being on a ventilator more than 30 minutes and meconium aspiration syndrome. Although we do not directly measure stress, our results are supportive of the idea that stressful events in pregnancy can damage the health of the fetus. However our results suggest that the effects may be subtle and not readily apparent in terms of widely-used metrics such as birth weight and gestation.

3
Health at birth is predictive of important child outcomes including educational attainment
and adult earnings. Hence, economists are increasingly concerned with understanding the
impacts of conditions during pregnancy on birth outcomes.1 One intriguing hypothesis is that
stress during pregnancy could have negative effects on the fetus through neuroendocrine
changes, changes in immune function, and/or through behavioral channels (Denckel-Schetter,
2011). Extreme weather events represent an unpredictable and unusual source of stress during
pregnancy.
This paper analyzes the effects of severe storms and hurricanes on birth outcomes in
Texas over the period 1996 to 2008. In principal, hurricanes could also subject pregnant women
to other negative conditions including injury, disruptions in the supply of clean water, inadequate
access to safe food, exposure to environmental toxins, interruption of healthcare, or crowded
conditions in shelters (Callaghan et al. (2007)). However, in the U.S., with the notable exception
of hurricane Katrina, such direct threats to health from hurricanes affect only very small numbers
of people. The primary threat to pregnant women in the path of a hurricane is the stress that is
generated by the fear of the hurricane, as well as by the property damage and disruption that
follows it.
The existing empirical literature on disasters and infant health is generally limited to
studies comparing birth outcomes before and after a disaster in the area of occurrence (Glynn et
al. (2001); Lauderdale (2006); Eskenazi et al. (2007); Simeonova (2009); Tan et al. (2009),
Eccleston (2011)). Such comparisons can be problematic if people respond to disasters by
moving. For example, if more disadvantaged and less healthy mothers are more likely to be
displaced by a disaster (or to have pregnancy losses), then estimates of the adverse effects will be
1 Black, Devereux, and Salvanes (2007) offer some of the most convincing evidence in this regard. See Currie (2011) and Almond and Currie (2010, 2011) for surveys of this literature.

4
biased towards zero due to the positive selection of mothers into the post-disaster sample.
Alternatively, it might be the case that mothers with greater resources in terms of income and
education are more likely to be able to move out of a devastated area.
Additionally, many previous studies are based on very small samples and use self-
reported measures of stress exposure, which could exacerbate measurement error bias. A third
issue is that many previous studies count exposure backwards from the date of birth rather than
forwards from the date of conception. Such a procedure could bias the estimated relationship
between exposure to the stressful event, gestation, and other outcomes that depend on gestation
length. A related issue is that there is a mechanical correlation between length of gestation and
the probability of having been exposed to a disaster in the third trimester of pregnancy. Given
these issues, the existing literature is limited in its ability to identify the effects of disasters on
birth outcomes.
We use a confidential version of all Texas birth records from 1996 to 2008 with
information on mothers’ names, dates of birth, and residential addresses. This information allows
us to link siblings born to the same mother and to identify mothers who were in the path of all
major tropical storms and hurricanes using data from the Weather Underground Hurricane
Archive. We compare mothers who lived in the path of the hurricane to those who lived further
away, and use mother fixed effects to control for time-invariant maternal characteristics that
might be correlated both with residential location and birth outcomes.
Time varying characteristics of mothers may also be important, and one of the most
important time varying characteristics may be the mother’s residential location. A mother’s
decision to move between pregnancies may be affected by the hurricane, and thus confound
estimates from a maternal fixed effects model. The use of maternal fixed effects may also

5
exacerbate biases due to measurement error. Hence, in order account for both measurement error
and for the potential endogeneity of maternal residence, we adopt a maternal fixed effects-
instrumental variables strategy. Our instrument is an indicator for whether the mother would
have been close to a hurricane during the current pregnancy had she continued to live in the first
location in which we observe her. Since the first location in which we observe her is a fixed
characteristic of the mother, the first location itself does not have an independent effect on birth
outcomes in models that include maternal fixed effects. This instrument is highly correlated with
whether the mother was exposed during her current pregnancy, but should have no independent
effect on birth outcomes.
We also adopt two methods for eliminating the mechanical correlation between gestation
and exposure probabilities. One is to compute our instrument for the hypothetical case in which
each woman had 39 weeks gestation (rather than using her actual gestation length to compute the
instrument). The second is to estimate a discrete time hazard model.
In contrast to most previous studies, we find little evidence of a relationship between
exposure to a stressful event during pregnancy and gestation or birth weight. We do, however,
find that mothers living within 30 kilometers of the hurricane path during their third trimester are
60% more likely to have a newborn with abnormal conditions (including meconium aspiration
syndrome, and being on a ventilator more than 30 minutes), and 30% more likely to have any
complications during labor and/or delivery. These results are extremely robust to different
estimation strategies.
We find no placebo effects of exposure to hurricanes three or six months after birth,
which provides support for the validity of our identification strategy. We also find little
consistent evidence of effects on maternal behaviors including smoking, weight gain, and use of

6
prenatal care that could explain our findings. Further, our results suggest that the effects are not
due to changes in medical care which might be associated with the hurricane. We believe
therefore, that it may be reasonable to attribute the effects to stress during pregnancy. Our results
suggest that the effects of stress on fetal health, while important, may be more subtle than
previous research has suggested.
The rest of the paper proceeds as follows. Section I presents a review of the existing
literature, while Section II discusses the data, sample, and presents summary statistics. The
empirical methods are discussed in detail in Section III, while Section IV presents the main
results. Several robustness checks are presented in Section V, and Section VI concludes.
I. Background Literature
In a landmark study that was one of the first to consider the impacts of a natural disaster
on pregnant women, Glynn et al. (2001) analyze the effects of the 1994 earthquake in
Northridge, California, on 40 women who were pregnant or post-partum at that the time. The
authors find that exposure to the earthquake in the first trimester is correlated with shorter
gestation length. However, with such a small sample and the lack of a comparison group, these
findings require corroboration.
In more recent work, Xiong et al. (2008) consider the effects of exposure to Hurricane
Katrina during pregnancy on 300 women in New Orleans and Baton Rouge. The study uses self-
reported information on “severe hurricane experiences” which include “walking through
floodwaters”, “having a loved one die”, and “feeling that one’s life is in danger”, among others,
and estimates correlations between having three or more severe hurricane experiences and birth
outcomes. They find that women with high hurricane exposure were 3.3 times more likely to

7
have a low-birth-weight baby and 2.3 times more likely to have a preterm baby. However, as
other unobserved maternal characteristics may be associated both with the likelihood of severe
hurricane exposure and poor birth outcomes, it is difficult to interpret the findings as causal
effects.
In another recent study, Tan et al. (2009) analyze the impact of the 2008 earthquake in
Wenchuan, China, on birth outcomes. They find that exposure to the earthquake during
pregnancy was associated with lower birth weight, lower Apgar scores, and a higher likelihood
of a low-birth-weight or preterm birth and birth defects. Yet since the authors employ simple
bivariate regressions without controls and essentially compare outcomes before and after the
earthquake in two affected counties, their results may suffer from omitted variables bias.
Simeonova (2009) uses data on the universe of all births in the United States over 1968-
1988 and takes advantage of the variation in disaster incidence across counties and over time.
She controls for geographic variation in extreme weather events by including county fixed
effects and for seasonal effects by including year-by-month interactions. She finds that exposure
to a disaster during pregnancy increases the likelihood of a preterm birth by about 1.3%, but this
result is not robust across all specifications. The study still may suffer from endogeneity due to
women moving in response to a disaster.
Torche (2011) uses a method similar to Simeonova (2009) to study the effects of a major
2005 earthquake in Chile. She uses county-level variation in earthquake intensity and compares
birth outcomes in high- and low-intensity counties before and after the earthquake. She finds that
high exposure to the earthquake was associated with lower birth weight. However, the study does
not contain many of the standard robustness checks associated with difference-in-difference type
(such as including specifications with pre-trends and including county-specific time trends),
8
contains only one specification with county fixed effects, and does not cluster the standard errors
at the county level. Additionally, endogenous migration in response to the earthquake from high-
intensity counties may be an issue.
A related literature considers the effects of man-made disasters, such as terrorist attacks,
on pregnancy and birth outcomes. Camacho (2008) uses an identification strategy close to ours,
and exploits the variation in the number of landmine explosions in Colombia by municipality and
quarter over 1998-2003 on births using a maternal fixed effects design. She finds that living near
a landmine explosion during pregnancy reduces birth weight by approximately 9 grams.
However, similar to Simeonova (2009) and Torche (2011), the study does not account for the
potential endogeneity of migration between births in response to a landmine explosion.
The September 11 terrorist attacks are also widely studied in this literature. Most of the
work on this subject either compares birth outcomes of women who were near the World Trade
Center during their pregnancies with the outcomes of women in other locations (Berkowitz et al.
(2003); Lipkind et al. (2010)), or conducts a time-series-type analysis comparing birth outcomes
of women pregnant before and after 9/11 (Lederman et al. (2004); Eskenazi et al. (2007),
Eccleston (2011)). A concern with the first set of studies is that the comparison groups likely
also suffered from stress due to the September 11 attacks despite living further away, and thus
could also have experienced effects on birth outcomes. Some of the latter set of studies may
suffer from non-random selection. For example, children borne by mothers who were pregnant
during September may have different characteristics than children borne by mothers who were
pregnant in other months (Buckles and Hungerman (2008)). And since women may move (or
miscarry) in response to a disaster, one cannot assume that all of the New York City women who

9
were pregnant at the time of the disaster went on to deliver in New York City.2 Additionally, it is
difficult to separate out the effects of stress due to the September 11 attacks from the effects of
increased exposure to air toxins and to the effects of any other events occurring during the fall of
2001 in a time-series analysis. The results from this literature are mixed – some studies find
adverse effects on birth weight, birth length, gestation, and intrauterine growth restriction
(Lederman et al. (2004); Berkowitz et al. (2003); Eskenazi et al. (2007), Eccleston (2011)),
while others find no effects on birth outcomes (Lipkind et al. (2010)).
Lauderdale’s (2006) work is perhaps the most convincing in the large literature on the
September 11 attacks and birth outcomes. Using the universe of California birth records for
2000-2002 with information on mothers’ names, the author finds that women with Arab names
were 34% more likely to have a low-birth-weight baby and 1.5 times more likely to have a
preterm birth in the six months after 9/11 relative to women who gave birth between October
2000 and March 2001. She conducts the analysis separately by race and finds no effects for
whites, blacks, Hispanics, Asian/Pacific Islanders, or foreign-born women without Arab names.
The author attributes the effects to stress due to discrimination against individuals of Arabic
origin post-9/11.
Mansour and Rees (2011) examine the effect of the intensity of the Intifada-related
conflict in the West Bank and Gaza to guage the effect of stress during pregnancy on birth
outcomes. They find that increases in the number of conflict-related deaths are associated with
small increases in the incidence of low birth weight, though they are not entirely able to rule out
other channels, such as nutritional deprivation, and cannot measure maternal mobility.
2 Eccleston (2011) examines the effect of the disaster on the probability of fetal death and finds no effect. However, since she cannot follow women over time, she cannot control for selection due to maternal mobility.

10
Aside from these studies of exposure to disaster, there is a vast medical literature on the
effects of maternal stress during pregnancy. In a literature review of major studies over 1966-
2001, Mulder et al. (2002) report that pregnant women with high stress and anxiety levels are at
an increased risk for spontaneous abortion, preterm labor, low birth weight, and for having a
malformed or growth-restricted baby. Most of this research is concerned with traumatic events
such as the death of an older child or a husband, work load, or self-reported stress levels.
However, these findings cannot be interpreted as causal as they likely suffer from omitted
variables bias due to other factors that are correlated both with stress and birth outcomes (for
example, poverty or poor health). Also, in more recent studies, the evidence is mixed: Morland et
al. (2007) find no relationship between Post-Traumatic Stress Disorder symptoms during
pregnancy and birth outcomes in a small sample of women in Hawaii, while Glynn et al. (2008)
find that changes in self-reported stress levels during pregnancy are associated with changes in
the likelihood of a preterm birth. However, these studies are based on small and non-
representative samples of pregnant women and also suffer from concerns about omitted
variables.
Aizer, Stroud, and Buka (2009) improve on this literature by examining data from a large
study that took measures of the stress hormone cortisol during pregnancy. In maternal fixed
effects models, they find that in-utero exposure to cortisol has little effect on birth weight or the
probability of low birth weight. Nevertheless, infants exposed to high levels of cortisol during
pregnancy have significantly lower schooling attainment and verbal IQ scores and are more
likely to have a chronic health condition at age 7. Our results are broadly consistent with this
pattern in that we find small effects on birth weight, but significant effects on abnormal
conditions of the newborn, which may in turn be linked to poorer outcomes in later life.

11
Another important issue in the existing literature is that exposure to a natural disaster or a
terrorist attack is usually estimated by counting backwards from a child’s birth date. Specifically,
many studies place women giving birth in the months following a disaster into the treatment
group (Camacho (2008); Lauderdale (2006); Lipkind et al. (2010); Simeonova (2009); Tan et al.
(2009)). However, this method may overestimate the adverse effects of disasters on gestation
length and other outcomes correlated with gestation (such as birth weight) by characterizing the
exposure window as wider than it actually is for preterm births. To understand this issue more
concretely, consider for example all preterm children who were born after only 7 months of
gestation. By classifying exposure to a disaster in the 3 months prior to birth as 3rd trimester
exposure, we will overstate the true likelihood of 3rd trimester exposure, since these children’s 3rd
trimesters were only one month long. Similarly, classifying exposure to a disaster in the 9
months prior to birth as exposure during pregnancy will overstate true exposure in pregnancies
that only last 7 months. We show below that it is important to account for the fact that
pregnancies with shorter gestations have a lower likelihood of disaster exposure relative to other
pregnancies, holding all else equal. Calculating exposure windows in the same way regardless of
gestation length by counting backwards from the child’s date of birth creates a mechanical
negative correlation between disaster exposure and gestation.
Overall, the existing literature provides a motivation for finding empirical methods that
can address the selection, endogeneity, and exposure timing issues that have plagued previous
studies in order to gauge the effects of stressful events during pregnancy on health at birth. We
attempt to fill this gap in the literature by analyzing the effects of storms and hurricanes using
data from the universe of Texas birth records.

12
II. Data and Summary Statistics
A. Data on Storms and Hurricanes
Our data on hurricanes and severe storms comes from The Weather Underground
Hurricane Archive, a publicly available database of information on all North Atlantic, East
Pacific, Western Pacific, and Indian Ocean storms since 1851.3 These data include the storm or
hurricane name, the total damages caused in millions of dollars, the total number of deaths, and
detailed tracking information on the latitude and longitude coordinates of the storm path and the
storm type for each day of the storm.4 We extracted data on the eight hurricanes and tropical
storms that hit any part of Texas over 1996-2008 and caused more than $10 million in damages.
Figure 1 shows a map of the eight storm paths that hit Texas over 1996-2008. All major
storms occur in the eastern and southern parts of Texas. The striped, dotted, and yellow shaded
areas represent all points within 100, 60, and 30 kilometers, respectively, of the storm paths. The
eye of a major storm is typically 30 to 60 kilometers across, and the eye is surrounded by the
strongest winds (Weatherford and Gray, 1988). Thus, the 30 kilometer bands around the storm
track represent the area the eye passed over, where there was likely to have been the most severe
damage. The costliest storms in our data are tropical storm Allison in 2001 which caused more
than $50 billion in damages and cost 40 lives, and Hurricane Ike in 2008 which caused $19.3
billion in damages but cost 103 lives. The only other storm in our data to cause much loss of life
was tropical storm Charley in 1998, which cost 20 lives but caused a comparatively minor $50
million in damages.
3 See www.wunderground.com/hurricane/hurrarchive.asp for more information. 4 Storms are classified into different categories based on the maximum sustained wind speed. Tropical depressions have a wind speed of up to 39 miles per hour, tropical storms have a wind speed of 40-74 miles per hour, while hurricanes have a wind speed of 75 miles per hour or more. Hurricanes are further classified into categories based on the wind speed.

13
B. Data on Births
We use restricted data from the universe of Texas birth records over 1996-2008 which is
available from the Texas Department of State Health Services. The sample is limited to single
births with non-missing information on the child’s date of birth and the mother’s full maiden
name, date of birth, birth place, race/ethnicity, and the longitude and latitude coordinates of her
residence address (N=4,237,494). We also dropped the 61,420 births with either less than 26
weeks gestation or missing gestation information. This restriction results in dropping about 1
percent of the sample and these births have much worse outcomes than other infants. Siblings
are identified using all of the available time-invariant maternal characteristics – full maiden
name, date of birth, birth place, and race/ethnicity. The data also have information on each
child’s exact birth date and the date of the last live birth for each second or higher birth, which
we use to check the sibling matches. We drop any birth records that cannot be linked to a sibling
using these methods (2,905,633 births). The resulting sibling sample consists of 1,270,441
births.
We calculate the distance to the closest point on the storm path using the longitude and
latitude coordinates of the mothers’ residential addresses. To create a more homogeneous
sample, we keep only sibling births to mothers who ever lived within 100 kilometers of any point
along a storm path (regardless of whether or not they were pregnant during the actual storm
occurrence). We omit mothers who live in Austin and San Antonio, as both cities are on the 100
kilometer boundary (the results are not sensitive to this exclusion). These selections leave us
with a main analysis sample of 485,111 sibling births. We use information on the children’s
dates of birth, gestation, and the dates of storm occurrences to calculate whether a child was
exposed to a hurricane during the 1st, 2nd, or 3rd trimester of the mother’s pregnancy in two

14
different ways: Either counting backwards from the time of the birth as many previous studies
have done, or counting forwards from the date of conception.
Table 1 presents summary statistics for the sample of Texas sibling births whose mothers
ever lived within 100 kilometers of a hurricane or storm path.5 The modal mother in our sample
is aged 25-34 years at the time of childbirth and has a high school degree. About 68 percent of
mothers are married at the time of childbirth. Forty-three percent of mothers are non-Hispanic
white, 17 percent are black, and 38 percent are Hispanic. The mean birth weight is around 3,330
grams, and about 5% of these babies are born low-birth-weight (defined as birth weight less than
2,500 grams), and 8% are born premature (defined as gestation less than 37 weeks).
Most previous analyses of the effects of stressful events during pregnancy on infant
health at birth have focused on birth weight and prematurity as outcomes. This study breaks new
ground by also looking at abnormal conditions of the newborn and complications of labor and/or
delivery. Five percent of newborns have abnormal conditions, and 13% of births had
complications. The most common abnormal conditions are meconium aspiration syndrome, and
any assisted ventilation, followed by being on a ventilator more than 30 minutes. Meconium
aspiration syndrome is of particular interest because it usually reflects fetal stress. Problems
with breathing (and hence assisted ventilation) are the most common abnormal conditions of the
newborn. The most common complications of labor and delivery are meconium staining of the
amniotic fluid, dysfunctional labor, and breech presentation. Texas changed the reporting of
abnormal conditions of the newborn and the complications of labor/delivery in 2005 and the data
5 The sample sizes differ slightly because for all variables, in addition to excluding births by mothers who have at most one child with non-missing gestation or gestation of 26 weeks or greater, we also omit mothers who have at most one child with non-missing information on birth weight (63 additional births).

15
is not consistently reported before and after 2005. Hence, our analysis of these conditions is
based on the data for 1996-2004 only.6
In columns 2, 3, and 4 of Table 1, we split the sample by whether or not the mother ever
experienced a hurricane or storm within 30 kilometers of her home during a pregnancy, or by
whether she experienced one during the current pregnancy. The most striking difference between
mothers near storm paths during pregnancy and other mothers is that they are less likely to be
black and more likely to be non-Hispanic white. They are also more likely to be less than 20,
less likely to be high school dropouts, and less likely to be married than other mothers. These
differences in the raw data point to the importance of controlling for geographical sorting when
trying to identify the effects of disasters on birth outcomes.
III. Empirical Methods
Table 1 shows that there are differences between women who live within 30 km of a
hurricane path while pregnant and other pregnant women. A common way to control for
selection into areas that are prone to disasters is to include area (such as county or municipality),
birth year, and birth month fixed effects. However, while such a method controls for time-
invariant area-specific factors (for example, if areas that are more likely to be hit by a disasters
tend to be more disadvantaged), and for overall seasonal effects, there may still be selection
within areas in who is affected by disaster. And there may still be geographical sorting in
6 Over 1996-2004, the following abnormal conditions were recorded: assisted ventilation (<30 min, 30+ min), seizures, anemia, fetal alcohol syndrome, meconium aspiration syndrome, hyaline membrane disease, arterial blood gas pH<7.2, and sepsis. Over 1996-2004, the following complications were recorded: moderate/heavy meconium staining of amniotic fluid, premature rupture of membranes, precipitous labor (<3hrs), prolonged labor (>20hrs), breech/malpresentation, labor febrile, abruptio placenta, placenta previa, excessive bleeding, seizures, dysfunctional labor, cord prolapse, cephalopelvic disproportion.

16
response to a disaster. Since disasters often lead to dislocation and migration, this issue is
potentially important.
To assess the importance of selection on observables in our data, we first examined the
relationship between living within 30 kilometers of a storm during pregnancy and maternal
characteristics. Specifically, we estimated the following equation using Ordinary Least Squares
(OLS):
(1) ∗ _1 ∗ _2 ∗ _3
for each child i, born in year y, month m, with mother in county of residence c. Xiymc is a
maternal characteristic, such as an indicator for the mother being less than 20 years old, or an
indicator for the mother having less than a high school education. HUR_1triiymc is an indicator
equal to 1 if a hurricane or storm occurred within 30 kilometers of i’s mother’s home during her
1st trimester of pregnancy, and 0 otherwise. HUR_2triiymc and HUR_3triiymc are similar indicators
for the 2nd and 3rd trimesters, respectively. County fixed effects are indicated by αc , The vector
γy are birth year fixed effects, while δm are birth month fixed effects, and εiymc is a child-specific
error term. We estimated this model with and without county fixed effects. Standard errors are
clustered at the county level.
If the county, birth month, and birth year fixed effects included in this model control for
selection, then we should not expect to see any statistically significant β coefficients. A
statistically significant relationship between exposure to a hurricane or a storm and maternal
characteristics in this model would suggest that county-level controls are not sufficient to

17
account for selection into storm exposure. The first panel of Appendix Table 1 shows that there
are some observable differences between mothers who are exposed to hurricanes, especially in
the third trimester, and others. However, the second panel of Appendix Table 1 shows that
controlling for county fixed effects does a good job of controlling for these differences.
A second issue is whether some people are more likely to move in response to a hurricane
than others. To assess this possibility, we estimated models of the following form:
(2) ∗ ∗
where is the probability that a woman moved more than 5 kilometers between births and
is an indicator for whether she was exposed to a hurricane during her first pregnancy.
We used a 5 km cutoff because geocoding is not entirely accurate, and it is possible that some
women who stay in the same location will be recorded at slightly different coordinates at
different pregnancies. We estimated this model with and without county fixed effects, . The
coefficients on the interaction terms, , allow us to assess the importance of differential
responses by observable characteristics. Appendix Table 2 suggests that there is some evidence
of endogenous mobility: in particular, black mothers and mothers over 45 are less likely to move
following a hurricane than others.
Since we do find some evidence of selection in terms of observables, and there may also
be selection in terms of unobservable characteristics, we could estimate models with mother
fixed effects. This would be an improvement upon a model with area fixed effects, as we would

18
be able to control for all time-invariant unobserved maternal characteristics by comparing
children borne by the same mother. In particular, we could estimate:
(3) ∗ _1 ∗ _2 ∗ _3
′
for each child i, borne by mother k, in year y, and month m. Yikym is an outcome of interest such
as birth weight or an indicator for any complications during labor/delivery. Here, Xikym would
include indicators for mother's age groups (<20, 20-24, 25-34, 35-44, 45+), mother's education
groups (<HS, HS, some college, college+, missing), mother's marital status, birth order, and an
indicator for living within 30km of an area that was ever affected by a storm or a hurricane over
the time period of analysis, and the mother fixed effect would be indicated by αk.
In equation (3), the effect of hurricane exposure would be identified using the sample of
mothers who had at least one child who was prenatally exposed to a hurricane or storm and one
child who was not. These mothers are comprised of two groups: 1) those who always live within
30 kilometers of a storm path and who were pregnant with one child during a hurricane and
pregnant with another child at another time, and 2) those who move between pregnancies and
live within 30 kilometers of a storm path during one pregnancy but not the other. Clearly, the
decision of whether to move (or not) between pregnancies could be a response to hurricane
exposure.
The inclusion of mother fixed effects controls for unobserved fixed characteristics of the
mother, but does not address the endogeneity of changes in mother’s residential location.
Suppose for example, that a mother’s initial residential location had unobserved characteristics

19
that caused better pregnancy outcomes, such as excellent social support. Further suppose that she
is subjected to a hurricane during the first pregnancy, and that other things being equal, hurricane
exposure causes worse pregnancy outcomes. In this example, the estimated effects of hurricanes
would be biased towards zero in an Ordinary Least Squares model only if places with hurricanes
had better unobserved attributes on average.
However, in a fixed effects model, changes in residential location and changes in
hurricane exposure matter. Suppose a mother experiences a hurricane in pregnancy 1, moves to a
new location that is worse in terms of unobservables, and does not experience a hurricane in the
new location. In this situation, the estimated effect of experiencing a hurricane during pregnancy
1 will be biased towards zero because the outcome of pregnancy 1 will be compared to the
outcome of pregnancy 2, in which the woman did not experience a hurricane but was residing in
a suboptimal location.
To take a second example, suppose a mother did not experience a hurricane during
pregnancy 1, but still chose to move to a new location in pregnancy 2. Let us assume that on
average, mothers who make this choice are moving to places with better unobserved
characteristics. If the mother experiences a hurricane during pregnancy 2, the effects of the
hurricane will again be under-estimated because the effect of the hurricane will be conflated with
the effect of having moved to the better location.
A second difficulty with the maternal fixed effects model is that the estimates may be
biased by measurement error. In particular, if some mothers who were residing in a location
affected by a hurricane are displaced, they may report a new residential location at the time of
their child’s birth, in which case we would systematically miss their hurricane exposure. In this

20
case, there could be large changes in outcomes in cases with no apparent change in hurricane
exposure, which would bias our estimates of the effects of hurricanes towards zero.
In order to deal with the endogeneity of maternal location and with measurement error,
we adopt a mother fixed effects-instrumental variables model. Specifically, we consider the
residential location during each mother’s first pregnancy that we observe. Then, for each
subsequent pregnancy, we create a variable that measures the child’s prenatal exposure to the
hurricane as though the mother had remained in her first reported pregnancy residence. That is,
we measure the hypothetical exposure the mother would have experienced during each trimester
of pregnancy as if she had never moved. We use these hypothetical variables to instrument for
the actual HUR_1triikym, HUR_2triikym, and HUR_3triikym variables constructed using information
on the mother’s actual place of residence during each of her pregnancies. We then estimate a
second-stage equation of the form:
(4) ∗ _1 ∗ _2 ∗ _3
′
with corresponding first stage equations:
(5) _1 ∗ _ _1 ′
(6) _2 ∗ _ _2 ′

21
(7) _3 ∗ _ _3 ′
for each child i, borne by mother k, in year y, and month m. FST_HUR_1triikym is an indicator
equal to 1 if a hurricane or storm occurred within 30 kilometers of i’s mother’s first-pregnancy
home during her 1st trimester of pregnancy with child i, and 0 otherwise. FST_HUR_2triikym and
FST_HUR_3triikym are similar indicators for 2nd and 3rd trimesters. The rest of the variables and
coefficients are defined as before, and standard errors are clustered at the mother level.
The idea is that while the mother’s current pregnancy residence is potentially
endogenous, her residence during her first pregnancy is controlled for by the inclusion of mother
fixed effects. Exposure to the hurricane is then identified only by the timing of natural disaster
occurrences, which should be exogenous to any particular mother. Thus, the instruments
FST_HUR_1triikym, FST_HUR_2triikym, and FST_HUR_3triikym should satisfy the requirements for
being valid instruments. They are highly predictive of HUR_1triikym, HUR_2triikym, and
HUR_3triikym (since most mothers do not move between pregnancies) and they should not have
any direct effect on birth outcomes other than through their effects on the likelihood of each
child’s prenatal exposure to a hurricane.
A final problem we address has to do with whether one should measure exposure
backwards from the date of birth, or forwards from the date of conception. If all children had
nine months of gestation, then this distinction would not matter. However, as discussed above,
8% of sample children are born prematurely. For premature infants, counting backwards nine
months will increase the probability that they are measured as being exposed during the first and

22
the third trimesters, and will induce measurement error into the assignment of exposure in the
second trimester.
In individual-level data where gestation length is available, researchers are able to
correctly infer whether an infant was exposed at some point during the pregnancy whether they
count forward or backwards. But counting backwards will still assign exposure to the wrong
trimester. For example, suppose an infant was born at 7 months gestation on Sept. 30, and was
exposed to a hurricane in utero on July 31st. This infant was exposed in the second trimester, but
a researcher counting backwards will incorrectly measure them as having been exposed in the
third trimester. Similarly, suppose an infant is born on Dec. 31st after 7 months gestation, and
was exposed to a hurricane in utero on July 31st. This infant was conceived in early June, and so
was exposed to a hurricane in the first trimester. But a researcher counting backwards will
incorrectly assign exposure to the second trimester. Hence, counting backwards will make it
difficult to determine whether the effects of stress during a particular trimester are greater than
the effects of stress during any other, even when gestation is correctly measured.
Counting forwards from conception does not completely overcome another problem,
which is that children who have longer gestations are mechanically more likely to be exposed to
a hurricane at some point during the pregnancy. In turn, children with longer gestations are likely
to have higher birth weight and better outcomes.
We address this mechanical correlation in two ways. First, we modify our procedure for
constructing the instrumental variables slightly, and construct measures of the exposure that
would have occurred during each pregnancy if the woman had stayed in the same place as we
first observe her and each pregnancy had lasted exactly 39 weeks. These instruments are not

23
affected either by endogenous mobility or by gestation length and can be used to correct for both
problems.
For the sake of comparison, we adopt a second procedure, which is to estimate a discrete
time hazard model similar to that employed in Currie and Neidell (2005). We treat each infant as
though he or she contributed one observation to the sample for each month of the last trimester
of pregnancy (recall that we are including only pregnancies that last at least 26 weeks, which is
the vast majority of pregnancies). For example, an infant born in the 7th month has one
observation, an infant born in the 8th month gets two observations, and an infant born in the 9th
month gets three. An outcome such as premature birth is coded as a 1 if it happened in that
month and a zero otherwise. The non-time-varying characteristics are the same for each
observation, while indicator variables for whether they were exposed to a hurricane vary over
time. We also include a dummy variable for each month of the last trimester. This procedure is
simple to implement in our fixed effects-IV framework and is asymptotically equivalent to
estimating a continuous time hazard model. Following the discussion above, the instruments are
defined with reference to whether there was a hurricane in the relevant time period within 30km
of the place that we first observe the mother. The standard errors are clustered at the mother
level.
IV. Results
Table 2 presents OLS and IV-mother fixed effects models of the effects of hurricane
exposure on birth outcomes. Following much of the literature, the first two panels show models
in which exposure is calculated by counting backwards from the date of the birth. The OLS
models shown in the first panel suggest that exposure during the 3rd trimester of pregnancy is

24
associated with lower birth weight and gestation, higher probabilities of low birth weight and
prematurity, and also with increased probabilities of abnormal conditions and complications of
labor and delivery. There seems to be little effect of earlier exposure, with the exception of a
positive effect of exposure in the first trimester on the probability of C-section.
The second panel of Table 2 shows fixed effects estimates that instrument hurricane
exposure using the exposure the woman would have experienced had she stayed in the location
where we first observed her, and using actual gestation. In these models, the effects on birth
weight are no longer statistically significant, though the point estimates still suggest negative
effects of exposure. The estimates suggest that exposure in the 3rd trimester significantly
increases the probability of prematurity, induced labor, abnormal conditions of the newborn, and
complications of labor and delivery. In this model, first trimester exposure is also estimated to
lead to an increase in abnormal conditions of the newborn. The results are almost identical if we
estimate separate models for exposure during each trimester (results available upon request).
The third panel of Table 2 shows models in which exposure in each trimester is assigned
correctly; that is, counting forward from the date of conception. The estimated effects of
exposure on outcomes are quite similar for induced labor, abnormal conditions of the newborn,
and complications of labor and delivery. However, now there appears to be a positive
association between gestation and exposure in the third trimester. This correlation is most likely
driven by the fact that children with longer gestations have a longer time in which they could be
exposed.
In Table 3, we address this mechanical correlation problem by modifying our instrument
as described above, and by estimating discrete time hazard models. The estimates obtained by
these two approaches are remarkably similar, as shown in the first and second panels of Table 3.

25
There is no longer any significant effect of exposure on birth weight, gestation, or whether the
child is “small for gestational age” (fifth column). However, exposure in the third trimester is
associated with increases in the probability that labor is induced, abnormal conditions of the
newborn, and complications of labor and delivery. Exposure in the first trimester is also
associated with increases in abnormal conditions, while exposure in the second trimester is
associated with an increased probability of C-section. The first stage regressions corresponding
to the first panel estimates are shown in Appendix Table 3. Clearly the instruments are quite
predictive.
The last two panels of Table 3 show models that consider exposure over the entire
pregnancy (rather than by trimester). These models confirm that exposure increases the
probability of abnormal conditions of the newborn and of complications of labor and delivery.
Table 4 presents “placebo tests” in which we examine the “effect” of hurricanes after the birth on
outcomes. Events after the birth can have no causal effect on birth outcomes, but if the estimated
effects of hurricanes during pregnancy reflected an omitted variable, then we might well find
significant estimates in these placebo regressions. We show estimates of the hazard models only
(since differences in gestation have no effect on the probability of being exposed three to six
months after childbirth). Table 4 confirms that we find no effects of hurricanes after the birth on
any of our outcomes.
The estimates so far suggest that hurricanes during pregnancy have significant effects on
abnormal conditions of the newborn and on complications of labor and delivery, as well as
induction and C-sections. In contrast, the estimated effects on prematurity and birth weight are
sensitive to the way that gestation is measured, and the only statistically significant effects are
26
driven by a mechanical correlation between length of the pregnancy and the probability of being
exposed.
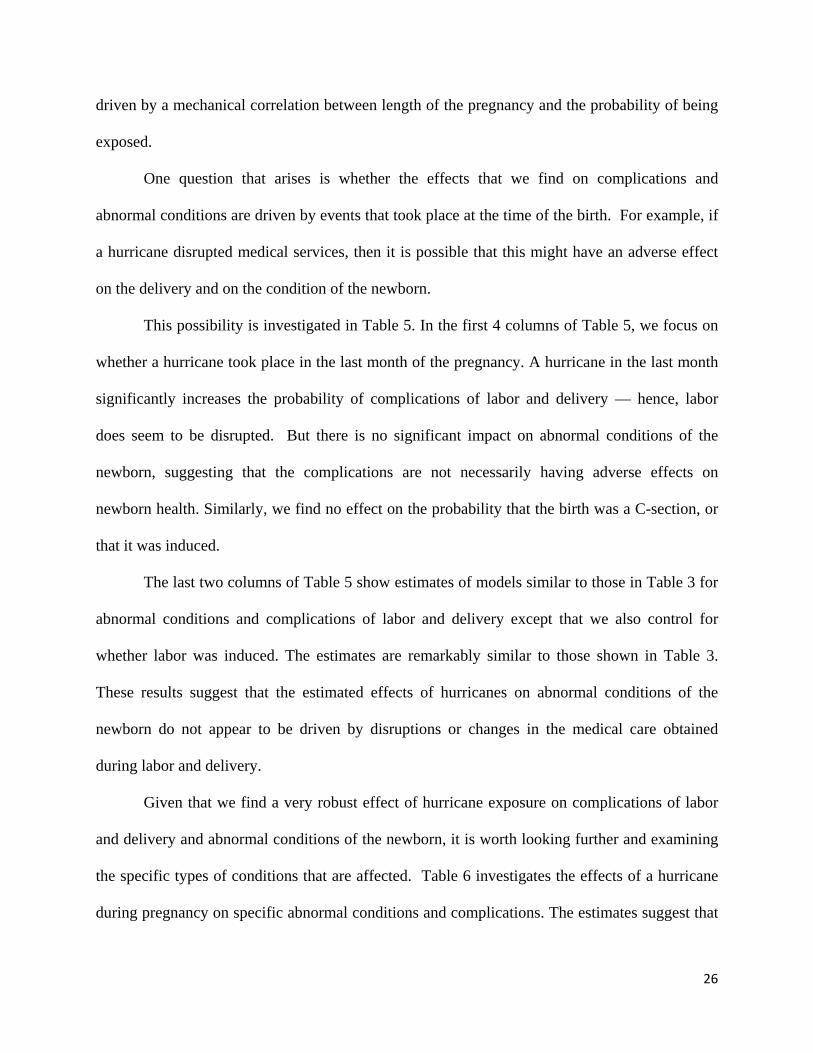
One question that arises is whether the effects that we find on complications and
abnormal conditions are driven by events that took place at the time of the birth. For example, if
a hurricane disrupted medical services, then it is possible that this might have an adverse effect
on the delivery and on the condition of the newborn.
This possibility is investigated in Table 5. In the first 4 columns of Table 5, we focus on
whether a hurricane took place in the last month of the pregnancy. A hurricane in the last month
significantly increases the probability of complications of labor and delivery — hence, labor
does seem to be disrupted. But there is no significant impact on abnormal conditions of the
newborn, suggesting that the complications are not necessarily having adverse effects on
newborn health. Similarly, we find no effect on the probability that the birth was a C-section, or
that it was induced.
The last two columns of Table 5 show estimates of models similar to those in Table 3 for
abnormal conditions and complications of labor and delivery except that we also control for
whether labor was induced. The estimates are remarkably similar to those shown in Table 3.
These results suggest that the estimated effects of hurricanes on abnormal conditions of the
newborn do not appear to be driven by disruptions or changes in the medical care obtained
during labor and delivery.
Given that we find a very robust effect of hurricane exposure on complications of labor
and delivery and abnormal conditions of the newborn, it is worth looking further and examining
the specific types of conditions that are affected. Table 6 investigates the effects of a hurricane
during pregnancy on specific abnormal conditions and complications. The estimates suggest that

27
hurricane exposure has a significant effect on meconium staining of amniotic fluid during
delivery, which in turn leads to a higher probability that the baby will breathe in meconium and
suffer from meconium aspiration syndrome. Meconium release is related to fetal distress. We
also find that newborns exposed in either the first or the second trimester are more likely to be on
assisted ventilation for longer than 30 minutes. Babies exposed during the first trimester are also
more likely to suffer from dysfunctional labor, and arterial blood gas pH less than 7.2. This latter
condition is an indicator of inadequate respiratory function. Babies exposed during the third
trimester have a higher probability of breech presentation, which is sometimes caused by
inadequate or excessive levels of amniotic fluid. Finally, we find a negative effect of exposure in
the second trimester on the probability of receiving any assisted ventilation although exposure in
the second trimester has no effect on the probability of receiving ventilation more than 30
minutes. This result might reflect some rationing of ventilation to infants with less severe
respiratory problems in the wake of a hurricane. 7
Table 7 turns to an investigation of behavioral mechanisms that might underlie our
results. It is possible that exposure to hurricanes affects birth outcomes by altering maternal
behavior. For example, mothers experiencing the stress of hurricane may smoke more or have
negative changes in their diets. Their receipt of prenatal care may also be disrupted. However,
Table 7 does not show evidence of changes in behavior that would explain our results. Women
exposed in the first trimester are less likely to gain an excessive amount of weight or to have
inadequate prenatal care. Women exposed in the second trimester are more likely to smoke, but
exposure in this trimester was not associated with a higher probability of adverse outcomes
(other than C-section).
7 We also estimated models for hyaline membrane disease, but did not find any statistically significant effects.

28
V. Robustness
The estimated effects of hurricane exposure on abnormal conditions are robust to
numerous changes in specification. In the first panel of Appendix Table 4, we show estimates
from models using our “full term gestation” instrument, and exclude mothers living in large
cities Houston and Dallas. These estimates can be compared to those in the first panel of Table
3. While this exclusion cuts the sample size significantly, we still estimate that exposure in the
first or third trimesters of pregnancy increases the probability of abnormal conditions of the
newborn, and in fact the point estimate is somewhat larger than in Table 3. In contrast, the point
estimate on complications of labor and delivery is somewhat reduced in magnitude by this
exclusion, and is no longer statistically significant. Moreover, there are no longer any statistically
significant effects on inducement or the probability of a c-section. One possible interpretation of
these results is that in large cities, labor and delivery is disrupted by hurricanes but that in rural
areas (where women travel larger distances to get to a provider in any case) a local disaster is
actually less disruptive to maternity care.
In the second panel of Appendix Table 4, we ask whether the estimates we have
presented are driven by mothers with pregnancy risk factors such as high blood pressure,
diabetes, or previous pre-term deliveries. When we drop mothers with these known risk factors,
we find similar estimates to those reported in the first panel of Table 3, suggesting that
hurricanes have harmful effects whether or not the mother has known risk factors. In fact, we
also find a marginally significant positive effect of exposure in the third trimester on the
probability of low birth weight in the population of women without risk factors.
Appendix Table 5 shows models that interact hurricane exposure with whether a WIC
(Special Supplemental Nutrition Program for Women, Infants, and Children) clinic was

29
operating in the woman’s zip code during the pregnancy.8 The table offers a crude way to see
whether supportive programs for pregnant women mitigate the effects of hurricane exposure.
We do not find that this makes much of a difference in terms of abnormal conditions of the
newborn or complications of labor and delivery. However, women with these services available
are less likely to be induced in the wake of a hurricane suggesting that WIC clinics may be
helpful in re-routing women whose maternity care is disrupted to alternative providers.
In models that are not shown, we also asked whether the effects of hurricanes were larger
for disadvantaged mothers. We split the sample and considered mothers who were unmarried,
less than 20, or without a high school education during any of their pregnancies as
“disadvantaged”. These estimates were not generally significantly different than those presented
in the main results. We also investigated interactions between hurricane exposure and race,
gender, and birth order. We found no conclusive evidence that the effects differed with these
characteristics.
VI. Conclusions
There is a growing literature suggesting that stressful events in pregnancy can have
negative effects on birth outcomes. Some of the estimates in this literature may be affected by
small samples, omitted variables, endogenous mobility in response to disasters, and errors in the
measurement of gestation, as well as by a mechanical correlation between longer gestations and
the probability of having been exposed. We use a large-scale individual-level data set from
Texas in which we can measure gestation and outcomes reasonably precisely and follow the
same mother over time; and we suggest estimation methods that correct for omitted unobserved
8 The data on WIC clinics comes from a public records request from the Texas Department of State Health Services and are described further in Rossin-Slater (2012).

30
fixed characteristics of the mother, endogenous moving in response to storms, and the above
mentioned correlation between gestation length and exposure.
We show that if we followed techniques commonly used in the literature, we would
conclude that exposure to hurricanes in the third trimester has a significant negative effect on
birth weight and gestation. In contrast, our methods suggest that exposure has no significant
effect on these outcomes.
We do find that exposure to a hurricane during pregnancy increases the probability of
complications of labor and delivery, and of abnormal conditions of the newborn. Some of the
increased probability of complications may be due to disruption of labor and delivery — we find
some evidence, for example, that women exposed to hurricanes in the last trimester are more
likely to be induced and that those exposed in the second trimester are more likely to have C-
sections.
However, the increase in abnormal conditions of the newborn is not explained either by
the increased probability of being induced or by events in the last month of the pregnancy.
Indeed, hurricane exposure in the first trimester of pregnancy is estimated to increase the
probability of several important abnormal conditions such as being on a ventilator more than 30
minutes and meconium aspiration syndrome.
Similarly, we find little evidence that the increases in abnormal conditions and
complications that are associated with exposure in the first and third trimester are caused by
changes in maternal behavior; although we find that exposure in the second trimester is
associated with an increased probability that the mother smoked during pregnancy, exposure in
the second trimester is not associated with significant increases in adverse birth outcomes.

31
Although we do not directly measure stress, our results are supportive of the idea that
stressful events such as disasters in pregnancy can damage the health of the fetus. However, the
effects may be subtle and not readily apparent in terms of widely-used metrics such as birth
weight and gestation.

32
VII. References
Aizer, Anna, Laura Stroud, and Stephen Buka. “Maternal Stress and Child Well-Being: Evidence from Siblings,” Brown University Department of Economics Working Paper, March 2009.
Almond, Douglas and Janet Currie. 2011. “Killing Me Softly: The Fetal Origins Hypothesis.” The Journal of Economics Perspectives.
Almond, Douglas and Janet Currie. 2010. “Human Capital Development Before Age Five,” in Orley Ashenfleter and David Card (Eds.), The Handbook of Labor Economics, 4b. Amsterdam: Elsevier Science B.V. Berkowitz, G.S., M.S. Wolff, T.M. Janevic, I.R. Holzman, P. Yehuda, P.J. Landrigan. 2003. “The World Trade Center Disaster and Intrauterine Growth Restriction,” Journal of the American Medical Association, 290, 595-6.
Black, Sandra, Paul Devereux and Kjell Salvanes. “From the Cradle to the Labor Market? The Effect of Birth Weight on Adult Outcomes, Quarterly Journal of Economics, March 2007.
Buckles, Kasey and Daniel Hungerman. 2008. “Season of Birth and Later Outcomes: Old Questions, New Answers,” National Bureau of Economic Research Working Paper No. 14573.
Callaghan, William M., Sonja A. Rasmussen, Denise J. Jamieson, Stephanie J. Ventura, Sherry L. Farr, Paul D. Sutton, Thomas J. Matthews, Brady E. Hamilton, Katherine R. Shealy, Dabo Brantley, and Sam F. Posner. 2007. “Health Concerns of Women and Infants in Times of Natural Disasters: Lessons Learned from Hurricane Katrina,” Maternal and Child Health Journal, 11: 307-311.
Camacho, Adriana. 2008. “Stress and Birth Weight: Evidence from Terrorist Attacks.” American Economic Review: Papers & Proceedings, 98(2): 511-515.
Currie, Janet. 2011. “Inequality at Birth: Some Causes and Consequences.” American Economic Review, May.
Dunkel-Schetter, Christine. 2011. “Psychological Science on Pregnancy: Stress Processes, Biopsychosocial Models, and Emerging Research Issues,” Annual Review of Psychology, 62, 531-558. Eccleston, Melissa. “In Utero Exposure to Maternal Stress: Effects of 9/11 on Birth and Early Schooling Outcomes in New York City,” working paper, Harvard University, November 2011. Eskenazi, Brenda, Amy R. Marks, Ralph Catalano, Time Bruckner, and Paolo G. Toniolo. 2007. “Low birth weight in New York City and upstate New York following the events of September 11th.” Human Reproduction, 22(11): 3013-3020.
Glynn, Laura M., Pathik D. Wadhwa, Christine Dunkel-Schetter, Aleksandra Chicz-DeMet, and Curt A. Sandman. 2001. “When Stress Happens Matters: Effects of Earthquake Timing on Stress Responsivity in Pregnancy,” American Journal of Obstetrics and Gynecology, 184(4): 637-642.

33
Glynn, Laura M., Christine Dunkel-Schetter, Calvin J. Hobel, and Curt A. Sandman. 2008. “Pattern of Perceived Stress and Anxiety in Pregnancy Predicts Preterm Births,” Health Psychology, 27(1): 43-51.
Lauderdale, Diane. 2006. “Outcomes for Arabic-Named Women in California Before and After September 11.” Demography, 43(1): pp.185-201.
Lederman, Sally Ann, Virginia Rauh, Lisa Weiss, Janet L. Stein, Lori A. Hoepner, Mark Becker, and Frederica P. Perera. 2004. “The Effects of the World Trade Center Event on Birth Outcomes among Term Deliveries at Three Lower Manhattan Hospitals.” Environmental Health Perspectives, 112(17): 1772-1778.
Lipkind, Heather S., Allison Curry, Mary Huynh, Lorna Thorpe, Thomas Matte. 2010. “Birth Outcomes Among Offspring of Women Exposed to the Sept. 11, 2001, Terrorist Attacks,” Obstetrics and Gynecology, 116 #4, 917-925.
Mansour, Hani and Daniel Rees 2011. “Prenatal Stress on Birth Weight: Evidence from the al-Aqsa Intifada.” Discussion Paper Series, IZA DP No. 5535.
Morland, Leslie, Deborah Goebert, Jane Onoye, LeighAnn Frattarelli, Chris Derauf, Mark Herbst, Courtenay Matsu, and Matthew Friedman. 2007. “Posttraumatic Stress Disorder and Pregnancy Health: Preliminary Update and Implications,” Psychosomatics, 48(4): 304-308. Mulder, E.J.H., P.G. Robles de Medina, A.C. Huizink, B.R.H. Van den Bergh, J.K. Buitelaar, and G.H.A. Visser. 2002. “Prenatal Maternal Stress: Effects on Pregnancy and the (Unborn) Child,” Early Human Development, 70: 3-14. Rossin-Slater, Maya. “WIC in Your Neighborhood: New Evidence on the Impacts of Geographic Access to Clinics,” Columbia University Department of Economics Working Paper, March 2012. Simeonova, Emilia. 2009. “Out of Sight, Out of Mind? The Impact of Natural Disasters on Pregnancy Outcomes,” CESInfo Working Paper No. 2814. Tan, Cong E., Hong Jun Li, Xian Geng Zhang, Hui Zhang, Pei Yu Han, Qu An, Wei Jun Ding, Mi Qu Wang. 2009. “The Impact of the Wenchuan Earthquake on Birth Outcomes,” PLoS ONE, 4(12): e8200. Torche, Florencia. 2011. “The Effect of Maternal Stress on Birth Outcomes: Exploiting a Natural Experiment,” forthcoming in Demography. Weatherford, C. and W.M. Gray. 1988. "Typhoon structure as revealed by aircraft reconnaissance. Part II: Structural variability," Mon. Wea. Rev., 116, pp.1044-1056. Xiong, Xu, Emily W. Harville, Donald R. Mattison, Karen Elkind-Hirsch, Gabriella Pridjian, and Pierre Buekens. 2008. “Exposure to Hurricane Katrina, Post-Traumatic Stress Disorder, and Birth Outcomes,” The American Journal of the Medical Sciences, 336(2): 111-115.

Whole Sample
(N=485,048)
Mothers w No
Hurricane <
30km During Any
Pregnancy
(N=477,080)
Mother Ever had
a Hurricane <
30km During
Pregnancy
(N=7,968)
Hurricane <
30km During
Pregnancy
(N=3,430)
Mother's age <20 0.132 0.132 0.154 0.149
Mother's age 20‐24 0.297 0.297 0.324 0.311
Mother's age 25‐34 0.486 0.487 0.448 0.457
Mother's age 35‐44 0.085 0.085 0.074 0.083
Mother's age 45+ 0.0003 0.0003 0.0003 0.0003
Mother's ed: <HS 0.281 0.282 0.264 0.247
Mother's ed: HS degree 0.341 0.341 0.374 0.386
Mother's ed: some college 0.157 0.157 0.160 0.161
Mother's ed: college+ 0.211 0.212 0.199 0.202
Mother is married 0.679 0.679 0.654 0.668
Mother is non‐Hispanic white 0.425 0.423 0.524 0.531
Mother is black 0.168 0.170 0.067 0.066
Mother is Hispanic 0.376 0.375 0.395 0.389
Child is male 0.511 0.511 0.518 0.520
Birth weight (g) 3329
(SD=523)
3329
(SD=523)
3325
(SD=520)
3333
(SD=525)
Low birth weight (<2500g) 0.053 0.053 0.053 0.054
Gestation (weeks) 38.672
(SD=1.721)
38.673
(SD=1.722)
38.581
(SD=1.692)
38.571
(SD=1.715)
Premature (<37 weeks) 0.080 0.080 0.082 0.085
Small‐for‐Gestational Age 0.157 0.157 0.162 0.161
C‐Section Delivery 0.282 0.282 0.283 0.294
Induced Labor 0.200 0.198 0.273 0.271
Mother smoked during pregnancy
0.066 0.065 0.093 0.097
Average #cigarettes per day 0.585
(SD=2.832)
0.582
(SD=2.826)
0.779
(SD=3.203)
0.786
(SD=3.221)
Mother gained <16 lbs 0.121 0.121 0.121 0.120
Mother gained >60 lbs 0.031 0.031 0.031 0.027
Number prenatal visits 11.350
(SD=4.179)
11.345
(SD=4.184)
11.598
(SD=3.869)
11.675
(SD=3.785)
Adequate prenatal care 0.784 0.783 0.818 0.827
Variables Available 1996‐2004 Only N=301,683 N=296,130 N=5,553 N=2,418
Any Abnormal Conditions of Newborn 0.051 0.051 0.082 0.096
Any Assisted Ventilation 0.038 0.038 0.045 0.040
Assisted Ventilation 30+ Minutes 0.007 0.007 0.012 0.019
Meconium Aspiration Syndrome 0.003 0.003 0.021 0.035
Hyaline Membrane Disease 0.005 0.005 0.004 0.003
Table 1: Variable Means

Arterial Blood Gas pH <7.2 0.004 0.004 0.017 0.022
Any Complications Labor/Delivery 0.133 0.133 0.164 0.177
Moderate/Heavy Meconium 0.043 0.043 0.064 0.073
Premature Rupture of Membranes 0.010 0.010 0.010 0.010
Dysfunctional Labor 0.014 0.015 0.012 0.015Breech/Malpresentation 0.026 0.026 0.028 0.031
Notes: The sample is the universe of singleton sibling births with gestation >26 weeks in Texas between 1996‐2008 whose mothers lived
within 100km of areas that were ever struck by a storm or hurricane over this period. Mothers who live in Austin and San Antonio (both at
the 100km boundary) are omitted. There were 8 hurricanes or storms (>40mph windspeed and >$10 million in property damages) over
1996‐2008. Births to mothers who have at most one child with non‐missing gestation or birth weight data are omitted from the sample.
For 1996‐2004 variables, births to mothers who have at most one child with non‐missing data for any abnormal condition or
complications from labor/delivery are also omitted (183,428 births).
The total sample sizes for variables about maternal pregnancy behavior (smoking, number cigarettes, weight gain, and prenatal care) and
characteristics of delivery (c‐section, induced labor) range from 439,837 to 483,354.
Timing of exposure is calculated using information on the child's birth date and child's gestation length (in weeks) to calculate approximate
date of conception.
Texas changed the abnormal conditions of the newborn and the complications of labor/delivery that are reported on the birth certificate
in 2005.

Birth Weight
(g)
Low Birth
Weight
(<2500g)
Gestation
(weeks)
Premature
(<37 weeks)
SGA (<25th
Percentile) C‐section
Induced
Labor
Any
Abnormal
Conditions of
Newborn
(1996‐2004)
Any
Complications of
Labor/Delivery
(1996‐2004)
Hurricane 1st Trimester 6.8636 ‐0.0020 ‐0.0225 ‐0.0003 0.0047 0.0280** 0.0109 0.0175 ‐0.0019
(18.6013) (0.0045) (0.0484) (0.0078) (0.0098) (0.0130) (0.0144) (0.0185) (0.0102)
Hurricane 2nd Trimester ‐3.0562 ‐0.0038 ‐0.0102 ‐0.0023 0.0101+ 0.0062 ‐0.0026 0.0152 0.0128
(10.3113) (0.0069) (0.0578) (0.0081) (0.0055) (0.0083) (0.0174) (0.0167) (0.0175)
Hurricane 3rd Trimester ‐35.0478*** 0.0155** ‐0.1047 0.0258** 0.0140 ‐0.0159 0.0226 0.0400** 0.0266***
(9.6125) (0.0060) (0.0821) (0.0112) (0.0101) (0.0098) (0.0115) (0.0121) (0.0064)
Hurricane 1st Trimester 4.7155 0.0055 ‐0.0534 0.0068 ‐0.0017 ‐0.0098 0.0036 0.0283** 0.0248
(19.3139) (0.0101) (0.0734) (0.0123) (0.0160) (0.0115) (0.0203) (0.0144) (0.0193)
Hurricane 2nd Trimester 24.2718 ‐0.0094 0.0316 ‐0.0117 ‐0.0068 0.0161 0.0016 0.0130 0.0229
(18.1824) (0.0093) (0.0669) (0.0116) (0.0143) (0.0098) (0.0184) (0.0139) (0.0194)
Hurricane 3rd Trimester ‐17.2596 0.0137 ‐0.0944 0.0234** 0.0037 0.0043 0.0360** 0.0371** 0.0468**
(17.3966) (0.0093) (0.0630) (0.0112) (0.0138) (0.0104) (0.0173) (0.0135) (0.0185)
Hurricane 1st Trimester 1.8854 ‐0.0021 ‐0.0378 0.0063 ‐0.0014 ‐0.0112 ‐0.0055 0.0363** 0.0213
(19.1785) (0.0100) (0.0703) (0.0119) (0.0159) (0.0114) (0.0204) (0.0137) (0.0195)
Hurricane 2nd Trimester 7.7571 ‐0.0022 ‐0.0424 ‐0.0043 ‐0.0018 0.0198** 0.0043 0.0136 0.0237
(18.2676) (0.0093) (0.0687) (0.0121) (0.0144) (0.0101) (0.0184) (0.0142) (0.0193)
Hurricane 3rd Trimester 19.6746 0.0005 0.1210** ‐0.0033 ‐0.0011 ‐0.0008 0.0411** 0.0341** 0.0448**
(16.8119) (0.0089) (0.0578) (0.0102) (0.0137) (0.0103) (0.0175) (0.0136) (0.0184)
Table 2: Effects of Hurricane Within 30km on Birth Outcomes ‐ Alternative Estimators
A. OLS with County Fixed Effects ‐ Counting Backwards from the Birth Date to Estimate Exposure
B. IV with Mother Fixed Effects ‐ Counting Backwards from the Birth Date to Estimate Exposure
C. IV with Mother Fixed Effects ‐ Counting forward from Conception to Estimate Exposure

Notes: Each column in each panel is a separate regression. See notes under Table 1 for information on the sample.
Panel A presents results from OLS regressions that include controls for mother's race (non‐Hispanic white, black, Hispanic, Hispanic missing), mother's age (<20, 20‐24, 25‐34, 35‐44, 45+), mother's
education (<HS, HS, some college, college+, missing), mother's marital status (married, not married, marital status missing), birth order, as well as conception year, conception month, and county
fixed effects, and an indicator for living within 30km of an area that was ever affected by a storm or hurricane over the time period of analysis. Robust standard errors in Panel A are clustered on the
county level. Panels B and C present results from regressions with mother fixed effects where the key coefficients of interest are instrumented by indicators for a storm/hurricane at the time of the
current pregnancy within a 30km radius of the mother's first pregnancy residence. These regressions include time‐varying controls for mother's age, mother's education, mother's marital status, birth
order, as well as conception year and conception month fixed effects, and an indicator for living within 30km of an area that was ever affected by a storm or hurricane over the time period of
analysis. Robust standard errors are clustered on the mother.
Significance levels: +p<0.10 **p<0.05 ***p<0.001

Birth
Weight (g)
Low Birth
Weight
(<2500g)
Gestation
(weeks)
Premature
(<37 weeks)
SGA (<25th
Percentile) C‐section
Induced
Labor
Any
Abnormal
Conditions
of Newborn
(1996‐2004)
Any
Complications
of
Labor/Delivery
(1996‐2004)
Hurricane 1st Trimester 1.8968 ‐0.0021 ‐0.0378 0.0062 ‐0.0014 ‐0.0112 ‐0.0055 0.0363** 0.0213
(19.1760) (0.0100) (0.0703) (0.0119) (0.0159) (0.0114) (0.0204) (0.0137) (0.0195)
Hurricane 2nd Trimester 7.5858 ‐0.0021 ‐0.0433 ‐0.0042 ‐0.0018 0.0198** 0.0043 0.0136 0.0237
(18.2667) (0.0093) (0.0687) (0.0121) (0.0144) (0.0101) (0.0184) (0.0142) (0.0193)
Hurricane 3rd Trimester ‐10.3925 0.0089 ‐0.0431 0.0109 ‐0.0066 0.0024 0.0340+ 0.0389** 0.0409**
(18.5000) (0.0100) (0.0649) (0.0116) (0.0143) (0.0107) (0.0182) (0.0147) (0.0196)
N 485,048 485,048 485,111 485,111 485,048 485,010 485,010 301,683 301,683
Hurricane 1st Trimester 2.2777 ‐0.0029 ‐0.0360 0.0041 ‐0.0016 ‐0.0126 ‐0.0034 0.0348** 0.0194
(18.0655) (0.0091) (0.0629) (0.0111) (0.0158) (0.0113) (0.0205) (0.0136) (0.0194)
Hurricane 2nd Trimester 13.0307 ‐0.0042 ‐0.0188 ‐0.0050 ‐0.0013 0.0203** 0.0033 0.0113 0.0205
(16.9888) (0.0085) (0.0602) (0.0114) (0.0142) (0.0099) (0.0185) (0.0141) (0.0192)
Hurricane 3rd Trimester 4.4363 0.0050 0.0400 0.0023 0.0006 0.0005 0.0255** 0.0227** 0.0294**
(10.6576) (0.0056) (0.0361) (0.0064) (0.0087) (0.0065) (0.0111) (0.0087) (0.0118)
N 1,440,809 1,440,809 1,440,996 1,440,996 1,440,809 1,440,703 1,440,703 896,390 896,390
Hurricane Any Time ‐0.7465 0.0020 ‐0.0416 0.0044 ‐0.0035 0.0043 0.0125 0.0291*** 0.0287**
Table 3: Effects of Hurricane Within 30km on Birth Outcomes ‐ Accounting for Correlations Between Gestation and
Exposure
A. IV with Mother Fixed Effects ‐ Full Term Gestation Exposure Instrument
B. IV with Mother Fixed Effects ‐ Hazard Model
C. IV with Mother Fixed Effects ‐ Full Term Gestation Exposure Instrument

During Pregnancy (10.8068) (0.0057) (0.0392) (0.0069) (0.0086) (0.0062) (0.0110) (0.0083) (0.0113)
N 485,048 485,048 485,111 485,111 485,048 485,010 485,010 301,683 301,683
Hurricane Any Time 10.8621 ‐0.0011 0.0229 ‐0.0007 ‐0.0009 0.0031 0.0156 0.0266*** 0.0288**
During Pregnancy (9.8668) (0.0050) (0.0338) (0.0062) (0.0084) (0.0061) (0.0109) (0.0080) (0.0110)
N 1,440,809 1,440,809 1,440,996 1,440,996 1,440,809 1,440,703 1,440,703 896,390 896,390
Notes: Each column in each panel is a separate regression. See notes under Table 1 for information on the sample. In the hazard models, each child has a unique observation for each
trimester. Exposure to the hurricane is calculated by considering trimesters from the time of conception. Panels A and C present results from regressions with mother fixed effects where
the key coefficients of interest are instrumented by indicators for a storm/hurricane at the time of the current pregnancy assuming a 39‐week gestation period within a 30km radius of the
mother's first pregnancy residence.
In panels B and D, each child has a unique observation for each month of the 3rd trimester until the time of birth (i.e., children born in the 7th month of pregnancy have one observation,
children born in the 8th month of pregnancy have 2 observations, and children born in the 9th month of pregnancy have 3 observations). Exposure to the hurricane is calculated by
considering trimesters from the time of conception (estimated using the child's birth date and gestation length). Exposure in the 3rd trimester is measured on a monthly level. The
regressions include mother fixed effects and the key coefficients of interest are instrumented by indicators for a storm/hurricane at the time of the current pregnancy within a 30km radius
of the mother's first pregnancy residence.
All regressions include time‐varying controls for mother's age, education, and marital status, as well as child's birth order, conception year and conception month, and an indicator for
living within 30km of an area that was ever affected by a storm or hurricane over the time period. Robust standard errors are clustered on the mother.
Significance levels: +p<0.10 **p<0.05 ***p<0.001
D. IV with Mother Fixed Effects ‐ Hazard Model

Birth Weight
(g)
Low Birth
Weight
(<2500g)
Gestation
(weeks)
Premature
(<37 weeks)
SGA (<25th
Percentile) C‐section
Induced
Labor
Any Abnormal
Conditions of
Newborn
(1996‐2004)
Any
Complications
of
Labor/Delivery
(1996‐2004)
Hurricane 3 mo. After Birth ‐10.2768 ‐0.0067 ‐0.0099 ‐0.0050 0.0070 0.0000 0.0258 0.0121 ‐0.0127
(15.4354) (0.0078) (0.0530) (0.0097) (0.0130) (0.0098) (0.0174) (0.0123) (0.0175)
Hurricane 6 mo. After Birth 5.3348 ‐0.0076 0.0181 ‐0.0091 0.0064 0.0103 0.0313 ‐0.0240 0.0045
(15.8287) (0.0082) (0.0543) (0.0102) (0.0130) (0.0098) (0.0180) (0.0131) (0.0195)
N 1,440,809 1,440,809 1,440,996 1,440,996 1,440,809 1,440,703 1,440,703 896,390 896,390
Table 4: Placebo Effects of Hurricanes Within 30km After Childbirth on Birth Outcomes
IV‐Mother Fixed Effects, Hazard
Notes: Each column in each panel is from a separate regression. See notes under Tables 1 for information about the sample. Significance levels: +p<0.10 **p<0.05 ***p<0.001

C‐section
Induced
Labor
Any
Abnormal
Conditions of
Newborn
(1996‐2004)
Any
Complications
of
Labor/Delivery
(1996‐2004)
Any Abnormal
Conditions of
Newborn (1996‐
2004)
Any
Complications
of
Labor/Delivery
(1996‐2004)
Hurricane within 30km, Last ‐0.0035 0.0107 0.0067 0.0381**
Month of Pregnancy (0.0097) (0.0188) (0.0120) (0.0188)
Hurricane 1st Trimester 0.0348** 0.0199
(0.0136) (0.0194)
Hurricane 2nd Trimester 0.0113 0.0202
(0.0141) (0.0192)
Hurricane 3rd Trimester 0.0227** 0.0291**
(0.0087) (0.0118)
Labor was Induced 0.0002 0.0211***
(0.0015) (0.0024)
N 1,440,703 1,440,703 896,390 896,390 896,390 896,390
B. IV with Mother Fixed Effects, Full Term Gestation Exposure Instrument
Hurricane 1st Trimester 0.0362** 0.0217
(0.0137) (0.0195)
Hurricane 2nd Trimester 0.0136 0.0233
(0.0142) (0.0193)
Hurricane 3rd Trimester 0.0389** 0.0406**
(0.0147) (0.0196)
Labor was Induced ‐0.0003 0.0201***
(0.0015) (0.0024)
N 301,683 301,683
A. IV with Mother Fixed Effects ‐ Hazard Model
Notes: Each column in each panel is a separate regression. See notes under Tables 1 and 3 for information about the sample, the storms and hurricanes, and the
estimation methods and controls. For each outcome, births by mothers who have at most one child with non‐missing data for that outcome are omitted. All
regressions include controls for mother's age, education, marital status, and child's birth order, conception year and conception month, and (where applicable)
fixed effects for each month of the 3rd trimester, and an indicator for living within 30km of an area that was ever affected by a storm or hurricane over the time
period of analysis. Robust standard errors are clustered on the mother.
Significance levels: ** p<0.05 ***p<0.001
Table 5: Effects of Hurricanes in Month of Delivery And Effects Controlling for Induction

Any Assisted
Ventilation
Meconium
Aspiration
Syndrome
Assisted
Ventilation: 30+
min
Arterial Blood
Gas pH<7.2
Moderate/Heavy
Meconium
Staining of
Amniotic Fluid
Dysfunctional
Labor
Breech/
Malpresentation
A. IV with Mother Fixed Effects, Full‐Term Gestation Exposure Instrument
Hurricane 1st Trimester 0.0073 0.0136** 0.0150** 0.0165** 0.0137 0.0144** 0.0080
(0.0101) (0.0064) (0.0064) (0.0072) (0.0116) (0.0069) (0.0088)
Hurricane 2nd Trimester ‐0.0249** 0.0326*** 0.0098 0.0061 0.0239** 0.0053 ‐0.0076
(0.0108) (0.0078) (0.0061) (0.0064) (0.0119) (0.0059) (0.0084)
Hurricane 3rd Trimester ‐0.0111 0.0369*** 0.0133** 0.0102 0.0299** ‐0.0022 0.0161**
(0.0106) (0.0091) (0.0053) (0.0069) (0.0132) (0.0056) (0.0081)
N 301,683 301,683 301,683 301,683 301,683 301,683 301,683
B. IV with Mother Fixed Effects, Hazard
Hurricane 1st Trimester 0.0058 0.0136** 0.0152** 0.0164** 0.0141 0.0143** 0.0077
(0.0099) (0.0064) (0.0062) (0.0072) (0.0116) (0.0069) (0.0086)
Hurricane 2nd Trimester ‐0.0268** 0.0320*** 0.0096 0.0055 0.0236** 0.0057 ‐0.0095
(0.0106) (0.0078) (0.0057) (0.0064) (0.0120) (0.0059) (0.0083)
Hurricane 3rd Trimester ‐0.0101 0.0245*** 0.0065** 0.0061 0.0183** ‐0.0006 0.0109**
(0.0063) (0.0056) (0.0029) (0.0042) (0.0080) (0.0033) (0.0051)
N 896,390 896,390 896,390 896,390 896,390 896,390 896,390
Table 6: Effects of Hurricanes on the Most Common Abnormal Conditions and Complications of Labor/DeliveryAbnormal Conditions of Newborn Complications of Labor/Delivery
Notes: Each column in each panel is from a separate regression. These regressions are estimated using data through 2004 only. See notes under Tables 1 and 3 for information about the sample,
the storms and hurricanes, and the estimation methods and controls. For each outcome, births by mothers who have at most one child with non‐missing data for that outcome are omitted.
Significance levels: +p<0.10 **p<0.05 ***p<0.001

Mother
Smoked
During
Pregnancy
Number
Cigarettes
Smoked
Weight Gain
<16 lbs
Weight Gain
> 60 lbs
Mother is
Married
Number
Prenatal
Visits
Number
Prenatal
Visits >7
Adequate
Prenatal Care
(Kessner Index)
A. IV with Mother Fixed Effects, Full‐Term Gestation Exposure Instrument
Hurricane 1st Trimester 0.0100 ‐0.0937 ‐0.0071 ‐0.0161** ‐0.0000 0.1415 0.0364** 0.0372**
(0.0102) (0.1186) (0.0156) (0.0080) (0.0000) (0.1780) (0.0152) (0.0172)
Hurricane 2nd Trimester 0.0202** 0.1073 0.0083 0.0008 ‐0.0000 0.1162 0.0203 0.0224
(0.0091) (0.0823) (0.0141) (0.0065) (0.0000) (0.1474) (0.0133) (0.0155)
Hurricane 3rd Trimester ‐0.0041 0.0061 ‐0.0252+ ‐0.0141+ ‐0.0000 0.0038 ‐0.0122 ‐0.0025
(0.0089) (0.1069) (0.0131) (0.0076) (0.0000) (0.1557) (0.0143) (0.0164)
N 482,248 476,743 412,705 412,705 485,111 457,999 457,999 485,111
B. IV with Mother Fixed Effects, Hazard
Hurricane 1st Trimester 0.0089 ‐0.1003 ‐0.0067 ‐0.0156 ‐0.0000 0.1630 0.0386** 0.0411**
(0.0102) (0.1180) (0.0156) (0.0081) (0.0000) (0.1749) (0.0147) (0.0169)
Hurricane 2nd Trimester 0.0203** 0.1146 0.0076 0.0001 0.0000 0.1385 0.0232 0.0235
(0.0091) (0.0829) (0.0139) (0.0065) (0.0000) (0.1459) (0.0130) (0.0155)
Hurricane 3rd Trimester ‐0.0016 ‐0.0001 ‐0.0119 ‐0.0065 ‐0.0000 0.0286 ‐0.0039 0.0010
(0.0053) (0.0633) (0.0078) (0.0046) (0.0000) (0.0906) (0.0083) (0.0098)
N 1,435,975 1,426,450 1,307,366 1,307,366 1,440,996 1,393,166 1,393,166 1,440,996
Table 7: Possible Mechanisms for the Effects of Hurricanes
Notes: Each column in each panel is from a separate regression. See notes under Tables 1 and 3 for information about the sample, the storms and hurricanes, and the estimation
methods and controls. For each outcome, births by mothers who have at most one child with non‐missing data for that outcome are omitted.
Significance levels: +p<0.10 **p<0.05 ***p<0.001

Mother's
Age <20
Mother's
Age 45+
Mother's
Ed: <HS
Mother's
Ed: HS
degree
Mother's
Ed: Some
College
Mother's
Ed:
College+
Mother's
Ed:
Missing
Mother is
Married
Marital
Status
Missing
Mother is
Black
Mother is
Hispanic
A. No County FE
Hurricane 1st Trimester 0.0212+ ‐0.0003+ ‐0.0399 0.0479 0.0154 ‐0.0182 ‐0.0052 ‐0.0312 ‐0.0006***‐0.1004*** 0.0191
(0.0117) (0.0001) (0.0321) (0.0290) (0.0151) (0.0368) (0.0037) (0.0451) (0.0001) (0.0293) (0.1212)
Hurricane 2nd Trimester 0.0171 0.0006 ‐0.0494 0.0157 0.0183** 0.0238 ‐0.0085** 0.0056 ‐0.0005***‐0.1010*** 0.0036
(0.0297) (0.0009) (0.0378) (0.0239) (0.0085) (0.0511) (0.0036) (0.0527) (0.0001) (0.0282) (0.1176)
Hurricane 3rd Trimester 0.0144 ‐0.0002** ‐0.0326 0.0402** 0.0159 ‐0.0153 ‐0.0082** ‐0.0263 0.0003 ‐0.0930** ‐0.0330
(0.0100) (0.0001) (0.0246) (0.0131) (0.0131) (0.0297) (0.0032) (0.0505) (0.0006) (0.0331) (0.0984)
B. County FE
Hurricane 1st Trimester 0.0006 ‐0.0001 ‐0.0250 0.0190 0.0024 0.0041 ‐0.0004 0.0123 ‐0.0006*** ‐0.0142 ‐0.0118
(0.0057) (0.0001) (0.0214) (0.0173) (0.0151) (0.0158) (0.0029) (0.0236) (0.0001) (0.0108) (0.0355)
Hurricane 2nd Trimester 0.0016 0.0007 ‐0.0285 ‐0.0089 0.0050 0.0362 ‐0.0039 0.0364 ‐0.0005*** ‐0.0191 0.0056
(0.0238) (0.0009) (0.0240) (0.0143) (0.0071) (0.0320) (0.0028) (0.0303) (0.0001) (0.0143) (0.0341)
Hurricane 3rd Trimester 0.0025 ‐0.0001 ‐0.0083 0.0158 0.0037 ‐0.0068 ‐0.0043+ ‐0.0098 0.0004 ‐0.0092 ‐0.0063
(0.0079) (0.0001) (0.0165) (0.0114) (0.0127) (0.0184) (0.0024) (0.0290) (0.0006) (0.0153) (0.0248)
N 485,111 485,111 485,111 485,111 485,111 485,111 485,111 485,111 485,111 485,111 485,111
Appendix Table 1: Maternal Characteristics and Exposure to Hurricanes in Texas
Notes: Each column in each panel is a separate regression. See notes under Table 1 for information on the sample of analysis and the storms and hurricanes. All regressions include conception
year and conception month fixed effects. The regressions in Panel B also include county fixed effects. Robust standard errors are clustered on the county level.
Significance levels: +p<0.10 **p<0.05 ***p<0.001

(1) (2) (3) (4)
Hurricane in 30km Radius During ‐0.0187 0.0083 0.0787 0.1499+
1st Pregnancy (0.0262) (0.0111) (0.0902) (0.0833)
Hurricane * Number Children ‐0.0408** ‐0.0492**
(0.0152) (0.0173)
Hurricane * Mother is ‐0.0085 ‐0.0323
Non‐Hispanic White (0.0724) (0.0725)
Hurricane * Mother is Black ‐0.0917+ ‐0.0946+
(0.0501) (0.0510)
Hurricane * Mother is Hispanic ‐0.0415 ‐0.0812
(0.0490) (0.0543)
Hurricane * Hispanic Missing 0.2054 0.1141
(0.2065) (0.2323)
Hurricane * Mother's Age 20‐24 ‐0.0165 ‐0.0073
(0.0206) (0.0211)
Hurricane * Mother's Age 25‐34 ‐0.0526** ‐0.0444+
(0.0237) (0.0232)
Hurricane * Mother's Age 35‐44 ‐0.0498 ‐0.0378
(0.0366) (0.0346)
Hurricane * Mother's Age 45+ ‐0.1869*** ‐0.1714***
(0.0487) (0.0482)
Hurricane * Mother's Education 0.0487 0.0521
<HS (0.0953) (0.0965)
Hurricane * Mother's Education 0.0858 0.0767
HS+ (0.0726) (0.0728)
Hurricane * Mother's Education 0.0729 0.0682
Some College (0.0455) (0.0452)
Hurricane * Mother's Education 0.1224 0.1664
Missing (0.1322) (0.1177)
Hurricane * Mother is Married 0.0002 ‐0.0012
(0.0240) (0.0231)
Constant 0.0775** 0.0626*** 0.0770** 0.0620***
(0.0292) (0.0125) (0.0294) (0.0125)
(0.0290) (0.0121) (0.0291) (0.0121)
First County of Residence FE No Yes No Yes
N 485,111 485,111 485,111 485,111
Appendix Table 2: Linear Probability Models of the Effect of Hurricane During
First Pregnancy on Probability of Moving >5km Before Next Pregnancy
Outcome: Mother Moved 5+ km Between Pregnancies

Notes: Each column is a separate regression. See notes under Table 1 for information on the sample of analysis and the
storms and hurricanes.
In addition to the listed covariates, all regressions include main effects for mother's race, age, education, marital status, and
number of children as well as conception year and conception month fixed effects. The regressions in the 2nd and 4th
columns also include fixed effects for the mother's first county of residence. All robust standard errors are clustered on the
mother's first county of residence
Omitted categories: mother's race ‐ other; mother's age <20; mother's education college+; mother is unmarried.
Significance levels: +p<0.10 **p<0.05 ***p<0.001

Hurricane During
Pregnancy
Hurricane During
1st Trimester
Hurricane
During 2nd
Trimester
Hurricane During
3rd Trimester
Hurricane within 30km of FIRST Birth Residence During
CURRENT Pregnancy Assuming Full‐Term 0.8740***
Gestation (0.0076)
Hurricane within 30km of FIRST Birth Residence During 1st
Trimester CURRENT Pregnancy Assuming 0.8978***
Full‐Term Gestation (0.0136)
Hurricane within 30km of FIRST Birth Residence During 2nd
Trimester CURRENT Pregnancy Assuming 0.9015***
Full‐Term Gestation (0.0123)
Hurricane within 30km of FIRST Birth Residence During 3rd
Trimester CURRENT Pregnancy Assuming 0.8334***
Full‐Term Gestation (0.0140)
N 485,111 485,111 485,111 485,111
R‐Squared 0.8653 0.8828 0.8829 0.8310
Appendix Table 3: First Stage, Mother Fixed Effects ‐ Calculating from Conception Date to Estimate
Exposure; Full‐Term Gestation Instrument
Notes: Each coefficient is from a separate regression. See notes under Tables 1 for information on the sample. All regressions include include time‐varying controls
for mother's age, education, marital status, and child's birth order, conception year and conception month, and an indicator for living within 30km of an area that
was ever affected by a storm or hurricane over the time period. Robust standard errors are clustered on the mother.
Significance levels: +p<0.10 ** p<0.05 ***p<0.001

Birth Weight
(g)
Low Birth
Weight
(<2500g)
Gestation
(weeks)
Premature
(<37
weeks)
SGA (<25th
Percentile) C‐Section
Induced
Labor
Any Abnormal
Conditions of
Newborn
(1996‐2004)
Any
Complications
of Labor or
Delivery
(1996‐2004)
A. Excluding Large Cities (Houston and Dallas)
Hurricane within 30km ‐0.2177 ‐0.0013 ‐0.0408 0.0044 ‐0.0013 ‐0.0026 ‐0.0135 0.0324** 0.0227
During 1st Trimester (19.4543) (0.0103) (0.0708) (0.0121) (0.0161) (0.0114) (0.0212) (0.0140) (0.0199)
Hurricane within 30km 13.9190 ‐0.0057 0.0388 ‐0.0122 ‐0.0066 0.0114 ‐0.0018 0.0216 0.0194
During 2nd Trimester (18.4608) (0.0095) (0.0710) (0.0125) (0.0147) (0.0102) (0.0190) (0.0147) (0.0199)
Hurricane within 30km 6.4760 0.0048 0.0104 0.0095 ‐0.0088 ‐0.0046 0.0195 0.0456** 0.0273
During 3rd Trimester (17.9751) (0.0099) (0.0629) (0.0114) (0.0144) (0.0106) (0.0185) (0.0154) (0.0200)
N 55,608 55,608 55,611 55,611 55,608 55,594 55,594 34,721 34,721
B. Mothers with No Risk Factors During Any Pregnancy
Hurricane within 30km 2.9500 ‐0.0087 ‐0.0378 ‐0.0009 ‐0.0066 ‐0.0152 ‐0.0098 0.0392** 0.0113
During 1st Trimester (19.1609) (0.0100) (0.0723) (0.0124) (0.0174) (0.0127) (0.0222) (0.0147) (0.0213)
Hurricane within 30km ‐0.6762 0.0061 ‐0.0863 0.0068 0.0060 0.0251** 0.0031 0.0104 0.0205
During 2nd Trimester (19.0330) (0.0098) (0.0721) (0.0127) (0.0157) (0.0105) (0.0195) (0.0157) (0.0207)
Hurricane within 30km ‐5.6062 0.0190+ ‐0.0432 0.0101 ‐0.0096 0.0048 0.0204 0.0377** 0.0411+
During 3rd Trimester (19.3355) (0.0106) (0.0680) (0.0119) (0.0154) (0.0112) (0.0190) (0.0155) (0.0210)
N 421,463 421,463 421,524 421,524 421,463 421,435 421,435 265,960 265,960
Appendix Table 4: Robustness ‐ IV‐Mother Fixed Effects, Full‐term Gestation Instrument
Notes: Each column is from a separate regression. In panel A, mothers residing in Austin, Dallas, Houston, and San Antonio are omitted. In panel B, mothers with risk factors are omitted.
See notes under Tables 1 and 3 for information about the sample, the storms and hurricanes, and the estimation methods and controls. For each outcome, births by mothers who have at
most one child with non‐missing data for that outcome are omitted.
Significance levels: +p<0.10 **p<0.05 ***p<0.001

Birth Weight
(g)
Low Birth
Weight
(<2500g)
Gestation
(weeks)
Premature
(<37
weeks)
SGA (<25th
Percentile) C‐Section
Induced
Labor
Any Abnormal
Conditions of
Newborn
(1996‐2004)
Any
Complications
of Labor or
Delivery
(1996‐2004)
Hurricane within 30km 5.2717 0.0010 ‐0.0572 0.0045 ‐0.0097 0.0145+ 0.0465** 0.0252** 0.0310**
During Pregnancy (15.4113) (0.0079) (0.0555) (0.0095) (0.0119) (0.0087) (0.0156) (0.0117) (0.0154)
WIC Clinic in Zip Code * ‐11.9538 0.0020 0.0310 ‐0.0001 0.0123 ‐0.0203+ ‐0.0675** 0.0078 ‐0.0044
Hurricane within 30km (21.4650) (0.0113) (0.0779) (0.0137) (0.0171) (0.0123) (0.0217) (0.0164) (0.0224)
During Pregnancy
N 485,048 485,048 485,111 485,111 485,048 485,010 485,010 301,683 301,683
Appendix Table 5: WIC Clinic Access Interaction ‐ IV‐Mother Fixed Effects, Full‐term Gestation Instrument
Notes: Each column is from a separate regression. The interacted variable is an indicator that is equal to 1 if a WIC clinic was operating at some point during the mother's pregnancy in her
zip code of residence, and 0 otherwise. See notes under Tables 1 and 3 for information about the sample, the storms and hurricanes, and the estimation methods and controls. For each
outcome, births by mothers who have at most one child with non‐missing data for that outcome are omitted.
Significance levels: +p<0.10 **p<0.05 ***p<0.001

Figure 1: Hurricane and Storm Tracks, 1996‐2008