
James D. Gounder, Peter Kutne, Wolfgang Meier, Development
20
James D. Gounder, Peter Kutne, Wolfgang Meier, Development of a laser- induced plasma probe to measure gas phase plasma signals at high pressures and temperatures, Spectrochemica Acta Part B 74-75 (2012) 66–73. The original publication is available at www.elsevier.com http://dx.doi.org/10.1016/j.sab.2012.06.018
Transcript of James D. Gounder, Peter Kutne, Wolfgang Meier, Development

James D. Gounder, Peter Kutne, Wolfgang Meier, Development of a laser-induced plasma probe to measure gas phase plasma signals at high pressures and temperatures, Spectrochemica Acta Part B 74-75 (2012) 66–73. The original publication is available at www.elsevier.com http://dx.doi.org/10.1016/j.sab.2012.06.018

Development of a Laser-induced Plasma Probe to Measure GasPhase Plasma Signals at High Pressures and Temperatures
J.D. Goundera,∗, P. Kutnea, W. Meiera
aDeutsches Zentrum fur Luft- und Raumfahrt, Institut fur Verbrennungstechnik, Pfaffenwaldring 38-40, 70569 Stuttgart,Germany
Abstract
The ability of Laser Induced Breakdown Spectroscopy (LIBS) technique for on line simulta-neous measurement of elemental concentrations has led to its application in a wide number ofprocesses. The simplicity of the technique allows its application to harsh environments such aspresent in boilers, furnaces and gasifiers. This paper presents the design of a probe using a cus-tom optic which transforms a round beam into a ring (Donut) beam, which is used for forminga plasma in an atmosphere of nitrogen at high pressure (20 bar) and temperature (200 ◦C). TheLIBS experiments were performed using a high pressure cell to characterize and test the effec-tiveness of the donut beam transmitted through the LIBS probe and collect plasma signal in backscatter mode. The first tests used the second harmonic of a Nd:YAG laser, pulse width 7 ns, toform a plasma in nitrogen gas at five different pressures (1, 5, 10, 15 and 20 bar) and three dif-ferent gas temperatures (25, 100 and 200 ◦C). The uniqueness of this probe is the custom madeoptic used for reshaping the round laser beam into a ring (Donut) shaped laser beam, which isfed into the probe and focused to form a plasma at the measurement point. The plasma signal iscollected and collimated using the laser focusing lens and is reflected from the laser beam axisonto an achromatic lens by a high reflection mirror mounted in the center section of the donutlaser beam. The effect of gas pressure and temperature on N(I) lines in the high pressure cellexperiment shows that the line intensity decreases with pressure and increase with temperature.Mean plasma temperature calculated using the ratios of N(I) line intensities range from 7400 K to8900 K at 1 bar and 2400 K to 3200 K at 20 bar for the three different gas temperatures. The re-sults show that as a proof of principle the donut beam optics in combination with the LIBS probecan be used for performing extensive LIBS measurements in well controlled laboratory environ-ment as well as harsh and demanding environments of practical devices at both high pressuresand temperatures.
Keywords: LIBS, High Pressure, High Temperature, Nitrogen
1. Introduction
The reduction of CO2 emissions has become a major topic of research in the last decadedue to the negative environmental impact of CO2 and other green house gases on world climate.
∗Corresponding authorEmail address: [email protected] (J.D. Gounder)
Preprint submitted to Spectrochimica Acta Part B: Atomic Spectroscopy June 11, 2012

In 2007 the European Commission has declared to reduce the emission of greenhouse gases by20 % until 2020 and increase the use of renewable energy [1]. The fossil fuels will remain thelargest source for energy conversion in the next decades. Thus there is an increased interest inpower generation industry towards technologies, which help to reduce CO2 emissions from fossilfuels. One of the these technologies involve the Integrated Gasification Combined Cycle (IGCC)power plant. While gasifiers for other applications already exist [2]. In order to be used in anIGCC the gasifier has to be optimized regarding efficiency and reliability. Slagging caused bymetals and other inorganics in the combustion products of coal has been a major factor affectingthe efficiency of the gasifiers.
A lot of challenges exist in order to perform measurements in gasifiers to study the gasi-fication process as well as measure impurities present in the product gas. One technique thatcould be used for studying and performing measurements in gasifiers would be the laser-inducedbreakdown spectroscopy (LIBS) technique. The LIBS consist of a high energy laser pulse witha short pulse width, focused onto a sample. Photon absorption causes vaporisation of the samplematerial resulting in a plasma with a temperature of several thousands of Kelvins, which dissoci-ates the material into atoms, electrons and ions. As the plasma temperature and electron densitydecay, the species present in the plasma emit photons at characteristic atomic frequencies as theyrelax back to their ground state. Time gated detection of the emitted photons using a spectro-graph coupled with suitable calibration allows the identification and quantification of elementalconcentrations.
The development of LIBS technique in last two decades alone has seen the LIBS techniquereceive considerable attention in fundamental studies as well as applications to practical systems[3, 4, 5]. The use of a laser and a focusing lens for forming a plasma and a spectrograph equippedwith a intensified charge coupled device (CCD), for detecting the signal from the plasma makesthe LIBS technique a very useful analytical tool for elemental analysis. The simplicity and ver-satility of the LIBS measurement technique and minimum effort required for sample preparationallows online, multi elemental detection of solids, liquids and gases. Cremers and Chinni [4]and the references within have listed a large number of applications where LIBS measurementtechnique is used. The applications which relate to the work done in this paper are the analysis ofimpurities in gases [6, 7, 8], measurements of equivalence ratio and fuel concentrations [9, 10, 11]and development of probes for measurements in gasifiers, furnaces and boilers [12, 13, 14, 15].
Blevins et al [12] and Molina et al [13] have performed LIBS experiment in high temperatureenvironment with promising results. They have also highlighted difficulties encounted whileperforming measurements in boilers and furnaces, especially with the layout and setup of themeasurement and probe. Similar challenges can be expected in gasifiers. Eseller et al [8] haveperformed LIBS measurement to detect impurities of N2, Ar and O2 in H2 and study the effect ofpressure on the measurements. Their experiments were carried out at pressures going up to 5 bar.The work of Blevins et al [12] also involved the development of a measurement probe to be usedin the boiler facility. Work has also been done in the development of fiber probes by Dumitrescuet el [16, 17] for performing LIBS measurements in gases. These studies have provided goodinsight into design and development of LIBS probes.
This paper presents the development of a laser beam transforming optics to be used in combi-nation with the LIBS probe for measurements to be performed at high pressure and temperatureenvironment. The LIBS probe has been designed for measurements to be performed at a gasifierfacility where the initial condition of the gas at the measurement point can be around 300 ◦C andover 20 bar pressure. A special custom made optic is used for transforming the 532 nm roundbeam from a Nd:YAG laser into a donut shaped beam, which is then transmitted through the
2

probe and focused to form a plasma. The plasma signal is collected in the back scatter modethrough the laser focusing lens and a high reflective mirror in the center of the donut beam form-ing optics. A comparison between plasma formed using a donut beam profile and a round beamprofile as well as the signal collected is presented.
The similarity in qualitative trends shown in the plasma signal from a round beam and thedonut beam provides confidence in using the LIBS probe with donut forming optics and collec-tion in back scatter mode. So far to the best of the authors knowledge, availability of data fromLIBS measurements or studies performed in gases at high pressures (>10 bar) and high tempera-tures are limited. This paper also provides the characterization of the plasma formed in nitrogengas at three different gas temperatures and five different gas pressures using the LIBS probe.
2. Experimental Method
A number of tests have been carried out to investigate the effectiveness of the high pressureLIBS probe in transmitting a laser beam and collecting plasma signal in back scatter mode. Thissection provides detailed description of the probe, the experimental setup and measurement con-ditions. The use of a high pressure cell allowed for experiments to be performed in a controlledenvironment, eliminating problems that may arise at the high pressure test rig and provided amuch better control of the boundary conditions to study the effect of pressure and temperatureon the plasma. Detailed experiments to study the behavior of the laser plasma formed in nitrogengas atmosphere at 5 different pressures and 3 different temperatures were performed using theLIBS probe and the high pressure cell.
2.1. LIBS Probe
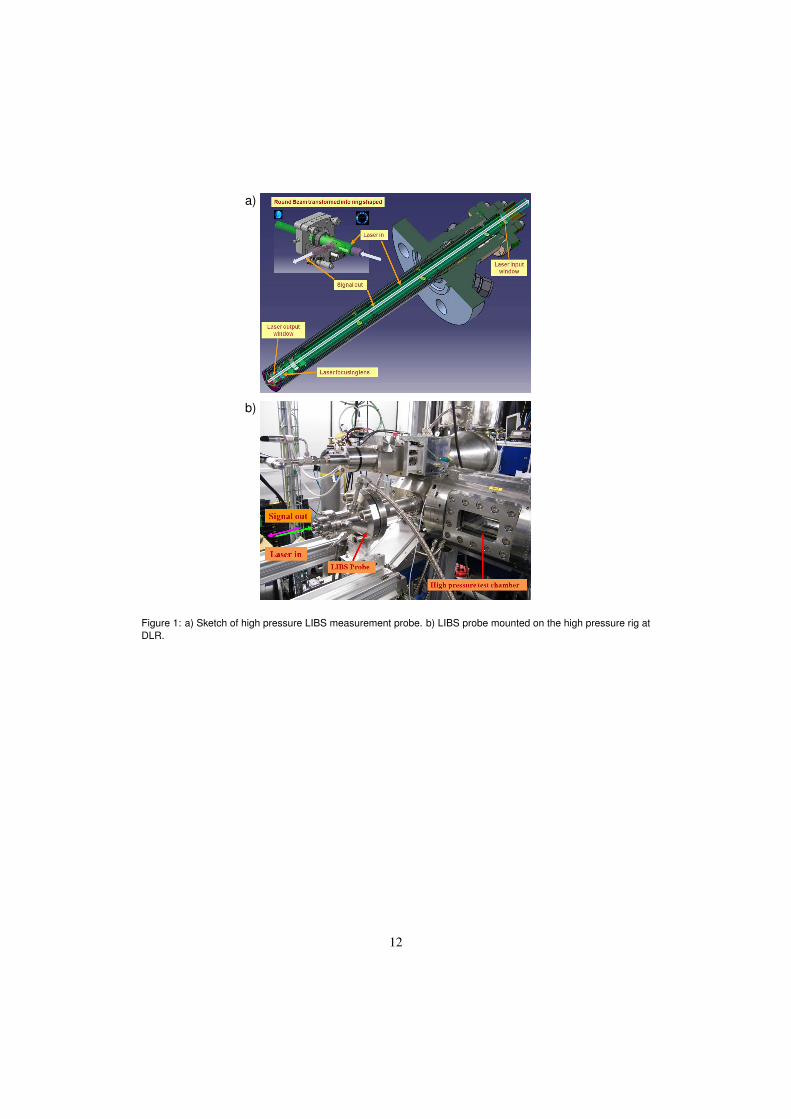
The main purpose of the high pressure LIBS probe is to be used for performing LIBS mea-surements at a gasifier facility hence the probe was designed to be operated in conditions withpressures up to 40 bar and temperatures reaching 1600 ◦C. Figure 1 shows a cross sectionedsketch of the probe. The probe contains a standard DN50 flange which allows simple adapters tobe used for mounting the probe to measurement access ports available at the gasifier facility aswell as the test rig at DLR. For measurements at high temperature the probe requires water cool-ing. Two quartz windows are used for sealing the inlet and exit end of the probe with provisionfor purge air cleaning for the exit window. A best form lens of diameter 25 mm and focal length(fl) of 100 mm is mounted inside the probe as marked in Fig. 1.
To transmit a 532 nm round laser beam through the LIBS probe to form plasma and collectthe signal in back scatter required a custom made beam splitter (filter), that reflected the laserlight at 532 nm and transmitted the plasma signal in the spectral range 350-700 nm. In orderto avoid interference from the scattered green light, the beam splitter had a 80 nm bandwidth(center λ = 532 nm) notch in the transmission spectral range. This transmission efficiency of thebeam splitter dropped significantly at lower wavelengths. A number of other filters were alsotested including a standard notch filter but all filters had significant reduction in transmission atlower wavelengths. Due to reduced detectable spectral range and transmissibility of the beamsplitter and standard filters, a new set of optics were designed to enable transmission of a 532 nmbeam through the LIBS probe, as well as allow collection of the plasma signal without the needof a filter.
This new optical component was designed specifically for the LIBS probe, for transforminga round beam profile into a ring (donut) shaped beam profile. The hole in the middle of the donut
3

beam provided allowance for a high reflective mirror component to be mounted for reflecting theplasma signal 90 ◦ from the laser axis to the collection optics comprising of an achromatic lensand fiber coupler. These optics are assembled and aligned to the optical axis of the probe, at adistance of 600 mm, from input window of the probe. The donut laser beam profile is fed intothe probe and focused by the best form lens creating a plasma. The signal from the plasma iscollected in the back scatter mode. The insert in Fig. 1 a) best illustrates the transformation ofthe laser beam and the collection of the signal. Figure 1 b) shows the LIBS probe assembled atthe high pressure rig at DLR. Details about the high pressure rig can be found in [18].
2.2. Laser configuration and experimental setup
The second harmonic (532 nm) of a Q-switched Nd:YAG laser (Innolas spitlight 600) oper-ating at a repetition rate of 10 Hz and with a pulse duration of 7 ns was used for all experiments.Figure 2 shows the layout of the laser setup to form plasma inside the high pressure cell and thecollection optics. The initial beam diameter of 6 mm out of the laser is expanded and directedinto the beam transforming optics using a beam splitter which reflects 95% of the laser energyand transmits 5% into a pyroelectric detector used for monitoring the laser energy on a shot toshot basis. The donut beam is directed into the probe and is focused by a best form lens of100 mm focal length to form a plasma inside the high pressure cell. The transmission efficiencyof the beam transforming optics is 75%. The mean laser energy in the donut beam was around250 mJ. A LaVision imager intense camera mounted at 90 ◦ is used for imaging the plasma. Thelight from the plasma is attenuated using neutral density filters to avoid damaging the CCD chip.
Spectral emission from the laser induced plasma was collected via back scatter by a highreflective metal mirror mounted in the center of the laser profile. This is shown in the insertin Fig. 1 a). The reflected signal is focused by a achromatic lens and is collected by a fiberoptics coupler connected to a echelle spectrograph (LLA Instruments ESA 4000) via a opticalfiber. The spectrograph has a built in ICCD detector. The image intensifier has been optimisedfor maximum sensitivity at 450 nm. The spectral resolution of the echele spectrograph used inthese experiments, ranges from 5 pm (200 nm) to 19 pm (780 nm). The computer controlling thespectrograph system, is equipped with a fast pulse generator and is programmed to control thelaser and the pyroelectric detector. Esawin software (LLA Instruments) is used for collecting thespectrum. Further detailed description of the spectrograph hardware can be found in [19]. Thegate width for the intensifier was set to 10 µs. For each gas pressure and temperature condition100 spectra were collected and each spectrum was an accumulation of 10 laser shots before theCCD was readout. The laser energy was also, recorded for each readout, which is the mean of10 laser shots.
2.3. Measurement conditions
The high pressure measurements were performed in a laboratory setup using a cell, whichcan be filled with a gas, with provision to pressurize and heat the gas. The external dimensions ofthe high pressure cell is 70 mm x 70 mm x 65 mm with four access windows as shown in Fig. 2.It was used for characterizing the plasma formation at high pressures and temperatures. In thisexperiment the LIBS probe was at atmospheric condition but was still used for transmitting thelaser to form the plasma inside the cell and collect the signal in back scatter mode. Nitrogenwas fed through the cell and the gas pressure was regulated using a needle valve and monitoredusing a pressure gauge connected to the output line of the cell. The cell is fitted with heatingelements which allows the cell and the gas flowing through it, to be heated. Thermocouples
4
are used for monitoring the gas temperature. Figure 3 shows the variation in the density ofnitrogen gas with pressure and temperature. Plasma is formed in pure nitrogen atmosphere atthe given gas pressures and temperatures as shown in Fig. 3. A second set of measurement wasperformed where the collection optics were placed at the second viewing window opposite theCCD camera. Here the laser beam transforming optic was replaced with a mirror to direct anexpanded round beam into the probe. Measurements were performed for the initial conditionspresented in Fig. 3.
3. Results
3.1. High pressure test cell results
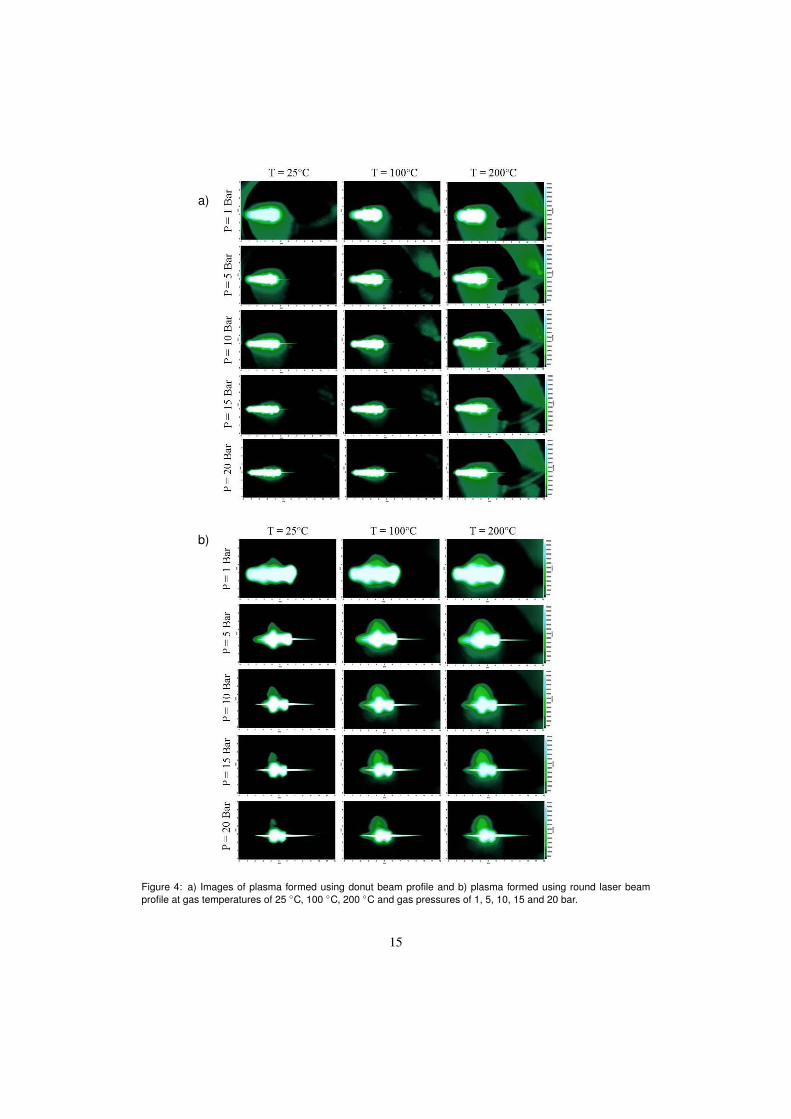
The plasma formed in the nitrogen gas inside the high pressure cell was imaged using aLaVision imager intense CCD camera. Hundred single shot images were collected and eachimage was corrected for background noise and normalized by the attenuation factor from theneutral density filters. The average of the 100 images collected for plasma formed in nitrogen atthree temperatures and five pressures was calculated for two different initial beam shapes. Thefirst set of images were collected for an initial beam profile having a donut shape and the secondset with a round beam profile. Figure 4 shows the mean images of the plasma formed with adonut (a) and a round (b) beam profile.
The single image size is 12 mm(W) x 7 mm(H) and the color scale representing the magnitudeof light intensity in counts is 0 for black and maximum (65000 counts) is represented by white.The average laser energy in the donut beam was 250 mJ/pulse whereas the round beam had320 mJ/pulse. It should be noted that the initial laser energy input into the donut forming opticswas 320 mJ/pulse. Hence for the round beam experiment as stated earlier the donut formingoptics were replaced with a standard high reflective mirror. The donut beam had a 20 mm outsidediameter at the entrance window of the probe whereas the diameter of the round beam was15 mm. Assuming that both beams behave as a Gaussian beam then the spot size at the focalposition can be calculated using r = λf/πro, where f is the focal distance, r is the beam radius andsubscript o represents the beam radius at the focal position. It should be noted that the assumptionthat donut beam behaves as a Gaussian beam is very crude but this does give an approximate sizeof the spot diameter which is acceptable for the purpose of this study. The focal spot diameter is3.4 µm and 4.5 µm for the donut and the round beam respectively. The diffraction limited spotsize diameter is 3.2 µm for the focusing lens setup used for the probe.
The plasma formed using the donut beam profile looks more stable and uniform in shapecompared to the plasma formed using the round beam. It should be noted that the laser energy perpulse for the round beam is 25% higher and the focal spot area is 75% bigger if the beams behavesas a Gaussian beam. If the diffraction limited spot diameter is considered then the round beamwill have a higher irradiance at the focal spot which could be why the plasma images from theround beam show non uniform plasma bubbles. The change in plasma shape and size at differentgas pressures and temperatures could be due to the effect of the gas density on the formationof the plasma. The effect of gas density is transferred into focusing of the laser beam throughvariation of the refractive index of the gas. These images do not provide any spectral informationbut it does give an insight into the form of the plasma and its reproducibility, especially at highpressure.
The entire experimental setup had to be triggered by the spectrograph computer mainly dueto the laser energy monitoring pyroelectric detector functioning only with the internal triggering
5

from the spectrograph computer. This meant that the minimum gate delay time could be set tothe minimum gate time allowed by the esawin software, which is 1 µs. A preliminary test wasconducted where plasma signal in air was measured at five different pressures. This test includedvarying the gate width to optimise the signal to background ratio. This test provided the optimumdelay time of 10 µs. As stated earlier each measured spectrum is an accumulation of 10 lasershots before the spectrum is read out. Spectra are measured with a gate delay of 1 µs after theq-switch is triggered with an intensifier gate width of 10 µs.
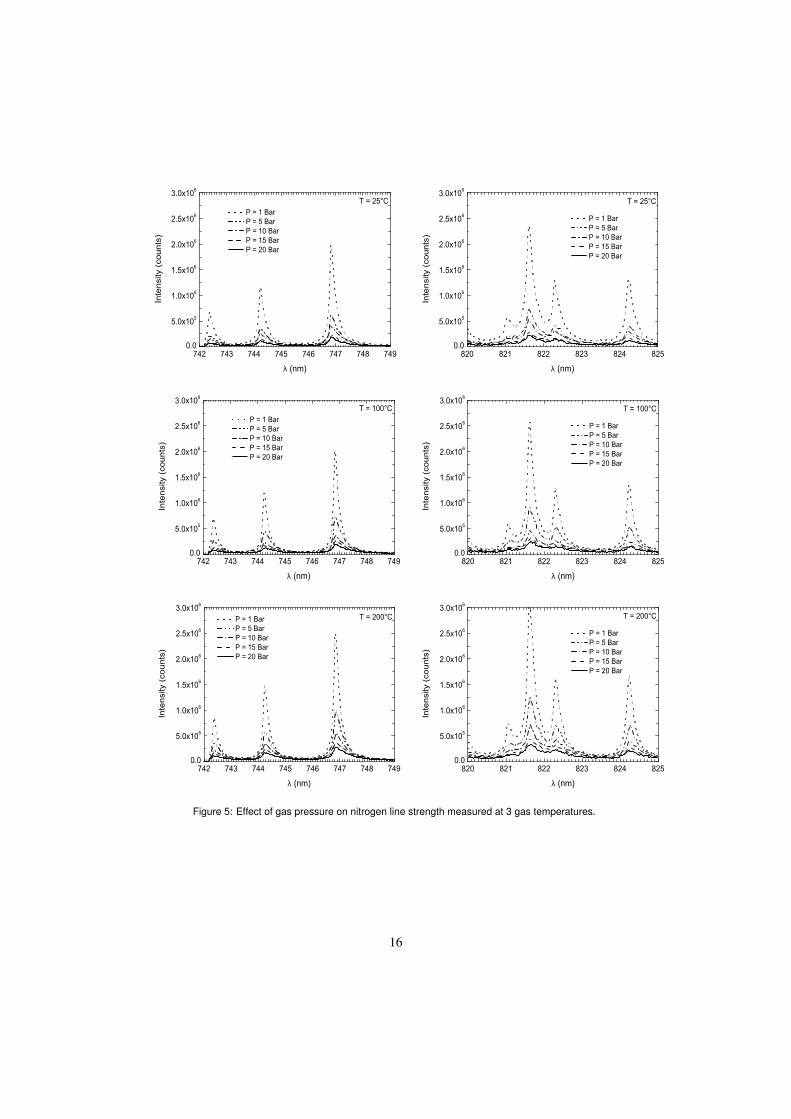
The raw data is exported to be post processed in Matlab 2007 software. The measured spectraare spectrally corrected using the measured spectral response function of the entire optical path.Each spectrum is also corrected for the laser energy fluctuations. The atomic nitrogen linesdetected have been listed in Table 1 with the line data obtained from the NIST database [20].The average spectrum calculated from the 100 measured spectra are presented in figures 5 and6.
The influence of gas pressure on the 6 detected lines is shown in Fig. 5 at fixed gas tem-peratures of 25 ◦C, 100 ◦C and 200 ◦C. For a fixed gas temperature the line intensity decreaseswith pressure. It should also be noted that the effect of pressure is similar for all nitrogen lines.Figure 6 shows the effect of gas temperature on the N(I) line intensities at a fixed pressure. For afixed gas pressure the N(I) line intensities increase with the gas temperature. In the three pressurecases shown in Fig. 6 the line intensities are the strongest for 200 ◦C. The lines are also broaderfor the 200 ◦C case. These results show that there is a definite influence of the gas density (varia-tion of gas pressure and temperature) on the plasma and the detected signal. The ability to detectN(I) lines at gas pressure of 20 bar and temperature of 200 ◦C shows that the LIBS probe withthe special optical configuration can be used.
To test the reproducibility and if the data is physically reasonable, an attempt to deduce themean plasma temperature was made using the mean spectrum shown in Fig. 5 and 6. Even ifusing close lines is not recommended to achieve meaningful plasma temperatures, it should bepossible to see if the trend is linked physically as expected. All the data was processed using aMatlab script written specifically for these cases. First of all the six lines given in Table 1 wereseparated by setting the limits of the end points for each line and the center wavelength being thevalues given in Table 1. The integrated signal from a straight line between the end points wasused as the background. This value was subtracted from the signal. Using the curve fit toolboxfrom Matlab a fit for each line was obtained using the multiple-term Gaussian library model.
Figure 7 shows the corrected data points of all six lines as well as the curve fits for the mini-mum and maximum gas pressure and temperature. As shown all the lines at 1 bar and 25 ◦C havehigh peak intensities and hence curve fitting these data points has been simple. Since the pur-pose of the LIBS probe is to perform measurements at pressures around 20 bar and temperaturesabove 200 ◦C, the question remains how good the curve fits will be at lower signal intensities. Asseen in Fig. 7 the measured data points from the nitrogen lines at 20 bar and 200 ◦C can be wellrepresented by these curve fits. In case of measurements performed at gas temperatures higherthan 200 ◦C the line strength should be stronger as the density will decrease and thus this willallow better curve fits.
Assuming a Maxwell-Boltzmann distribution for the energy distribution function of the 4P-4So transition at 746.831 nm and 4P-4Po at 824.239 nm henceforth these two lines are chosen forthe plasma temperature calculation. The two lines chosen are well isolated and have minimuminterference from any of the neighboring lines. The plasma temperature is determined usingEqn.1, where I is the line intensity, λ the wavelength, g is the statistical weight of the level, Ais the absorption oscillator strength for the transition, E is the energy of the upper level, k is the
6

Boltzmann constant and T is the plasma temperature. The subscripts 1 and 2 represent the twolines. Using the integrated signal from the curve fits and the data provided in Table 1 the meanplasma temperature is calculated.
I1
I2=λ2g1K1
λ1g2K2exp−(E1 − E2)
kT(1)
Figure 8 a) shows influence of gas pressure and temperature on the mean plasma temperaturecalculated from the ratios of the intensities from lines at 746.831 nm and 824.239 nm. It shouldbe noted that the average laser energy for this measurement was 250 mJ and the signal wascollected in the back scatter mode. The mean plasma temperature decreases as the pressureincreases and this could be due the strength and size of plasma as shown earlier in Fig.4. Theerror in the temperature calculated using the two line method can be around 10% at best ofmeasuring conditions. In the current measurement the error is approximately 20% based onthe accuracy of the calibration and the fluctuations in the measured spectrum resulting from thehardware, as well as the correction of the background. The error is quite high as expected whenusing such close lines.
In order to compare the trends shown in the data obtained from the donut beam setup, asecond set of measurement was performed using a round laser beam profile and collecting theplasma signal at 90◦ angle through one of the access windows available in the high pressurecell. Figure 8 b) shows the decay in plasma temperature with pressure similar to what is seenwith measurements performed using the probe with donut beam optics. It should be noted thatthe higher temperatures in Fig. 8 b) could be due to the high laser energy. The influence of gastemperature seems to be small compared to the pressure effect. At 1 bar the plasma temperatureranges from 7400 K to 8900 K as measured using the LIBS probe and this temperature decaysto range of 2400 K to 3200 K at gas pressure of 20 bar. The plasma temperature is an importantparameter for determining the concentration of species present in a sample. Therefore the plasmatemperature obtained from the measurements done using the LIBS probe provides confidence intesting the LIBS probe at the high pressure rig and later performing measurements at the gasifierfacility under high pressure and temperature environment.
4. Conclusion
A probe has been designed and developed to perform laser induced breakdown spectroscopymeasurements in gas at high pressure and temperature. A set of special optics is used for trans-forming a round beam profile into a donut shaped beam profile which is then transmitted throughthe probe to form plasma and the signal from the plasma is collected in the back scatter modeusing a mirror mounted in the center of the donut beam profile. The transmission of laser beamand collection of plasma signal through the LIBS probe has been tested using a high pressure cellfilled with nitrogen gas where the gas pressure has been varied between 1 to 20 bar at 3 differentgas temperatures ranging from 25 to 200 ◦C.
The plasma imaged on a CCD camera shows the influence of gas pressure and temperature onthe shape and size of the plasma from a donut and a round beam profile. The changes in the gasdensity due to variation of pressure and temperature reduce the size of the focal volume wherethe plasma is formed. The line intensities measured using the LIBS probe at high pressure andhigh temperature are high enough to be easily delineated. Mean plasma temperature calculatedusing the ratio of intensities from lines 746.831 nm and 824.239 nm show reasonable values.
7
Even though the errors involved in the temperature may be considered high the trend shown isone that is expected.
A good agreement is seen between the decay trend of the plasma temperatures obtained usinga round laser beam with signal collection at 90◦ to the laser beam axis and the donut laser beamwith signal collection in back scatter. This provides confidence in further developing the donutbeam optics in combination with the LIBS probe for measurements to be performed at a highpressure test facility.
5. Acknowledgments
The work presented here has been carried out as part of the TEIMAB project (SFG Verga-sungsreaktor mit Teilgnench und Abhitzesystem, 0327797D) which is funded by the GermanFederal Ministry of Economics and Technology and Siemens AG. The authors take the respon-sibility for the content of the paper. The authors would also like to acknowledge all the helpprovided by Mr Tobias Raap in setting up of the experiments.
References
[1] McKinsey & Company, available at <http://www.mckinsey.com/clientservice/ccsi/pdf/CCS Assessingthe Economics.pdf>
[2] J. Rezaiyan, N. P. Cheremisinoff, Gasification Technologies A Primer for Engineers and Scientists, Taylor & Fran-cis, 2005.
[3] D. A. Cremers, L. J. Radziemski, Handbook of Laser-Induced Breakdown Spectroscopy, Wiley, New York, 2006.[4] D. A. Cremers, R. C. Chinni, Laser-Induced Breakdown Spectroscopy-Capabilities and Limitations, Appl. Spec-
trosc. Rev. 44 (2009) 457-506.[5] D. W. Hahn, N. Omenetto, Laser-Induced Breakdown Spectroscopy (LIBS), Part I: Review of Basic Diagnos-
tics and Plamsa-Particle Interactions: Still-Challenging Issues With in the Analytical Plasma Community, Appl.Spectrosc. 64 (12) (2010) 335-362.
[6] L. Dudragne, Ph. Adam, J. Amouroux, Time-Resolved Laser-Induced Breakdown Spectroscopy: Application forQualitative and Quantitative Detection of Fluorine, Chlorine, Sulfur, and Carbon in Air, Appl. Spectrosc. 52 (10)(1998) 1321-1327.
[7] H. Zhang, F.-Y. Yueh, J. P. Singh, Laser-induced breakdown spectrometry as a multimetal continuous-emissionmonitor, 38 (9) (1999) 1459-1466.
[8] K. E. Eseller, F.-Y. Yueh, J. P. Singh, Non-intrusive, on-line, simultaneous multi-species impurity monitoring inhydrogen using LIBS.
[9] V. Sturm, R. Noll, Laser-induced breakdown spectroscopy of gas mixtures of air, CO2, N2, and C3H8 for simulta-neous C, H, O, and N measurement, Appl. Opt. 42 (30) (2003) 6221-6225.
[10] L. Zimmer, S. Tachibana, Laser induced plasma spectroscopy for local equivalence ratio measurements in an oscil-lating combustion environment, Proc. Combust. Inst. 31 (2007) 737-745.
[11] T.-W. Lee, N. Hegde, Laser-induced breakdown spectroscopy for in situ diagnostics of combustion parametersincluding temperature, Combust. Flame 142 (2005) 314-316.
[12] L. G. Blevins, C. R. Shaddix, S. M. Sickafoose, P. M. Walsh, Laser-induced breakdown spectroscopy at hightemperatures in industrial boilers and furnaces, Appl. Opt. 42 (30)(2003) 6107-6118.
[13] A. Molina, P. M. Walsh, C. R. Shaddix, S. M. Sickafoose, L. G. Blevins, Laser-induced breakdown spectroscopyof alkali metals in high-temperature gas, Appl. Opt. 45 (18)(2006) 4411-4423.
[14] M. Kurihara, K. Ikeda, Y. Izawa, Y. Deguchi, H. Tarui, Optimal boiler control through real-time monitoring ofunburned carbon in fly ash by laser-induced breakdown spectroscopy, Appl. Opt. 42 (30)(2003) 6159-6165.
[15] C. E. Romero, R. De Saro, J. Craparo, A. Weisberg, R. Moreno, Z. Yao, Laser-Induced Breakdown Spectroscopyfor Coal Characterization and Assessing Slagging Propensity, Energy Fuels 24 (2010) 510-517.
[16] C. E. Dumitrescu, P. V. Puzinauskas, S. Olcmen, Movable fiber probe for gas-phase laser-induced breakdownspectroscopy, Appl. Opt. 47 (31) (2008) 88-98.
[17] C. E. Dumitrescu, P. V. Puzinauskas, S. Olcmen, S. G. Buckley, S. Joshi. A. P. Yalin, Fiber-Optic Spark Deliveryfor Gas-Phase Laser-Induced Breakdown Spectroscopy, Appl. Spectrosc. 61 (12) (2007) 1338-1343.
8
[18] B. K. Kapadia, P. Kutne, J. D. Gounder, W. Meier, Combustion behavior of swirl stabilised oxyfuel flames atelevated pressure, 9th AIAA Annual International Energy Conversion Engineering Conference, Papernr AIAA2011-5593, San Diego, USA, 2011.
[19] K.Loebe, A. Uhl, H. Lucht, Microanalysis of tool steel and glass with laser-induced breakdown spectroscopy, Appl.Opt. 42 (30) (2003) 6166-6173.
[20] P.J. Linstrom, W.G. Mallard, Eds., NIST Chemistry WebBook, NIST Standard Reference Database Number 69,National Institute of Standards and Technology, Gaithersburg MD, 20899, <http://webbook.nist.gov, (retrievedDecember 13, 2011).
9

Table 1: N(I) line data of the detected lines. The data was obtained from the NIST database [20].λ nm gk Aki (108 s1) Ek (eV) gi-gk
742.364 0.226 11.9955 2-4744.229 0.476 11.9955 4-4746.831 0.784 11.9955 6-4821.634 0.226 11.8444 6-6822.314 0.262 11.8374 4-2824.239 1.31 11.7397 6-4
10

Figure captions:Fig. 1 Sketch of high pressure LIBS measurement probe. b) LIBS probe mounted on the highpressure rig at DLR.
Fig. 2 High pressure and temperature LIBS experimental setup.
Fig. 3 Density variation of nitrogen gas due to changing pressure and temperature.
Fig. 4 a) Images of plasma formed using donut beam profile and b) plasma formed using roundlaser beam profile at gas temperatures of 25 ◦C, 100 ◦C, 200 ◦C and gas pressures of 1, 5, 10, 15and 20 bar.
Fig. 5 Effect of gas pressure on nitrogen line strength measured at 3 gas temperatures.
Fig. 6 Effect of gas temperature on nitrogen line strength measured at 3 gas pressures.
Fig. 7 Corrected data points and curve fit for the measured lines of nitrogen at gas pressures1 and 20 bar and temperatures 25 ◦C and 200 ◦C.
Fig. 8 a) Influence of gas pressure and temperature on mean plasma temperature obtained frommeasurements performed using the LIBS probe with donut beam profile (Laser energy ≈ 250mJ) and back scatter collection. b) Mean plasma temperature calculated from measurements per-formed using a round laser beam profile (Laser energy ≈ 320 mJ) and signal collection at 90◦.
11
a)
b)
Figure 1: a) Sketch of high pressure LIBS measurement probe. b) LIBS probe mounted on the high pressure rig atDLR.
12

Figure 2: High pressure and temperature LIBS experimental setup.
13

� � � � � � � � � � � � � � � � �
�
�
�
� �
� �
� �
� �
� �
�
�
��
��
� �
��
��
��
� � � � � � � � � � � �
� � � � � � � �
� � � � � � � � �
� � � � � � � � �
Figure 3: Density variation of nitrogen gas due to changing pressure and temperature.
14
a)
b)
Figure 4: a) Images of plasma formed using donut beam profile and b) plasma formed using round laser beamprofile at gas temperatures of 25 ◦C, 100 ◦C, 200 ◦C and gas pressures of 1, 5, 10, 15 and 20 bar.
15
� � � � � � � � � � � � � �
� � �
� � � � � ��
� � � � � ��
� � � � � ��
� � � � � ��
� � � � � ��
� � � � � ��
� � � � � � � �
����
�
��
���
�
��
�
λ� � � � �
� � � � � � � �
� � � � � � � �
� � � � � � � � �
� � � � � � � � �
� � � � � � � � �
� � � � � � � � � � � � � � � � � �
� � �
� � � � ��
� � � � ��
� � � � ��
� � � � ��
� � � � ��
� � � � ��
� � � � � � � �
����
�
��
���
�
��
�
λ� � � � �
� � � � � � � �
� � � � � � � �
� � � � � � � � �
� � � � � � � � �
� � � � � � � � �
� � � � � � � � � � � � � �
� � �
� � � � � ��
� � � � � ��
� � � � � ��
� � � � � ��
� � � � � ��
� � � � � ��
� � � � � � � � �
����
�
��
���
�
��
�
λ� � � � �
� � � � � � � �
� � � � � � � �
� � � � � � � � �
� � � � � � � � �
� � � � � � � � �
� � � � � � � � � � � � � � � � � �
� � �
� � � � ��
� � � � ��
� � � � ��
� � � � ��
� � � � ��
� � � � ��
�
�
� � � � � � � � �
����
�
��
���
�
��
�
λ� � � � �
� � � � � � � �
� � � � � � � �
� � � � � � � � �
� � � � � � � � �
� � � � � � � � �
� � � � � � � � � � � � � �
� � �
� � � � � ��
� � � � � ��
� � � � � ��
� � � � � ��
� � � � � ��
� � � � � ��
�
�
� � � � � � � � �� � � � � � � �
� � � � � � � �
� � � � � � � � �
� � � � � � � � �
� � � � � � � � �
����
�
��
���
�
��
�
λ� � � � �
� � � � � � � � � � � � � � � � � �
� � �
� � � � ��
� � � � ��
� � � � ��
� � � � ��
� � � � ��
� � � � ��
� � � � � � � � �
����
�
��
���
�
��
�
λ� � � � �
� � � � � � � �
� � � � � � � �
� � � � � � � � �
� � � � � � � � �
� � � � � � � � �
Figure 5: Effect of gas pressure on nitrogen line strength measured at 3 gas temperatures.
16

� � � � � � � � � � � � � �
� � �
� � � � � ��
� � � � � ��
� � � � � ��
� � � � � ��
� � � � � ��
� � � � � ��
�
�
����
�
��
���
�
��
�
λ� � � � �
� � � � � � � �
� � � � � � � � �
� � � � � � � � �
� � � � � � � � �
� � � � � � � � � � � � � � � � � �
� � �
� � � � ��
� � � � ��
� � � � ��
� � � � ��
� � � � ��
� � � � ��
� � � � ��
� � � � � � � � �
����
�
��
���
�
��
�
λ� � � � �
� � � � � � � �
� � � � � � � � �
� � � � � � � � �
� � � � � � � � � � � � � � � � � � � � � �
�
� � � ��
� � � ��
� � � ��
� � � ��
� � � ��
� � � ��
� � � � � � � � � �
����
�
��
���
�
��
�
λ� � � � �
� � � � � � � �
� � � � � � � � �
� � � � � � � � �
� � � � � � � � � � � �
� � �
� � � � ��
� � � � ��
� � � � ��
� � � ��
� � � � � � � � � �
����
�
��
���
�
��
�
λ� � � � �
� � � � � � � �
� � � � � � � � �
� � � � � � � � �
� � � � � � � � � � � � � �
� � �
� � � � � ��
� � � � � ��
� � � � ��
� � � � � ��
� � � � � ��
� � � � � � � � � �
����
�
��
���
�
��
�
λ� � � � �
� � � � � � � �
� � � � � � � � �
� � � � � � � � �
� � � � � � � � � � � � � � � � � �
�
� � � ��
� � � ��
� � � ��
� � � ��
� � � � � � � � � �
����
�
��
���
�
��
�
λ� � � � �
� � � � � � � �
� � � � � � � � �
� � � � � � � � �
Figure 6: Effect of gas temperature on nitrogen line strength measured at 3 gas pressures.
17

� � � � � � � � � � � � � �
� � �
� � � � � ��
� � � � � ��
� � � � � ��
� � � � � ��
� � � � � ��
�
�
��
�
�
��
���
��
λ� � � � �
� � � � � � � � � � � � � � � � �
� � � � � � � � � �
� � � � � � � �
� � � � � � � �
� � � � � � � � � � � � � �
� � �
� � � � � ��
� � � � � ��
� � � � � ��
� � � � � ��
� � � � � ��
� � � � � � � � �
� � � � � � � �
��
�
�
��
���
��
λ� � � � �
� � � � � � � � � � � � � � � � � �
� � � � � � � � �
� � � � � � � � � � � � � � � � � � � � � � � � � � � � � � � � � � � � � � � � � � � � �
� � �
� � � � ��
� � � � ��
� � � � ��
� � � � ��
� � � � ��
� � � � � � � �
� � � � � � � �
��
�
�
��
���
��
λ� � � � �
� � � � � � � � � � � � � � � � �
� � � � � � � � � �
� � � � � � � � � � � � � � � � � � � � � � � � � � � � � � � � � � � � � � � � � � � � �
� � �
� � � � ��
� � � � ��
� � � � ��
� � � � ��
� � � � ��
� � � � � � � � �
� � � � � � � �
��
�
�
��
���
��
λ� � � � �
� � � � � � � � � � � � � � � � � �
� � � � � � � � �
Figure 7: Corrected data points and curve fit for the measured lines of nitrogen at gas pressures 1 and 20 bar andtemperatures 25 ◦C and 200 ◦C.
18

a)
� � � � � � � � � � � � � � � � ��
� � � �
� � � �
� � � �
� � � �
� � � � �
� � � � �
� � � � � � � � � � � � � � � � � �
�
�
��
���
�
��
��
����
����
�
� � � � � � � � � � �
� � � � �
� � � � � �
� � � � � �
b)
� � � � � � � � � � � � � � � � �
�
� � � �
� � � �
� � � �
� � � �
� � � � �
� � � � �
� � � � �
� � � � �
� � � � � � � � � � � � � � � � � �
��
���
�
��
��
����
����
�
� � � � � � � � � � �
� � � � �
� � � � � �
� � � � � �
Figure 8: a) Influence of gas pressure and temperature on mean plasma temperature obtained from measurementsperformed using the LIBS probe with donut beam profile (Laser energy ≈ 250 mJ) and back scatter collection.b) Mean plasma temperature calculated from measurements performed using a round laser beam profile (Laserenergy ≈ 320 mJ) and signal collection at 90◦.
19


