James D. Adams J. Roger Clemmons NBER-SEWP Conference October 20, 2005
33
Research Productivity, Teaching Productivity, and Faculty Compensation: Evidence from U.S. Universities James D. Adams J. Roger Clemmons NBER-SEWP Conference October 20, 2005
-
Upload
james-blankenship -
Category
Documents
-
view
22 -
download
2
description
Research Productivity, Teaching Productivity, and Faculty Compensation: Evidence from U.S. Universities. James D. Adams J. Roger Clemmons NBER-SEWP Conference October 20, 2005. Five Goals. Goals: To conduct a thought experiment on the university & its role in faculty choice. - PowerPoint PPT Presentation
Transcript of James D. Adams J. Roger Clemmons NBER-SEWP Conference October 20, 2005

Research Productivity, Teaching Productivity, and Faculty Compensation:
Evidence from U.S. Universities
James D. Adams
J. Roger Clemmons
NBER-SEWP Conference
October 20, 2005

2
Five Goals Goals:
1. To conduct a thought experiment on the university & its role in faculty choice.
2. To provide evidence on research and teaching productivity in top U.S. universities.
3. To compare productivity in private and public, top 10 and non-top 10 universities.
4. To describe sources of productivity growth in aggregate productivity growth.
5. To explain research & teaching productivity and compensation at the university level.
3
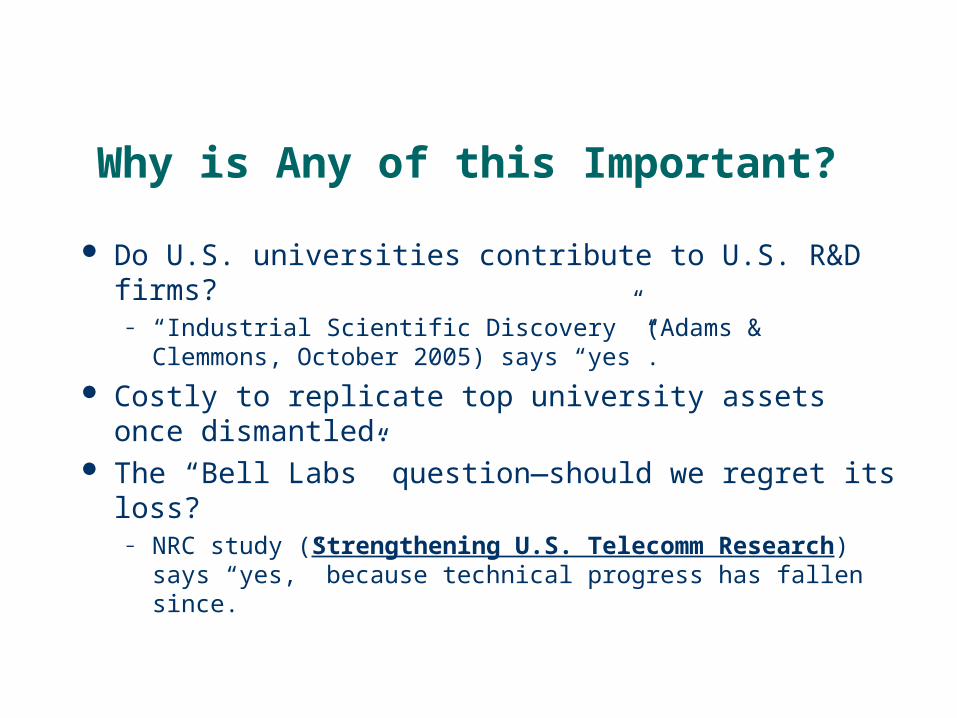
Why is Any of this Important?
Do U.S. universities contribute to U.S. R&D firms?– “Industrial Scientific Discovery” (Adams & Clemmons, October
2005) says “yes”.
Costly to replicate top university assets once dismantled.
The “Bell Labs” question—should we regret its loss?– NRC study (Strengthening U.S. Telecomm Research) says
“yes,” because technical progress has fallen since.

4
A Thought Experiment
Faculty teach and provide research. But who do they work for? For teaching the
answer is usually clear—the school. And yet research faculty cultivate many
clients, more as the life cycle progresses. The university is like a business incubator. It
is arms length in its handling of faculty.

5
Sketch of the FacultyMember’s Problem
Accordingly suppose that faculty have freedoms that workers in “real” jobs lack.
Faculty maximize utility subject to personal production functions and an effort constraint.
They derive satisfaction from income and effort for enjoyment’s sake, but are motivated by net prices for research and teaching.
Choice variables are the effort vector and variable complementary inputs.

6
Model Problem is to maximize the Lagrangian,
Subject to The resulting optimal supplies of output are
)(
)(
IRC
IRXIIRR
eeee
yzzPxPxPUL
. iiiiii zex
ii
i
ii
i
ii
iii
iizi
i
iiii P
a
bPAx
111* IRi ,

7
Implications
Output increases with university efficiency, with output price, with faculty talent, but decrease with complementary input price.
Compensation is an additive function of net income from research and teaching.
It responds to both sets of determinants and increases with optimal output supplies.

8
University Constraints (1)
Faculty rely on fixed or shared inputs—libraries, heating and other utilities, parking, students, top university governance.
These costs must be covered—hence the necessity of the overhead rate.
But the overhead rate distorts faculty incentives, though it supports the institution.

9
University Constraints (2)
The market sets gross prices, but net prices depend on the overhead rate. This must satisfy a solvency constraint.
Net of payments to faculty and variable complementary inputs, the constraint is
Here t is the overhead rate and F is fixed cost.
FxPxPt IIRR )( **

10
Empirical Work: Construction of Faculty-Equivalents
We start with estimates of teaching and research faculty in top U.S. Universities.
Use undergraduate and graduate degrees as teaching outputs—for now.
Construct research outputs—papers and citation-weighted papers.
Build teaching and research labor productivity indicators using these data.

11
Trends in Faculty, 1981-1999
Tenure-track faculty grow at 0.6% per year. Research faculty grow at 1.3%, teaching
faculty at 0.2%. Adjunct faculty, graduate student-teachers--
not well measured in the data. Private university faculty grow at 1.2%, public
university faculty at 0.5%.
12
Separability Hypothesis Concerning Research and Teaching
Suppose that teaching and research are separable production activities.
Teaching effort does not produce research, research effort does not produce teaching.
This is a reasonable assumption for undergraduate teaching.
It is more accurate than assuming the same effort jointly produces both outputs.

13
Problem #1: Joint Researchand Teaching
Ever since Justus von Liebig graduate research & teaching have tended to be jointly produced.
But most teaching is undergraduate & some graduate teaching does not involve research.
Perhaps separability is the more accurate assumption.
Also, graduate and undergraduate teaching expenditures are combined in the data.
Justus von Liebig

14
Problem #2: Human Energy Constraints & Incentives
Energy constraints—research and teaching entail a tradeoff, subject to incentives.
Adam Smith emphasized this problem: “The endowments of schools and colleges have
necessarily diminished more or less the necessity of application in the teachers. …In the University of Oxford, the greater part of the public professors, have, for these many years, given up altogether even the pretence of teaching.”
The Wealth of Nations (p. 717-718, Mod. Lib. Ed.)
Adam Smith

15
Research and Teaching Productivity
Proceeding with the separability assumption, we construct twin indexes of labor productivity:
Research and teaching outputs are divided by faculty equivalents.
Iit
IitIit
Rit
RitRit
L
QLP
L
QLP

16
Trends in Research and Teaching Productivity, 1981-1999
Next we compute productivity trends. For research we find that:
– Papers per research faculty grow at 1.5%– Citations per research faculty grow at 6.6%
For teaching we find that:– BA degrees per instructional faculty grow at 0.8%– All degrees per instructional faculty grow at 0.9%.

17
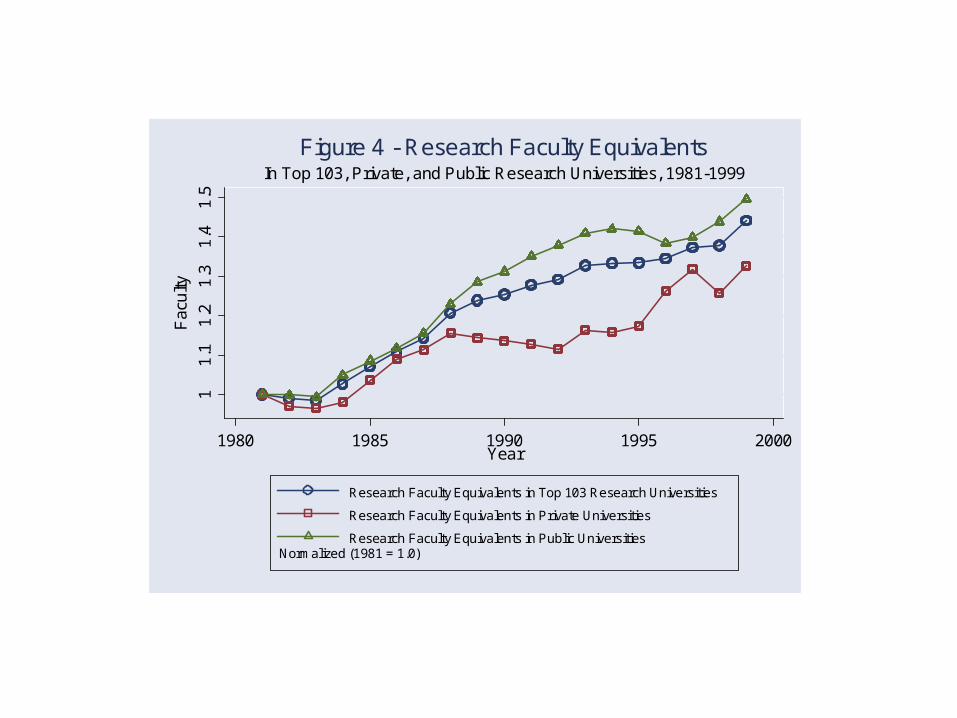
Trends in Graphical Form
Graphs show trends in faculty and productivity by type.
Research faculty grow faster in public universities, but research productivity grows faster in private universities.
Teaching productivity grows faster in public universities, but teaching faculty grow faster in private universities.
18
11
.11
.21
.31
.41
.5
Fac
ulty
1980 1985 1990 1995 2000Year
Research Faculty Equivalents in Top 103 Research Universities
Research Faculty Equivalents in Private Universities
Research Faculty Equivalents in Public Universities
Normalized (1981 = 1.0)
In Top 103, Private, and Public Research Universities, 1981-1999
Figure 4 - Research Faculty Equivalents

19
11
.11
.21
.3
Fac
ulty
1980 1985 1990 1995 2000Year
Instructional Faculty Equivalents in Top 103 Research Universities
Instructional Faculty Equivalents in Private Universities
Instructional Faculty Equivalents in Public Universities
Normalized (1981 = 1.0)
In Top 103, Private, and Public Research Universities, 1981-1999
Figure 5 - Instructional Faculty Equivalents

20
11
.11
.21
.31
.41
.5
Res
ear
ch P
rodu
ctiv
ity
1980 1985 1990 1995 2000Year
Papers per Research Faculty in Top 103 Research Universities
Papers per Research Faculty in Private Universities
Papers per Research Faculty in Public Universities
Papers per Research FacultyIn Top 103, Private, and Public Research Universities, 1981-1999
Figure 6 - Research Productivity

21
11
.52
2.5
Res
ear
ch P
rodu
ctiv
ity
1980 1985 1990 1995 2000Year
Citations per Research Faculty in Top 103 Research Universities
Papers per Research Faculty in Private Universities
Citations per Research Faculty in Public Universities
Citations per Research FacultyIn Top 103, Private, and Public Research Universities, 1981-1995
Figure 7 - Research Productivity

22
.95
11
.05
1.1
1.1
51
.2In
stru
ctio
nal P
rod
uctiv
ity
1980 1985 1990 1995 2000Year
Baccalaureate Degrees per Instructional Faculty in Top 103 Research Universities
Baccalaureate Degrees per Instructional Faculty in Private Universities
Baccalaureate Degrees per Instructional Faculty in Public Universities
Baccalaureate Degrees per Instructional FacultyIn Top 103, Private, and Public Research Universities, 1981-1999
Figure 8 - Instructional Productivity

23
.95
11
.05
1.1
1.1
51
.2
Inst
ruct
iona
l Pro
duc
tivity
1980 1985 1990 1995 2000Year
Total Degrees per Instructional Faculty in Top 103 Research Universities
Total Degrees per Instructional Faculty in Private Universities
Total Degrees per Instructional Faculty in Public Universities
Total Degrees per Instructional FacultyIn Top 103, Private, and Public Research Universities, 1981-1999
Figure 10 - Instructional Productivity

24
Sources of Aggregate Productivity Growth among Universities
Next we examine the sources of productivity growth. This analysis employs a formula from Haltiwanger et alia (2001):
Results are shown on the next slide.
University-Between
11
CovarianceUniversity-Within
11
i titit
i ititi ititttt
LPLPs
LPsLPsLPLPLP

25
Table 5
Sources of Aggregate Productivity Growth In University Research and Teaching, 1981-1999
(Shares in Parentheses)
University Classification
Papers/ Research Faculty
Five-Year Citations/ Research
Faculty
Bacc. Degrees/ Teaching faculty
Total Degrees/ Teaching faculty
All Universities (N=103) Total Productivity Growth 0.789 (1.00) 9.322 (1.00) 0.660 (1.00) 1.187 (1.00)
Within University 0.918 (1.16) 10.940 (1.17) 0.855 (1.30) 1.411 (1.19) Covariance -0.490 (-0.62) -1.972 (-0.21) -0.226 (-0.34) -0.438 (-0.37)
Between University 0.361 (0.46) 0.355 (0.04) 0.032 (0.05) 0.214 (0.18) Private Universities (N=34)
Total Productivity Growth 0.566 (1.00) 21.989 (1.00) -0.325 (1.00) -0.288 (1.00) Within University 0.525 (0.93) 25.677 (1.17) -0.179 (0.55) -0.061 (0.21)
Covariance -0.421 (-0.74) -3.231 (-0.15) -0.166 (0.51) -0.437 (1.52) Between University 0.464 (0.82) -0.456 (-0.02) 0.020 (-0.06) 0.210 (-0.73)
Public Universities (N=69) Total Productivity Growth 1.758 (1.00) 6.409 (1.00) 1.063 (1.00) 1.627 (1.00)
Within University 2.139 (1.22) 6.207 (0.97) 1.115 (1.05) 1.781 (1.09) Covariance -0.557 (-0.32) -0.806 (-0.13) -0.167 (-0.16) -0.324 (-0.20)
Between University
0.176 (0.10) 1.009 (0.16) 0.115 (0.11) 0.171 (0.11)
Notes: Productivity measures are outputs per faculty member. Productivity growth is the long difference between final and initial
productivity over the entire period. It is the arithmetic difference 1XX T , not the percentage difference 11 /)( XXX T . The
decomposition of total productivity growth into within university, covariance, and between university components follows equation (14). Sum of the components may differ slightly from total productivity growth because of rounding error.
26
Regression Analysis of Research Productivity
We also estimated production functions for research in labor productivity form.
Table 7 reports the results. The lagged stock of R&D is significant, but
this and other inputs are sensitive to the inclusion of university fixed effects.
There is evidence of decreasing returns to scale to research at the university level.

27
Table 7 OLS Research Productivity Equations:
Papers and Citations Per Research Faculty (t-Statistics in Parentheses)
Papers per Research Faculty
Citations per Research Faculty
Variable or Statistic
7.1 7.2 7.3 7.4 7.5 7.6 7.7 7.8
Time Period
1982-1999
1982- 1999
1982-1999
1982-1999
1982-1995
1982-1995
1982-1995
1982-1995
University Fixed Effects
No Yes
No Yes No Yes No Yes
Time Trend
-0.016 (-7.1)
0.014 (9.2)
-0.013 (-6.9)
0.012 (7.6)
0.005 (1.2)
0.047 (20.5)
0.009 (2.3)
0.046 (18.8)
Public (1 if yes, 0 if no)
-0.118 (-5.0)
-- 0.056 (2.1)
-- -0.414 (-10.6)
-- -0.003 (-0.1)
--
Log (Stock of R&D per Research Faculty)
0.778 (40.0)
0.192 (7.7)
0.512 (24.7)
0.175 (6.5)
1.095 (32.8)
0.246 (6.8)
0.767 (21.6)
0.272 (7.0)
Log (Endowment per Research Faculty)
0.038 (6.3)
0.006 (0.9)
0.086 (8.2)
0.010 (0.9)
Log (Graduate Students per Research Faculty)
0.259 (11.7)
0.037 (1.2)
0.047 (1.2)
-0.130 (-2.7)
Log (Post-Doctoral Students per Research Faculty
0.146 (14.8)
0.016 (2.3)
0.255 (15.0)
0.054 (3.9)
Log (Research Faculty-1)
-0.190 (-12.5)
-0.497 (-18.5)
-0.191 (-14.3)
-0.457 (-13.4)
-0.165 (-6.3)
-0.392 (-10.0)
-0.191 (-8.2)
-0.441 (-8.6)
N
1525 1525 1525 1525 1306 1306 1306 1306
Root Mean Squared Error
0.385 0.112 0.334 0.111 0.617 0.145 0.545 0.144
F
764.3 510.0 653.0 497.7 546.1 595.8 452.2 588.1
Adjusted R2
0.667 0.972 0.750 0.972 0.626 0.979 0.708 0.980
Notes: Dependent variables are logarithms of papers and citations per research faculty-equivalent. Notice that the number of research faculty-equivalents used to derive the right-hand side variables is lagged one year relative to the number used on the left in order to avoid division error bias.

28
Regression Analysis of Teaching Productivity
We undertook a similar analysis of teaching productivity. Results are shown in Table 9.
Graduate students per faculty play a role in undergraduate degrees (but only in public universities).
As expected, student inputs are significant. Decreasing returns to scale are much weaker
than in the research productivity regressions.

29
Table 9 OLS Teaching Productivity Equations
Baccalaureate Degrees and Graduate Degrees per Faculty (t-Statistics in Parentheses)
Baccalaureate Degrees Per Teaching Faculty
Graduate Degrees
Per Teaching faculty
Variable or Statistic
9.1 9.2 9.3 9.4 9.5 9.6 9.7 9.8
Time Period
1982-1999
1982-1999
1982-1999
1982-1999
1982-1999
1982-1999
1982-1999
1982-1999
University Fixed Effects
No Yes No Yes No Yes No Yes
Time Trend
0.003 (1.9)
0.007 (10.2)
0.003 (1.5)
0.006 (5.7)
0.009 (3.4)
0.012 (12.0)
0.001 (0.2)
0.011 (6.9)
Public (1 if yes, 0 if no)
0.124 (6.4)
-- 1.182 (9.8)
-- -0.393 (-16.0)
-- -1.469 (-8.6)
--
Log (Enrollment per Teaching faculty)
0.689 (31.6)
0.403 (9.0)
0.655 (28.8)
0.364 (7.8)
Log (Endowment per Teaching faculty)
-0.004 (-0.8)
0.006 (1.0)
0.021 (2.9)
-0.010 (-1.5)
Public × Log (State Appropriations per Instructional Faculty)
-0.183 (-9.0)
-0.064 (-2.9)
0.199 (6.9)
-0.091 (-3.8)
Log (Graduate Students per Teaching faculty)
0.103 (6.4)
0.060 (2.2)
0.395 (19.5)
0.303 (10.4)
0.145 (5.1)
0.277 (8.7)
Log (Stock of R&D per Teaching faculty)
0.204 (8.5)
0.049 (2.0)
Log (Teaching faculty-1)
0.037 (3.2)
-0.297 (-6.4)
-0.006 (-0.5)
-0.303 (-5.9)
-0.007 (-0.4)
-0.321 (-8.2)
0.142 (7.4)
-0.358 (-7.9)
N
1360 1360 1360 1360 1360 1360 1360 1360
Root Mean Squared Error
0.288 0.089 0.279 0.088 0.402 0.098 0.377 0.097
F
384.8 280.8 249.3 275.5 203.9 341.4 160.7 337.1
Adjusted R2
0.530 0.955 0.561 0.956 0.374 0.963 0.451 0.964
Notes: Time period is 1982-1999. The dependent variables are logarithms of baccalaureate degrees and total degrees per teaching faculty-equivalent. Graduate degrees include baccalaureate, masters’, professional, and doctoral degrees. Notice that the number of teaching faculty -equivalents used to derive the right-hand side variables is lagged one year relative to the number used on the left.

30
Regression Analysis of Faculty Compensation
Finally we explore determinants of faculty compensation—salary plus fringes.
Because compensation depends on the sum of net values of output in both research and teaching, all variables are expressed in log deviations from the mean of the sample.
Results are shown in Table 11 below.

31
Table 11
Salary plus Fringe Benefits per Faculty Regressions in Deviation Form
(t-Statistics in Parentheses)
All Universities
Variable or Statistic 11.1 11.2 11.3 11.4 11.5 11.6 11.7 11.8
Time Period
1982-1999
1982-1999
1982-1999
1982-1999
1982-1995
1982-1995
1982-1995
1982-1995
University Fixed Effects No Yes No Yes No Yes No Yes
Time Trend
0.019 (25.4)
0.022 (54.6)
0.018 (24.2)
0.022 (37.4)
0.019 (24.1)
0.022 (40.7)
0.018 (24.1)
0.022 (32.9)
Private Control (1 if yes, 0 if no)
0.063 (7.9)
-- -0.039 (-2.9)
-- 0.051 (6.4)
-- -0.037 (-2.7)
--
Log (Papers per Research Faculty)
0.029 (4.5)
0.022 (2.2)
0.024 (4.0)
0.014 (1.4)
Log (Citations per Research Faculty)
0.037 (8.4)
0.013 (1.6)
0.021 (4.9)
0.002 (0.2)
Log (Baccalaureate Degrees per Teaching Faculty
-0.072 (-7.5)
-0.062 (-4.0)
-0.100 (-11.7)
-0.064 (-4.1)
-0.058 (-6.1)
-0.075 (-4.8)
-0.096 (-11.1)
-0.078 (-4.9)
Log (Graduate Degrees per Teaching Faculty)
0.045 (5.4)
-0.017 (-1.2)
0.046 (6.4)
-0.026 (-1.8)
0.031 (3.9)
-0.011 (-0.8)
0.043 (6.1)
-0.019 (-1.3)
Log (Endowment per Research Faculty)
0.003 (1.5)
0.004 (1.4)
0.002 (1.1)
0.013 (4.0)
Share of Full Professors in Tenure Track Faculty
0.587 (12.9)
0.301 (5.1)
0.581 (12.6)
0.333 (5.6)
Share of Associate Professors in Tenure Track Faculty
-0.064 (-0.9)
-0.027 (-0.4)
-0.031 (-0.4)
0.020 (0.3)
Log (Tuition/Student)
0.024 (3.5)
-0.011 (-1.5)
0.020 (2.8)
-0.015 (-1.9)
N
1346 1346 1346 1346 1292 1292 1292 1292
Root Mean Squared Error
0.116 0.048 0.100 0.048 0.113 0.047 0.099 0.046
F
244.6 130.3 237.3 128.9 267.6 138.2 243.6 139.6
Adjusted R2
0.475 0.909 0.613 0.911 0.508 0.917 0.629 0.921
Notes: The dependent variable is the deviation of the logarithm of salary plus fringe benefits per faculty from the mean of the sample. Likewise, all variables on the right are deviations of the logarithms from the respective means for those variables. Note that the number of faculty used to derive the right -hand side variables is lagged one year relative to the number on the left.

32
Discussion of Compensation Results
Compensation usually rises faster than productivity (compare trends).
Compensation rises with research productivity, but falls with undergraduate teaching productivity.
Selective forces and the allocation of effort away from more highly valued skills drive this last result.

33
Conclusions
This paper seeks to explain the university in terms of applied microeconomics and to study its growth.
An empirical survey suggests that growth is slow and proceeds with allocative inefficiency.
Slow growth related to budget problems, to opportunities in industry that raise wages.
More work needed—especially on value of teaching output and use of part-time faculty.