J. Membrane Biol. 150, 89–103 (1996) Membrane Biology Transfer Between Cells of the Lens J.L. Rae...
15
Dye Transfer Between Cells of the Lens J.L. Rae 1 , C. Bartling 1 , J. Rae 1 , R.T. Mathias 2 1 Departments of Physiology and Biophysics and Ophthalmology, Mayo Foundation, Rochester, MN 55905 2 Department of Physiology and Biophysics, SUNY, Stony Brook, NY 11794-8661 Received: 14 September 1995/Revised: 13 November 1995 Abstract. Dye transfer between lens fiber cells and be- tween lens epithelial cells and underlying fiber cells was studied using a wide dynamic range-cooled CCD cam- era, H 2 O immersion objectives and image analysis tech- niques. Each lens was decapsulated by a new technique which leaves the epithelial cells adherent to the lens fiber mass. Lucifer Yellow CH was injected into either single epithelial cells or single fiber cells using the standard whole cell configuration of the patch voltage clamp tech- nique. The results demonstrate extensive dye communi- cation between fiber cells at the lens posterior surface, anterior surface, and equatorial surface. Dye transfer be- tween deep fiber cells was also observed. Dye transfer between ≈10% of epithelial cells and their underlying fiber cells was apparent when care was taken to yield wide dynamic range images. This was required because the relatively high concentration of dye in the epithelial cell masks the presence of much lower dye concentra- tions in the underlying fiber cell. A mathematical model which includes dye concentration, time, and spatial spread suggests that those epithelial cells that are cou- pled to an underlying fiber cell are about as well dye coupled as the epithelial cells themselves. The relatively low dye concentration in a fiber cell is due to its larger volume and diffusion of the dye along the axis of the fiber away from the fiber/epithelial junction. Key words: Lens — Epithelium — Fibers — Dye trans- fer — Gap junctions Introduction Over more than 20 years, evidence has been accumulat- ing that the lens fiber cells and even lens epithelial cells exist as a functional 3-dimensional syncytium (Duncan, 1969; Mathias, Rae & Eisenberg, 1981). In most early studies aimed at demonstrating cell-to-cell dye transfer between fiber cells or between fiber and epithelial cells, the dye transfer could be observed. In embryonic chick lenses, pathways for dye movement between fiber cells and between epithelial and fiber cells was demonstrated (Schuetze & Goodenough, 1982; Miller & Goodenough, 1986). Cell-to-cell dye movement between fiber cells of adult Rana pipiens lenses was also reported (Rae, 1974; Rae & Stacey, 1976) and, moreover, epithelial and fiber cells were reported to be electrically coupled in adult frog lenses (Rae & Kuszak, 1983). Several morpholog- ical studies reported the existence of gap junctions be- tween lens epithelial and fiber cells (Goodenough et al., 1980; Miller & Goodenough, 1986; Lo & Reese, 1993). Recently, applications of more modern imaging technology have arrived at somewhat different conclu- sions. While freeze fracture transmission electron mi- croscopy easily demonstrates structures that look like gap junctions between lens fibers cells, few if any gap junctions between lens epithelial and fiber cells could be observed in a recent study (Brown et al., 1990). These results prompted several investigators (Bassnett et al., 1994) to question the existence of metabolic communi- cation between lens epithelium and fibers. Confocal mi- croscopy applied to intact lenses following the micro- electrode injection of Lucifer Yellow CH into single fi- ber cells of frog lenses failed to demonstrate fiber to fiber dye movement except in a small region near the lens equator (Prescott et al., 1994). These authors also sug- gest that metabolic communication between fiber cells might not exist in general. Several investigators have reported that BCECF AM or SNARF-1 loaded into ep- ithelial cells of whole lenses does not obviously pass into fiber cells and can take more than an hour to leak from Correspondence to: J.L. Rae J. Membrane Biol. 150, 89–103 (1996) The Journal of Membrane Biology © Springer-Verlag New York Inc. 1996
Transcript of J. Membrane Biol. 150, 89–103 (1996) Membrane Biology Transfer Between Cells of the Lens J.L. Rae...
Dye Transfer Between Cells of the Lens
J.L. Rae1, C. Bartling1, J. Rae1, R.T. Mathias21Departments of Physiology and Biophysics and Ophthalmology, Mayo Foundation, Rochester, MN 559052Department of Physiology and Biophysics, SUNY, Stony Brook, NY 11794-8661
Received: 14 September 1995/Revised: 13 November 1995
Abstract. Dye transfer between lens fiber cells and be-tween lens epithelial cells and underlying fiber cells wasstudied using a wide dynamic range-cooled CCD cam-era, H2O immersion objectives and image analysis tech-niques. Each lens was decapsulated by a new techniquewhich leaves the epithelial cells adherent to the lens fibermass. Lucifer Yellow CH was injected into either singleepithelial cells or single fiber cells using the standardwhole cell configuration of the patch voltage clamp tech-nique. The results demonstrate extensive dye communi-cation between fiber cells at the lens posterior surface,anterior surface, and equatorial surface. Dye transfer be-tween deep fiber cells was also observed. Dye transferbetween≈10% of epithelial cells and their underlyingfiber cells was apparent when care was taken to yieldwide dynamic range images. This was required becausethe relatively high concentration of dye in the epithelialcell masks the presence of much lower dye concentra-tions in the underlying fiber cell. A mathematical modelwhich includes dye concentration, time, and spatialspread suggests that those epithelial cells that are cou-pled to an underlying fiber cell are about as well dyecoupled as the epithelial cells themselves. The relativelylow dye concentration in a fiber cell is due to its largervolume and diffusion of the dye along the axis of thefiber away from the fiber/epithelial junction.
Key words: Lens — Epithelium — Fibers — Dye trans-fer — Gap junctions
Introduction
Over more than 20 years, evidence has been accumulat-ing that the lens fiber cells and even lens epithelial cells
exist as a functional 3-dimensional syncytium (Duncan,1969; Mathias, Rae & Eisenberg, 1981). In most earlystudies aimed at demonstrating cell-to-cell dye transferbetween fiber cells or between fiber and epithelial cells,the dye transfer could be observed. In embryonic chicklenses, pathways for dye movement between fiber cellsand between epithelial and fiber cells was demonstrated(Schuetze & Goodenough, 1982; Miller & Goodenough,1986). Cell-to-cell dye movement between fiber cells ofadultRana pipienslenses was also reported (Rae, 1974;Rae & Stacey, 1976) and, moreover, epithelial and fibercells were reported to be electrically coupled in adultfrog lenses (Rae & Kuszak, 1983). Several morpholog-ical studies reported the existence of gap junctions be-tween lens epithelial and fiber cells (Goodenough et al.,1980; Miller & Goodenough, 1986; Lo & Reese, 1993).
Recently, applications of more modern imagingtechnology have arrived at somewhat different conclu-sions. While freeze fracture transmission electron mi-croscopy easily demonstrates structures that look likegap junctions between lens fibers cells, few if any gapjunctions between lens epithelial and fiber cells could beobserved in a recent study (Brown et al., 1990). Theseresults prompted several investigators (Bassnett et al.,1994) to question the existence of metabolic communi-cation between lens epithelium and fibers. Confocal mi-croscopy applied to intact lenses following the micro-electrode injection of Lucifer Yellow CH into single fi-ber cells of frog lenses failed to demonstrate fiber to fiberdye movement except in a small region near the lensequator (Prescott et al., 1994). These authors also sug-gest that metabolic communication between fiber cellsmight not exist in general. Several investigators havereported that BCECF AM or SNARF-1 loaded into ep-ithelial cells of whole lenses does not obviously pass intofiber cells and can take more than an hour to leak fromCorrespondence to:J.L. Rae
J. Membrane Biol. 150, 89–103 (1996) The Journal of
MembraneBiology© Springer-Verlag New York Inc. 1996
Rae et al. 558
the cells (Wolosin et al., 1988; Wolosin, Alvarez & Can-dia, 1990; Bassnett, 1990; Bassnett et al., 1994). Thistime period, they propose, is longer than would be ex-pected if the dye were able to transverse gap junctionsand enter the fiber cell. Bassnett et al. (1994) were ableto dye fill fiber cells in embryonic chick lenses and toobserve dye spread into the overlying epithelial cells.When they filled epithelial cells, however, they could notsee dye move into the fiber cells below.
How are these major differences in findings to berationalized? It is possible that the epithelial-fiber elec-trical coupling demonstrated by Rae and Kuszak (1983)in frog lenses might be in error. While Rae & Kuszakused a marker dye to ensure that their voltage-measuringelectrode was inside a single lens epithelial cell, it mayhave resided somehow in a surface fiber cell. The Pro-cion scarlet dye used to mark the position of their voltageelectrode did not fluoresce appreciably and could noteffectively demonstrate cell-to-cell dye transfer. Theirevidence for epithelial-cell-to-fiber-cell coupling was,therefore, entirely electrical. The experiments ofSchuetze and Goodenough (1982) and Miller and Good-enough (1986) did demonstrate both fiber-to-fiber andepithelial-to-fiber dye transfer but only in embryonicchick lenses. Perhaps these results do not hold for moremature lenses. The fiber-fiber dye transfer demonstratedby Rae (1974) and Rae and Stacey (1976) was done inmature frog lenses using fixed and embedded lenses andso movement of dye from cell to cell during the tissuepreparation could not be ruled out though care was takento avoid this artifact.
On the other hand, there is no paucity of artifacts orsensitivity issues which might result in failure to dem-onstrate cell-to-cell diffusion pathways. An intracellularmicroelectrode rarely has a seal around it that exceeds100 megohms and the seal resistance can be very muchlower than this. Lack of a tight seal can allow extracel-lular substances like Ca+2 to enter the cytoplasm whichmight result in uncoupling from adjacent cells. More-over, in a 3-dimensional syncytium, the intensity of thedye fluorescence is expected to fall very rapidly withdistance from the injection site by comparison to theexpectation from either one-dimensional or two-dimensional syncytia. Thus, it would be possible for dyespread to occur but for the detection procedures to lacksufficient sensitivity to quantify or even detect thespread.
The existence of metabolic communication betweenlens fiber cells and between lens epithelium and fibersare important issues. We therefore chose to reinvestigatethem using more modern electrophysiological ap-proaches and more modern imaging approaches than weand most other investigators have used in the past. Withthese approaches, we routinely find dye transfer betweenfiber cells and between epithelium and fibers in severaldifferent kinds of lenses.
Materials and Methods
PREPARATION OF THERAT LENS
Most experiments were done on lenses obtained from albino Sprague-Dawley rats (both sexes). We used rats weighing approximately 200 gbecause their lenses were large and relatively easy to work with. Therats were euthanized by an intraperitoneal injection of 25% urethanesolution. After death, the globes were enucleated and placed in NaClRinger’s solution at room temperature. The posterior globe was re-moved by cutting posterior to the zonules with fine iris scissors. Thecornea and iris were then cut around their periphery and discarded.This dissection left the lens and capsule intact, attached via its zonulesto a ring of uveal-scleral tissue.
EMBEDDING THE RAT LENS IN AGAROSE
A small[184 Sylgard (Dow Corning, Midland, MI) mat (6 mm square× 2 mm thick) was used to position the lens for embedding in agarose.A [1 cork borer was used to trephine a hole in the center of the mat.The mat was submerged in NaCl Ringer’s solution and the rat lenspositioned over the hole using a lens loop. For mostfiber-fiber cellexperiments,the posterior of the lens fit down into the hole in theSylgard mat; forepithelial-fiber cell experiments,the opposite orien-tation was used. A 2% weight/volume agarose solution was made,using equal amounts of SeaKem GTG and SeaPlaque agarose (FMCBioProducts, Rockland, ME) dissolved in NaCl Ringer’s solution.Microwave heat was applied to dissolve the agarose. The agarose wascontinuously stirred and measured with a thermometer until it cooled toapproximately 37°C. At this point, the Sylgard mat with the lens wascarefully moved from the Petri dish containing Ringer’s solution to asilicone flat embedding mold (Ted Pella, Redding, CA). Agarose so-lution was poured over the positioned lens, filling the embeddingtrough. Enough agarose was used to completely cover the lens andoverflow the trough. As the agarose began to gel, a Petri dish coverwas placed, without pressure, over the trough to flatten the agarosesurface. Once the agarose had adequately gelled, the Petri dish coverwas removed and the excess agarose was trimmed with a razor blade,squaring the sides of the agarose mold to match the sides of the em-bedding trough. The entire agarose mold, containing the rat lens, wascarefully removed from embedding mold, and placed in a Petri dishcontaining NaCl Ringer’s solution. Using a[5 jeweler’s forceps, theSylgard mat was carefully removed from the agarose mold, yielding anexposed portion of the rat lens.
DECAPSULATION OF THERAT LENS
Decapsulation of the lens was necessary for patch clamping the fiberand epithelial cells of the rat lens (Dewey, Bartling & Rae, 1995).A Ca+2-Mg+2-free solution containing 10 mM bumetanide (SigmaChemical, St. Louis, MO) was used to incubate the exposed portion ofthe lens prior to decapsulation. The agarose block was submerged inthe decapsulation solution and incubated for 15–30 min at room tem-perature. After incubation, the agarose block was removed from thedecapsulation solution and the capsule was gently teased from theexposed lens area using two pairs of[5 jeweler’s forceps.
PATCH ELECTRODES
Corning borosilicate[7052 glass was pulled on a constant temperaturecoil vertical puller. The electrode tips were firepolished to final resis-
90 J.L. Rae et al.: Lens Dye Transfer
tances of approximately 8MV when filled with our pipette solutions.For Lucifer Yellow CH experiments, the electrode tip was filled witha lithium chloride solution and was then backfilled with a lithiumchloride-Lucifer Yellow CH solution.
PATCH CLAMPING AND DYE IONTOPHORESIS OFRAT
LENSCELLS
The agarose block was mounted in an acrylic chamber where the blockwas held in place by compression. The acrylic chamber was mount-ed on a modified stage of a Leitz Laborlux (Rockleigh, NJ) uprightepifluorescence microscope with a Leitz 25× long working-distanceHoffman modulation contrast objective. A NaCl Ringer’s solution wasused to bathe the exposed lens tissue during the experiments. A lineartranslator was used to move the electrode against an exposed cellmembrane and the current was monitored while applying a 5 mVtestpulse. Gentle suction was used to allow gigohm seals to form to acell’s membrane. The seal resistance was measured and gentle suctionwas again used to rupture the membrane patch inside the opening of theelectrode tip. Rupture of the membrane patch, to achieve awhole-cellpatch clampconfiguration, allowed maximum access to the cell’s in-terior for dye injection while minimizing the amount of dye and ionleakage at the membrane-seal interface.
Iontophoretic currents of 1 to 15 nA were applied using aPCLAMP (Axon Instruments, Foster City, CA) voltage protocol fortimes between 10 to 40 mins.
SOLUTIONS
The sodium chloride Ringer’s solution contained (in mM): 149.2 NaCl,4.74 KCl; 2.54 CaCl2, 5 HEPES, and 5 glucose. The pH was bufferedto 7.35 and the osmolarity was measured at 290 mOsm/kg. The cal-cium-magnesium free bumetanide solution contained (in mM): 150KMeSO3, 2 EDTA, 5 HEPES, 0.01 bumetanide, and 5 glucose. Thebumetanide was added from a 10 mM stock solution in absolute ethanol.The pipette solution used with all Lucifer Yellow experiments con-tained (in mM): 150 LiCl, 2 EGTA, and 5 HEPES. The pH was titratedto 7.00 after adding the dye and the osmolarity was measured at 275mOsm/kg. The Lucifer Yellow CH dye was dissolved in the lithiumchloride solution to a final concentration of 5 mM.
IMAGE CAPTURE ANDANALYSIS
Images were captured using a MCD1000 peltier-cooled charge-coupleddevice (CCD) imaging system (SpectraSource Instruments, WestlakeVillage, CA). The system consisted of a 1024× 1024 CCD chip array,a 16-bit digitizer, a TEC Control Unit which powered both the externalcooling fans and the peltier-cooling of the CCD chip itself, and theHPC-1 software running under Microsoft Windows. Images were cap-tured in a 16-bit 512× 512 pixel image format, and each image wasbias and flat field image-corrected (seebelow). Most images weretaken with a 40×, 0.75 NA water immersion objective (Carl Zeiss, WestGermany). The images not being used for quantitation were correctedfor out-of-plane fluorescence by using a no-neighbors deblurringscheme described by Monck et al. (1992). Final image analysis andcontrast enhancement were performed on a Sun Microsystems SPARCworkstation (SUN Microsystems, Mountain View, CA) using theANALYZE software package (Biomedical Imaging Resource, MayoClinic, Rochester, MN).
CCD NONUNIFORMITY IMAGE CORRECTION
The images were modified by bias field subtraction and by flat fieldscaling to correct for imperfections in the CCD array. The bias fieldsubtraction corrects for nonzero charge in the CCD array immediatelyafter clearing the array and with no light applied. The bias field imagewas subtracted from the raw image before flat field image correction.The flat field image correction normalizes the image data for differ-ences in photon collection efficiency for each pixel in the array. Thisis accomplished by multiplying each pixel’s bias field-corrected valueby a scale factor. The scale factor, found by imaging a uniformlyilluminated field of view, is equal to the collected pixel’s value dividedby the average value of all the pixels in the array.
NO NEIGHBORSDEBLURRINGSCHEME
Bias field- and flat field-corrected images obtained from the HPC-1software were processed in a custom program after undergoing fileformat conversion. Monck et al. (1992) have developed a deblurringscheme which utilizes a simple inverse filter to extract optically rele-vant data from an input image without the need for adjacent imagesections. The deblurring algorithm removes out-of-focus informationfrom an image by convolution of the in-focus image. The resultantblurred image is then multiplied by a factor of two. The image productis then subtracted from the original in-focus image, and a Wienerinverse filter convolution was used for final image sharpening:
Ij = [{Oj − 2 c OjS1}{So/(So2 + a)}]
whereOjS1 represents the blurred in-focus image,Oj, the original in-focus image,S1, the blurred image contrast transfer function,So, thein-focus image contrast transfer function, andc anda, empirical con-stants (typical values of 0.48 and 5.00 were used, respectively). Allcapital letters represent Fourier transforms of the respective pointspread functions. In the calculation ofS1, a hypothetical section spac-ing (Dz) was used to control the sectioning thickness parameter utilizedin the deblurring algorithm. The Dz parameter was typically set at 1mm. The numerical aperture of the objective lens (0.75), the wave-length of light emitted by the fluorophore (535 nm), pixel size (0.22mm), and the index of refraction of the objective immersion medium(water, 1.3) were also utilized as parameters in the deblurring algorithm(Monck et al., 1992).
OTHER IMAGE PROCESSING
Resultant deconvolved images were saved and transferred to the SunMicrosystems SPARCstation1 workstation running the SunOS operat-ing system. Images were retrieved in the ANALYZE image processingand analysis program. Many of the images were further processed byan adaptive histogram equalization operation. This process adjusts thegray scale values of an image based on the localized image area his-togram. The localized area consists of an 8× 8 pixel kernel, with theresulting histogram consisting of 64 sample values. The purpose of thisequalization operation is to enhance the viewable contrast in all areasof the image, without the preservation of any mathematical relationshipof gray level scale. The operation creates a histogram of gray levelvalues for each localized area kernel. The contrast is then adjustedlocally within each area kernel. The gray scale for the entire image iscalculated similarly to avoid any checkerboarding. A clipping fractionlimits the contribution of any pixel’s given gray level value, and thusreduces the enhancement of noise in the resultant image. This opera-tion is especially effective for expanding the dynamic range of theimage in regions which have subtle but significant contrast differences.
91J.L. Rae et al.: Lens Dye Transfer
ABBREVIATIONS
A (cm2) area of apical face of an epithelial cellCe(t) (mole/cm3) epithelial cell dye concentrationCf(x,t) (moles/cm3) fiber cell dye concentrationCo(x) (moles/cm3) initial (t = 0) distribution of dye in a fiber cellCp (moles/cm3) pipette dye concentrationD (cm2/sec) dye diffusion coefficient≈1.5 × 106 cm2/sech (cm) height of epithelial celljx(x,t) (moles/cm2sec) dye flux along fiber cell axispe (cm/sec) fiber/epithelial gap junctional permeabilitypf (cm/sec) fiber/fiber gap junctional permeabilitySm/Vt (cm−1) surface to volume ratio of fiber cellst (sec) time since removal of patch pipette from epithelial cellu(x) (cm/sec) velocity of convection plus conductionU(x) (cm/sec) velocity of convectionVe (cm3) volume of epithelial cellx (cm) distance along fiber cell axis from epithelial junctionl (cm) length constant for dye diffusion along a fiber cellte (sec) time constant for epithelial/fiber cell dye exchangetf (sec) time constant for fiber/fiber cell dye exchange
Results
EPITHELIAL-FIBER DYE TRANSFER
As shown in the analysis section (later), epithelial-fiberdye transfer is expected to be quite difficult to demon-strate. Even for substantial degrees of coupling, dye dif-fuses more readily along the axis of a fiber cell thanacross the epithelial-fiber gap junctions. Hence, therewill be a large step drop in dye concentration between theepithelial cell and the fiber cell to which it is coupled.Figure 1A andB demonstrates this phenomenon. Fig. 1Ais a largely unenhanced photograph (deconvolution only)of dye injection into a single epithelial cell of a rat lens.The exposure is such that the epithelial cell is nearlyoptimally exposed. The fiber cell, however, is essen-tially invisible. This does not mean that the fiber cellbeneath does not have dye in it. Rather, the dynamicrange of the image is sufficiently limited that both theepithelial cell and the fiber cell cannot be visualizedsimultaneously. By using a clipped amplitude histogramequalization routine (Fig. 1B, seeMaterials and Meth-ods), it is possible to display the dye in the fiber cell eventhough its intensity is much less than that in the epithelialcell. At this level of exposure, the intensity in the fiberis only a little above background and so the image isnoisy.
Integrating CCD cameras have an antibloom capa-bility whereby the electrons filling the most highly pop-ulated wells can be removed and so prevent blooming inthe most intense areas of the image. This leaves the loworder 8 bits of the camera in a linear photometric rangewhereas the 8 high order bits respond nonlinearly withincreasing light. Figure 2A,-C shows that dye in a fibercell coupled to its overlying epithelial cell can easily bedemonstrated by turning on the antibloom feature of the
camera and then exposing for a 50 to 100 fold longerperiod than is required to image an epithelial cell. Figure2A shows a rat lens epithelial cell near the equator whichhas been loaded with Lucifer Yellow through a patchelectrode. Here the antibloom capability was not used.In this instance, it was possible to see dye in an under-lying fiber cell without enhancement. This was possiblebecause we chose to patch one of a small cluster of cellsleft on the fibers following decapsulation. The neighbor-ing cells were removed by the decapsulation procedurethus decreasing the number of adjacent epithelial cellsinto which the injected dye might be lost. In Fig. 2B, thecamera’s antibloom feature was used and the exposuretime increased until the fiber cell dye could easily beseen. In Fig. 2C, the clipped amplitude histogram equal-ization algorithm was applied to the antibloomed image.These figures show clearly that dye injected into an ep-ithelial cell through a patch electrode ultimately diffusesinto the fiber cell below. In fact, in Fig. 2B andC, dyecan be seen in several underlying fiber cells. Epithelial-fiber dye transfer was seen in 29 of 83 clusters of epi-thelial cells near the lens pole successfully filled withLucifer-yellow.
When the antibloom capability of the camera is usedwith long exposure times, a diffuse trail of dye moving inone direction only can be seen (Fig. 3A). Simultaneousbright field and fluorescence imaging (Fig. 3B) showsthat the direction of the diffuse dye trail is always alongthe axis of the underlying fiber cells. This unidirectionalmovement of the dye in fibers is expected and is ex-plained in the cartoon below (Fig. 4). The fiber/fiberswhich abut any single epithelial cell leave in a singledirection at all epithelial locations except right at thesuture. The observed apparent unidirectional movementof dye lends credence to the notion that dye is diffusinginside the fiber cells and not in the extracellular space.In the extracellular space, dye would be expected to dif-fuse in all directions. A second demonstration of epithe-lial-fiber dye transfer is shown in Fig. 5A (fluorescence)and Fig. 5B (bright field and fluorescence) at highermagnification. Here at least 3 fluorescent fiber cells canbe seen underlying the epithelial cell which was the pri-mary injection site. The bright field photomicrography(Fig. 5B) clearly shows that theapparentfiber cells fromFig. 5A are in fact fiber cells.
Epithelial-fiber dye transfer was easily seen in ma-ture rat and rabbit lenses and in 14 day chick embryolenses. These were the only lenses we tried. The cou-pling could be demonstrated in rat lens with carboxyflu-orescein and dichlorofluorescein (data not shown), inaddition to Lucifer Yellow. It could not be demonstratedwith BCECF although when a mixture of BCECF andLucifer Yellow was used to fill the epithelial cell, dyetransfer was evident showing that BCECF did not blockdye transmission. BCECF did not even diffuse into ad-jacent epithelial cells, either in ‘‘intact’’ lenses or in
92 J.L. Rae et al.: Lens Dye Transfer
dissociated cell pairs of mouse lens epithelial cells orrabbit corneal epithelial cells. Therefore, even thoughBCECF has been shown to diffuse between gap junctionsin at least two other preparations (Cooper, Miller &Fraser, 1989; El-Sabban & Pauli, 1991), we were unableto demonstrate its movement between lens epithelialcells, between fiber cells or between epithelial and fibercells.
The dye transfer with Lucifer Yellow was also notvery dependent on the pH of pipette filling solution. Dyemovement between epithelial cells and fiber cells oc-curred at least in a qualitatively similar way for pipettefilling solution pHs between 4 and 7. Given that pHbuffering can occur by H+ movement through the gapjunctions, the actual pHs which resulted in the coupledcells are not known.
These dissection, dye injection and imaging tech-niques also allow clear demonstration of fiber-to-fibercoupling. In Fig. 6A (a deconvolved image) and in Fig.6B (the same image subjected to amplitude histogramequalization), extensive lateral spread of dye into poste-rior lens fibers adjacent to the central injection can bevisualized. Results similar to these (data not shown)were found when dye was injected into fiber cells at boththe anterior and equatorial surfaces.
We also made some attempts to inject dye into deepfiber cells using this methodology. To do that, it was
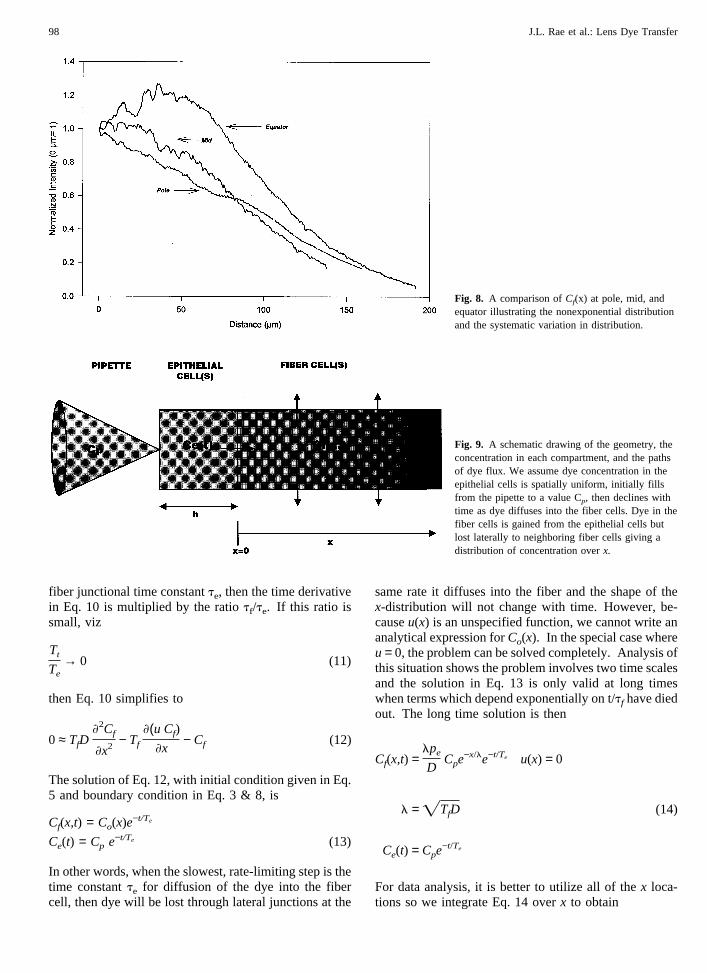
necessary to mechanically peel surface fiber cells awayfrom the rest of the lens and then patch clamp fiber cellsurfaces exposed deep in the lens by the surface-fiberremoval. Figure 7 shows that even under these poten-tially mechanically traumatic conditions, fiber-to-fiberdye movement is still readily observed. Its extent doesnot seem to be nearly as pronounced as between fibercells near the lens surface but the two locations shouldprobably not be compared directly given the anticipatedmechanical trauma involved in isolation of deep fibercell surfaces.
ANALYSIS OF THEDATA
Figure 8 compares the initial fluorescence intensity inthree typical experiments where the introduction of dyewas into an epithelial cell either at the pole, midwaybetween pole and equator, or at the equator. The fluo-rescence intensity as a function of position along thefiber cell axis is not a simple exponential. One reasonfor the complex distribution may be the shape of the fibercells. We measure fluorescence intensity, which is pro-portional to the amount of dye at anyx location ratherthan the concentration of dye. Thus, where the fibercells are thicker we will collect more light even if theconcentration is not higher. At the equator, the fiber
Fig. 1. CCD camera images from a rat lens wherein a single epithelial cell was dye-injected with Lucifer Yellow CH through a patch electrode usedin whole cell voltage clamp mode. The image in (A) was deconvolved to correct for out-of-plane fluorescence. The image in (B) was deconvolvedand subjected to clipped amplitude histogram equalization to show a noisy image of a fiber cell (arrow) hidden in the low order bits of the CCDcamera.
93J.L. Rae et al.: Lens Dye Transfer
cells are more banana-shaped than at the poles, so theincrease in intensity as one moves away from the fiber/epithelial junction could simply be an artifact due to theshape. Secondly, forces other than diffusion may con-tribute to dye spread. As first reported by Robinson andPatterson (1983) there are circulating currents betweenthe pole and equator and these currents will generateconduction and convection of dye. Based on an analysisof these currents (Baldo & Mathias, 1992), the voltage
and hydrostatic pressure in peripheral fiber cells at theequator will be higher than in peripheral cells at thepoles, hence the negatively charged dye will be con-ducted toward the equator but convected toward thepoles. The longitudinal flux of dye along the axis of afiber cell is given by
jx(x,t) = −DCf(x,t)
x+ Cf(x,t) u(x)
moles
cm2sec(1)
Fig. 2. CCD camera images from a rat lens wherein a single epithelialcell of a small cluster of epithelial cells near the equator was dye-injected with Lucifer Yellow CH through a patch electrode used inwhole cell voltage clamp mode. The deconvolved image in (A) showsbrightly fluorescent epithelial cells and a dimly fluorescent fiber cell(arrow) below. (B) is a longer exposure using the antibloom circuitry ofthe CCD camera. Now several underlying fiber cells are clearly seen tocontain the fluorescing dye. (C) is the same image shown in (B) afterclipped amplitude histogram equalization which makes the fiber cellsmore easily visualized.
94 J.L. Rae et al.: Lens Dye Transfer
whereCf (x,t)(mmoles/cm2) is the dye concentration at
locationx (cm) and timet (sec) in a fiber cell,D (cm2/sec) is the dye diffusion coefficient and the velocity u(x)(cm/sec) represents either conduction or convection. Viz
u = −DFz
RT
dc(x)dx
+ U(x) cm/sec (2)
The voltage within the fiber cell isc(x) andU(x) (cm/sec) is the fluid flow velocity. Other symbols and coor-dinates are defined in Fig. 9. Positive values ofx aredefined along the axis of the fiber cell as distance from
the epithelial/fiber junction. The longitudinal flux at thefiber/epithelial junction must equal the transjunctionalflux, which is given bype(Ce(t) − Cf (0,t)), where pe(cm/sec) is the fiber-epithelial junctional permeability.SinceCe(t) >> Cf (0,t), we can approximate
peCe(t) . −DCf (0,t)
x+ u(0)Cf (0,t) (3)
Eq. 3 can be rewritten as
DCf (0,t)
x= u(0)Cf (0,t) − peCe(t) (4)
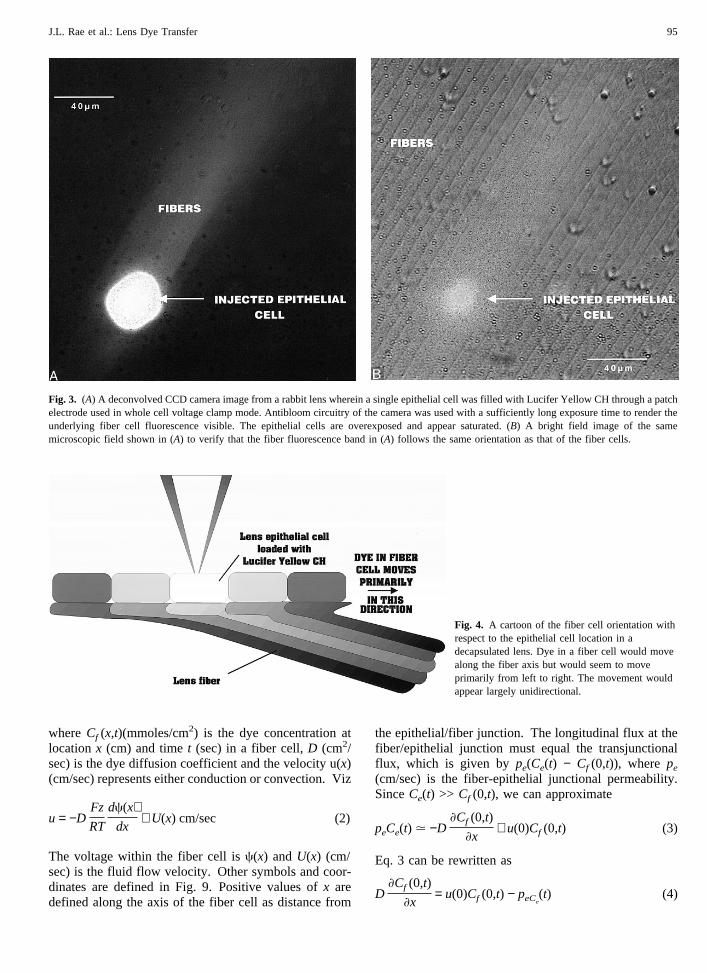
Fig. 3. (A) A deconvolved CCD camera image from a rabbit lens wherein a single epithelial cell was filled with Lucifer Yellow CH through a patchelectrode used in whole cell voltage clamp mode. Antibloom circuitry of the camera was used with a sufficiently long exposure time to render theunderlying fiber cell fluorescence visible. The epithelial cells are overexposed and appear saturated. (B) A bright field image of the samemicroscopic field shown in (A) to verify that the fiber fluorescence band in (A) follows the same orientation as that of the fiber cells.
Fig. 4. A cartoon of the fiber cell orientation withrespect to the epithelial cell location in adecapsulated lens. Dye in a fiber cell would movealong the fiber axis but would seem to moveprimarily from left to right. The movement wouldappear largely unidirectional.
95J.L. Rae et al.: Lens Dye Transfer
At the poles, the data showCf(0,t)/x is negative henceu is either small or negative. Since conduction carriesthe dye away from the poles whereas convection carriesdye to the poles, the convection velocity,U(x), is nega-
tive and may dominate. At the equator,Cf(0,t)/x ispositive, suggestingu(0) is positive and large. In thissituation, x is increasing as we move away from theequator so convection is positive whereas conduction is
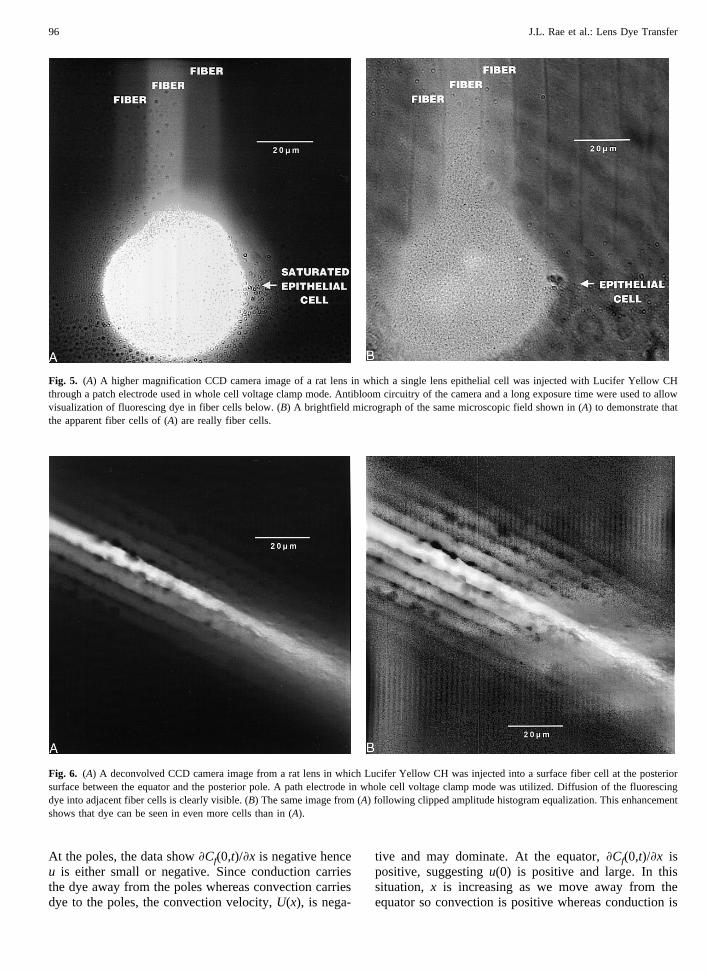
Fig. 5. (A) A higher magnification CCD camera image of a rat lens in which a single lens epithelial cell was injected with Lucifer Yellow CHthrough a patch electrode used in whole cell voltage clamp mode. Antibloom circuitry of the camera and a long exposure time were used to allowvisualization of fluorescing dye in fiber cells below. (B) A brightfield micrograph of the same microscopic field shown in (A) to demonstrate thatthe apparent fiber cells of (A) are really fiber cells.
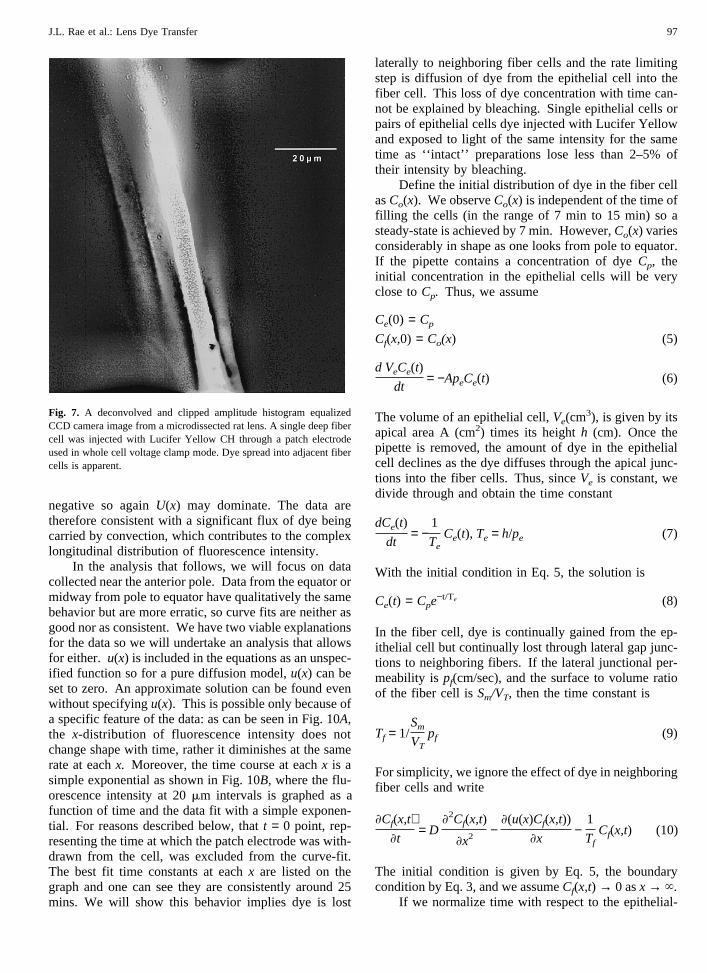
Fig. 6. (A) A deconvolved CCD camera image from a rat lens in which Lucifer Yellow CH was injected into a surface fiber cell at the posteriorsurface between the equator and the posterior pole. A path electrode in whole cell voltage clamp mode was utilized. Diffusion of the fluorescingdye into adjacent fiber cells is clearly visible. (B) The same image from (A) following clipped amplitude histogram equalization. This enhancementshows that dye can be seen in even more cells than in (A).
96 J.L. Rae et al.: Lens Dye Transfer
negative so againU(x) may dominate. The data aretherefore consistent with a significant flux of dye beingcarried by convection, which contributes to the complexlongitudinal distribution of fluorescence intensity.
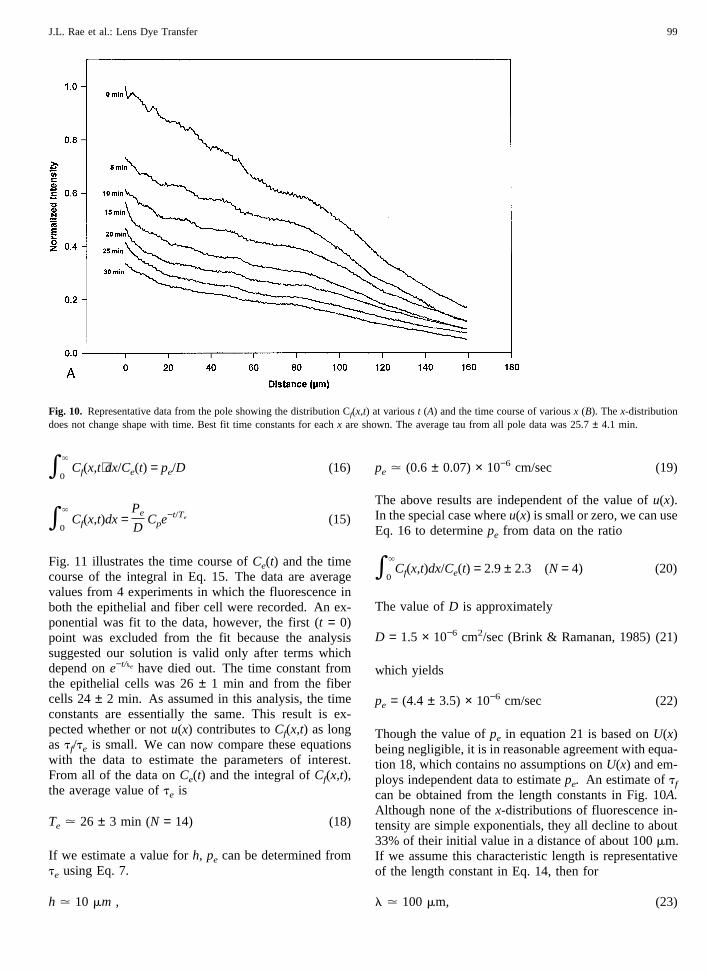
In the analysis that follows, we will focus on datacollected near the anterior pole. Data from the equator ormidway from pole to equator have qualitatively the samebehavior but are more erratic, so curve fits are neither asgood nor as consistent. We have two viable explanationsfor the data so we will undertake an analysis that allowsfor either. u(x) is included in the equations as an unspec-ified function so for a pure diffusion model,u(x) can beset to zero. An approximate solution can be found evenwithout specifyingu(x). This is possible only because ofa specific feature of the data: as can be seen in Fig. 10A,the x-distribution of fluorescence intensity does notchange shape with time, rather it diminishes at the samerate at eachx. Moreover, the time course at eachx is asimple exponential as shown in Fig. 10B,where the flu-orescence intensity at 20mm intervals is graphed as afunction of time and the data fit with a simple exponen-tial. For reasons described below, thatt = 0 point, rep-resenting the time at which the patch electrode was with-drawn from the cell, was excluded from the curve-fit.The best fit time constants at eachx are listed on thegraph and one can see they are consistently around 25mins. We will show this behavior implies dye is lost
laterally to neighboring fiber cells and the rate limitingstep is diffusion of dye from the epithelial cell into thefiber cell. This loss of dye concentration with time can-not be explained by bleaching. Single epithelial cells orpairs of epithelial cells dye injected with Lucifer Yellowand exposed to light of the same intensity for the sametime as ‘‘intact’’ preparations lose less than 2–5% oftheir intensity by bleaching.
Define the initial distribution of dye in the fiber cellasCo(x). We observeCo(x) is independent of the time offilling the cells (in the range of 7 min to 15 min) so asteady-state is achieved by 7 min. However,Co(x) variesconsiderably in shape as one looks from pole to equator.If the pipette contains a concentration of dyeCp, theinitial concentration in the epithelial cells will be veryclose toCp. Thus, we assume
Ce(0) = CpCf(x,0) = Co(x) (5)
d VeCe(t)
dt= −ApeCe(t) (6)
The volume of an epithelial cell,Ve(cm3), is given by its
apical area A (cm2) times its heighth (cm). Once thepipette is removed, the amount of dye in the epithelialcell declines as the dye diffuses through the apical junc-tions into the fiber cells. Thus, sinceVe is constant, wedivide through and obtain the time constant
dCe(t)
dt= −
1
TeCe(t), Te = h/pe (7)
With the initial condition in Eq. 5, the solution is
Ce(t) = Cpe−t/Te (8)
In the fiber cell, dye is continually gained from the ep-ithelial cell but continually lost through lateral gap junc-tions to neighboring fibers. If the lateral junctional per-meability ispf(cm/sec), and the surface to volume ratioof the fiber cell isSm/VT, then the time constant is
Tf = 1/SmVT
pf (9)
For simplicity, we ignore the effect of dye in neighboringfiber cells and write
Cf(x,t)t
= D2Cf(x,t)
x2−
(u(x)Cf(x,t))
x−1
TfCf(x,t) (10)
The initial condition is given by Eq. 5, the boundarycondition by Eq. 3, and we assumeCf(x,t) → 0 asx→ `.
If we normalize time with respect to the epithelial-
Fig. 7. A deconvolved and clipped amplitude histogram equalizedCCD camera image from a microdissected rat lens. A single deep fibercell was injected with Lucifer Yellow CH through a patch electrodeused in whole cell voltage clamp mode. Dye spread into adjacent fibercells is apparent.
97J.L. Rae et al.: Lens Dye Transfer
fiber junctional time constantte, then the time derivativein Eq. 10 is multiplied by the ratiotf/te. If this ratio issmall, viz
TtTe
→ 0 (11)
then Eq. 10 simplifies to
0 ≈ TfD2Cf
x2− Tf
(u Cf)x
− Cf (12)
The solution of Eq. 12, with initial condition given in Eq.5 and boundary condition in Eq. 3 & 8, is
Cf(x,t) = Co(x)e−t/Te
Ce(t) = Cp e−t/Te (13)
In other words, when the slowest, rate-limiting step is thetime constantte for diffusion of the dye into the fibercell, then dye will be lost through lateral junctions at the
same rate it diffuses into the fiber and the shape of thex-distribution will not change with time. However, be-causeu(x) is an unspecified function, we cannot write ananalytical expression forCo(x). In the special case whereu= 0, the problem can be solved completely. Analysis ofthis situation shows the problem involves two time scalesand the solution in Eq. 13 is only valid at long timeswhen terms which depend exponentially on t/tf have diedout. The long time solution is then
Cf(x,t) =lpeD
Cpe−x/le−t/Te u(x) = 0
l = =TfD (14)
Ce(t) = Cpe−t/Te
For data analysis, it is better to utilize all of thex loca-tions so we integrate Eq. 14 overx to obtain
Fig. 8. A comparison ofCf(x) at pole, mid, andequator illustrating the nonexponential distributionand the systematic variation in distribution.
Fig. 9. A schematic drawing of the geometry, theconcentration in each compartment, and the pathsof dye flux. We assume dye concentration in theepithelial cells is spatially uniform, initially fillsfrom the pipette to a value Cp, then declines withtime as dye diffuses into the fiber cells. Dye in thefiber cells is gained from the epithelial cells butlost laterally to neighboring fiber cells giving adistribution of concentration overx.
98 J.L. Rae et al.: Lens Dye Transfer
*0
`
Cf(x,t)dx/Ce(t) = pe/D (16)
*0
`
Cf(x,t)dx=PeDCpe
−t/Te (15)
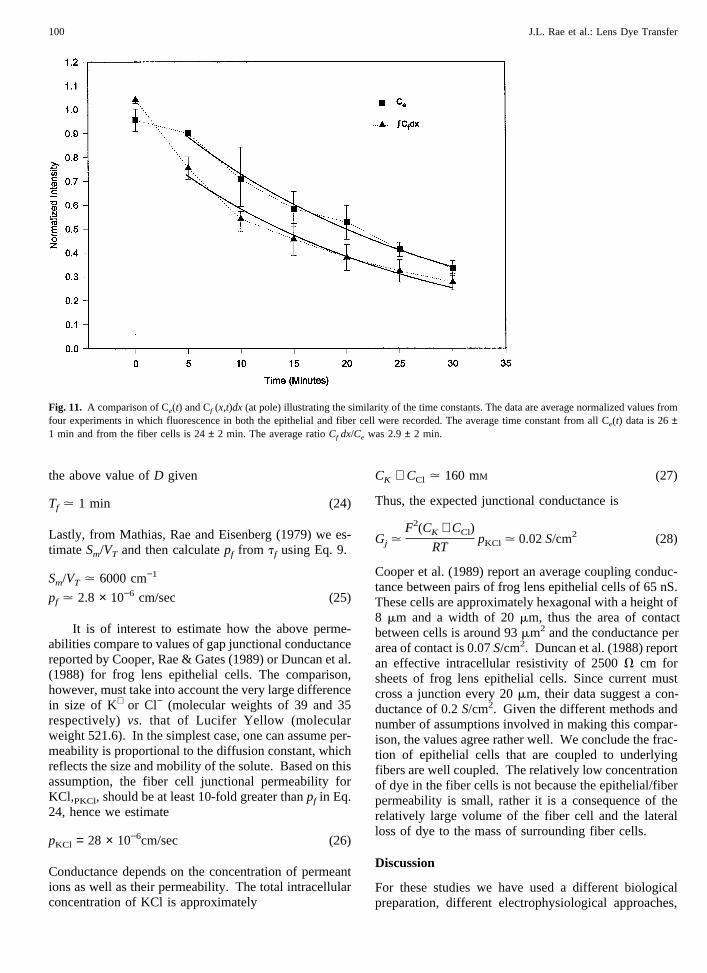
Fig. 11 illustrates the time course ofCe(t) and the timecourse of the integral in Eq. 15. The data are averagevalues from 4 experiments in which the fluorescence inboth the epithelial and fiber cell were recorded. An ex-ponential was fit to the data, however, the first (t = 0)point was excluded from the fit because the analysissuggested our solution is valid only after terms whichdepend one−t/ie have died out. The time constant fromthe epithelial cells was 26± 1 min and from the fibercells 24± 2 min. As assumed in this analysis, the timeconstants are essentially the same. This result is ex-pected whether or notu(x) contributes toCf(x,t) as longas tf/te is small. We can now compare these equationswith the data to estimate the parameters of interest.From all of the data onCe(t) and the integral ofCf(x,t),the average value ofte is
Te . 26 ± 3 min (N = 14) (18)
If we estimate a value forh, pe can be determined fromte using Eq. 7.
h . 10 mm ,
pe . (0.6 ± 0.07)× 10−6 cm/sec (19)
The above results are independent of the value ofu(x).In the special case whereu(x) is small or zero, we can useEq. 16 to determinepe from data on the ratio
*0
`
Cf(x,t)dx/Ce(t) = 2.9± 2.3 (N = 4) (20)
The value ofD is approximately
D = 1.5 × 10⁻⁶ cm2/sec (Brink & Ramanan, 1985) (21)
which yields
pe = (4.4 ± 3.5) × 10−6 cm/sec (22)
Though the value ofpe in equation 21 is based onU(x)being negligible, it is in reasonable agreement with equa-tion 18, which contains no assumptions onU(x) and em-ploys independent data to estimatepe. An estimate oftfcan be obtained from the length constants in Fig. 10A.Although none of thex-distributions of fluorescence in-tensity are simple exponentials, they all decline to about33% of their initial value in a distance of about 100mm.If we assume this characteristic length is representativeof the length constant in Eq. 14, then for
l . 100mm, (23)
Fig. 10. Representative data from the pole showing the distribution Cf(x,t) at varioust (A) and the time course of variousx (B). Thex-distributiondoes not change shape with time. Best fit time constants for eachx are shown. The average tau from all pole data was 25.7± 4.1 min.
99J.L. Rae et al.: Lens Dye Transfer
the above value ofD given
Tf . 1 min (24)
Lastly, from Mathias, Rae and Eisenberg (1979) we es-timateSm/VT and then calculatepf from tf using Eq. 9.
Sm/VT . 6000 cm−1
pf . 2.8 × 10⁻⁶ cm/sec (25)
It is of interest to estimate how the above perme-abilities compare to values of gap junctional conductancereported by Cooper, Rae & Gates (1989) or Duncan et al.(1988) for frog lens epithelial cells. The comparison,however, must take into account the very large differencein size of K+ or Cl− (molecular weights of 39 and 35respectively)vs. that of Lucifer Yellow (molecularweight 521.6). In the simplest case, one can assume per-meability is proportional to the diffusion constant, whichreflects the size and mobility of the solute. Based on thisassumption, the fiber cell junctional permeability forKCl,PKCl, should be at least 10-fold greater thanpf in Eq.24, hence we estimate
pKCl = 28 × 10−6cm/sec (26)
Conductance depends on the concentration of permeantions as well as their permeability. The total intracellularconcentration of KCl is approximately
CK + CCl . 160 mM (27)
Thus, the expected junctional conductance is
Gj .F2(CK + CCl)
RTpKCl . 0.02S/cm2 (28)
Cooper et al. (1989) report an average coupling conduc-tance between pairs of frog lens epithelial cells of 65 nS.These cells are approximately hexagonal with a height of8 mm and a width of 20mm, thus the area of contactbetween cells is around 93mm2 and the conductance perarea of contact is 0.07S/cm2. Duncan et al. (1988) reportan effective intracellular resistivity of 2500V cm forsheets of frog lens epithelial cells. Since current mustcross a junction every 20mm, their data suggest a con-ductance of 0.2S/cm2. Given the different methods andnumber of assumptions involved in making this compar-ison, the values agree rather well. We conclude the frac-tion of epithelial cells that are coupled to underlyingfibers are well coupled. The relatively low concentrationof dye in the fiber cells is not because the epithelial/fiberpermeability is small, rather it is a consequence of therelatively large volume of the fiber cell and the lateralloss of dye to the mass of surrounding fiber cells.
Discussion
For these studies we have used a different biologicalpreparation, different electrophysiological approaches,
Fig. 11. A comparison of Ce(t) and Cf (x,t)dx (at pole) illustrating the similarity of the time constants. The data are average normalized values fromfour experiments in which fluorescence in both the epithelial and fiber cell were recorded. The average time constant from all Ce(t) data is 26±1 min and from the fiber cells is 24± 2 min. The average ratioCf dx/Ce was 2.9± 2 min.
100 J.L. Rae et al.: Lens Dye Transfer
and different imaging methodology than have previouslybeen used to investigate dye transfer between lens cells.The biological preparation is a new one in which we usea calcium-and magnesium-free incubation solution con-taining EDTA and bumetanide to decapsulate the lenswhile leaving the epithelial cells attached to the fibercells. By adjusting the incubation time in the decapsu-lation fluid, it is possible to decapsulate the lens withallepithelial cells adhering to the fiber cells,no epithelialcells adhering to the fiber cells, or some combination inbetween. When only a fraction of the epithelial cells isleft adherent to the fiber mass, small clumps of epithelialcells can be dye injected. Because the number of lateralcells into which dye might diffuse is limited, it is possi-ble to get higher concentrations of dye within the cells inthe clump than would have been possible with a fullyintact epithelium. The dye is injected using patch volt-age clamp techniques. Lucifer Yellow filled electrodesare sealed to the cells in the whole cell recording modewhere dye can either diffuse and/or be electrophoresedinto the cells using patch clamp electronics. This ap-proach has the advantage that virtually no leak existsaround the patch electrode and consequently the flux ofcalcium through the seal and the resulting increase inintracellular calcium does not occur. Because of thelarge cross-sectional area of the tip, it is possible to injectmore dye per unit time than is possible with the muchsmaller intracellular microelectrodes used for intracellu-lar dye injection. One must be careful with this ap-proach, however, because it is easily possible to put somuch dye in the cells that they take up water from thebathing solution and explode. This technique also hasthe potential disadvantage that it can wash out regulatorysubstances that exist inside of the cell since the largevolume of the pipette in comparison to the volume of thecell ensures that the cell largely takes on the compositionof the pipette filling solution. We also employ wide dy-namic range imaging by using a cooled CCD camerawith a 16-bit gray scale digitization. Under proper con-ditions, this allows both bright objects and dim objects tobe imaged simultaneously.
These studies show that unlike recently publishedstudies of dye transfer between fiber cells (Prescott et al.,1994), fiber cells at least at the lens surface are excep-tionally well coupled. In a few attempts aimed at dem-onstrating dye transfer between fiber cells at least 1 mmor so deep into the lens, it was easily possible to dem-onstrate some lateral movement of the dye from cell tocell. These patch clamp methods, however, are not wellsuited to measuring dye transfer deep in the lens sincesurface layers of the lens must be mechanically removedand may result in damage of the fibers below. Evengiven this potential for damage, lateral dye cell couplingwas routinely seen. Dye transfer between fiber cells atthe surface, whether at the posterior surface, equatorialsurface, or anterior surface was extensive. These results
are in keeping with previous intracellular microelectrodestudies from frog lenses (Rae, 1974; Rae & Stacey,1976) and chick embryo lenses (Schuetze & Goode-nough, 1982; Miller & Goodenough, 1986) but are not inkeeping with recent results from confocal microscopy inthe frog lens (Prescott et al., 1994).
Our studies also show that the epithelium is coupledto the fiber cells below by pathways that allow dyemovement. In fact, a crude model aimed at quantifyingthe extent of dye transfer suggests that the epitheliumand fibers are exceptionally well coupled, about as wellcoupled as the epithelial cells are among themselves.This result was true in lenses of all species in which itwas studied that included rat lenses, rabbit lenses, andembryonic chick lenses. Fiber-epithelial dye transferwas seen in 29 of 83 successful experiments in which anepithelial cell was filled with Lucifer Yellow. Therefore,the fraction of total epithelial cells coupled to fiber cellsshould not exceed 0.35. This fraction is likely an over-estimate because with every epithelial cell injection,there are 3–4 adjacent epithelial cells that take up enoughdye through epithelial-epithelial gap junctions that theycould serve as dye sources for demonstrating dye transferinto the fiber cell immediately below them. Therefore,in the 54 attempts in which epithelial-fiber dye transferwas not observed, one would have expected to see dyetransfer into about two fiber cells/attempt if the fractionof cells coupled was 0.35. This was never observed.Rather, dye transfer is seen in one of three attemptswhere 3–4 cells were available to demonstrate coupling/attempt. This represents a coupling fraction of .067–.08or less than 1 epithelial cell in 10 is coupled to a neigh-boring fiber cell. This coupling fraction does not alterthe notion that the epithelial cells and fiber cells exist ina 3-D syncytium. Since the epithelial cells are them-selves well coupled, not every epithelial cell must beconnected directly to its underlying fiber cell for thesyncytial connections to be complete. Moreover, theseresults are from the polar region of the epithelium andBaldo and Mathias (1992) showed fiber cell coupling ismuch less at the polar region. Epithelial cell couplingcould be similarly reduced but we were unable to obtainenough data from the equatorial region to produce a rea-sonable comparison.
The analysis of epithelial-fiber cell coupling showsit is anticipated (and found experimentally) that there isa large concentration difference between the epithelialcell and the fiber cell below. This dye concentration dif-ference does not then provide evidence that the cells arepoorly coupled. The large drop in concentration dependsprimarily on the fact that the underlying fiber cells areexceptionally well coupled and are of much larger vol-ume than the epithelial cells above.
How then are we able to rationalize these resultswith previous morphological and electrophysiologicalresults that suggest little or no coupling between the
101J.L. Rae et al.: Lens Dye Transfer
epithelial cells and fiber cells and between the fiber cellsthemselves? First, consider the results of Bassnett et al.(1994) in which they were able to easily demonstrate dyetransfer between fiber and epithelium when the dye wasinjected in the fiber cell but could not demonstrate itwhen the dye was injected in the epithelial cell of em-bryonic chick lenses. These results are expected. Aloaded fiber cell would offer a nearly infinite source ofdye to diffuse into the epithelial cells above. Injectingdye into the epithelial cell results in an extremely lowdye concentration in the fiber cells below, a concentra-tion which could have easily have been missed withoutthe application of the wide dynamic range imaging weutilize here. In fact, using our procedures we were ableto inject Lucifer Yellow into embryonic chick lens epi-thelial cells and see dye movement into fiber cells below(data not shown).
The methods which we use are incapable of identi-fying morphologically or biochemically the pathway thatgives rise to the dye movement from epithelial cells tofiber cells. They can, however, clearly demonstrate thata pathway exists. The work of Bassnett et al. (1994) didnot conclude that such pathways did not exist, only thatthe pathways are rare or are morphologically differentfrom classical gap junctions. Our results, that less than 1in 10 epithelial cells are connected to fibers, suggests thatthe pathways are quite rare, at least in the anterior polarregion.
Another possibility for failure to demonstrate dyetransfer between epithelial cells or epithelium and fibercells might result from the well-known fact that intracel-lular microelectrodes even with tips smaller than 0.1mmin diameter rarely have more than a 100 megohm sealaround them. Influx of calcium ion or some other sub-stance from the bath might simply result in uncouplingand failure to demonstrate cell to cell dye movement.Our methods, where we inject dye through a patch clampelectrode, greatly reduce this leak problem but mightwash out vital control substances and induce couplingthat did not exist normally. This result would certainlybe contrary to that obtained, for example, from cell pairmeasurements of lens epithelial cells (Cooper et al.,1989) or many other types of cells in which the washoutof substances inherent in the patch clamp technique re-sults in uncoupling of the cells with time and not theproduction of a coupling pathway that did not previouslyexist.
Previous reports that lens epithelial cells loaded withBCECF do not lose their dye to the fiber cells over time(Wolosin et al., 1988, 1990; Bassnett et al., 1994) caneasily be explained by our observations that BCECF dif-fuses poorly through lens gap junctions if at all. BCECF(MW = 520) is larger than Lucifer Yellow and morenegatively charged (4–5 charges at physiological pH)and so may exceed some size/charge maximum formovement between these cells. We cannot unequivo-
cally rule out the possibility that our procedures disruptthe pathways for BCECF movement. But, if so, theymay be different pathways than for Lucifer Yellow sincedye continues to move when a mixture of BCECF andLucifer Yellow fills an epithelial cell. Of course, LuciferYellow might somehow reopen pathways for BCECFmovement closed by BCECF. Our experiments do notallow a distinction between the two mechanisms. How-ever, unlike the experiments of Bassnett et al. (1994), wewere able to demonstrate epithelial to fiber diffusion ofcarboxyfluorescein and dichlorofluorescein. We did nottry SNARF-1, another dye which Bassnett (1990) andBassnett et al., (1994) concluded could not move fromepithelial cells to fiber cells.
The results that we report here are very much inkeeping with early dye diffusion measurements from em-bryonic lens epithelial and fiber cells and from electricalmeasurements which demonstrate electrical coupling be-tween the epithelium and fibers in frog lenses. We be-lieve that the best explanation for the data presented hereis that about 10% of the epithelial cells and polar surfacefiber cells are in dye communication and that the cellsthat are coupled are very well coupled. The model usedfor analyzing the data suggests that the epithelial cellsthat are coupled to the fiber cells are coupled almost aswell as the epithelial cells are coupled to each other.
We are grateful to Helen Hendrickson and Jerry Dewey for technicalhelp and to Julio Fernandez and Jonathan Monck for help with thenearest neighbor analysis and to Erika Wohlfiel for help in preparingthe manuscript. The work was supported by NIH grants EY03282,EY06005 (JLR), EY06391 (RTM), and by an unrestricted award fromResearch to Prevent Blindness.
References
Baldo, G.J., Mathias, R.T. 1992. Spatial variations in membrane prop-erties in the intact rat lens.Biophys. J.63:518–529
Bassnett, S. 1990. Intracellular pH regulation in the embryonic chickenlens epithelium.J. Physiol.431:445–464
Bassnett, S., Kuszak, J.R., Reinisch, L., Brown, H.G., Beebe, D.C.1994. Intercellular communication between epithelia and fiber cellsof the eye lens.J. Cell Science107:799–811
Brink, P.R., Ramanan, S.V. 1985. A model for the diffusion of fluo-rescent probes in the septate giant axon of the earthworm: Axo-plasmic diffusion and junctional membrane permeability.Biophys.J. 48:299–309
Brown, H.G., Pappas, G.D., Ireland, M.E., Kuszak, J.R. 1990. Ultra-structural, biochemical, and immunologic evidence of receptor-mediated endocytosis is in the crystalline lens.Invest. Ophthalmol.Vis. Sci.111:2579–2592
Cooper, M.S., Miller, J.P., Fraser, S.E. 1989. Electrophoretic repattern-ing of charged cytoplasmic molecules within tissues coupled by gapjunctions by externally applied electric fields.Develop. Biol.132:179–188
Cooper, K., Rae, J.L., Gates, P. 1989. Membrane and junctional prop-erties of dissociated frog lens epithelial cells.J. Membrane Biol.111:215–227
Dewey, J., Bartling, C., Rae, J.L. 1995. A non-enzymatic method for
102 J.L. Rae et al.: Lens Dye Transfer
lens decapsulation which leaves the epithelial cells attached to thefibers.Curr. Eye Res.14:357–362
Duncan, G. 1969. The site of the ion restricting membranes in the toadlens.Exp. Eye Res.8:406–412
Duncan, G., Stewart, S., Prescott, A.R., Warn, R.M. 1988. Membraneand junctional properties of the isolated frog lens epithelium.J.Membrane Biol.102:195
El-Sabban, M.E., Pauli, B.U. 1991. Cytoplasmic dye transfer betweenmetastatic tumor cells and vascular endothelium.J. Cell Biol.115:1375–1382
Goodenough, D.A., Dick, J.S.B. II, Lyons, J.E. 1980. Lens metaboliccooperation. A study of mouse lens transport and permeability vi-sualized with freeze-substitution autoradiography and electron mi-croscopy.J. Cell Biol.86:576–589
Lo, W.K., Reese, T.S. 1993. Multiple structural types of gap junctionsin mouse lens.J. Cell Sci.106:227–235
Mathias, R.T., Rae, J.L., Baldo, G.J., Shi, J. 1989. Electrical propertiesof structural components of the lens. A comparison of frog and ratlenses.Invest Ophthalmol. Vis. Sci.30:(Suppl), 87
Mathias, R.T., Rae, J.L., Eisenberg, R.S. 1981. The lens as a nonuni-form syncytium.Biophys. J.34:61
Mathias, R.T., Riquelme G., Rae J.L. 1991. Cell to cell communicationand pH in the frog lens.J. Gen. Physiol.98:1085–1103
Miller, T.M., Goodenough, D.A. 1986. Evidence for two physiologi-cally distinct gap junctions expressed by the chick lens epithelialcell. J. Cell Biol.102:194–199
Monck, J.R., Oberhauser, A.F., Keating, T.J., Fernandez, J.M. 1992.Thin-section ratiometric Ca2+ images obtained by optical section-ing of fura-2 loaded mast cells.J. Cell Biol.116:745–759
Prescott, A., Duncan, G., Van Marle, J., Vresen, G. 1994. The corre-lated study of metabolic cell communication and gap junction dis-tribution in adult frog lens.Exp. Eye Res.58(6):737–746
Rae, J.L., Kuszak, J.R. 1983. The electrical coupling of epithelium andfibers in the frog lens.Exp. Eye Res.36:317–326
Rae, J.L. 1974. The movement of procion dye in the crystalline lens.Invest. Ophthal.13:147–150
Rae, J.L., Stacey, T. 1976. Intracellular markers in the crystalline lensof the rat. Documenta Ophthalmologica Proceedings Series.In:Progress of Lens Biochemistry Research. O. Hockwin, editor. pp.233–239. Dr. W. Junk b.v., The Hague
Robinson, K.R., Patterson, J.W. 1983. Localization of steady currentsin the lens.Curr. Eye Res.2:843–847
Schuetze, S.M., Goodenough, D.A. 1982. Dye transfer between cells ofthe embryonic chick lens becomes less sensitive to CO2 treatmentwith development.J. Cell Biol.92:694–705
Wolosin, J.M., Alvarez, L.J., Candia, O.A. 1988. Cellular pH and Na+
−H+ exchange activity in lens epithelium of Bufo marinus toad.Am.J. Physiol.255:C595–C602
Wolosin, J.M., Alvarez, L.J., Candia, O.A. 1990. HCO3-transport in thetoad lens epithelium is mediated by an electronegative Na+-dependent symport.Am. J. Physiol.258(27):C855–C861
103J.L. Rae et al.: Lens Dye Transfer