ITP Forest Products: Evaluation and Development of a ...
24
Evaluation and Development of a Prototype Electrokinetic Sonic Amplitude (ESA) System for On-Line Measurement of Charge in Papermaking Process Streams B. J. Tucker M. S. Good June 2005 Prepared for the U.S. Department of Energy under Contract DE-AC05-76RL01830 PNNL-15186
Transcript of ITP Forest Products: Evaluation and Development of a ...
Evaluation and Development of a Prototype Electrokinetic Sonic Amplitude (ESA) System for On-Line Measurement of Charge in Papermaking Process Streams B. J. Tucker M. S. Good June 2005 Prepared for the U.S. Department of Energy under Contract DE-AC05-76RL01830
PNNL-15186
DISCLAIMER
This report was prepared as an account of work sponsored by an agency of the United States Government. Neither the United States Government nor any agency thereof, nor Battelle Memorial Institute, nor any of their employees, makes any warranty, express or implied, or assumes any legal liability or responsibility for the accuracy, completeness, or usefulness of any information, apparatus, product, or process disclosed, or represents that its use would not infringe privately owned rights. Reference herein to any specific commercial product, process, or service by trade name, trademark, manufacturer, or otherwise does not necessarily constitute or imply its endorsement, recommendation, or favoring by the United States Government or any agency thereof, or Battelle Memorial Institute. The views and opinions of authors expressed herein do not necessarily state or reflect those of the United States Government or any agency thereof.
PACIFIC NORTHWEST NATIONAL LABORATORY operated by BATTELLE
for the UNITED STATES DEPARTMENT OF ENERGY
under Contract DE-AC05-76RL01830
Printed in the United States of America
Available to DOE and DOE contractors from the Office of Scientific and Technical Information,
P.O. Box 62, Oak Ridge, TN 37831-0062; ph: (865) 576-8401 fax: (865) 576-5728
email: [email protected]
Available to the public from the National Technical Information Service, U.S. Department of Commerce, 5285 Port Royal Rd., Springfield, VA 22161
ph: (800) 553-6847 fax: (703) 605-6900
email: [email protected] online ordering: http://www.ntis.gov/ordering.htm
This document was printed on recycled paper. (8/00)
PNNL-15186
Evaluation and Development of a Prototype Electrokinetic Sonic Amplitude (ESA) System for On-Line Measurement of Charge in Papermaking Process Streams B. J. Tucker M. S. Good
June 2005 Prepared for the U.S. Department of Energy under Contract DE-AC05-76RL01830
Pacific Northwest National Laboratory Richland, WA 99352
Evaluation and Development of a Prototype Electrokinetic Sonic Amplitude (ESA) System for On-Line Measurement of Charge in Papermaking Process Streams
National Laboratory Field Work Proposal
Final Progress Report
Contractor: Pacific Northwest National Laboratory
Richland, WA 99352 FWP Number: 40114; ED-18-01-00-0 Subcontractors: IPST - Institute of Paper Science and Technology MU - Miami University of Ohio
Other Partners: Colloidal Dynamics, Weyerhaeuser, Buckman Laboratories Contact(s): Project Manager, Dr. Brian J. Tucker, (509) 375-3889 [email protected] Principal Investigator, Dr. Morris S. Good, (509) 375-2529 [email protected] Project Team: DOE-HQ contact – Dickson Ozokwelu [email protected]
Abstract The papermaking industry uses an abundance of chemicals to control the process of papermaking. These chemicals are used to control everything from paper strength to brightness. Due to the natural variability of products used in papermaking, the chemistry of the process is heavily monitored. Cationic (charge) demand is one of the most important parameters in process control of papermaking. High variations in cationic demand result in off-spec final product or paper breaks resulting in wasted production and downtime. Both of these results are costly for papermakers due to higher energy consumption and loss of revenue. Currently, cationic demand is measured off-line in a laboratory setting with a heavily diluted specimen taking up to hours for results. The industry need is for an on-line, real-time measurement of cationic demand at higher consistencies to provide control feedback for the addition of cationic polymers for finely-tuned control of the paper process. Electrokinetic sonic amplitude (ESA) is a method for measuring particle charge and size, which has been employed in the semiconductor industry for several years. While this technology is generally geared for smaller particles (micron size) instead of paper fibers (millimeter size), this project researched the idea of using ESA to measure cationic demand in a real-time setting at high pulp consistencies. Within the scope and schedule of this project, the feasibility of the ESA technology for use in an on-line instrument was inconclusive. Further engineering is required to generate a sufficient ESA signal from the paper pulp to obtain reliable and consistent measurements. Future research in this area will help to further tailor the technology for application to paper streams. The ESA technology continues to remain a viable option for on-line charge demand measurements in the papermaking process and future research should continue in this area to address technical and mechanical issues associated with its implementation.
i

Contents Abstract ............................................................................................................................................ i 1.0 Introduction ..................................................................................................................... 1.1 2.0 Experimental Plan ........................................................................................................... 2.1
2.1 Materials ..................................................................................................................... 2.1 2.2 Sample Preparation ..................................................................................................... 2.1 2.3 Procedures................................................................................................................... 2.2
2.3.1 Alterations to commercially available ZetaProbe™............................................... 2.2 2.4 Streaming Current Technique ..................................................................................... 2.6
3.0 Electrokinetic Sonic Amplitude Charge Demand Measurement Technique................... 3.1 4.0 Discussion of Results ...................................................................................................... 4.1
4.1 Mutek Results ............................................................................................................. 4.1 4.2 ESA Results ................................................................................................................ 4.1 4.3 Comparison of Techniques ......................................................................................... 4.3
5.0 Conclusions ..................................................................................................................... 5.1 6.0 References ....................................................................................................................... 6.1
iii
1.0 Introduction The papermaking industry uses an abundance of chemicals to control the process of papermaking. These chemicals are used to control paper strength, brightness, and charge in the paper stream. Due to the natural variability of the products used in papermaking, the chemistry of the process is heavily monitored. Cationic Demand is one of the most important parameters in process control of papermaking whereas a high cationic demand results in off-spec final product and a low cationic demand could cause paper breaks leading to downtime. Both of these results are costly for papermakers due to higher energy consumption and loss of revenue. Currently, cationic demand is measured off-line in a laboratory setting with a heavily diluted specimen taking up to hours for results. The industry need is for an on-line, real-time measurement of cationic demand at higher consistencies to provide control feedback for the addition of cationic polymers for finely-tuned control of the paper process. Particle surface charge and dissolved polymer charge affect many papermaking phenomenon. Due to measurement difficulty, most mills rely on periodic (e.g., one measurement per shift) laboratory measures for gross wet chemistry adjustments. “Forest Products – Agenda 2020," stated that research is needed to develop a new device that will work over the entire papermaking consistency range (5%-0.5%), handle a wide range of furnish compositions, enable automated monitoring of process streams, and be reliable while being low cost. One potential solution for real-time monitoring of cationic demand in paper streams is the Electrokinetic Sonic Amplitude (ESA) approach. The basis of ESA measurement is the converse of an effect discovered by Debye (1933) where an alternating current (AC) potential was produced when suspensions of colloidal particles were subjected to ultrasonic waves. The ultrasonic waves perturbed the ionic environment around the particles in an oscillatory fashion, giving rise to the observed alternating voltage potential. This voltage potential is a function of the zeta potential of the particles. More recently, O’Brien et al. (1995) developed in 1995 a phase lag method for determining particle size and zeta potential of colloidal suspensions of spherical particles. Taggert (1985) reported that the ESA technique appeared to correlate well with microelectrophoresis measurements of clay particles but suspensions of wood fibers failed to produce a detectable signal. Strazdins (1992) and Jaycock (1995) that microelectrophoresis indicated that in a slurry of pulp and filler particles, the charge of the filler particles closely correlated to the charge of the pulp fibers. Cationic demand measurements from a 3% consistency, hardwood fiber suspension were shown at the April 2001 project review. The project team therefore, concluded that on-line measurement of charge of wood fibers is feasible whether the signal solely comes from suspended fibers or inorganics. The ZetaProbe measures the dynamic mobility of particles within a slurry. The dynamic mobility is directly correlated with the zeta potential, which is a measure of the individual surface fiber charges in the system. As the zeta potential approaches zero (and thus the dynamic mobility), the percentage of paper fines on retained on the wire increases, which results in a more efficient papermaking process. In the paper industry, if a surplus of cationic polymer is added to control
1.1
the zeta potential, causing the paper stream to have an overall positive charge, the process becomes extremely unstable and can be catastrophic leading to hours of downtime for cleanup. Therefore, the optimal addition of chemicals for control of charge in the paper stream is extremely important. The industry has indicated the need for a functional prototype for on-line charge measurement in papermaking process streams. Benefits would include savings in paper making additives, less build up of colloidal material in white water, mill water savings and improved recyclability, less machine down time due to loss of drainage control, greater substitution of cheaper paper fillers for more expensive pulp fibers, increased production rates and energy savings from lower steam requirements. Current limitations make charge an infrequent measurement and ineffective over the wide range of paper furnishes. This research, using a relatively new technology to the paper-making field, provides a first step in providing the industry with a prototype having the ability to make on-line measurements of charge (cationic demand) at varying levels of fiber consistency and anionic compound content. This prototype will replicate the chemical reactions taking place in the paper stream on a much smaller scale, providing paper producers with accurate real-time information regarding the paper stream chemistry.
1.2
2.0 Experimental Plan 2.1 Materials In a paper mill environment, pulp consistencies range from approximately 12% (by weight) for the incoming supply to 0.5% where the furnish is applied to the wire. Between these stages, the pulp is diluted with water for ease in handling and chemicals are added for desired final paper properties. Chemicals are a substantial expense for paper mills and therefore, if the addition of these chemicals could be optimized, money could be saved. For optimal addition of cationic polymer, the cationic demand should be measured on the pulp at a consistency of approximately 5%. The standard (from the factory) sampling chamber for the ESA measurement device is approximately 250 mL. Pulp at 5% consistency proved difficult to handle in this small quantity. A larger 1-Liter measurement chamber was constructed in an attempt to accommodate the difficulty in pulp handling; however, it was found that a maximum consistency of 2% for softwood and 3% for hardwood pulp existed. The procedure for measuring cationic demand using the ESA technique (mentioned later in this report) requires a titration with cationic polymer while thoroughly mixing the pulp. It was decided to settle on the 1-Liter measurement chamber size and concentrate on the actual measurements instead of using funds to resolve pulp handling issues. A test matrix was created to compare and reveal differences between the industry standard SC technique and the ESA technique for measuring cationic demand. The test matrix included pulp consistencies between 0.5% and 3.5% and pH levels between 4.5 and 10.0. Then, varying amounts of lignin, a model cationic demand compound, were added to the solutions creating a variety of slurries representing the range of cationic demand found in paper mills. Since lignin contains phenolic and carboxylic acid groups that ionize differently under varying pH conditions, identical amounts of lignin would result in varying cationic demand at the different pH levels. Lignin is a common anionic component in many paper streams. The pulping process removes most of the lignin from the wood fibers; however, a poorly washed pulp supply resulting in low-quality pulp can cause drastic changes in the paper stream due to the additional negative charges. Lignin was used as a source of surplus negative charge in paper pulp samples for the research conducted herein. A series of experiments was conducted to determine the average lignin charge density. Anionic polymers with known negative charge densities were also used to simulate unwanted anionic trash in paper pulp samples. 2.2 Sample Preparation With the constraint of the 1-Liter measurement chamber, both hardwood and softwood slurries were tested at approximately 1% consistencies. Dry pulp stock was obtained from Miami of Ohio University. The as-received moisture content of the stock was measured and subsequently, the stock was mixed with deionized water to reach the desired consistency. The stock was allowed to soak in the water for 24 hours, mixed with a non-sharp impeller, covered to minimize water loss
2.1
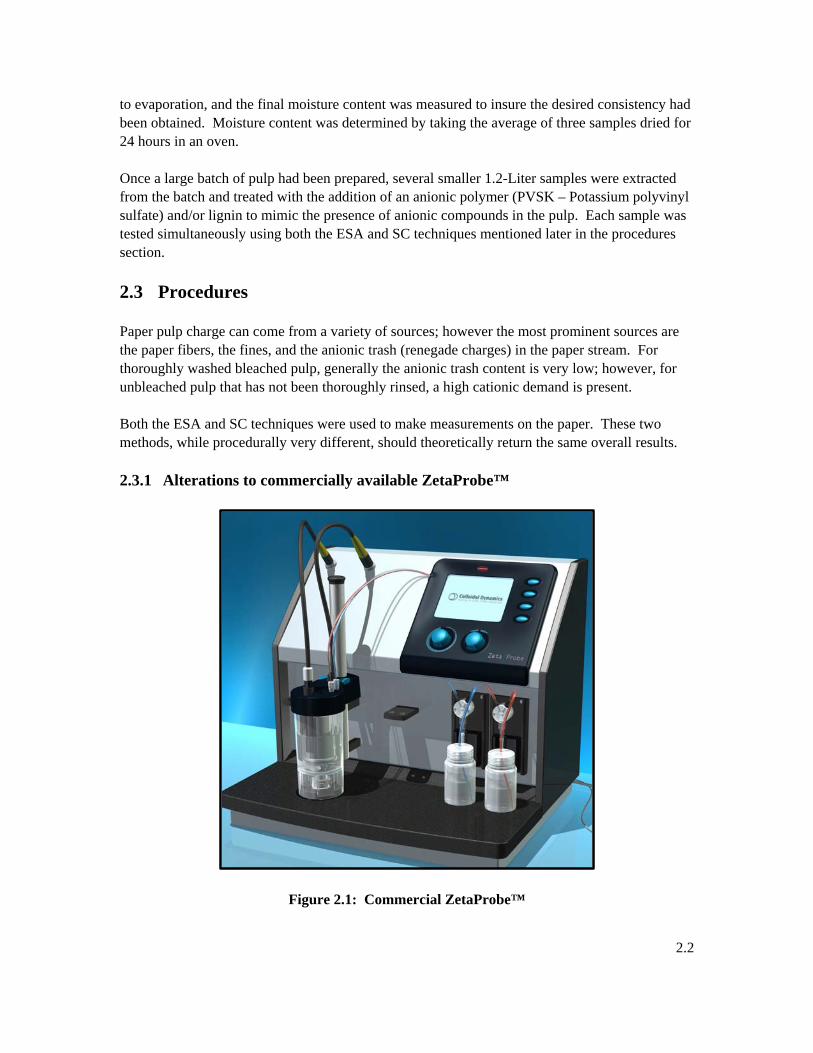
to evaporation, and the final moisture content was measured to insure the desired consistency had been obtained. Moisture content was determined by taking the average of three samples dried for 24 hours in an oven. Once a large batch of pulp had been prepared, several smaller 1.2-Liter samples were extracted from the batch and treated with the addition of an anionic polymer (PVSK – Potassium polyvinyl sulfate) and/or lignin to mimic the presence of anionic compounds in the pulp. Each sample was tested simultaneously using both the ESA and SC techniques mentioned later in the procedures section. 2.3 Procedures Paper pulp charge can come from a variety of sources; however the most prominent sources are the paper fibers, the fines, and the anionic trash (renegade charges) in the paper stream. For thoroughly washed bleached pulp, generally the anionic trash content is very low; however, for unbleached pulp that has not been thoroughly rinsed, a high cationic demand is present. Both the ESA and SC techniques were used to make measurements on the paper. These two methods, while procedurally very different, should theoretically return the same overall results. 2.3.1 Alterations to commercially available ZetaProbe™
Figure 2.1: Commercial ZetaProbe™
2.2
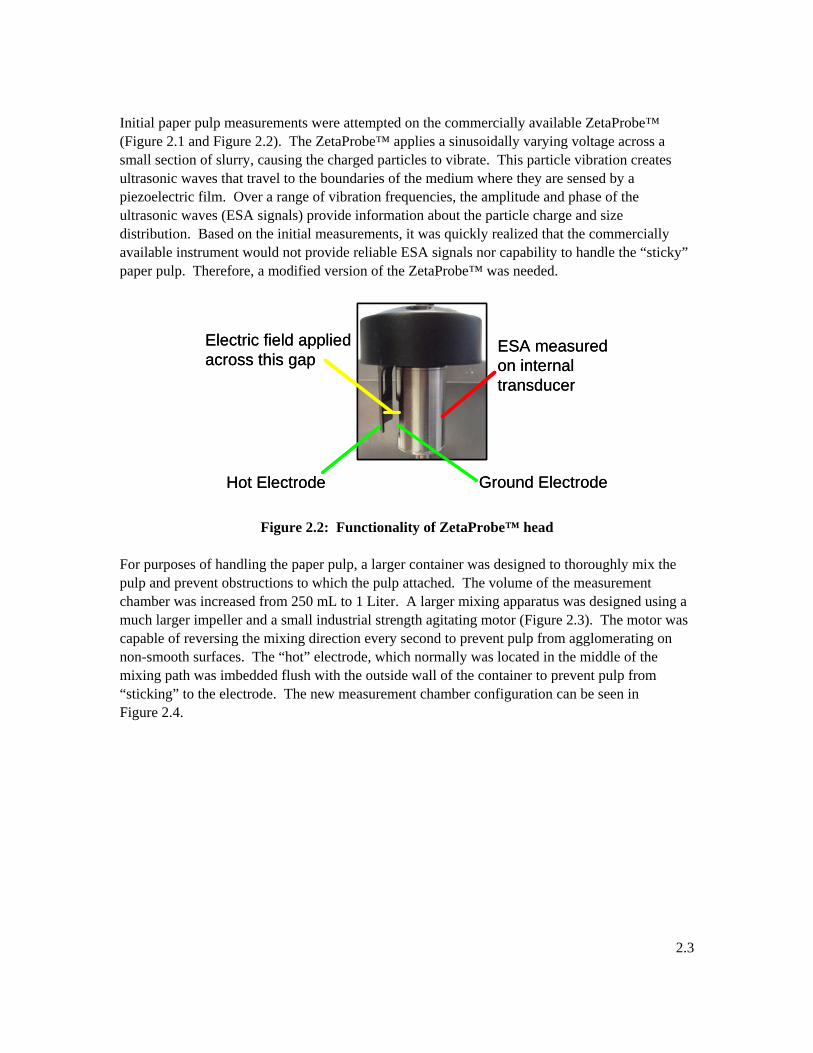
Initial paper pulp measurements were attempted on the commercially available ZetaProbe™ (Figure 2.1 and Figure 2.2). The ZetaProbe™ applies a sinusoidally varying voltage across a small section of slurry, causing the charged particles to vibrate. This particle vibration creates ultrasonic waves that travel to the boundaries of the medium where they are sensed by a piezoelectric film. Over a range of vibration frequencies, the amplitude and phase of the ultrasonic waves (ESA signals) provide information about the particle charge and size distribution. Based on the initial measurements, it was quickly realized that the commercially available instrument would not provide reliable ESA signals nor capability to handle the “sticky” paper pulp. Therefore, a modified version of the ZetaProbe™ was needed.
Electric field applied across this gap
ESA measured on internal transducer
Ground ElectrodeHot Electrode
Electric field applied across this gap
ESA measured on internal transducer
Ground ElectrodeHot Electrode
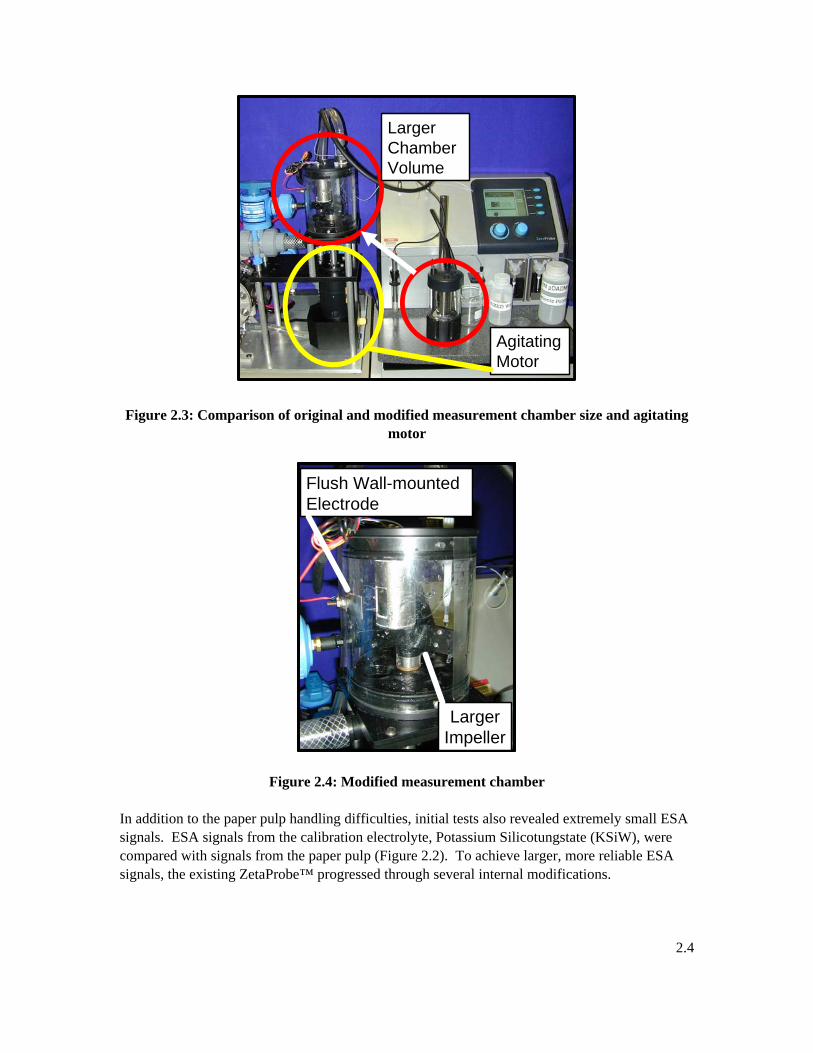
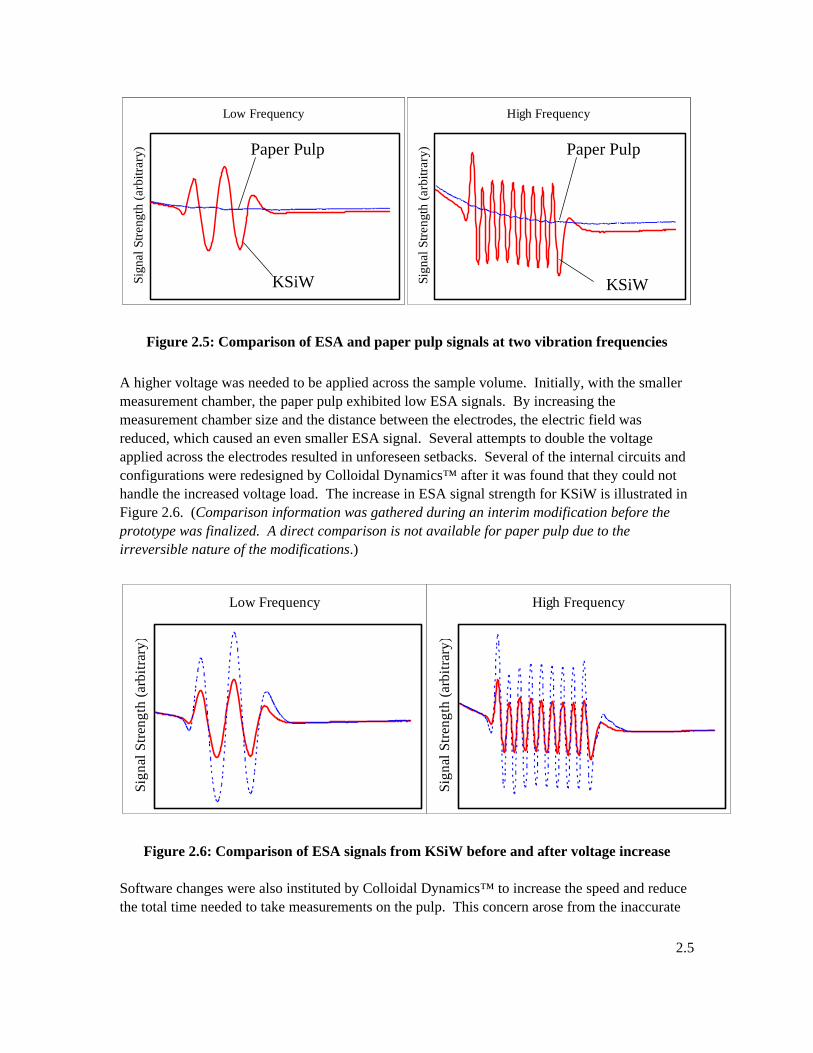
Figure 2.2: Functionality of ZetaProbe™ head For purposes of handling the paper pulp, a larger container was designed to thoroughly mix the pulp and prevent obstructions to which the pulp attached. The volume of the measurement chamber was increased from 250 mL to 1 Liter. A larger mixing apparatus was designed using a much larger impeller and a small industrial strength agitating motor (Figure 2.3). The motor was capable of reversing the mixing direction every second to prevent pulp from agglomerating on non-smooth surfaces. The “hot” electrode, which normally was located in the middle of the mixing path was imbedded flush with the outside wall of the container to prevent pulp from “sticking” to the electrode. The new measurement chamber configuration can be seen in Figure 2.4.
2.3
Agitating Motor
Larger Chamber Volume
Agitating Motor
Larger Chamber Volume
Figure 2.3: Comparison of original and modified measurement chamber size and agitating motor
Larger Impeller
Flush Wall-mounted Electrode
Larger Impeller
Flush Wall-mounted Electrode
Larger Impeller
Flush Wall-mounted Electrode
Figure 2.4: Modified measurement chamber
In addition to the paper pulp handling difficulties, initial tests also revealed extremely small ESA signals. ESA signals from the calibration electrolyte, Potassium Silicotungstate (KSiW), were compared with signals from the paper pulp (Figure 2.2). To achieve larger, more reliable ESA signals, the existing ZetaProbe™ progressed through several internal modifications.
2.4
Low Frequency
Sign
al S
treng
th (a
rbitr
ary)
High Frequency
Sign
al S
treng
th (a
rbitr
ary)
KSiW KSiW
Paper Pulp Paper Pulp
Low Frequency
Sign
al S
treng
th (a
rbitr
ary)
High Frequency
Sign
al S
treng
th (a
rbitr
ary)
Low Frequency
Sign
al S
treng
th (a
rbitr
ary)
High Frequency
Sign
al S
treng
th (a
rbitr
ary)
KSiW KSiW
Paper Pulp Paper Pulp
Figure 2.5: Comparison of ESA and paper pulp signals at two vibration frequencies A higher voltage was needed to be applied across the sample volume. Initially, with the smaller measurement chamber, the paper pulp exhibited low ESA signals. By increasing the measurement chamber size and the distance between the electrodes, the electric field was reduced, which caused an even smaller ESA signal. Several attempts to double the voltage applied across the electrodes resulted in unforeseen setbacks. Several of the internal circuits and configurations were redesigned by Colloidal Dynamics™ after it was found that they could not handle the increased voltage load. The increase in ESA signal strength for KSiW is illustrated in Figure 2.6. (Comparison information was gathered during an interim modification before the prototype was finalized. A direct comparison is not available for paper pulp due to the irreversible nature of the modifications.)
Low Frequency
Sign
al S
treng
th (a
rbitr
ary)
High Frequency
Sign
al S
treng
th (a
rbitr
ary)
Low Frequency
Sign
al S
treng
th (a
rbitr
ary)
High Frequency
Sign
al S
treng
th (a
rbitr
ary)
Figure 2.6: Comparison of ESA signals from KSiW before and after voltage increase Software changes were also instituted by Colloidal Dynamics™ to increase the speed and reduce the total time needed to take measurements on the pulp. This concern arose from the inaccurate
2.5
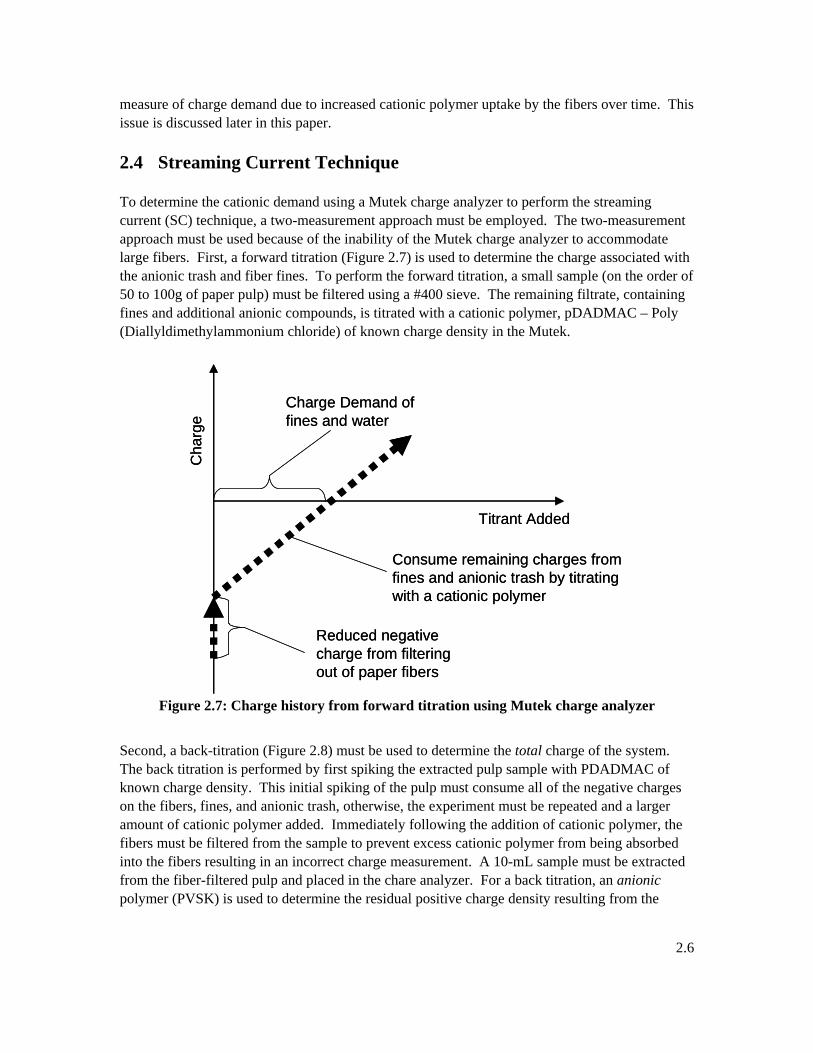
measure of charge demand due to increased cationic polymer uptake by the fibers over time. This issue is discussed later in this paper. 2.4 Streaming Current Technique To determine the cationic demand using a Mutek charge analyzer to perform the streaming current (SC) technique, a two-measurement approach must be employed. The two-measurement approach must be used because of the inability of the Mutek charge analyzer to accommodate large fibers. First, a forward titration (Figure 2.7) is used to determine the charge associated with the anionic trash and fiber fines. To perform the forward titration, a small sample (on the order of 50 to 100g of paper pulp) must be filtered using a #400 sieve. The remaining filtrate, containing fines and additional anionic compounds, is titrated with a cationic polymer, pDADMAC – Poly (Diallyldimethylammonium chloride) of known charge density in the Mutek.
Cha
rge
Titrant Added
Reduced negative charge from filtering out of paper fibers
Consume remaining charges from fines and anionic trash by titrating with a cationic polymer
Charge Demand of fines and water
Cha
rge
Titrant Added
Reduced negative charge from filtering out of paper fibers
Consume remaining charges from fines and anionic trash by titrating with a cationic polymer
Charge Demand of fines and water
Figure 2.7: Charge history from forward titration using Mutek charge analyzer
Second, a back-titration (Figure 2.8) must be used to determine the total charge of the system. The back titration is performed by first spiking the extracted pulp sample with PDADMAC of known charge density. This initial spiking of the pulp must consume all of the negative charges on the fibers, fines, and anionic trash, otherwise, the experiment must be repeated and a larger amount of cationic polymer added. Immediately following the addition of cationic polymer, the fibers must be filtered from the sample to prevent excess cationic polymer from being absorbed into the fibers resulting in an incorrect charge measurement. A 10-mL sample must be extracted from the fiber-filtered pulp and placed in the chare analyzer. For a back titration, an anionic polymer (PVSK) is used to determine the residual positive charge density resulting from the
2.6
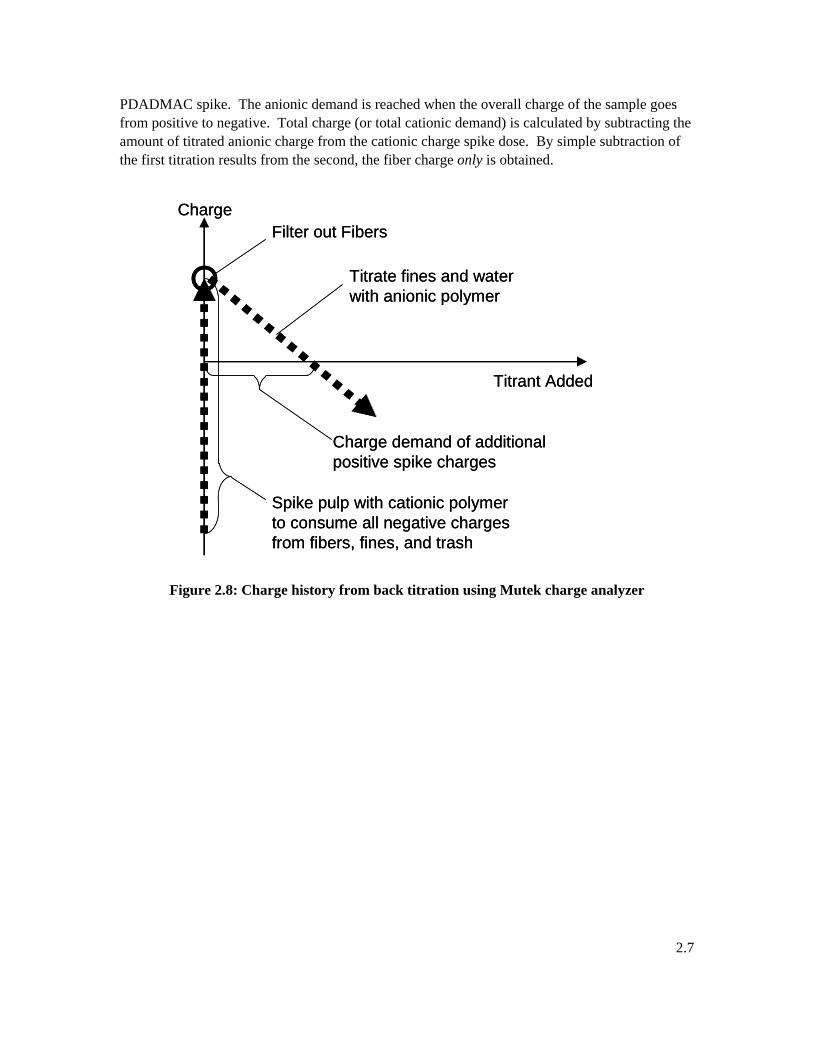
PDADMAC spike. The anionic demand is reached when the overall charge of the sample goes from positive to negative. Total charge (or total cationic demand) is calculated by subtracting the amount of titrated anionic charge from the cationic charge spike dose. By simple subtraction of the first titration results from the second, the fiber charge only is obtained.
Charge
Titrant Added
Spike pulp with cationic polymer to consume all negative charges from fibers, fines, and trash
Titrate fines and water with anionic polymer
Charge demand of additional positive spike charges
Filter out FibersCharge
Titrant Added
Spike pulp with cationic polymer to consume all negative charges from fibers, fines, and trash
Titrate fines and water with anionic polymer
Charge demand of additional positive spike charges
Filter out Fibers
Figure 2.8: Charge history from back titration using Mutek charge analyzer
2.7
3.0 Electrokinetic Sonic Amplitude Charge Demand Measurement Technique
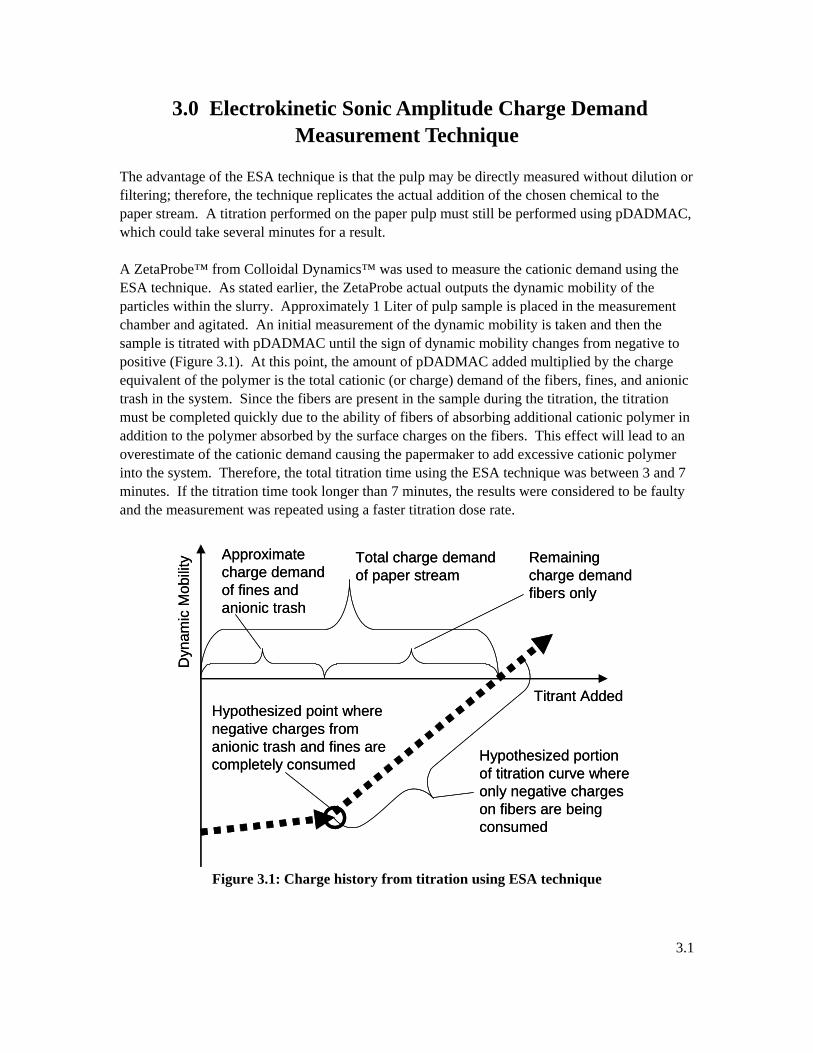
The advantage of the ESA technique is that the pulp may be directly measured without dilution or filtering; therefore, the technique replicates the actual addition of the chosen chemical to the paper stream. A titration performed on the paper pulp must still be performed using pDADMAC, which could take several minutes for a result. A ZetaProbe™ from Colloidal Dynamics™ was used to measure the cationic demand using the ESA technique. As stated earlier, the ZetaProbe actual outputs the dynamic mobility of the particles within the slurry. Approximately 1 Liter of pulp sample is placed in the measurement chamber and agitated. An initial measurement of the dynamic mobility is taken and then the sample is titrated with pDADMAC until the sign of dynamic mobility changes from negative to positive (Figure 3.1). At this point, the amount of pDADMAC added multiplied by the charge equivalent of the polymer is the total cationic (or charge) demand of the fibers, fines, and anionic trash in the system. Since the fibers are present in the sample during the titration, the titration must be completed quickly due to the ability of fibers of absorbing additional cationic polymer in addition to the polymer absorbed by the surface charges on the fibers. This effect will lead to an overestimate of the cationic demand causing the papermaker to add excessive cationic polymer into the system. Therefore, the total titration time using the ESA technique was between 3 and 7 minutes. If the titration time took longer than 7 minutes, the results were considered to be faulty and the measurement was repeated using a faster titration dose rate.
Dyn
amic
Mob
ility
Titrant AddedHypothesized point where negative charges from anionic trash and fines are completely consumed
Total charge demand of paper stream
Hypothesized portion of titration curve where only negative charges on fibers are being consumed
Approximate charge demand of fines and anionic trash
Remaining charge demand fibers only
Figure 3.1: Charge history from titration using ESA technique
3.1
4.0 Discussion of Results 4.1 Mutek Results Consistent measurements were obtained using Mutek charge analyzer to perform the SC technique. Table 4.1 contains results from a sample of SC pulp testing of with varying consistencies and surplus anionic charges from various sources. The highest coefficient of various for the sets of data presented here is 2.9%, indicating that the SC measurement technique is relatively precise.
Table 4.1: SC measurements of various paper streams
Sample # Batch 1
Batch 2 Batch 3
1 235 307 384 2 239 310 388 3 232 324 381
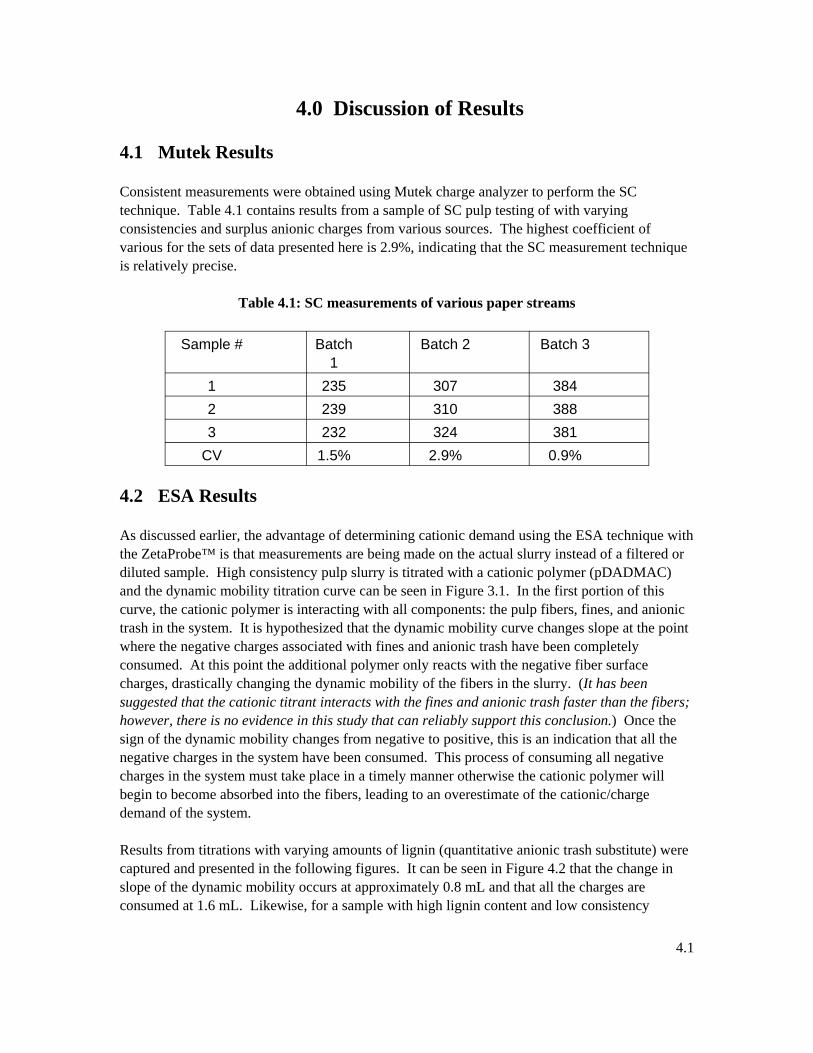
CV 1.5% 2.9% 0.9% 4.2 ESA Results As discussed earlier, the advantage of determining cationic demand using the ESA technique with the ZetaProbe™ is that measurements are being made on the actual slurry instead of a filtered or diluted sample. High consistency pulp slurry is titrated with a cationic polymer (pDADMAC) and the dynamic mobility titration curve can be seen in Figure 3.1. In the first portion of this curve, the cationic polymer is interacting with all components: the pulp fibers, fines, and anionic trash in the system. It is hypothesized that the dynamic mobility curve changes slope at the point where the negative charges associated with fines and anionic trash have been completely consumed. At this point the additional polymer only reacts with the negative fiber surface charges, drastically changing the dynamic mobility of the fibers in the slurry. (It has been suggested that the cationic titrant interacts with the fines and anionic trash faster than the fibers; however, there is no evidence in this study that can reliably support this conclusion.) Once the sign of the dynamic mobility changes from negative to positive, this is an indication that all the negative charges in the system have been consumed. This process of consuming all negative charges in the system must take place in a timely manner otherwise the cationic polymer will begin to become absorbed into the fibers, leading to an overestimate of the cationic/charge demand of the system. Results from titrations with varying amounts of lignin (quantitative anionic trash substitute) were captured and presented in the following figures. It can be seen in Figure 4.2 that the change in slope of the dynamic mobility occurs at approximately 0.8 mL and that all the charges are consumed at 1.6 mL. Likewise, for a sample with high lignin content and low consistency
4.1
(Figure 4.3), the anionic charges are consumed at approximately 1.35 mL and the dynamic mobility immediately goes positive due to the small amount of fibers being immediately consumed.
Low Lignin, High Consistency
-0.40
-0.30
-0.20
-0.10
0.00
0.10
0.20
0.30
0.00 0.50 1.00 1.50 2.00 2.50 3.00
Total Titrant Added [mL]
Dyn
amic
Mob
ility
[m2/
V/s]
Figure 4.2: Dynamic mobility for sample with high consistency and low anionic compound content
Heavy Lignin, Low Consistency
-0.40
-0.30
-0.20
-0.10
0.00
0.10
0.20
0.30
0.00 0.50 1.00 1.50 2.00 2.50
Total Titrant Added [mL]
Dyn
amic
Mob
ility
[m2/
V/s]
Figure 4.3: Dynamic mobility for sample with low consistency and high anionic compound content
4.2
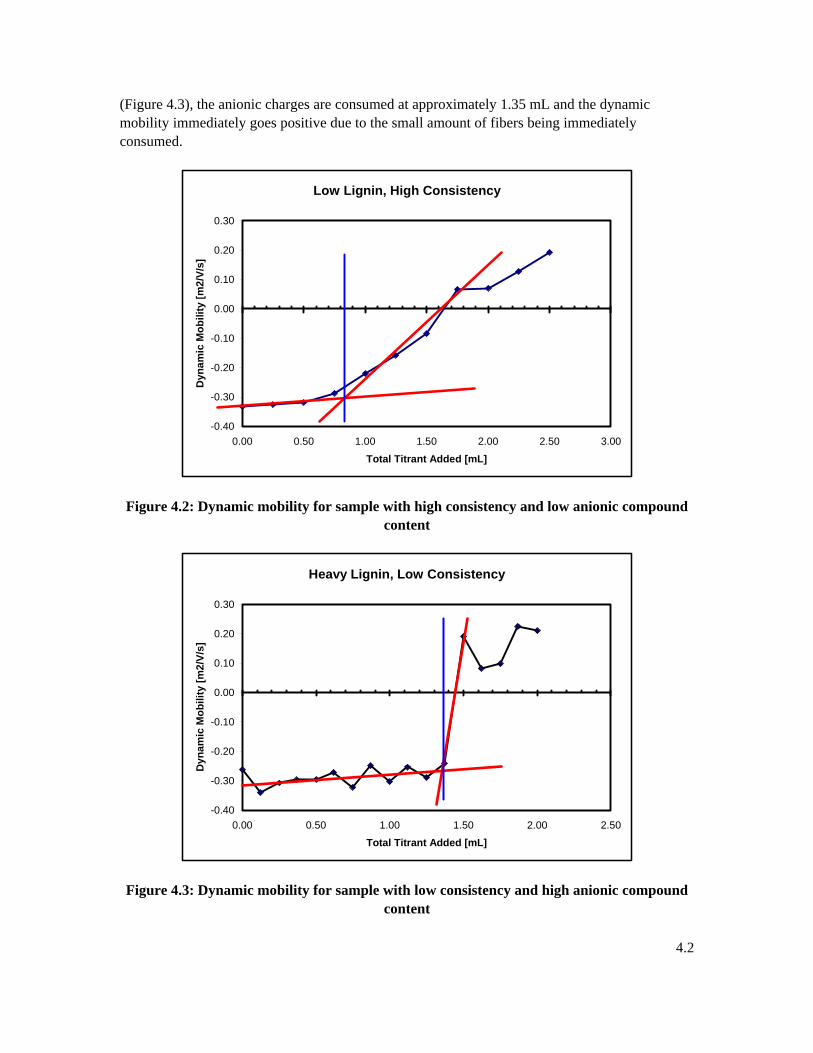
For a sample with both high consistency and high lignin content (Figure 4.4), the turning point at which all fines and anionic compounds are consumed is a bit more ambiguous to determine. The consumption of fines and anionic compounds occurs at approximately 1.85 mL and the total consumption of negative charges occurs at approximately 2.7 mL. For the three different samples shown here, the ESA technique provided reasonable results based on the nature of the samples. For samples with high anionic compound content (high lignin), the “turning point” of the dynamic mobility curve took longer to attain (Figure 4.3 and Figure 4.4) whereas the change in slope occurred almost immediately for the sample with low lignin content (Figure 4.2). Also for the samples with high consistency fiber content, the change from negative to positive dynamic mobility was much more gradual (Figure 4.2 and Figure 4.4) than the sample with low consistency (Figure 4.3).
Heavy Lignin, High Consistency
-0.50
-0.40
-0.30
-0.20
-0.10
0.00
0.10
0.20
0.30
0.00 0.50 1.00 1.50 2.00 2.50 3.00 3.50 4.00
Total Titrant Added [mL]
Dyn
amic
Mob
ility
[m2/
V/s]
Figure 4.4: Dynamic mobility for sample with high consistency and high anionic compound content
4.3 Comparison of Techniques The streaming current technique was consistent and reliable in providing cationic demand measurements for various paper pulp batches. However, the SC technique is not necessarily representative of the actual chemical reactions taking place in the paper stream due to the dilution and filtration required to perform the measurement. The ESA technique using the ZetaProbe demonstrated marked difficulty in making measurements on paper pulp, especially at lower fiber consistencies. The ZetaProbe was designed to perform measurements on small particles on the order of microns with densities much higher than that of the solution. Paper fibers have relatively low density and are on the order of millimeters in length. These properties likely reduce the
4.3
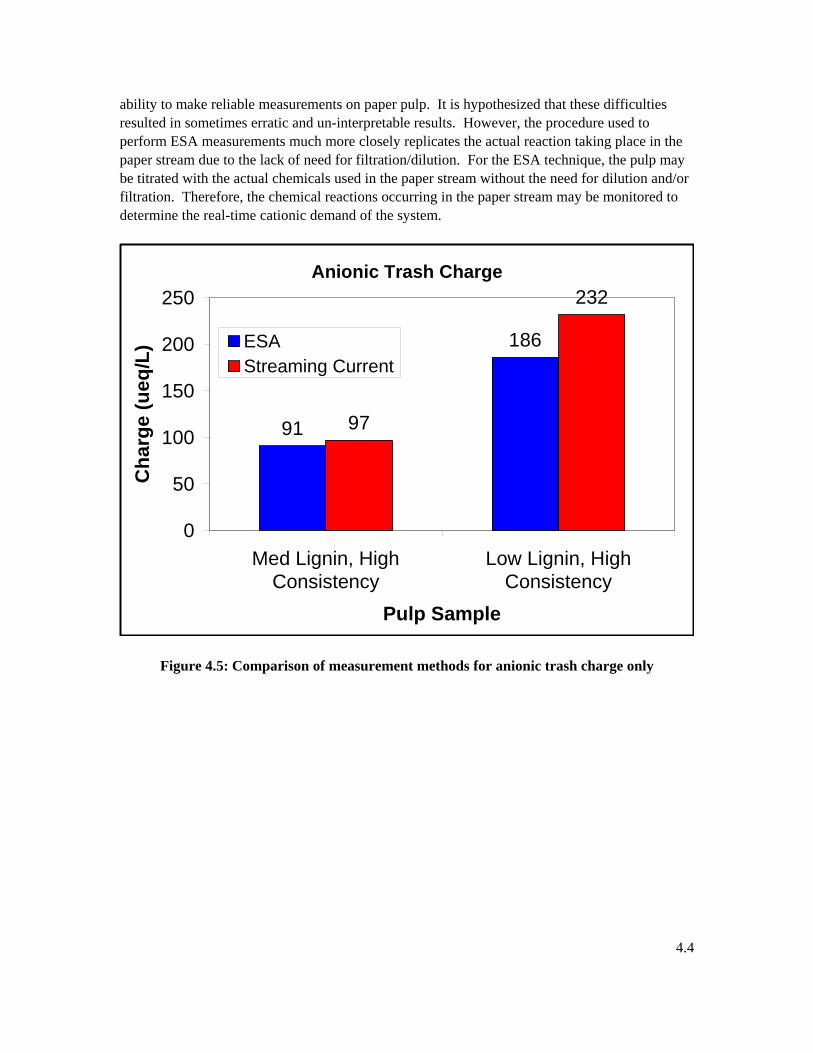
ability to make reliable measurements on paper pulp. It is hypothesized that these difficulties resulted in sometimes erratic and un-interpretable results. However, the procedure used to perform ESA measurements much more closely replicates the actual reaction taking place in the paper stream due to the lack of need for filtration/dilution. For the ESA technique, the pulp may be titrated with the actual chemicals used in the paper stream without the need for dilution and/or filtration. Therefore, the chemical reactions occurring in the paper stream may be monitored to determine the real-time cationic demand of the system.
Anionic Trash Charge
91
186
97
232
0
50
100
150
200
250
Med Lignin, HighConsistency
Low Lignin, HighConsistency
Pulp Sample
Cha
rge
(ueq
/L) ESA
Streaming Current
Figure 4.5: Comparison of measurement methods for anionic trash charge only
4.4
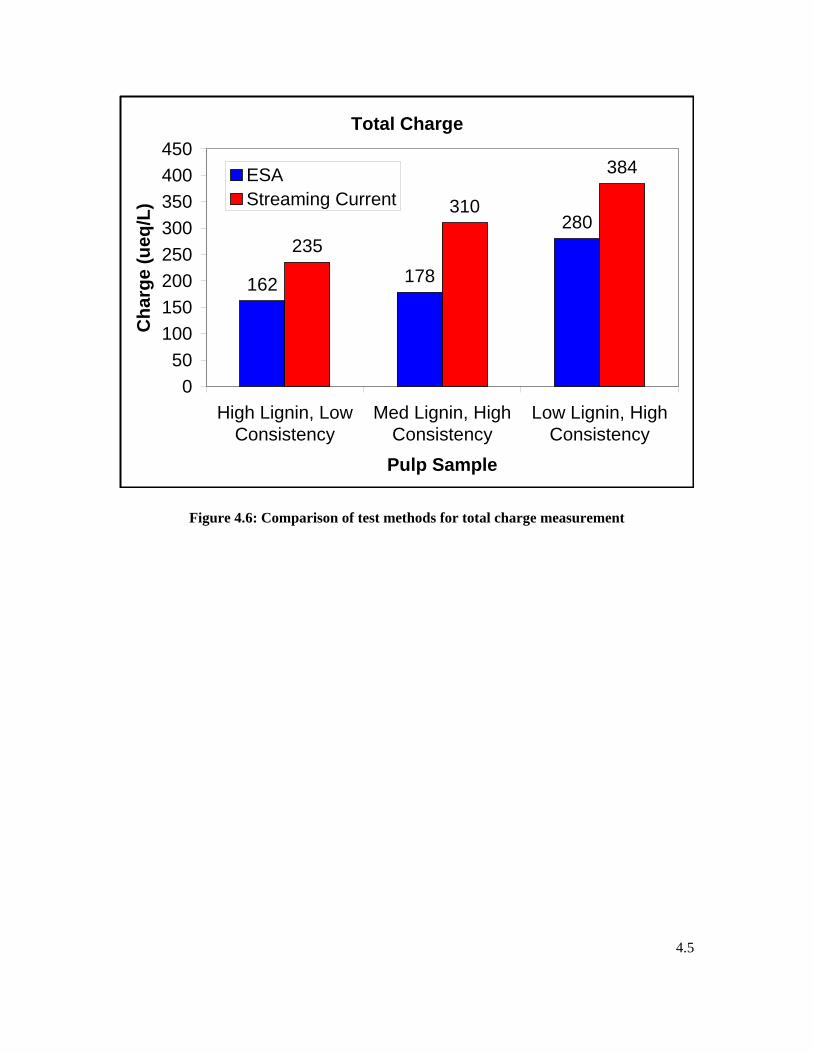
Total Charge
162 178
280235
310
384
050
100150200250300350400450
High Lignin, LowConsistency
Med Lignin, HighConsistency
Low Lignin, HighConsistency
Pulp Sample
Cha
rge
(ueq
/L)
ESAStreaming Current
Figure 4.6: Comparison of test methods for total charge measurement
4.5
5.0 Conclusions This project has made significant contributions in the area of paper chemistry using advanced technologies to gain a better understanding of the paper chemistry process. The current industry standard method of cationic demand measurement (streaming current technique) was found to provide consistent measurements for various paper pulp batches, which could be empirically correlated to charge demand. However, the streaming current technique is not necessarily representative of the actual chemical reactions taking place in the paper stream and does not provide an absolute value of charge demand. Conversely, the advantage of the ESA technique is the ability to replicate, on a smaller scale, the actual chemical/physical processes taking place in the paper stream when additional chemicals are added. However, the ESA technique using the ZetaProbe exhibited inconsistent paper pulp measurements, especially at lower fiber consistencies due to the low amplitude ESA signals, largely due to low specific gravity and large particle size. High fiber percentages were used to increase ESA signal strength; however, handling difficulties were encountered precluding the ability to obtain representative measurements of the pulp samples. PNNL efforts to construct a small flow loop for material handling led to cost overruns; therefore, the remainder of the project focused on measurements in the existing chamber. Within the scope and schedule of this project, the feasibility of the ESA technology for use in an on-line instrument was inconclusive. Further engineering is required to generate a sufficient ESA signal from the paper pulp to obtain reliable and consistent measurements. Future research in this area will help to further tailor the technology for application to paper streams. The ESA technology remains a viable option for on-line charge demand measurements in the papermaking process and future research should continue in this area to address technical and mechanical issues associated with its implementation.
5.1
6.0 References 1) Debye, P.J. 1933. A method for the determination of the mass of electrolytic ions. Journal of Chemical Physics, 1(13):13-16. 2) Jaycock, M.J. 1995. Assumptions made in the measurement of zeta potential by streaming current/potential detectors. Paper Technology 36(9):35-38. 3) O’Brien, R.W., D.W. Cannon, W.N. Rowlands. 1995. Electroacoustic determination of particle size and zeta potential. Journal of Colloid and Interface Science, 173:406-418. 4) Strazdins, E. 1992. Microelectrophoresis theory and Praxis. In: Papermakers Conference, Proceedings of the Technical Association of the Pulp and Paper Industry, April 5-8, 1992, Nashville, TN. 5) Taggart, T. 1985. Investigation of alternative methods of determining total charge in a papermaking system. M.S. Thesis, Miami University of Ohio.
6.1