Italian Association for the Development of Biotechnology...
68
Blossom Associati - Assobiotec Report Italian Association for the Development of Biotechnology Biotechnology in Italy The Financial Perspective 2008
Transcript of Italian Association for the Development of Biotechnology...

Blossom Associati - Assobiotec Report
Italian Association for the Development of Biotechnology
Biotechnology in ItalyThe Financial Perspective
2008

blossomassociati.com
Leadership Finance Management
Companies and Individuals Development
Milan - Italy
MANAGEINNOVATION
Federica BottazziManaging Director
+39-02-80 50 50 [email protected]

BIOTECHNOLOGYIN ITALY 2008 Blossom Associati - Assobiotec Report

Blossom Associati srl. All rights reserved.
AUTHORISATION FOR DIVULGATION
All rights reserved for the divulgation and use of the data,information, translation, electronic storage, reproduction,and partial or total adaptation by any means(including microfilm and photocopies).
No data and information contained in this report maybe used or divulged without prior written authorisation.Blossom Associati may, at its own discretion, authorisesuch use upon request, on condition that the followingsource is cited:
Report by Blossom Associati - Assobiotec 2008
Data sheets, charts or tables must, instead, state thesource indicated within the document.
Request for the reproduction of the data and informationcontained herein should be made by email to:
Object:request for the reproduction - Biotechnology in Italy 2008
Massimo BorieroMaria Adelaide BottaroFederica BottazziAgostino CarloniMaria Grazia ChimentiMarina Del BueMaria Alessandra De LucaSergio DompéRita Nunzia FucciLaura GattoRoberto GradnikGianluigi LiberatiCorrado MaggiAlessandra ManciaLuca MartignoniNello MartiniStefano MilaniFrancesca MondelloMaria Luisa NolliCeleste Martina PenatiAlessia PisoniAlberto OnettiMarco RenoldiDeryck RhodesCarlo RicciniFederica RovidaAlessandro SidoliMarco TalaiaUmberto VattaniLeonardo VingianiAntonella Zucchella
BIOTECHNOLOGY IN ITALY 2008
Acknowledgements:
AIFA
Assobiotec
Blossom Associati
CCIAA Varese
CIBIE (Center for Researchin International Businessand Economics)University of Pavia
CrESITUniversità dell’Insubria di Varese
Farmindustria
ICE
This handbook 2008is available online:www.blossomassociati.com

3Blossom Associati 2008
Innovating the concept of businessDear Friends and Customers,
2008: the Italian biotechnological sector is consolidating aphase of successful development, thus demonstrating its capacityto meet the challenge posed by the knowledge economy.The sector is in a rare state of ferment and pursuing a clear strategicobjective: integrating biotechnological and pharmaceutical companies,financial institutions and research institutes; a phenomenontaking place in Italy, as elsewhere in the world, and which couldgive rise to one of Europe’s leading biotechnological clusters.
At the close of 2007, the sector comprised 228 companies, of whichno less than 24 – meeting Blossom Associati-CrESIT’s methodologicalselection criteria – were accredited in that sole year. The sectorremains dominated by companies dedicated to health care (74%).The overall turnover of accredited companies exceeded 10 billioneuros, of which 4.8 billion generated by biotechnological products,representing a 11% growth rate in 2007.Biotechnological R&D investments totalled 1.3 billion - a 9%year-on-year increase. The employees of accredited sector companiesnumbered more than 26,000 (14,543 if we exclude accreditedPharma companies) of which over 6,600 in R&D. Overall, equitycapital rose 56%, while at 213% the sector posted a particularlystrong EBIT growth. In conclusion, financial indebtedness decreased30%, shrinking to 1.6 billion euro.
All these indicators point to there being real growth prospects forsmall companies (75% of the accredited companies). However, theoverriding factor is the interest shown in the sector by medium-sizedand large companies, which generate 97% of the entire Biotech sector’ssales and are responsible for 84% of R&D biotechnological investments.
Stefano MilaniCEO Blossom Associati
Alberto OnettiDirector CrESIT

To achieve a better understanding of the futurepotentialities of biotechnologies in Italy, the mostobvious course of action is to analyse thefoundations upon which the so-called Italianchallenge to the knowledge economy rests. Assector operators appreciate, Italy ranks among theleading countries in the international arena of thelife sciences. Its total pharmaceutical sales(pharmacies + hospitals) at ex-works prices amountto E 16.5 billion (2006 data, source IMS).The overall value of the pharmaceutical market (atex-works prices denominated in Euro) shows thatItaly is the third market in Europe, after Germanyand France and the fifth in the world, with theUSA and Japan occupying the first two positions(source IMS). In terms of employment, the sectorhas over 70,000 workers on its payroll (June2006), of whom over 6000 occupied in R&D.
599 clinical studies were conducted in Italy between2001 and 2007 on biotechnologically deriveddrugs (source AIFA, National Observatory on clinicaltrials), of which the main part was Phase II (42.2%)and Phase III (49.8%) with the remaining trialsin Phase IV (7.46%). In terms of numbers,the first three therapeutic areas of clinical trialsare oncology (34.4%) immunology and infectivediseases (10.8%) and haematology (9.4%).
4
The first has the objective of raising E 150 millionfor investment in technological transfer, theweakest link in the value-creation chain of theItalian economy. The second fund, on the otherhand, has E 45 million of its own fundsthanks to the involvement of the Tuscan bankingsystem and is focusing on biotechnologies forthe development of innovative start-ups.Alongside these funds, there is the Fondo Next,considered the best European practice as regardsequity funds, which was set up thanks to thesupport of Finlombarda and the Lombardy Region.The fund has raised E 37 million and investedthe money in three biotechnology companies.
Listed Italian biotech companies, all situatedin Lombardy:> NicOx: Listed in
November 1999 - France(Nouveau Marché - Euronext)
> Cell Therapeutics: Listed inJanuary 2004 - Italy(Italian stock exchange)
> Gentium: Listed inJune 2005 - US (NASDAQ,American stock exchange)
> BioXell: Listed inJune 2006 - Switzerland(BXLN.SW, ZÜRICH),
> Newron Pharmaceuticals: Listed inDecember 2006 - Switzerland(SWX, ZÜRICH)
> Cosmo Pharmaceuticals: Listed inMarch 2007 - Switzerland(COPN.SW, ZÜRICH),
> DiaSorin: Listed inJuly 2007 - Italy(Italian stock exchange)
> MolMed: Listed inMarch 2008 - Italy(Italian stock exchange)
In addition, there are the companies Biosearchand Novuspharma.The first is a biopharmaceutical companyset up as a spin-off by the managers of theLepetit Research Centre. In 1998, the fund3i invested E 13.5 million in the company andtook out 39% of the company's share capital.In July 2000, Biosearch was listed on theNew Market with an equity capital of aboutE 350 million.
As regards the operations of private equity andventure capital in Italy as a whole, the markethas now reached a consolidated maturity interms of the investment operations conducted,although there is still a significant delay asconcerns investments in the specific sectorof biotechnologies, especially in comparisonwith the other main European countries.However, the delays have been compensated inItaly by the bank foundations, which, in part, playthe role that venture capital plays outside Italy.TT Venture owned by the Fondazione Cariploand Toscana Innovazione belonging to MontePaschi di Siena are two examples of bank-ownedfunds recently set up in Italy.
Year N. CT %2001 2 0.32002 10 1.82003 20 3.42004 87 14.52005 130 21.72006 195 32.52007 155 25.8Total 599 100.0
Total CT involving drugs of biotechnological origin
Source: AIFA

5Blossom Associati 2008
In Italy, the science and technological parks inwhich biotechnologies operate constitute animportant asset in terms of scientific, technologicaland organisational skills. Moreover, the networkprovided by such parks performs a fundamentalrole in the development of the innovation supplychain. According to the latest analyses conductedby Blossom Associati, there are 7 science parksin Italy where biotechnologies are operative:the AREA Science Park, the Canavese BioindustryPark, the Parco Tecnologico Padano, the RafScience Park, the TLS Science Park, SardinaRicerche and the Insubrias Biopark of Gerenzano.
The data confirm the findings documentedin the previous edition of the Report: i.e. thatthe localisation of the biotech industry is directlyrelated to the co-presence of a series of differentindustrial and institutional factors – pharmaceuticalcompanies, research centres and structures,scientific and technological parks and incubators,hospitals and clinics, and also investors – whichby functioning together as a system stimulatethe development of new companies.
Venture Capitalists
Banks
IstitutionalInvestors
Stock Market
Business Angels
INVESTORS
Advisory
Financial
Legal
Human Resources
SERVICESPROVIDERS
Consortia
Hospital
Science Park
Universities
Bio-incubator
FUNDAMENTALRESEARCH
Related Companies
Applied Companies
COMPANIES
Istitutions
Local Istitutions
IndustrialAssociations
European Union
ISTITUTIONS
Biotechnologycompanies
CLUSTER
CapitalProfessional
Services
Fees
Fees
HumanResources
Interest,dividends
Legislative Support
EconomicDevelopmentEmployment
Know how Investments
In December 2003, Biosearch merged withVersicolor, a Californian company listed onNasdaq and the resulting company was calledVicuron, a fully integrated, global, pharmaceuticalcompany that was subsequently taken overby Pfizer in September 2005.Novuspharma, instead, started life as abiopharmaceutical company specialised in R&Don antitumour drugs. The group BoehringerMannheim sold it as a spin-off from its Monzadivision. The fund 3i invested E 18 millionin the company together with two other investorsand the management and employees ofNovuspharma became shareholders in thecompany through a stock option plan.Roche continued to act as strategic partner tothe company, guaranteeing the transfer andlicensing of important research project patents onwhich it retained option rights. In November 2002,it was listed on the New Market witha pre-money capital valuation of about E 360million and raised around E 160 million incapital subscriptions. In June 2003, the companymerged with the American Cell Therapeutics.
Listed Italian biotech companies (up to 2008)
Profile: Blossom Associati Corporate Finance
That these are particularly exciting times forItalian biotech companies is also demonstratedby the international agreements they haveentered into. Examples of these developments arethe agreement reached between Nerviano MedicalSciences and the American Genentech for 316million euros, the acquisition of Hunter-Flemingby Newron and the merger between Amgen andDompé which will lead to a biotech company witha strong research orientation and investments in2008 estimated at E 10.5 million.
Company Year of Listing Stock exchangeNicOx 1999 France - Nouveau
TrademarksEuronext
Biosearch 2000 Italian stock exchangeNovuspharma 2000 Italian stock exchangeCell Therapeutics 2004 Italian stock exchangeGentium 2005 USA - NASDAQ
Americanstock exchange
BioXell 2006 SwitzerlandSWX Zurich
Newron 2006 SwitzerlandSWX Zurich
Cosmo 2007 SwitzerlandSWX Zurich
DiaSorin 2007 Italian stock exchangeMolMed 2008 Italian stock exchange
Source: Blossom Associati - CrESIT
Discovery Preclinical Phase I Phase II Phase IIIPipeline Italy 2008 99 63 33 35 16
Source: Blossom Associati - Assobiotec
Furthermore, the sector’s characteristically strong territorialconcentration is also a local phenomenon. Thus, biotech companiesapart from polarising on a limited number of regions (Lombardy,Piedmont, Tuscany and Friuli Venezia Giulia), also tend to concentratein certain specific territorial areas within them. If we limit ourselvesto the case of Lombardy alone, we find that accredited companiesare principally situated in the area of Milan, with ramifications inComo, Varese, Lodi and Pavia, although all are situated within amaximum radius of 50 kilometres from the regional capital.
If we consider international empirical analyses, on the one hand,and, on the other, our accumulated experience of cooperation withmany companies as strategic advisor, we can illustrate some featuresthat characterise the managerial DNA of all the companies thatwe can define as “emergent companies”:> they invest in business ideas and products that do not
set limits upon their own growth potential or value(Business Innovation);
> they sustain the implementation of new ideas – innovationunderstood as the task of all persons within the organisation(Corporate Innovation);
> they demonstrate managerial capacity through the adoptionof strategic options and financially sustainable exit strategies(Managerial Innovation).
Finally, we would like to emphasise three structural problem areasthat in, our opinion, call for serious remedy, in Italy as elsewhere:> Corporate renovation to be understood as a crucial phase in the
innovation of not only products, processes and systems butalso corporate objectives and missions in order to guaranteethe attractiveness and ongoing advantage of companies if theyare to be able to compete at a global level (The Innovation of theBusiness Concept, Corporate Innovation, and Managerial Innovation).
> Certainty of the timeline to obtain authorisations and clinicaltrial permits, which can be achieved by borrowing the systemsand operating arrangements in use in other European countries.
> Rigour and the application of selective sector models in theprovision of financing while bearing in mind the universal needfor a new class of financial advisors and operators, as they havethe capacity to interpret and valuate such new business types.
These are the considerations that we would recommend our readersremember when they read the 2009 edition of the Report evaluatingthe operations conducted in the course of the year and describingthe performances of the best-accredited “emergent companies”.
6

7Blossom Associati 2008
The growth and consolidation of Italian biotech
The fourth edition of the report “Biotechnologies in Italy” provides expertswith an updated overview of the sector and a chance to critically appraise thedevelopmental process of the Italian biotech industry in recent years.
The phases through which the industry has developed as well as the objectiveshitherto reached in terms of the critical mass of companies, employees and salestestifies to the fact that the sector – comprising companies, scientific parks andresearch centres – has by now acquired the characteristics of a mature industry.The process is well known as other countries have passed through the same phases.Italian biotechnologies are undergoing a specific developmental phase characterisedby the ongoing growth of new corporate ventures but also, and more importantly, bythe consolidation of established companies, and the elimination of the weakest.
The undeniable maturity of the biotech sector is also demonstrated by a seriesof important factors. First the sector’s capacity to produce value has been reinforced,as testified by its sizeable pipeline, which, in a pharmaceutical context,translates into a constant increase in the number of products undergoing clinicaldevelopment (Phases I-II-II), and which are all the result of Italian research.The number of such products has practically tripled in only two years, rising from30 in March 2006 to 84 in March 2008 (a 280% growth rate). In particular,of the 84-biotech products undergoing clinical development, 33 are in Phase I,35 in Phase II, and 16 in Phase III. Moreover, 8 have received “orphan drugdesignation” (3 by EMEA and 5 by both EMEA and the FDA). These are mainlyproducts for use in the field of oncology. The remaining products refer to cardiovascularapplications. Italian biotech research, furthermore, can boast 63 products at apre-clinical developmental phase and 99 molecules at a discovery phase, whichaltogether constitute a solid foundation for the sector in the coming years.
A second element demonstrating the maturity of the sector is the progressivecapitalisation of the companies. A strong growth in capitalisation goeshand-in-hand with the increase in companies’ project development activities.Similarly, R&D investments are increasing and some important agreementscan be read in the light of these investments, as they bring Italian companies andinternational partners increasingly closer together.
In conclusion, there is the contribution made by the stock exchange. In a six-yearperiod, since 2001, five Italian biotechnological companies achieved a listingon the principal international markets. In March 2008, a sixth company managedto be listed on the Milan stock exchange. This is not an insignificant achievementif it is considered that the first listings – and for considerable time the onlylistings – go back to the period 1999-2000, the time of the ‘new economy’ boom.
Certainly, the path is still long and major investments in biotechnological innovation,which has shown itself capable of generating wealth, jobs and wellbeing, is stillnecessary. In terms of the national economy the challenge is, therefore, to sustainand realise the potentialities of the Italian sector through strong and strategicindustrial policy decisions, in both the medium and the long term, capable ofattracting ever-higher investment flows. In the same manner, it is necessary tosupport whoever has an original idea and transform it into a corporate reality.For this purpose, Assobiotec has launched “Sportello Biotech”, (the Biotech Desk)a new area of its internet site, offering free information for the creation ofstart-ups and spin-offs in the biotechnology sector. Similarly, we also promotedthe exhibition BioInItaly (April 2008), where fifteen companies (chosen from about30 applicants) were able to present their research projects to over forty internationalfinancial investors.
Now it is necessary to improve the country’s capacity to attract investment –for whoever has an original idea and for whoever wants to invest.Therefore, it is necessary that the Finance Act fully implements all the taxfacilities for “new innovative companies”, and increases tax relief on corporateR&D expenditure from 10 to 20%.
Roberto GradnikPresident Assobiotec

8
Within a fast changing framework characterised by increases in R&D spendingand the reduction in the number of active principles discovered each year, biotechnologieshave long since come to play an important and integral role in the life sciences.
Ever-closer relationships between pharmaceutical companies and the new technologies(in various forms such as co-operation, co-promotion, and co-development) meanthat many advanced scientific paths can now be explored to meet hitherto unsatisfiedtherapeutic needs. Furthermore, through closer working relations the necessaryskills, resources and instructions are forthcoming for the development of themolecules and expertise that will make the new therapeutic instruments available.
Thanks to possessing a number of unique qualities, Italy has demonstrated itsleading international role in the life sciences (the third country in Europe and thefifth in the world in terms of employees), and its capacity to attract foreign capital.
Furthermore, Italy has acquired an international specialisation in the pharmaceuticalfield as demonstrated by its foreign trade surplus in pharmaceuticals (E 1,229million in 2007). The intensity of research and development is growing in thesector, as proxied not only by the ratio of researchers to total employees (whichrose from 8.3% in 2006 to 8.7% in 2007) but also by the ratio of R&D investmentto turnover (which grew from 9.4% to 10.1%).The biotechnologies deployed for health care are making an important contributiontowards such results.
At present 147 projects are being conducted by Red Biotech in Italy, of which63 in the pre-clinical phase and 84 in the clinical development phase.Total R&D investments are rising as well as the value of red biotechnologicalproduction (estimated at E 4.6 billion), corresponding to 20% of the total valuegenerated by the pharmaceutical sector as a whole.
Apart from large Italian-and foreign owned companies, the companies dedicatedto biotech research in Italy are becoming ever more numerous: 42 pharmaceuticalcompanies have recently oriented their R&D effort towards the new technologies.
These include those start-ups that in short space of time conquered the front pagesof prestigious international scientific journals, attracted investments into Italy andreached cooperation agreements with large companies. Gentium, which is specialisedin research activities, especially in the field of orphan drugs, is the only Italiancompany to be listed on NASDAQ; Axxam works in the San Raffaele Scientific Park;Nerviano Medical Science has commenced cooperation with Bristol Myers Squibbfor the development of oncological drugs; Layline Genomics, a spin-off from theScuola Internazionale Superiore di Studi Avanzati (SISSA) in Trieste, is part of anetwork with BioXell for the development of a monoclonal antibody; MolMed hasbeen recently listed on the Milan stock exchange; Newron has reached an agreementwith Merck Serono for the development of products for Parkinson’s and Alzheimer’sdisease; Philogen, from which Bayer-Schering AG has acquired the developmentof marketing rights for a new anticancerogenic molecule will soon be listed on theMilan stock exchange; NicOx, listed on Euronext, has reached agreements withPfizer and Merck & CO.
That Italy offers numerous competitive advantages is a fact recognized by themanagers who work here. Such advantages include the presence of many outstandingpublic biomedical research centres, in which some of the most prestigious internationalnames work, highly qualified personnel and a skilled management, the productivity,flexibility and creativity of the human resources, solid skills and a long industrialtradition and a widespread and strongly innovative entrepreneurial spirit.
The Life Sciences in Italy:the pharmaceutical companies’ biotech effort
by Sergio DompéPresident Farmindustria

9Blossom Associati 2008
Moreover, this salient position has been furtherconsolidated in recent years by incentives providedfor sector companies: the programmatic agreementsto promote investment in production and R&D inItaly; the fund for the promotion of research andadvanced training in biotechnologies and, veryimportantly, tax credits for research activities.
And nor should we forget the 0.5 percent allocation,a mechanisms that allows the taxpayer toearmark a part of his or her income tax towardsassociations that undertake socially relevant activities(non-profit, scientific and health-care research).Moreover, we can also cite other forms of assistance:the EU’s 7th framework programme, the reductionin the Ires (corporate income tax) rate, and financingfrom bank foundations.
These measures have created the premises foran ever closer co-operation between companiesand public centres of excellence, for examplein the field of rare illnesses – a particular fieldof biotechnological application – which areindispensable if significant results are to be achieved.Genetic engineering and pharmaceutical/biotechnological research constitute the maincontributions for the cure of rare illnesses while manyof the orphan drugs are, in fact, biotech drugs.
Such pathologies (which are mostly genetic inorigin) call for a new approach on account of theircomplexity in therapeutic and ethical terms; anapproach that can bring public and private skillstogether in the name of social solidarity and theobservation of the principle of subsidiarity.
The commitment of companies to the researchnetwork on rare diseases needs the support of anad hoc network created for information and training.This was the premise that led to the agreementon the protocol of understanding betweenFarmindustria and the UNIAMO Association.The protocol is a tool aimed at promoting theadoption in Italy of legislative instrumentsdesigned to encourage the development of orphandrugs by providing financing for research andimproving the welfare and social assistance aspectsof such pathologies.
The biotech sector is an extremely high valueindustry in terms of its therapeutic potentiality andhigh innovative profile.Italy has been able to participate successfully inthis process thanks to its mix of industrial skills,the excellence of its research and the entrepreneurialvitality exhibited by the biotechnological sector,which is generating not only important scientificresults but also ever larger numbers of companiesand, consequently, overall sector growth.
Pharmaceutical andBiotech companies
Public R&D:istitutions and
universitiesPatient andnon-profit
associations
Commitmentto industrial
research
Circulation ofintellectual
resourses andinformation
Incentivesfor R&D andnetworking
New andmore-focused
therapies
Information,prevention,diagnosis,
and treatment
The network of research, information and training

Biotechnologies in Italy 2008
At the end of 2007, the sector comprised 228 companies,of which 24 accredited in that year insofar as they met theBlossom Associati-CrESIT methodological selection criteria.The sector remains dominated by companies dedicated tohealthcare (74%).The overall turnover of accredited companies exceeded 10 billioneuros of which 4.8 billion generated by biotechnological productswhose 2007 growth rate was 11%. Biotechnological R&Dinvestments totalled 1.3 billion, which represents a 9% increaseon the previous year.The employees of accredited sector companies numbered over26,000 (14,543 if we exclude accredited Pharma companies)of which over 6,600 active in R&D. Equity capital rose overallby 56%, with a strongly growing EBIT of 213%, and a 30%decline in financial debt, which shrank to 1.6 billion euro.
Although the Italian biotechnological industry is, largely, arecent development, interesting information can be obtainedfrom the growth in the number of companies over time.Of the 222 companies almost 60% were set up or located inItaly in the last ten years and of these 87 (40% of the total)were only founded in the last six years. The number of companiesin the industry has grown constantly, especially since 2000when the development rate intensified significantly. Since 2000,the average annual registration rate of new companies has been13 (representing an approximate annual new entrant rate of 10%)However, alongside the new entrants there are a group of companieswith a long history and tradition. 63 companies were foundedprior to beginning of the 1990s, and 20 before 1970. These arecompanies whose consolidated market positions were achievedby developing traditional technologies and which have tended todiversify into new biotech-derived technologies in recent years.
Numerically, the Italian industry is mainly made up of smallcompanies. 170 of the 228 certified companies (75%)employ fewer than 50 employees and generate total sales ofless than 10 million euros. 27 of the remaining companies (12%)are medium-sized concerns (i.e. employing less than 250,with annual sales of less than 50 million euros) and 30 (13%)are large companies employing over 250, whose sales exceed50 million euros.
by Stefano Milani, Alberto Onetti, Federica Bottazzi, Federica Rovida
Blossom Associati Management Consulting
CrESIT - University of Insubria of Varese
befo
re 1
970
2229
40
63
94
132
228
20
1971
- 19
75
1976
- 19
80
1981
- 19
85
1986
- 19
90
1991
- 19
95
1996
- 20
00
2001
- 20
07
Number of biotechcompanies in Italy:temporal growth
Source: Blossom Associati - CrESIT 2008
159 178 199 211 223 228
149
2002
2003
2004
2005
2006
2007
2001
Source: Blossom Associati - CrESIT 2008
Number of newly set upbiotech companies:temporal growth (2001-2007)
Large 13%
Medium 12%
Small 75%
Source: Blossom Associati - CrESIT 2008
Breakdown of Italian biotech companiesby size
10

11Blossom Associati 2008
Red 73%
White 9%Bioinfo 5%
Green 13%
Source: Blossom Associati - CrESIT 2008
Classification of biotech companies in Italyby area of application
Red 95,36%
White 0,54%Bioinfo 0,07%
Green 4,04%
Source: Blossom Associati - CrESIT 2008
Breakdown of biotech turnover by area
Green 11,76%
Red 86,28%
White 1,60% Bioinfo 0,36%
Source: Blossom Associati - CrESIT 2008
Breakdown of R&D investments inbiotech activities by area
An analysis of the 228 companies shows that 168 work inthe health care area (the so-called “Red Biotech Companies”),30 in the field of biotechnologies for agricultural, animal husbandryand veterinary applications (the so-called “Green BiotechCompanies”), 19 in industrial and environmental fields(“White Biotech Companies”) and 11 are oriented to R&D inthe field of bioinformatics.
It should also be noted that 31 subsidiaries, or branches ofmultinationals, figure among these 228 companies, of which18 belong to the “Pharma- industry” category. In numericalterms, therefore, the industry reveals a prevalence ofItalian-owned companies.
Apart from estimating the overall economic value created bythe sector, we are also in a position to quantify the revenuesgenerated by companies from the sale of biotech-derived products.The figure constitutes a subset of the aggregate revenues postedby the 228 recognised companies and was obtained by applyinga percentage – representative of the share of revenue from thesales of biotechnological products in Italy and on internationalmarkets1 – to the revenues of each company.
Although this figure is important, and now places Italy amongthe leading European countries, it should be stressed that, today,sales revenues are certainly not the principal indicator for assessingthe development potential and growth opportunities of the industry.The analysis of investments and pipelines allows us to determinethe potential future of the business, which, in view of theextreme volatility of the sector, can undergo strong (positive)variations from one year to another.
This is the case of certain small companies that, thanks tothe development of innovative products, were able to increasetheir market share within the space of a few years until theyreached a position of global leadership with levels of capitalisationon a par with the main multinational companies operating intraditional sectors.
95% of the foregoing 4,805 million euros is accounted for bythe “Red” sub-sector. The remaining 5% is produced bycompanies operating in other areas, with a clear predominanceof the “Green” sub-sector.
1 This percentage was calculated in the course of a qualitative analysis of theinformation provided by the companies.

It would also be useful to supplement the foregoing data withinformation on the aggregate sales of which the foregoing biotechrevenues form part. In terms of total turnover (thus not singlingout the biotech component) in 2006 the 228 companies surveyedposted revenues of over 10.8 billion euros2. Obviously, the datalargely reflect the revenues obtained by the 42 red biotechcompanies with a pharmaceutical derivation, which alone accountedfor over 7.9 of the 10,8 billion in question.
The overall size of the investments in R&D in biotechnologicaltechnologies and processes in 2006 in Italy has been estimatedat 1,331 million euros: of which 1,149 million (over 86%)invested by Red companies, 155 million euros (12%) by companiesin the Green area and the remaining 26 million (2%), in theWhite Biotech sub-sector.
The significance of these data once again demonstrates theunderestimates of the research effort of Italian industry bymost studies with an international circulation. The principalreason for this under-estimate is to be found in the difficultyof procuring and identifying pertinent data during analysis.As stated in the methodological notes, the foregoing data concerningthe size of biotech investments are based solely on the valuesof R&D investments in technology and processes referring tobiotechnological type platforms carried out by the 228 companiesmaking up the industry.
However, it would be appropriate to supplement the foregoingfigures with data on the overall volumes of investments inR&D (and thus not just limited to biotech activities). In 2006,the 228 recognised companies made investments for over2,345 million euros in R&D. The data, however, are stronglyinfluenced by the value of investments referring to companiesfrom the pharmaceutical sector that mainly tend to investin traditional technology and products, especially the 14“Pharma Oriented” companies.
2 Aggregate sales data proxy the economic value generated by the biotech sector.However, it should be noted that this value is necessarily an over- or under-estimateas it not possible to “map” situations that sometimes can have a major impact onthe results presented. A frequent case is that of spin-offs or branches of foreigncompanies with marketing agreements for the products of their parent companies.In this case, the sales data refer to R&D activities performed outside Italy.However, the same argument applies to diversified companies that occupy marketsother than biotech. For this reason, the turnover should be rectified to excludesales referring to other business. In all these cases, an analysis that takes accountof the sales data of Italian companies is structurally inclined to over-estimate thesize of the sector. On the other hand, there are subsidiaries of foreign companiesdedicated to R&D whose products are marketed by other companies of the group.In this case, their operating revenue will not reflect the actual value of theoperations performed in our country. However, such simplifications are unavoidablein an analysis on aggregate data. Nevertheless, they also mean that we should makea careful and prudent use of the results presented.
12

13Blossom Associati 2008
The data used (number of employees declared by the companiesand found by qualitative analysis or by analysing the notes tothe financial statements) nevertheless tend to underestimate thesize of the industry. Thus, it can be presumed that the industryincludes, especially in the case of smaller companies, a significantnumber of self-employed professional workers and other freelancers.
In terms of territorial location, the Italian biotechnological sectoris characterised by its strong geographical concentration.If, on the one hand, almost all the regions (17) of our countryhost biotech companies, at present only a few have attractednumerically and economically significant concentrations ofcompanies. The regions that exhibit strong concentrations areLombardy, where 78 companies are situated (35% of the total),Piedmont with 31 companies (12% of the total), Tuscanywith 22 (10% of the total), Friuli Venezia Giulia with 16(7% of the total) followed by Lazio with 15 (6% of the total)and Sardina with 13 (6% of the total). 76% of the Italianbiotechnological companies are concentrated in these six regions.
Furthermore, strong territorial concentrations also emergewhen we examine each region. Thus, biotech companiesapart from being concentrated in a limited number of regions(Lombardy, Piedmont, Tuscany and Friuli Venezia Giulia), alsotend to cluster in certain specific territorial areas within them.We can take the case of Tuscany to illustrate this phenomenon.In this region, the companies are not evenly distributed throughoutthe region but localised in areas around Florence, Siena and Pisa,where all the basic factors for their development can be found.
Breakdown of R&D employees and overall totals by area
Scope of application Total R&Demployees employees
Bioinfo 205 162Green 477 149Red 25,303 6,233White 172 108Overall total 26,157 6,652
Source: Blossom Associati – CrESIT 2008
The overall number of employees performing R&D activities is6,652 (57% of all employees surveyed in the framework ofbiotech companies). The data take account of researchers activein Green (3%), White (2%), Bioinformatics (3%) and Red Biotech(92%) companies.
If the analysis is extended to cover all the employees of the228 Italian biotechnological companies (of which 14 arethe direct expression of the pharmaceutical industry) the resultingfigure is 26,157 employees, hence all the employees of Green(3.3%), White (1.2%), Bioinformatics (1.4%) and Red Biotech(94%) companies. The latter two categories include not onlyauthentically red biotech companies but also pharmaceuticallyderived companies.

14
Lazi
o
Tosc
ana
Emili
a Ro
mag
na
Piem
onte
Cam
pani
a
Friu
li Ve
nezi
a Gi
ulia
Vene
to
0
8000
7000
6000
5000
4000
3000
2000
1000
Lom
bard
ia
Sard
egna
Altre
ALL EMPLOYEESR&D EMPLOYEES
Empirical evidence shows that the extreme volatility of the sectorand the facility of transferring intellectual capital and financialresources, means that foreign companies tend to invest financialcapital and attract intellectual capital where the prospectsof a functional system and the creation of value have alreadybeen found to operate, in terms of internationally consolidatedpositions and relations.
If we reflect on the analysis of the 228 companies, net of the13 Pharma oriented companies, we find confirmation of theforegoing considerations, and also as regards employment data,even though their national ranking in this respect may be slightlydifferent. At a national level, the number of employees engagedon R&D amounts to 6,652 while the overall number of allemployees of biotechnological companies (including the dataon accredited pharmaceutical companies) is around 26,157.
Source: Blossom Associati – CrESIT 2008
Lombardy certainly detains a leading position. 11,555 employeeswork in the region, of whom 3,472 engaged in R&D (44% ofthe national total and 52% of all employees in the industryengaged on R&D, on a national basis). In terms of total and R&Demployees, Lazio emerges as the second most important region,where there is a strong prevalence of Big Pharma or large biotechoriented companies. After these we find regions with a strongpropensity towards investment such as Piedmont, with 9,5%of all the industry's employees and 8,7% of all R&D employeeson a national basis, Emilia Romagna with 1,5% of all employeesand 4,5% of employees engaged on R&D on a national basis,followed by Tuscany and Friuli Venezia Giulia.
The geographic distribution of all employees in the industry and R&D employees

15Blossom Associati 2008
An analysis of the distribution of turnover by region underlinesthe territorial polarisation mentioned earlier. Two regions (Lombardyand Lazio) alone account for 76% (in almost equal proportions)of national sales, while demonstrating profoundly differentorientations and morphological characteristics with respect tocompany structure.
An examination of other regions reveals important contributionsfrom Tuscany (which accounts for 11% of biotech operatingrevenue), Emilia Romagna and Friuli (which jointly account foranother 7%)
The analysis of biotech investments in R&D reveals a partiallydifferent picture, which tends to correspond to the map of thedistribution of the companies. In this case, the followingaspects emerge. Lombardy plays a predominant role, with 73%of all investments carried out in Italy in biotechnological R&D.
However, the importance of Tuscany in the panorama of the Italianmarket diminishes as it accounts for only 2% of all investments.On the other hand, the contributions of Emilia Romagna (8%)and Piedmont (4%) are found to be significant, as well as thatof Friuli (3%). Lazio, on the other hand, has a much more limitedR&D role (6%) in relation to the foregoing indicators.
The analysis of the asset structures of biotech companiesreveals a very clear competitive position attributable to eachof the Italian regions.
Geographical distribution
Region # Companies # R&D # Overall Biotechemployees employees Turnover
Campania 9 212 265 9,314,027Emilia Romagna 14 581 2,500 174,589,188Friuli Venezia Giulia 16 135 206 37,712,805Lazio 15 1,069 7,721 1,685,686,182Lombardy 78 3,472 11,555 2,386,039,818Piedmont 31 299 385 130,489,461Sardinia 13 75 93 2,384,617Tuscany 22 637 3,169 315,197,226Trentino Alto Adige 4 7 40 42,020Veneto 11 98 138 52,210,292Other 15 66 85 12,215,073Total 228 6,652 26,157 4,805,880,708
Source: Blossom Associati – CrESIT 2008
The strong territorial concentration of the sector, which weunderlined earlier, now appears even more pronounced.The first six regions that account for 76% of all Italian companiesemploy over 96% of all employees and over 79% of the employeesengaged on R&D.

Lombardy is the region with the highest concentration of R&Dactivities, as well as displaying a uniform distribution of large,medium-size and small companies, all sharing the same strongvocation for innovation and investment in technologies and products.In addition, the system includes the presence in the territory ofnot only scientific parks such as, for example, Science Park Raf(as described in detail below), but also internationally importantuniversities, clinical institutes with a strong vocation forexperimentation and attracting investors (the latter favoured bythe proximity of Milan, the nation’s most important financialcentre). In addition, to these advantages there is the supportprovided by local institutions. These are increasingly committedto sustaining the development of biotechnologies and attractingforeign investments by streamlining bureaucratic formalitiesfor company growth and developing specific packets to sustainintellectual capital and help set up new companies.
Tuscany possesses a mature system made up of 22 companiescharacterised by a strong R&D vocation for biotechnologicalresearch (such as, for example, Novartis Vaccines ex Chiron)while important investments are being carried out within theterritory by pharmaceutical companies. For example, we findnational pharmaceutical companies (such as Abiogen Pharmaor Menarini), small biotech companies strongly oriented toinnovation, as well as scientific parks such as the Tuscany LifeSciences (see following data sheet), universities oriented tothe setting up of academic spin-offs such as the University ofFlorence, clinical institutes oriented to experimentation andinstitutional investors willing to support the sector (the Montedei Paschi Foundation).
Piedmont, Friuli, Sardinia and other regions are meeting thedevelopmental challenge by an increased commitment to innovation.Although the number of companies on their territories is stillsmall, they exhibit a strong vocation for innovation and a strongorientation towards innovation in biotechnological R&D. Moreover,it should be noted that for years regional institutions have beensupporting the creation of systems and structures able to hostnew innovative biotechnological companies with a stronginternational character. This is demonstrated by the scientificparks to be discussed in further detail below (the CanaveseBioindustry Park in Piedmont, the Science Park Area in Friuliand the Scientific and Technological Park in Sardinia), that functionas reference points for the sector in each territorial area.
On the other hand, Lazio shows that its vocation is to host maturecompanies with a predominant interest in production andsales, as confirmed by the high concentration of employees,and significant levels of turnover as also by the average EBITposted by the companies situated in the region, which is a suresign of operational maturity.
16

17Blossom Associati 2008
2008: Red biotechnologiesin Italyby Stefano Milani, Alberto Onetti, Federica Bottazzi
Blossom Associati Management Consulting
CrESIT – University of Insubria of Varese
Competitive Positioning.An overall view of the national context.
By the end of 2007, the segmentof the Italian biotechnology industryspecialised in biotech for health carecomprised 168 companies. The datapresented are based on a list certifiedby Blossom Associati and CrESIT.For further information, readers arereferred to the methodologicalappendix for the sample selectionprocedure. However, we would liketo point out that, in line with themethodologies adopted by the mostauthoritative international studies,the most rigorous criteria werefollowed in our selection procedure.Thus, we excluded pharmaceuticalcompanies that do not performin- house R&D activities onbiotechnological platforms within Italy.
Although the Italian biotechnologicalindustry is a quite recent development,some interesting information emergeson the numerical growth of companiesover time. Of the 168 companiesalmost 58% were set up or locatedin Italy in the last ten years and ofthese 70 (42% of the total) were onlyfounded in the last six years. Theparticularly intense development thatthe Red biotech sub-sector has beenexperiencing since the start of thenew millennium is also reflected inthe constant growth in its numberswithin the sector. Last year, 24new Red biotech companies wereaccredited, as they were found tocomply with the criteria used forinclusion in the biotech sector, while18 were removed from the sector, asrequired by the application of therigorous Blossom Associati-Cresitmethodology.
Alongside these recently establishedcompanies, there is a group ofpharmaceutical companies with along history and tradition: 42pharmaceutical companies that inrecent years have been directingresearch and development towardsbiotechnologies. These are nationaland multinational companies thathave been able to consolidate theirmarket positions by developing and/ormarketing traditional technologies andwhich in recent years intend todiversify their pipeline with the newproducts derived from biotechnologies.

18
Numerically, the Italian red biotech sub-sector is made up ofsmall companies. 114 of the 168 accredited companies (68%)employ fewer than 50 employees and their total annual salesare less than 10 million euros. Of the remaining companies,26 (16%) are medium-sized concerns (i.e. employing up to250 with annual sales of under 50 million euros) and 27(16%) are large companies employing over 250 with sales ofover 50 million euros.
It should also be noted that of the 168 companies, 29 aresubsidiaries (the reduction in their number with respect to2007 – minus 30 subsidiaries – is mainly due to importantacquisitions and mergers). 18 of these subsidiaries belong to the“Pharma-industry” category. In numerical terms, therefore, theindustry reveals a prevalence of Italian-owned companies.
From the analysis of the business models of the 168companies, we can classify them as belonging to one of thefollowing two segments:
> a “Born Biotech” segment that accounts for 126 companies.These are mainly small to medium-sized companies witha strong orientation to research and development within abiotechnological environment;
> “Pharma-Biotech” a macro-segment, made up of 42companies with important ties to the pharmaceutical sector.These 42 break down as follows:– 28 are “Biotech Oriented” companies, in other words,companies with a pharmaceutical derivation but whoseoperations are mainly focused upon biotech R&D activities.These companies tend to have a business model mainlyor exclusively based on strong ties with pharmaceutical firms,from which, as stated, they mainly derive. Good examplesare, first, Biosearch, created as a spin-off by the managersof the Lepetit research centre and, second, Novuspharma,a spin-off from a division of the German BoehringerMannheim Group.– 14, instead, are “Pharma Oriented” i.e., Italian or multinationalpharmaceutical companies that, in line with their own strategicplans are investing in R&D in order to extend their ownpipelines with innovative products, which, inter alia, enablethem to extend the period of patent protection.
befo
re 1
970
1971
- 19
75
1976
- 19
80
1981
- 19
85
1986
- 19
90
1991
- 19
95
1996
- 20
00
2001
- 20
07168
98
71
52
33272120
Number of Red Biotech companiesin Italy:temporal growth
Source: Blossom Associati - CrESIT 2008
2002
2003
2004
2005
2006
2007
108
2001
115
128
145152
163 168
Number of newly set up biotechcompanies: temporal growth(2001-2007)
Source: Blossom Associati - CrESIT 2008

19Blossom Associati 2008
3 Aggregate sales data proxy the economic value generated by the biotech sector.However, it should be noted that this value is necessarily over- or under-estimatedas it not possible to “map” situations that can sometimes have a major impacton the results presented. A frequent case in point is that of the spin-offs or subsidiariesof foreign companies that have marketing agreements for products of the parentcompany. In this case, the sales data refer to R&D operations conducted outside Italy.However, the same argument applies for diversified companies that occupy marketsother than biotech. For this reason, the turnover should be rectified to excludesales referring to other business. In all these cases, an analysis that takes accountof the sales data of Italian companies is structurally inclined to over-estimate the sizeof the sector. On the other hand, there may be subsidiaries of foreign companiesdedicated to R&D whose products are marketed by other companies of the group.In this case, their operating revenue will not reflect the actual value of theoperations performed in our country. Such simplifications cannot, unfortunately,be eliminated at an aggregate level analysis. Nevertheless, they counsel us to considerthe results presented with due prudence.
Small 68%
Large 16%
Medium 16%
Breakdown of Red Biotech companiesin Italy by size
Source: Blossom Associati - CrESIT 2008
Pharma 25%
Biotech 75%
Breakdown of Red Biotech companiesby category
Source: Blossom Associati - CrESIT 2008
Revenue trend and macro indicators
The overall value of biotechnological production (referring tothe sole area of health care) is estimated at E 4.6 billion, or20% of the total value of the production generated by thepharmaceutical sector, with a 12% year-on-year growth rate.
Broken down into its component parts, the value of Italianbiotechnological production derives 34% from 126 “Born Biotech”companies, and 47% from 28 pharmaceutically derivedcompanies that focus primarily on biotech (“Biotech Oriented”).The remaining 19% of biotechnological production value isproduced by 14 “Pharma Oriented” companies. The marketshare of the 32 foreign-capital companies amounts to 77%.
It would be useful to supplement the foregoing data withinformation on the financial aggregate of which the foregoingbiotech revenues form part. We have determined that total turnover(thus not singling out the biotech component) in 2006 of the168 companies surveyed amounted to over 9.8 billion euros3.
An historical analysis of sales trends shows that after areduction in biotech production values in 2005, a strong recovery(+12%) took place in 2006.The growth in production revenue was mainly attributable tothe 28 pharmaceutically derived biotechnological companies(+15%) which accounted for E 2.2 billion. This performancewas matched – in percentage terms – by the 14 pharmaceuticalcompanies (+14%) that generated E 0.9 billion in sales whilethe born biotech companies, with a +8% growth generated1.5 billion in sales revenues from biotechnological derived products.
If we analyse the companies by size we that find a strongsales increase took place in the past year as regards 54 largeand medium-sized companies (+13%), while the 112 smallsized-companies, after a 55% growth in 2005, recorded adrop-off in sales (- 14%) in 2006.

The 168 red companies have a total market capitalisation ofE 2.2 billion with R&D biotech investments for E 1.1 billionand significant growth performance with respect to thepreceding year (+11%).
The companies' net indebtedness amounts to E 1.6 billion.This is a major reduction (-30%) with respect to the precedingyear and demonstrates a significant increase in their net worth(+79%), mainly through important capitalisation operations;mainly more capital injections. And, in fact, the most commonform of financing, for all companies, is constituted by majorcapital contributions from shareholders. In 28% of the cases,banks intervened in the operations to provide an additionalguarantee for the success of the operations, but almost exclusivelyon behalf of medium-sized and large companies.
A central role is played by programmes co-financed by thepublic sector (mainly functioning as seed and pre-seed money,otherwise virtually absent from the national financial market)which – through mostly national and regional financialschemes – intervened in 61% of the operations and mainly tosupport small companies, which are normally more exposed toenterprise risk. Local programmes, on the other hand, offeredonly marginal assistance. Venture capital, mainly originatingoutside Italy, accounted for 19.5% of the capitalisation operationsof accredited companies, which is an index of the dynamism inthe sector and the interest it arouses. The contribution fromBusiness Angels was practically nil as they are virtually absentfrom the sector. Our analysis has shown only one case of theirhaving operated in Italy. It should be emphasised that the limitedimpact of this type of operation reflects the virtual absence ofsuch operators from the Italian market.
An assessment of the companies’ 2006 operating marginsshows an operating income (EBITDA) of E 768 million, of which142 million accounted for by biotech companies, with theremaining E 626 million generated by Pharma companies.Furthermore, after a breakdown by size, the analysis uncoversa strong diversification in relation to the maturity and sustainabilityof the business of biotech companies. Thus if, on the one hand,the overall level of operating income would seem to indicatethat the sector has grown beyond the first development stage,on the other, we must distinguish three different “moving spirits”that ideally comprise the totality of the accredited biotechcompanies covered by this analysis, if we are to comprehend thenature of the growth.
20

Medie 50%
Piccole 14%
Grandi 36%
Breakdown of R&D investmentsRed Biotech by size
Source: Blossom Associati - CrESIT 2008
An EBIT analysis (i.e. net of the depreciation charges on investments)yields an overall figure of over E 338 million for the 168 accreditedbiotech companies, which break down as follows:
> 114 small companies that against overall investments ofE 158 million posted a negative EBIT in 2006 of E 69 million;
> 26 medium-sized companies that against E 578 millionin overall investments posted an EBIT of slightly overE 12.5 million;
> 28 large companies that against overall biotech investmentsof just over E 403 million posted an EBIT in excess ofE 395 million.
The performance of the 29 subsidiaries of foreign companiesis significant. These invested slightly less than E 250 millionin biotech technology (22% of total national investment)and posted an EBIT of almost E 250 million.
In making international comparisons we must always bear inmind that the real potential of the Italian pharmaceutical market(which is one of the main drivers for the future development ofthe biotech market) puts Italy in the fifth position among worldmarkets with total pharmaceutical sales (pharmacies + hospitals),at ex works prices, of E 16.5 billion (2006 data: Source IMS).The global value of the pharmaceutical market (expressedin Euro at ex-works prices) confirms that Italy is the third largestmarket in Europe, after Germany and France and the fifth inthe world, with the USA and Japan occupying the first two places(Source IMS).
Biotech investments in R&D
The overall size of R&D investments in biotechnological technologiesand processes in 2006 in Italy was estimated at 1.149 millioneuros (an 11% year-on-year growth rate). The size of suchinvestment confirms that significant R&D activities are takingplace in Italy directed at both the development of authenticallyoriginal products (research conducted in Italy, but largely underthe auspices of foreign multinationals) and the development ofproducts able to improve the clinical effectiveness of knownmolecules by the development of innovative release applicationsand/or systems. As stated in the methodological notes, theforegoing data concerning the size of biotech investments aresolely based on the values of R&D investments in technology andprocesses referring to biotechnological type platforms carried outby the 168 accredited companies that meet the selection criteriaof Blossom Associati-CrESIT.
21Blossom Associati 2008

However, to supplement the foregoing figures it would beuseful to provide data on the overall volumes of investments inR&D (and thus not just limited to biotech activities). In 2006,the 168 accredited red biotech companies made investmentsfor over 2,160 million euros in R&D. These data directlyeflect the value of investments made by the 14 companiesclassified as pharmaceutical, which mainly make investmentsin innovative technologies and products (53% of the overallvalue of the investments).
Of the E 1,149 million in total investments in biotech technologiesand processes, E 413 million (with a 14% year-on-yeargrowth rate) were accounted for by large companies, while 578million (with a 7% year-on-year growth rate) were made bymedium-sized companies. Small companies made overallinvestments for 158 million (representing a 16% year-on-yeargrowth rate).
Moreover, extremely interesting considerations emerge fromthe analysis of the origin of the investments. Thus of theE 1,149 million in total investments, 555 million (with a 31%year-on-year growth rate) were accounted for by biotech derivedcompanies, while 517 million stemmed from biotech companieswith a pharmaceutical derivation. In conclusion, traditionalpharmaceutical companies tended to limit their internal investmentsand only accounted for a modest 67 million (representing a22% year-on-year decrease). In general, instead of internaldevelopment such companies prefer a risk diversification strategyaimed at the setting up of Newco Biotechs which they canendow with capital, licensing contracts and expertise.Of such investments, the 29 branches of multinationals accountedfor 250 million (22%).
Biotech products under development in Italy *by Assobiotec
Research & Development taking place in Italy has given rise toan extremely interesting pipeline.The principal area of activity, in which 74% of the Italian biotechcompanies operate, is pharmaceuticals.Thus, in Italy there are, overall, no less than 147 biotechnologicalproducts under development, the results of research being carriedout by 35 companies. Of these 147 products, 63 are in thepreclinical development phase while 84 are already in the clinicalphase (Phases I-II-III). In particular, of the 84-biotech productsundergoing clinical development, 33 are in Phase I, 35 in PhaseII, and 16 in Phase III.Italian biotech research, furthermore, can boast 63 productsat a pre-clinical developmental phase and 99 molecules at adiscovery phase, which altogether constitute a promising foundationfor the sector in the coming years.
If we consider all R&D activities (therefore also including moleculesin the discovery phase), the analysis shows a strong orientationof overall investments towards the area of oncological therapy(33%), the central nervous system (15%) and the areas ofdermatology (3%) and antimicrobials for systemic use (3%).Moreover, these data are even more significant if we take accountof the fact that the activities performed by R&D centres of themultinationals operating in our country have not been considered.
Spin off pharma 45%
Pharma 7%
Biotech 48%
Breakdown of R&D investmentsRed Biotech by class of company
Source: Blossom Associati - CrESIT 2008
Discovery 40%
Preclinic 26%
Phase I 13%
Phase II 14%
Phase III 7%
Table 1 - Pipeline referring to the R&Dactivities conducted in Italy (2008)
Fonte: Blossom Associati - Assobiotec 2008
22
Discovery 99Preclinic 63Phase I 33Phase II 35Phase III 16
Chart 1 - Pipeline referring to the R&Dactivities conducted in Italy (2008)
Source: Blossom Associati - Assobiotec 2008
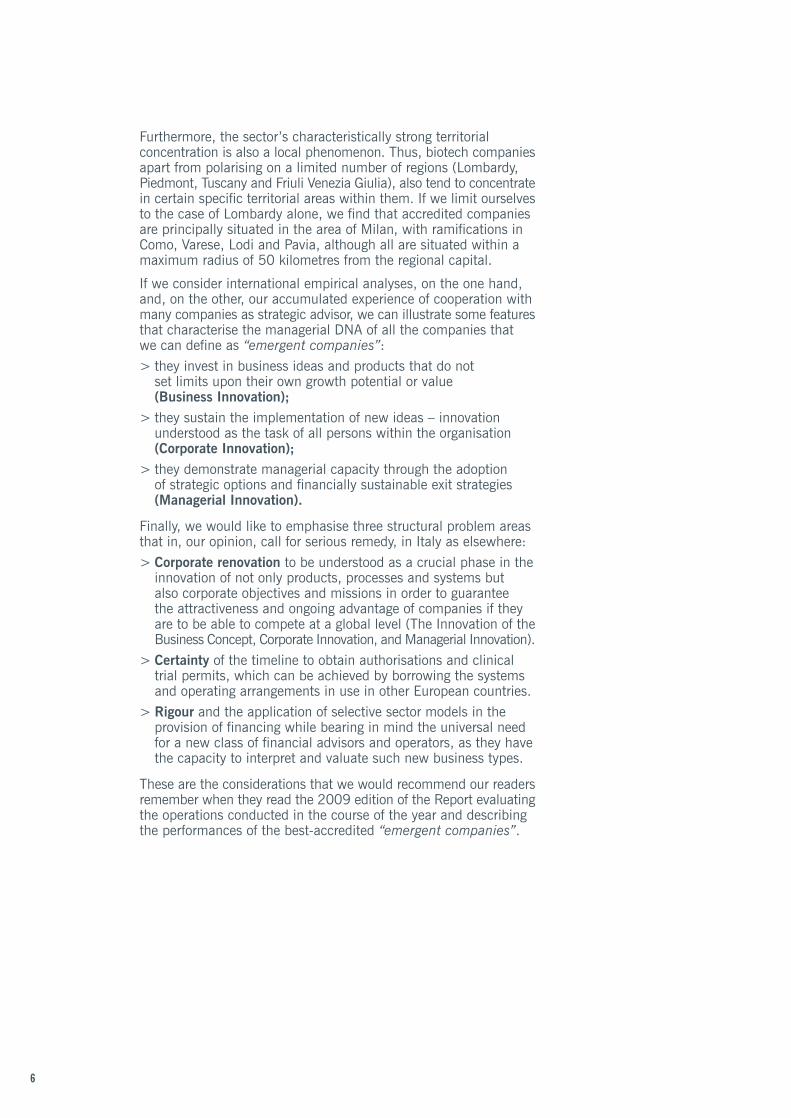
The foregoing data reflect the undeniable maturityof the Italian biotechnological sector, which inrecent years has shown a major improvement in itscapacity to produce value.A further important element refers to the increase inthe capacity of Italian research to invest in projectdevelopment activities. The number of productsunder development has practically tripled in onlytwo years, passing from 30 in March 2006 to 84 inMarch 2008 (a 280% growth rate).
As regards the classification of the products underdevelopment, 14 therapeutic areas were identified,and among these the following are conspicuous fortheir critical mass: antineoplastics and immunemodulators (accounting for 42% of the products),the central nervous system (10% of the products)and the gastrointestinal and cardiovascular areas(both 8% of the products).
On the other hand, if we consider the products“under discovery”, the greater part of these referto the areas of antineoplastics/immune modulators(23%) and the central nervous system (20%) while,in third position, we find the area of antimicrobialsfor systemic use (14%).
The biotech products under development refer tomore than one therapeutic area. Consequently, thetotal set forth in table 3 does not refer to the numberof products indicated in table 1.
Among the technologies most frequently found inthe biotech sector, there is a strong predominanceof the use of recombinant protein (16%), monoclonalantibodies (14%) and peptides (9%).However, a good 51% of the technologies utiliseddo not belong to any of the foregoing categories(i.e. other): a large part of these productsconcerns “small molecules”, clearly developedthrough biotechnological technologies.
Of the 84 products under development, 8 have beengiven “orphan drug designation” (3 by EMEA and5 by both EMEA and the FDA). These are mainlyproducts for use in the field of oncology. The remainingproducts are for cardiovascular use.
Discovery Preclinical Phase I Phase II Phase IIIGastrointestinal and metabolism 5 6 2 3 3Blood and haematopoietic organ 1 0 1 2 3Cardiovascular 6 5 3 2 3Dermatological 11 8 1 3 0Genit-urinary and sexual hormones 0 1 1 1 0Hormones (excluding sexual hormones) 8 0 2 0 0Antimicrobials for systemic use 17 3 0 0 1Antineoplastic and immune modulators 28 32 19 15 4Skeletal muscle 6 3 1 0 1Central nervous system 25 6 5 3 2Antiparasitics 2 0 0 0 0Respiratory 2 0 0 3 0Sense organs 2 2 1 0 0Other 11 4 2 7 3
Some products could be appliedto different therapeutic fields.
Table 3 - Biotechnological R&D conducted in Italy (2008):analysis by therapeutic area by development phase
Source: Blossom Associati - Assobiotec 2008
Antineoplastic andimmune modulators 32%
Central nervous system 15%
Dermatological 8%
Antimicrobialsfor systemic use 8%
Cardiovascular 6%
Gastrointestinal and metabolism 6%
Skeletal muscle 4%
Hormones (excludingsexual hormones) 3%
Respiratory 2%
Blood and haematopoietic organ 3%
Sense organs 2%Antiparasitics 1%
Genit-urinary and sexual hormones 1%Other 9%
Chart 2 - Biotechnological R&D conducted in Italy (2008): analysis by therapeutic area
23Blossom Associati 2008
Source: Blossom Associati - Assobiotec 2008

Human resources and employment.An overview of the national context
The overall number of employees performing R&Dactivities is 6,233 (25% of all employees surveyedin the framework of biotech companies)*.
However, we can break this figure down stillfurther into two sub-categories based on themethodological approach indicated in this Report.
> 50% (equivalent to 3,133 employees to R&Doperations) is accounted for by 126 companiesthat can be described as authentically
biotechnological.
> The remaining 50% (equivalent to 3,100employees) refers to 42 pharmaceutical companiesor spin offs from pharmaceutical companies.
A more in-depth analysis reveals that 58% of thetotal number of R&D employees is employed by largecompanies, 29% by medium-sized companies and13% by small companies. These figures illustratethe enormous importance played by medium-sizedand small enterprises in the employment of researchpersonnel. If the large companies generally assign16% of their personnel to R&D, the medium-sizedand small companies appear much more focused,declaring 66% of all employees engaged on R&D work.
The data used (number of employees disclosedby the companies through either qualitative analysisor the analysis of the notes to the financial statements)nevertheless tend to underestimate the size of theindustry. Thus, it can be presumed that the industryincludes, especially in the case of smaller companies,a significant number of self-employed professionalworkers and other freelancers.
Competitive regional positioningTerritorial distribution
For many years, the Blossom Associati-Cresitmethodology has been pursuing the objective ofdefining a unique and objective approach fordetermining the comparative importance ofbiotechnologies as between the Italian regions.With respect to 2005, the biotech companiesperforming R&D operations within Italy display ahigh level of geographical clustering.
Monoclonal Recomb. Cell Gene Fermen-Anti Protein Pept. Therapy Therapy Vacc. tation Other
Discovery 5% 6% 5% 2% 1% 1% 0% 22%Preclinic 3% 4% 1% 2% 0% 0% 1% 14%Phase 1 3% 2% 0% 1% 0% 0% 0% 6%Phase 2 2% 3% 2% 1% 0% 0% 0% 7%Phase 3 1% 1% 1% 1% 0% 0% 0% 2%
Table 5 - Biotechnological R&D conducted in Italy (2008):analysis of biotechnological technologies by development phase
Source: Blossom Associati - Assobiotec 2008
Other 51%
RecombinantProtein 16%
MonoclonalAnti 14%
Peptides 9%
Cell Therapy 7%
Gene Therapy 1%Fermentation 1%
Vaccines 1%
Chart 4 - Biotechnological R&D conducted in Italy (2008):analysis of biotechnological technologies
24
Fonte: Blossom Associati - Assobiotec 2008
* The overall number of R&D employees in Italy in the lifesciences amounts to 9,383 of whom 3,133 accountedfor by biotech companies, 3,100 by pharmaceutical companiesthat invest in biotechnologies and a further 3,150 bytraditional pharmaceutical companies.

Although almost all the regions (14) of our country host companiesfrom this sector, at present only a few have attracted economicallyand numerically significant concentrations of companies.These are: Lombardy, where 64 companies are situated (38%of the total), Piedmont with 17 companies (10% of the total),Tuscany with 17 (10% of the total), Piedmont with 17(10% of the total), Lazio with 11 (8% of the total) and FriuliVenezia Giulia with 11 (7% of the total) followed by EmiliaRomagna with 10 and Sardinia with 10. These seven regionsaccount for 85% of the Italian biotechnological companies.
The analysis of the 168 companies shows that the foregoingconsiderations also apply to employment data, even thoughtheir actual national ranking may differ slightly. The overall numberof employees performing R&D activities at a national level,and employed by the accredited companies, is 6,233.
Lombardy certainly detains a leading position. 11,294 employeeswork in the region, of whom 3,398 engaged in R&D (45%of the national total and 55% of all employees in the industryengaged on R&D, on a national basis).
In terms of total employees and R&D employees Lazio emergesas the second most important region, with a strong Big Pharmapresence and important pharmaceutically derived biotechoriented companies employing 7,714 employees of whom1,065 dedicated to R&D activities. The other regions with astrong innovative propensity are Piedmont, with 4% of totalemployees in R&D Emilia Romagna with 9% of total employeesin R&D and Tuscany with 10%.
Geographical distribution Red Biotech
Region # Companies # Overall # R&D Biotechemployees employees turnover
Campania 6 70 56 5,179,505Emilia Romagna 10 2,487 571 173,982,633Friuli Venezia Giulia 11 105 85 20,220,158Lazio 14 7,714 1,065 1,685,221,761Lombardy 64 11,294 3,398 2,251,047,836Piedmont 17 304 252 121,859,191Sardinia 10 74 63 662,763Tuscany 17 3,045 614 308,787,222Veneto 7 122 87 12,501,057Other 12 88 42 3,187,616Overall total 168 25,303 6,233 4,582,649,741
Source: Blossom Associati – CrESIT 2008
25Blossom Associati 2008

The strong territorial concentration of the sector, which weunderlined earlier, now appears even more pronounced.The first seven regions, where 85% of Italian biotechnologicalcompanies are situated, employ over 97% of the total employeesdedicated to R&D operations.
The analysis of the distribution of turnover by regiondemonstrates the territorial polarisation mentioned previously.Two regions (Lombardy and Lazio), while demonstrating profoundlydifferent orientations and morphological characteristics inrespect of company structure, alone account for 86% of nationalsales of biotechnological products for health care with growthrates of, respectively, 16% for Lombardy and 9% for Lazio.
If we turn our attention to the other regions, we can identifyan important contribution from Tuscany (which accountsfor 7% of biotech sales with a 3% year-on-year growth rate)followed by Emilia Romagna (4% with a 9% year-on-year growthrate) and Piedmont (3% and substantially stable with respectto the preceding year).
The analysis of biotech investments in R&D reveals a partiallydifferent picture, which tends to correspond to the map ofthe distribution of the companies. In this case, the followingaspects emerge:
> Lombardy plays a predominant role, accounting for 73%of all investments carried out in Italy in biotechnological R&Dand biotech processes for health care;
> With 9% of all investments Emilia Romagna's new and importantrole in the Italian panorama is confirmed;
> Lazio at 7% confirms its position in the national panorama,while also characterised by a strong propensity on the partof companies to localise headquarters and marketing officesin the region, as well as important production facilities.
> At 3% of all overall national investments in Tuscany plays aless important role in the Italian scenario;
> On the other hand, the contribution made by Piedmont (4%),as also that of Friuli Venezia Giulia and Veneto (3%) is important.
26

Helping companies improvetheir financial results
The art ofbusinessinnovationis differentfor everycountry
blossomassociati.com

The art ofmanagementinnovationis differentfor everyindustry
Helping companies improvetheir financial results
blossomassociati.com

Structure, characteristics and developmental dynamicsof biotech companies in Italyby Alberto Onetti, Stefano Milani, Alessia Pisoni and Marco TalaiaCrESIT - University of Insubria of VareseBlossom Associati - Management Consulting
The 2008 Report contains an important novelty.By processing the data collected for the preparationof the reports in past years, we are now ableto trace out the sector's historical developmentaltrend. We have dedicated special attention tothe growth of the sector in the three-yearperiod 2003-2006 by making reference toturnover growth rates and new entrants/leavers(following the start-up of new companies orthe winding up of existing ones).
In addition, thanks to the qualitative informationcollected through questionnaires we were ableto indicate the “sentiments”, i.e. the evaluationsof biotech companies concerning the developmentprospects of the sector in the immediate future.
Information on the trends and developmentaldynamics of the sector was subsequentlysupplemented by a qualitative analysis designedto highlight the specific features of the biotechcompanies comprising the reference populationat the end of 2007. The sector is made up ofdifferent “moving spirits” in terms of not only sizeand strategic positioning, but also corporategovernance and relationships with institutionalactors; a sector in which small, medium-sizedand large companies are all active. Thesecompanies include the subsidiaries ofmultinationals as well as start-ups and spin-offs,with either academic or corporate origins.
Some companies are located in science andtechnological parks. For these reasons, wehave chosen to provide detailed studies designedto fathom the characteristics of these differentcategories of company and the differentcorporate structures and performance capacitiesthat connote them.
The developmental trends of the biotech sectorin Italy
In this section, we would like to make someconsiderations regarding the developmentaldynamics of the turnover exhibited by biotechcompanies in the period 2003 -2006.Therefore, we have reconstructed the historicaldevelopmental trends of the turnover of thecompanies in our sector from two temporal,but complementary, standpoints:
> the medium-term, represented by averageturnover growth rate in the three-year period2003-2006;
> a more recent standpoint, focusing uponvariations in turnover in the last year of ourhistorical data series (2006).
Figure 1 - Developmental growth matrix
Source: Blossom Associati - CrESIT 2008
29Blossom Associati 2008
Ave
rage
turn
over
gro
wth
rat
e in
the
thre
e-ye
ar p
erio
d 20
03-2
006
Variations in turnover in the last year of our historical data series (2006)
Average
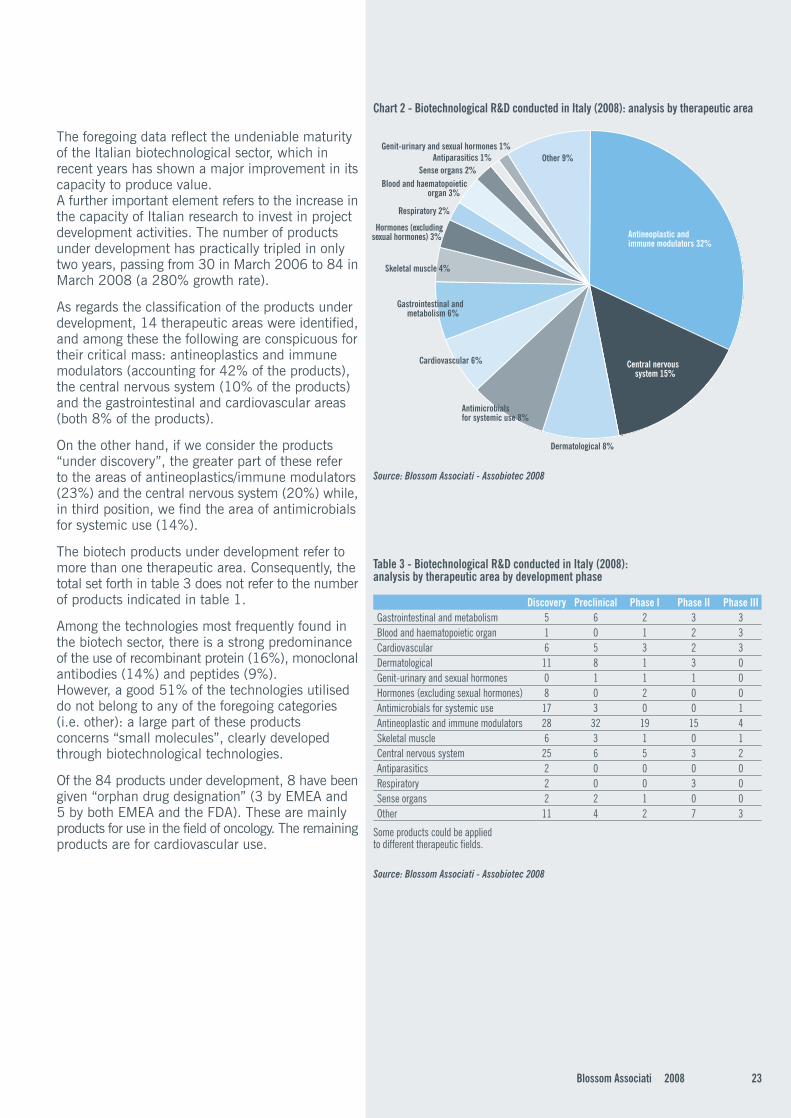
Based on the cross-classification of the foregoingdata it was possible to construct a matrix(see Figure 1) and thus represent the developmentalpattern of biotech companies for the period inquestion. Each company is identified in the matrixby a dot that represents its annual averagegrowth in the three-year period and in the lastfiscal year considered. Hereinafter we proposethe principal keys with which to read the matrixof the development dynamics of the biotech sector.
> The companies in the top right quadrant ofthe matrix (quadrant A) were those that grewin the period in question and whose growthpropensity was confirmed in the last yearexamined. These are companies that exhibitstable and lasting signs of development andwhich can reasonably be seen as constitutingthe backbone of the biotech sector.
> The companies in the bottom right quadrant(quadrant B) despite exhibiting a positiveaverage growth in the three-year period inquestion, recorded a sales slowdown in thelast year (2006). For such companies ourevaluation, albeit positive, remains suspended.In other words, we must understand if 2006’sslowdown is to be attributed to externaleconomic circumstances and therefore likelyto be reversed or if it represents the signalof a possible company crisis.
> The companies situated in the top left-handquadrant (quadrant D) are companies thatdespite having undergone a negative trendin the three-year period were able to recoverin the last year under examination.Consequently, also for them our judgementremains suspended. It must be determinedif the growth exhibited constitutes a structuralinversion in the sales trend or simply atemporary phenomenon.
> The companies situated in the bottom rightquadrant (quadrant C), on the other hand,are companies undergoing structural decline.They exhibited a decline in sales in both thethreeyear period and in the last year studied.It is not unrealistic to expect that all thesecompanies will disappear from the sector inthe near future.
However, these evaluations must take accountof the positioning of the dots within the singlequadrants.
> For companies situated near to the origin ofthe axes the foregoing trends are clearly lesspronounced. Consequently, the evaluationof a company in quadrant A, situated closeto the axes although positive must obviouslybe qualified. Similarly, for those companiesin quadrant C and D, the negative evaluationsexpressed need to be qualified in the eventthat the dots are situated near to the axisof the abscissas.
> The further from the axes the more markedthe situations of growth or decline become.In such cases, evaluations are more definitivein either a positive or a negative sense.
In order to give objective references to theevaluations we have also indicated averagesector values within the matrix in figure 1(represented by broken lines). Thus, the biotechcompanies exhibited a 10.4% average annualgrowth three-year period 2003-2006, while in2006 (the latest year with an available data)they recorded an annual growth of 24.2%.Such values should be regarded as proxies;a help to the analyst in his or her evaluationsof the performance of individual companies.
> Companies situated to the right and abovethe broken lines are companies, which can bedefined as over-performers, insofar as theiraverage growth is greater than the sectoraverage with reference to both the three-yearperiod and the latest year examined.
> On the other hand, companies to the left ofor below the broken lines are, instead,underperformers. They exhibit more pronouncedreductions than the average of the companiesin the sector.
> Companies situated near to the point wherethe two broken lines intersect can be definedas neutral as their performance is in linewith the sector average.
> Clearly, as already stated above, our judgementstend to become more emphatic the furtherthe dots stray from the broken lines expressingaverage values.
30

Figure 2 - Turnover growth trend in the three-year period 2003-2006
Source: Blossom Associati - CrESIT 2008
Before discussing the specific data on the sectorand attempting to formulate evaluations upon them,some preliminary considerations are necessary.
> The analysis conducted is handicapped bybeing based upon turnover and not uponinvestments and pipelines. The peculiarityof companies that belong to this sector is thatthey carry out considerable investments inthe initial phases of activities or study/trialson new products. Such investments can rarelyhave an immediate return in terms of sales.Therefore, an analysis based essentially onturnover growth may underestimate andincorrectly map the real development dynamicsof a sector characterised by a high rate ofinvestment, a relatively limited historyand a pipeline whose potential has beenindicated earlier.
> We have excluded start-ups from our analysis.This decision was taken for two main reasons.In the first place, the turnover of recently setup companies tends to be a variable of limitedimportance, especially in sectors such asbiotech where the introductory phase can beextremely long. Secondly, it is normal forcompanies in an early stage of development tohave extremely volatile results, and this clearlymakes them unsuitable for an analysis basedupon variations in turnover. Given that thesecompanies are extremely important if we areto understand the development prospects ofthe sector, we have dedicated a sector entry/exitanalysis to them in the following paragraph.
In figure 2, we have mapped all the companiesincluded in the sector onto a matrix. The dataprovide some extremely interesting indicationsfor helping us to outline and understand thedevelopmental dynamics of the Italian biotech sector.
> In the first place, the analysis of the matrixshows a large spread of companies amongthe four quadrants. This finding clearlyexpresses the strong volatility that typifiesemerging sectors with high rates of innovationand investment.
> Most of the biotech companies are foundclustered around the sector average, thereforewithin or next to the central rectangle formedby the intersection between the origin of theaxes and the two broken lines that interceptthe axes at the sector's average value points.These companies can be defined as “stayers”,whose developmental dynamics are in linewith sector averages.
> Then there are companies which overperformwith respect to sector averages. These aresituated in quadrant A, above and to the rightof the broken lines. Such companies, whichcan be defined as “rumping up”, haveabove-average growth trends. Within this groupthere is a subgroup corresponding to theconcentration of dots in the extreme right angleof the matrix. These are small companieswhose development cycle began quite recentlyand which, consequently, have only recentlybegun to record sales revenue. Therefore, theapparently extraordinary growth trend thatdistinguishes them can be explained by theabsence or limited nature of precedingresults. Nevertheless, it is an interesting groupof companies that having overcome the“pre-revenue” phase and from whose midstmay be found the sector's short or mediumterm protagonists.
31Blossom Associati 2008
Ave
rage
turn
over
gro
wth
rat
e in
the
thre
e-ye
ar p
erio
d 20
03-2
006
Variations in turnover in the last year of our historical data series (2006)
Average

> There are a small number of companies inquadrant B, that experienced a positive growthtrend in the three-year period but whichencountered difficulties in 2006.We have defined these companies as“slowing down” in order to report their currentslow down. A qualitative analysis can helpus understand if the fall back experiencedrepresents a temporary phase linked to theeconomic cycle or if, on the other hand,it represents the onset of a structural crisis.
> Quadrant C accommodates companies witha negative growth trend in both the three yearperiod and in 2006. Here we must distinguishbetween companies represented by dots nearto the axes and those indicated by dots inthe bottom left-hand angle. The former witha limited sales downturn may still be ableto recover. The second (referred to as“tumbling down”), which are characterisedby significant sales downturns, will, in ouropinion, be unable to remain within the sector.
> The fourth quadrant contains the “improving”companies, i.e. companies that recorded anegative sales growth in the three-year periodbut a positive sales growth in 2006. Thispositive growth could prelude a recovery andtheir subsequent shift towards quadrant A.
Sector entry and exit dynamics:new entrants and leavers
In this section, the analysis of sector dynamicswill be supplemented by a study on the numericalvariation that took place in the population ofbiotech companies over the last three years.The analysis considers not only new entrants(newly set up companies, spin-offs originatingfrom the diversification processes of chemicalor pharmaceutical companies, etc.) but also ofleavers (companies wound up or currentlybeing wound up).
There were 27 new entrants in the last threeyears and 9 leavers. As regards the former,most of these (21 out of 27) belong to the reddivision and are mainly based in northern Italy.The regions that recorded the highest numberof new entrants were as follows: Piedmont (12companies), Lombardy (5) and Sardinia (4).In addition, of these 27 companies, 16 were setup in scientific parks. 8 in the CanaveseBioindustry Park in Piedmont, and 4 in thePolaris scientific park in Sardinia. The dataseem to confirm that parks or incubators actas a stimulus for the setting up of companies.By making available laboratories and equipmentto newly-constituted companies, theparks/incubators can limit start-up costs andtherefore facilitate new entrepreneurial initiativesto take root. As regards the new entrants,it can be noted that 10 are spin-offs: 9 ofthem had an academic origin and 1 was acorporate spin off (a pharmaceutical company).The 9 academic spin-offs are concentratedin the north but the universities from which theyoriginated are more widely dispersed.
For the period in question, the leavers amountedto nine: 6 were in liquidation, 2 had only recentlybegun bankruptcy proceedings and 1 wasdiscovered to have already been wound up.These companies were mainly based in the north:(7 out of 9). 8 belonged to the red divisionand 1 was a bioinformatics company. The averagelife of these companies (calculated as theaverage of the difference between the yearof bankruptcy or liquidation and the year ofconstitution) amounted to 5/6 years.Considering their brief life cycle, it is quitelikely that they were start-ups that were unableto survive the initial business phase, which,as is known, requires considerable capitalinvestments and can rarely generate enough cashflow to cover the operating costs.
32

Developmental prospects of the sector:the analysis of sentiments
We can supplement the findings of the quantitativeanalysis on sector dynamics with a survey ofevaluations and sentiments, i.e. the prospectsthat the companies themselves express inquestionnaires returned to us on future salestrends. This is a very important qualitative analysisas it enables us to supplement the results of theforegoing historical analysis with an account ofthe prospective dynamics of the sector.
Our analysis shows that only a small percentageof these companies (8%) forecast a decline insales in the immediate future. Most companies(51%) expect sales to grow while another37% believes that they will remain stable.It can therefore be concluded that over onehalf of the companies are destined to shift tothe superior quadrants (A and D) of the matrix,assuming that they have not already done so.It is similarly likely that over one third of theremaining companies-those companies thatexpected their sales to remain stable-will situatethemselves near to the axis of the abscissas,while the 8% that expected their sales to declinewill fall into the lower quadrants (B and C).
In addition, the analysis of disaggregated data(set forth in table 1) reveals that companiesforecasting an increase in sales are mainly smallor large companies. Most of the medium-sizedcompanies forecast, on the other hand, stablesales even if none of the companies of this sizeexpect their sales to decline. The disproportionatepresence of large companies among thosecompanies expressing optimistic evaluations is astrong signal because it underscores the sector’sgrowth expectations. On account of their size,these companies are in fact those that tend tocharacterise the developmental trend of the sector.The high variance in the results recorded bysmall companies is in line with the great volatilityin performance that generally characterisesenterprises of this size.
Table 1 - The sentiments of biotech companies in Italy by size(percentage data from the sample)
By focusing on red companies (see table 2), we can see that thecompanies with the highest growth expectations belong to Big Pharma.This data can be explained by the fact that this category includespharmaceutical companies with structured activities and a highlydiversified product mix.
Source: Blossom Associati – CrESIT 2008
DIMINUTION STABLE GROWTH N.A. TOTALSmall 10% 32% 52% 6% 100%Medium 0% 70% 30% 0% 100%Large 6% 31% 63% 0% 100%Total 8% 37% 51% 4% 100%
Table 2. The sentiments of red companies in Italy (percentage data from the sample)
Source: Blossom Associati – CrESIT 2008
DIMINUTION STABLE GROWTH N.A. TOTALBiotech Pure 6% 43% 49% 3% 100%Pharma Biotech(Biotech Oriented) 6% 35% 53% 6% 100%Big Pharma 11% 11% 78% 0% 100%
33Blossom Associati 2008

The size profile of biotech companies
The Italian biotech industry is characterised by a significantnumerical presence of small companies. They account for75% of the certified companies (170 out of 228 and aredefined by having sales of less than E 1 million and fewerthan 50 employees. Medium-sized companies account for about12% of the sample (28 out of 228). These companies employfewer than 250 and have a turnover of less than E 50 million.The large companies (over 250 employees and with a turnover inexcess of E 2 million) number 30 and constitute 13% of the sector.
On the other hand, the subsidiaries of foreign companies inItaly number 34, of which 47% are large companies, 27%medium-sized companies and the remaining 26% small concerns.
In terms of the analysis of the distribution of turnover by companysize, it can be noted that over 85% of overall biotech sales in2006 were accounted for by 30 large companies. This groupalso employs 80% of the workers recorded for the industry.Medium-sized companies account for 11% of biotech turnoverand 11% of all employees, while small companies generate nomore than 3% of sales and employ only 6% of all workers.Nevertheless, we should remember that these categories includethe subsidiaries of multinationals operating in Italy, whichalone account for 80% of total biotech sales and 50% of allemployees in the industry.
The clear numerical predominance of small companies callsfor further analysis. The category includes start-ups as well asacademic and corporate spin-offs. The latter two categoriesrepresent almost 55% of the small companies. On average,recently set up companies have sales of around E 500,000compared to the E 1 million invoiced on average by smallcompanies. As regards employee data, start-ups seem to employalmost twice as many workers as the small companies.However, in this respect it is necessary to make a methodologicalobservation. These figures are artificially high due to therebeing pharmaceutical spin-offs within the start-up categorythat employ a much higher number of workers than the average(around 5/6 employees for company).
START UP SMALL MEDIUM SUBSIDIARIES LARGEBiotech sales(mln euros) 0.51 0.97 18.1 112.5 137.8Employees 17 10 106 388 718Years <5 5<y<20 10<y<50 2<y<100 5<y<100
Table 3 - Biotech companies in Italy: average values by company type (2007).
Source: Blossom Associati – CrESIT 2008
34

Moreover, the analysis reveals that medium-sized companiespost sales that are 18 times greater than those of small companies,and that each, on average, employs 20 workers. Regardingthe operational maturity of the medium-sized companies, theage range of such companies, on average, is 10 to 50 years(80% of the small companies have an average age of 12 years).
On average, large companies post sales of 140 million euros,have 40 years of business life (although there are companiesin our list of over 100 years) and employ over 700 employees.It should also be mentioned that the large companies employingthe largest share of the workforce are Big Pharma companies.Over 50% of all employees employed by large companies workfor pharmaceutical corporations.
The size profile of red biotech companies
Table 4 outlines the average profiles of the 168 red companiescomprising this sub-sector. As discussed in the introduction, wecategorised companies according to the business model adopted.We identified 126 pure biotech companies and 42 Pharma biotechcompanies (of which 28 biotech oriented and 14 Big Pharma).The average data set forth in the table 4 indicate that averageturnover and the average number of employees differ considerablyaccording to the business model characterising the companiesbelonging to the red sub sector.
In terms of average turnover, the data are much more variablethan those examined on overall turnover.Pure biotech companies are, in general, recently constitutedsmall to medium-sized companies4 (with a high start-up quota).On average, they employ fewer than 50 workers and generatesales of between 10 and 20 million. They are almost exclusivelyfocused on biotech (which accounts on average for 80%of their turnover).
Instead, the profile changes considerably when we considerPharma Biotech companies, depending on whether they arebiotech-oriented or belong to the Big Pharma segment.As regards the former type, they have been on the market from5/15 years and are generally medium to large-sized companies.They employ 250/300 workers and generate over 100 millionin sales with a very clear focus on biotech (which on averageaccounts for 70% of sales revenue).
170;75%
28;12%
30;13%
LargeMediumSmall
Figure 3 - Biotech companies in Italy:company size (2008).
Source: Blossom Associati - CrESIT 2008
LargeMediumSmall
Figure 4 - The subsidiaries of biotechmultinationals in Italy: company size (2008).
Source: Blossom Associati - CrESIT 2008
16;47%
9;27%
9;26%
LargeMediumSmall
Figure 5 - Biotech companies in Italy:breakdown of biotech turnover bycompany type (2006) (financial data in E m)
Source: Blossom Associati - CrESIT 2008
4.134;86 %
508;11 %
164;3 %
35Blossom Associati 2008
4 This finding is in line with the fact that of the 126 pure biotech companies no fewerthan 102 are small companies.

Pharma Biotech, on the other hand, refers to large pharmaceuticalconglomerates, often part of multinational groups, with decadesof history behind them, very large turnovers and very largeworkforces (on average over 800 employees). For such companiesbiotech is one of their business operations but not their coreactivity; On average biotech accounts for 20% of total sales.
The Subsidiaries
It should be pointed out that notwithstanding the numericalpredominance of large companies, the subsidiaries ofmultinational companies (a group comprising 34 companies)form a heterogeneous group made up of 16 large, 9 small and9 medium-sized companies. This explains (see table 3) the highaverage turnover (112 million euros) of the category, as alsothe relatively high number of employees (380 employees percompany). In addition, it is necessary to specify that nearlyall subsidiaries (no fewer than 32 of the 34 subsidiaries operatingin the Biotech sector) are red companies, in line with the profilementioned in the preceding paragraph.
Academic and corporate spin-offs
In this section, we set out to provide data on spin-offs in orderto distinguish those with an academic pedigree from those witha corporate background.Spin-offs with a university origin amount to 26, a higher numberthan that reported last year (14). This number includes5:
> academic spin-offs, which we could define as “institutional”,i.e. companies with a formal university involvement in theform of a shareholding;
> “informal” spin-offs, i.e. biotech companies set up followingthe departure of university researchers and without auniversity shareholding.
BIOTECH PURE BIOTECH ORIENTED PHARMA ORIENTEDBiotech sales(mln euros) 17.4 131.5 303.8Biotech sales(mln euros) 12.6 77.3 61.5Employees 46 282 830Years 2<y<20 5<y<20 8<y<100
Table 4 - Biotech companies in Italy: average values by company type (2007).
Source: Blossom Associati – CrESIT University Study of Insubria of Varese 2008
LargeMediumSmall
Figure 6 - Biotech companies in Italy:breakdown of all employeesby company type (2007)
Source: Blossom Associati - CrESIT 2008
83 %
6 %
11 %
Spin
off
acca
dem
ici
26
8
Spin
off
corp
orat
e
Figura 9 - Types of spin off
Source: Blossom Associati – CrESIT Universitàdegli Studi dell’Insubria di Varese 2008
5 The classification criterion used for university spin-off and adopted in earlier reportslimited itself to “institutional” type spin-offs, as the formal presence of a universityin the company's share capital was a necessary condition for such spin-offs.This was, therefore, an extremely restrictive criterion and consequently the actualimportance of this type of company in the biotech sector was underestimated.
36

Of the 26 university spin-offs, 13 are “institutional” insofar as theuniversity in which they originate detains a shareholding in theirshare capital, while the remaining 13 can be classified as “informal”as they originated with the departure of university researchers andno university has a shareholding in their share capital.
Alongside the 26 academic spin-offs, there are 8 corporatespin-offs. 5 of the latter originated from foreign ownedpharmaceutical firms and 3 from Italian biotech companies.If we focus our attention on the red sub sector, we shall findthat the greater part of the spin-offs are active in this red sector.Actually, no fewer than 7 seven corporate spin-offs out of 8and 17 academic spin-offs out of 26 are red biotech companies.
Table 5 shows that the 34 identified spin-offs are small companieswith a significant number of employees and an average turnoverof slightly more than E 1 million. However, the data also reflectthe influence of corporate spin-offs with pharmaceutical parentage.On average, these spin-offs employ a larger number of workersand post higher sales than academic spin-offs. If we ignore thepharmaceutically derived spin-offs, the morphological profilethat we can outline for spin-offs generally corresponds withcompanies that are going through the first phase of their life cycle.
SPIN-OFF START-UP SMALLBiotech sales (mln euros) 1.1 0.51 0.96Employees 30 18 9
Table 5. Spin-off characteristics: comparison between start-ups and small companies(average values in E mln.) (2006).
Source: Blossom Associati – CrESIT 2008
37Blossom Associati 2008
Biotech companies: capital structure
This paragraph deals with the findings emerging from the studyon the capital structure of Italian biotech companies.The objective is to evaluate their survival capacity in financialterms and their investment behaviour.For this purpose, we have attempted to provide evaluationson the degree of capitalisation of the companies and their levelof indebtedness so as to provide indications regarding thetypes of investment carried out. In processing the findings,we have grouped the companies by size.

The results of this analysis have been expressed graphically(see figures from 10 to 12), in order to facilitate ready comparisonsbetween the different structures.With reference to the sector as a whole, the basic elements toemerge are:
> a sound level of capitalisation, which on average reaches35% (share capital/total assets);
> high asset cover (average sector ratio is 1.2);
> a wholly sustainable level of debt given that the averagedebt/equity gearing is 0.5;
> an asset structure featuring a clear predominance of workingcapital (amounting to 70% of all assets).
Small companies are characterised by a high level of capitalisation(amounting to 57% of assets) along with a very limited debtexposure. Gearing is slightly above 0.2. As regards the compositionof the liabilities, there is a slight prevalence of current liabilities.In terms of capital investment, working capital constitutesthe main capital deployment with fixed assets constitutingless than 30% of all assets. However, this data must take accountof the problems regarding the correct recognition of intangibleassets in balance sheets (such as investments in R&D), whichare typical of companies operating in science-based sectors.
As concerns the structure of larger companies no significantdifferences are noted as between medium-sized and largecompanies. The average level of capitalisation reaches valuesof over 30% (which is significant even if lower than the percentagefound for small companies) while the level of financial exposureis also limited (gearing is 0.62 for medium-sized and 0.5 forlarge companies). Asset cover is positive (even if the values arelower than those of small companies). Their asset structureconfirms the net prevalence of working capital as already notedfor small companies.
In brief, the analysis performed shows that the sector exhibitshigh levels of capitalisation and sound gearings. This constitutesan indispensable condition for Italy's biotech growth potential.As part of a sector with a very high content of technologicalinnovation biotech companies require high levels of investmenton which return times can be very long. Consequently, sufficientlycapitalised corporate structures, with modest levels of outstandingdebt are ideal vehicles to handle any adverse market situationsand access venture capital.
30%
70%
57%
29%
14%
MLT LiabilitiesST LiabilitiesWorking capitalShareholders’ equityFixed asset
Figure 10 - Small Biotech Companies:Average capital structure (2006).
Source: Blossom Associati - CrESIT 2008
34%
66%
33%
47%
20%
Figure 11 - Median Biotech Companies:average capital structure (2006).
Source: Blossom Associati - CrESIT 2008
28%
72%
33%
37%
30%
Figure 12 - Large Biotech Companies:average capital structure (2006).
Source: Blossom Associati - CrESIT 2008
38
MLT LiabilitiesST LiabilitiesWorking capitalShareholders’ equityFixed asset
MLT LiabilitiesST LiabilitiesWorking capitalShareholders’ equityFixed asset

The capital structure of red biotech companies in Italy
In this paragraph, the capital structures of red companies areanalysed separately. As noted earlier, different business modelsare pursued and this results in different types of capital structure.In the following figures, the average capital structures are setout graphically for the various categories of company making upthe red sub-sector.
Red companies also exhibit a high level of capitalisation, varyingbetween the 37% of biotech-oriented companies to the 29%of Big Pharma. The latter has a capital structure in line with itshigher degree of operational maturity and higher average size.The gearing of Big Pharma companies, although very low,is the highest of all biotech companies (actually, it is close to 1,against 0.52 for pure biotech and 0.80 for Pharma biotechoriented). This reflects their appetite for working capital,necessary to sustain very large turnovers. The investmentprofile is also more pronounced as fixed assets exceed 30%of all capital deployment.
Sources of finance of biotech companies in Italy
In this year’s report, we decided to investigate the sources offinance used by the biotech companies. The information wasgathered from questionnaires and supplemented by an analysisof company structure documented in chamber of commerce records.
The study demonstrates that the primary source of finance remainscapital contributions from shareholders (82%), followed byco-financed public sector programmes (61%) (we shall analysein detail what categories of company benefit most from thesecontributions in the following section), bank loans (28%) andventure capital (20%) (see table 6).
The figure of 20% referring to the number of companies thatobtain venture and seed capital investments is a matter of greatinterest. It illustrates that this institution, albeit slowly, and takingdue account of the specific nature of the biotech sector, is alsotaking root in our country.
Capital contributions from shareholders 82%Programmes co-financed by the public sector 61%Banks 28%Venture Capital/Private Equity 20%Business Angels 1%
Table 6 - Sources of finance of biotech companies in Italy(percentages of all companies).
Source: Blossom Associati – CrESIT 2008
30%
70%
33%
47%
20%
Figure 13 - Pure Biotech Companies.
Source: Blossom Associati - CrESIT 2008
Figure 14 - Biotech oriented Companies.
Source: Blossom Associati - CrESIT 2008
Figure 15 - Pharma Oriented Companies.
Source: Blossom Associati - CrESIT 2008
22%
78%
38%
35%
27%
32%
68%
29%
35%
36%
MLT LiabilitiesST LiabilitiesWorking capitalShareholders’ equityFixed asset
39Blossom Associati 2008
MLT LiabilitiesST LiabilitiesWorking capitalShareholders’ equityFixed asset
MLT LiabilitiesST LiabilitiesWorking capitalShareholders’ equityFixed asset

Here we analysis the recourse to venturecapital/private equity by company size(see table 7). In response to our questionnaire,30% of small companies declared that they usethis channel to obtain financing. Most of thesecompanies were start-ups or companies set upless than 10 years ago. Furthermore, 30% ofthe companies belonging to the small companysegment that had declared a recourse to venturecapital/private equity, were also found to bespin-offs (mainly academic spin-offs).On the contrary, however, no medium-sized orlarge company declared that it had made use ofthis channel of financing.
The data confirm that the interest of institutionalinvestors is, in general, concentrated upon recentlyconstituted companies insofar as they exhibita high growth and development potential.These investors include both foreign venturecapital and Italian seed capital providers.
Table 8 - Public sector co-financing by company size(% of all companies).
PERCENTAGE NR. OF COMPANIESSmall 30% 50Medium 0% 10Large 0% 16
Table 7 - Venture capital/private equity financing by company size(% of all companies).
Source: Blossom Associati – CrESIT 2008
As regards programmes co-financed by the publicsector, we can see that this percentage variesfrom 25% for large companies to 76% for smallcompanies (see Table 8). On the one hand, thedata demonstrate the greater importance thatpublic financing has for small companies withrespect to large companies, and on the other, theinterest exhibited by public institutions for recentlyconstituted companies operating in the territory.
As concerns recourse to bank financing, it isagain interesting to break the data down bycompany size (see Table 9). The analysis showsthat the companies making most use of bankloans are large companies. This finding fitswith the fact that bank loans are a suitablevehicle to assist a company’s development(by financing investments and working capital)but are not suitable for a company’s initialdevelopmental phases.
PERCENTAGE NR. OF COMPANIESSmall 76% 50Medium 40% 10Large 25% 16
Source: Blossom Associati – CrESIT Università degli Studidell’Insubria di Varese 2008
Table 9 - Bank financing by company size (% of all companies).
PERCENTAGE NR. OF COMPANIESSmall 26% 50Medium 20% 10Large 38% 16
Source: Blossom Associati – CrESIT 2008
The data, moreover, confirmed the findings ofour earlier gearing analysis, which showed thatlarge companies had a higher gearing thanthat of smaller companies.
40
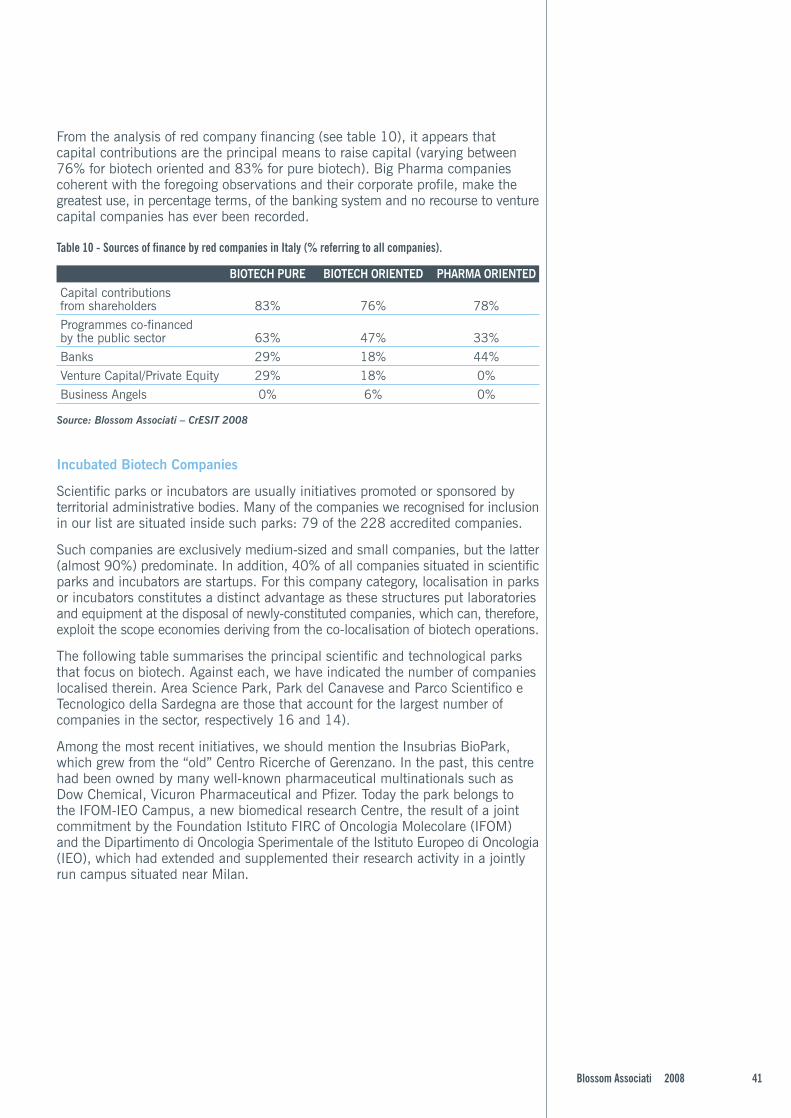
41Blossom Associati 2008
From the analysis of red company financing (see table 10), it appears thatcapital contributions are the principal means to raise capital (varying between76% for biotech oriented and 83% for pure biotech). Big Pharma companiescoherent with the foregoing observations and their corporate profile, make thegreatest use, in percentage terms, of the banking system and no recourse to venturecapital companies has ever been recorded.
BIOTECH PURE BIOTECH ORIENTED PHARMA ORIENTEDCapital contributionsfrom shareholders 83% 76% 78%Programmes co-financedby the public sector 63% 47% 33%Banks 29% 18% 44%Venture Capital/Private Equity 29% 18% 0%Business Angels 0% 6% 0%
Table 10 - Sources of finance by red companies in Italy (% referring to all companies).
Source: Blossom Associati – CrESIT 2008
Incubated Biotech Companies
Scientific parks or incubators are usually initiatives promoted or sponsored byterritorial administrative bodies. Many of the companies we recognised for inclusionin our list are situated inside such parks: 79 of the 228 accredited companies.
Such companies are exclusively medium-sized and small companies, but the latter(almost 90%) predominate. In addition, 40% of all companies situated in scientificparks and incubators are startups. For this company category, localisation in parksor incubators constitutes a distinct advantage as these structures put laboratoriesand equipment at the disposal of newly-constituted companies, which can, therefore,exploit the scope economies deriving from the co-localisation of biotech operations.
The following table summarises the principal scientific and technological parksthat focus on biotech. Against each, we have indicated the number of companieslocalised therein. Area Science Park, Park del Canavese and Parco Scientifico eTecnologico della Sardegna are those that account for the largest number ofcompanies in the sector, respectively 16 and 14).
Among the most recent initiatives, we should mention the Insubrias BioPark,which grew from the “old” Centro Ricerche of Gerenzano. In the past, this centrehad been owned by many well-known pharmaceutical multinationals such asDow Chemical, Vicuron Pharmaceutical and Pfizer. Today the park belongs tothe IFOM-IEO Campus, a new biomedical research Centre, the result of a jointcommitment by the Foundation Istituto FIRC of Oncologia Molecolare (IFOM)and the Dipartimento di Oncologia Sperimentale of the Istituto Europeo di Oncologia(IEO), which had extended and supplemented their research activity in a jointlyrun campus situated near Milan.

AIFA’s interest in biotechnological drugs covers anumber of different aspects: from the evaluation ofthe innovative nature of drugs soon after introductiononto the market to post-marketing assessments,and from incentives for corporate research to thefinancing of non-profit research.
In order to properly prepare itself for the arrivalof new drugs on the market, AIFA has prepareda guideline document for the evaluation of theinnovativeness of drugs that are ready to bemarketed. The primary purpose is to determinea drug’s “place in therapy”, i.e. the role thatcan be attributed to the new drug within theset of therapies available for the treatment ofa given condition.
Defining a place in therapy also implies drawingup a characterisation of patients able to benefitfrom the administration of the drug. It shouldbe borne in mind that even in the case of drugswhose efficacy has been clearly demonstrated,only a subgroup of patients will react in satisfactorymanner. This, therefore, poses the question ofhow best to identify such responder patients.This procedure will not only prevent (or reduce)the inevitable toxicity determined by treatingpatients who obtain no benefit from the drug butit may also avoid wasteful spending.
With this dual objective in mind, the idea of applyingthe principle of risk sharing was introduced intoItaly, and subsequently adopted internationally.The principle refers to the sharing of risk betweenpharmaceutical companies and the bodies – publicagencies or insurance companies – responsiblefor guaranteeing the reimbursement of drug costs.In short, the idea is that the price of drugsshould only be reimbursed with respect topatients that respond to treatment while thecosts of treating non-responder patients shouldbe met by the companies.
Along with the potentialities of biotechnologicaldrugs, we must also bear in mind the problemsarising from their use. In addition to the need tomake appropriate definitions of the populationsof patients who could benefit from the new therapies,there are also new implications in terms of safetyand important repercussions in terms of expenditure.
Biotechnological drugs:AIFA’s role
by Nello MartiniAIFA

43Blossom Associati 2008
The need to monitor new drugs in the phaseimmediately after their introduction onto themarket is well known, as this operation is designedto promote the appropriate use of a drug andcomplete our knowledge of any attendant risks.The monitoring forms used for oncologicaldrugs are an example of this requirement.At present 14 different forms are used andas of 2007, information had been gathered onabout 25,000 patients receiving treatment.
The analysis of the information acquired,conducted in cooperation with the Associationof oncological physicians, provides a morecomplete picture of the risks/benefits of the newoncological drugs.
Post-marketing monitoring constitutes asupplementary source of knowledge with respectto the data emerging from the analysis ofclinical research conducted in Italy. In recentyears, clinical trials in Italy have undergonea considerable overhaul from both a proceduraland contextual point of view.
Some preliminary considerations can be madebased upon the data contained in the latest annualreport on clinical drug trials, which summarisethe contents of the National Observatory on theClinical Trials of Drugs (OsSC).
The existence of such an important nationwidedatabank – whose information goes back tothe year 2000 – allows us not only to constantlymonitor the trend in clinical trials in Italy, butalso, and more importantly, to highlight theirpeculiar and inevitably critical aspects so thatwe can make the corrections necessary (at thelevel of controls and the system) in an attemptto sustain and further develop the entire sector.
After five years, during which the absolute numberof clinical trials, although exhibiting a slow butconstant growth, had inched up to about 600/year,suddenly in 2006 the number of studiesrecorded by the OsCS shot up to 730 – a 11.8%year-on-year increase that signaled a resurgencein Italian research. Moreover, the distributionof the phases of the national research hasalso undergone a substantial change. In 2001,Phase II studies only represented 27.8% of allstudies compared to 61.4% for Phase III studies.The data indicated that while Italy was “involved”in the development process of new moleculessuch involvement only referred to the final phases(immediately prior to registration). The expertiseand the earlier phases were left to other countries,which were probably better endowed than Italywith clinical research facilities.
However, after only a few years the data nowphotograph a new situation. In 2006, Phase IIstudies accounted for 39.5% of all studies,with the percentage of Phase III studies fallingto 46.2%. The data certainly reflect the“knock-on” effects of oncology, an area in whichno less than 57% of the 1442 studies conductedwere classified as Phase II. The regulatoryauthority's hope is that other therapeutic areasmay soon proceed along the same road taken byoncology in order to acquire other areas of skilland leadership in the international panorama.Only in this way will Italy be able to play animportant role in centralised and/or mutualrecognition drug-registration processes, in whichthe level of expertise is fundamental.
Biotechnologically derived drugs play a crucialrole in the resurgence of national growth.The details of the clinical trials conducted in thisspecific sector are set out in tables table 1-7.It is also important to emphasise that clinicaltrials have, by now, acquired a predominantlyinternational (67.8% of the total) and multicentric(84.9%) character. This means that Italian clinicalresearch centres are fully integrated into themultinational framework. In addition, it can alsobe noted that clinical trials involving drugs ofbiotechnological origin have now come to representabout one quarter of all clinical trials taking placein Italy. As expected, the lion's share of thesestudies refers to drugs in the field of oncology.It is, moreover, also worth pointing out thatover one third of the studies were promoted bynon-profit institutions, which also bears witness tothe interest in the spread of skills to be found inItalian research structures and in the health service.
That drugs of biotechnological origin representone of the cutting-edges of research is alsodemonstrated by the independent research projectson drugs financed by AIFA. As is known, AIFAprojects are funded by pharmaceutical companiesto the tune of 5% of their promotional budgets.

44
The fund principally sets out to stimulate researchin areas in which companies have little or nointerest in making investments: from rarediseases to comparative studies on drugs andtherapeutics strategies, and safety evaluationsconcerning the general population of patient usersand not just the selected populations of clinicaltrial participants.
Independent research projects put out totender in the first two years of AIFA’s life (2005and 2006) have already been financed. 2007tendering procedure is about to be concludedwhile that for 2008 is already in preparation.It is interesting to note that out of the 105projects financed in the first two tender processes,26 (25%) prefer to studies on drugs ofbiotechnological origin.
It could be asked why there should be nocommercial interest in conducting studies onnewly marketed innovative biotechnological andother drugs? We can illustrate the point withtwo examples. The first concerns the long-term(nine-year) cost/benefit profile of three aromataseinhibitors in the adjuvant treatment of breastcancer. The comparison also includes a procedureto determine if immediate treatment based onaromatase inhibitors is better than a sequentialtreatment, which includes an initial two-yearperiod with tamoxifen. It is obvious that therewill be little or no commercial interest in acomparison involving one drug and othersof the same category, or either in determiningthe best therapeutic strategies aimed atidentifying the specific contribution of a drugin a therapeutic setting in which treatmentis already in progress.
Another example is represented by the inclusionin the 2006 AIFA call to tender for independentresearch on drugs, of a question referring tothe optimisation of therapeutic strategies in orderto improve the risk/ benefit ratio of pharmacologicaltreatment in oncology.
Thus, two studies have been financed on breastcancer treatment, both designed to comparedifferent therapies involving the drug trastuzumab.This drug’s efficacy is well documented. However,it is still necessary to determine if the adverseevents inevitably associated with this treatmentcan be reduced, especially as concernscardiotoxicity, but without reducing the drugsclinical efficacy. One study in particular is aimedat evaluating if a short-term (three-month)treatment is safer, efficacy being the same,than the standard duration (twelve-month).A second survey sets out to determine if byhalving the doses, treatment may be safer,conditions of efficacy being equal, than theactual doses advised for the present regime.
In these cases, it is clear that there would beno commercial interest in conducting in-depthstudies, which, in order to decrease toxicity, wouldentail a reduction in the quantity of the drugneeded in the treatment for breast cancer.These cases are emblematic of the role that canbe played by independent research in meetingthe need for knowledge as well as having apotential impact on the health of women andclinical practice. Furthermore, if it weredemonstrated that shorter and/or less aggressivetreatments had a better cost benefit ratio forpatients, another result would be a reductionin NHS spending.

45Blossom Associati 2008
One final aspect that must beconsidered in discussing the roleof AIFA refers to the contentsof the so-called “programmaticagreements”. These concernindustrial research incentives laiddown in the 2006 Finance Actthat will be disbursed on the basisof a call to tender publishedlast autumn. In the spring of thisyear, the projects submittedby pharmaceutical companieswill be evaluated.There are numerous areasearmarked for incentives – froman increase in research activitiesas well as researchers to PhaseI and II clinical trials, as wellas an increase in productionnationwide and an increase inexports. Altogether, the valueof the incentives amounts toE 100 million, which will bedevolved to pharmaceuticalcompanies to cover 10% of theinvestments carried out. In thismanner, the overall volume ofinvestments or supplementaryspending by pharmaceutical firmsto be generated by this initiativewould amount to E 1 billion.Moreover, among the activitiesto qualify for incentives,biotechnological-drugdevelopment is obviously onewith significant researchimplications as well as being oneof the themes most meritoriousof attention, even if we mustawait the conclusion of theevaluation process in order toquantify the results.
Year N. CT %2001 2 0.32002 10 1.82003 20 3.42004 87 14.52005 130 21.72006 195 32.52007 155 25.8Total 599 100.0
Table 1 - Trials by yearTotal CT involving drugs of biotechnological origin
Data referring to clinical trials involving active principles of biotechnological originstated in the National Observatory on Clinical Trials
Year N. CT % % % % Bioeq/ %Phase II Phase III Phase IV Biod Tot.
2001 2 50.0 50.0 0.0 0.0 100.02002 10 60.0 30.0 0.0 10.0 100.02003 20 15.0 70.0 15.0 0.0 100.02004 87 37.9 57.5 4.6 0.0 100.02005 130 39.2 50.0 10.8 0.0 100.02006 195 43.6 49.7 6.2 0.5 100.02007 155 47.7 44.5 7.7 0.0 100.0Total 599 42.2 49.8 7.6 0.3 100.0
Table 2 - trials by year and by phaseTotal CTs involving drugs of biotechnological origin: 599
Table 3 - Trials by promoter type: profit / non-profitTotal CTs involving drugs of biotechnological origin: 604
Promoter type N. CT % % in ItalyProfit 395 65.4 70.6No profit 209 34.6 29.4Total 604 100.0 100.0
Therapeutic area N. CT %Oncology 208 34.4Immunology and infectious diseases 65 10.8Haematology 57 9.4Gastroenterology 51 8.4Endocrinology 30 5.0Rheumatology 28 4.6Cardiology/Vascular Diseases 23 3.8Neurology 23 3.8Nephrology/Urology 22 3.6Ophthalmology 22 3.6Dermatology/Plastic surgery 18 3.0Others 52 9.0Total 599 100.0
Table 4 - Trials by therapeutic areaTotal CTs involving drugs of biotechnological origin: 599
46
ATC Active principle N. CT1 L01XC07 BEVACIZUMAB 352 L01XC02 RITUXIMAB 333 L01XC03 TRASTUZUMAB 174 L01XC04 ALEMTUZUMAB 135 M03AX01 TOSSINA BOTULINICA 136 L01XC06 CETUXIMAB 127 B03XA01 ERITROPOIETINA 118 L04AA12 INFLIXIMAB 119 J07BB02 ANTIGENE INFLUENZALE, PURIFICATO 10
10 L03AB11 PEGINTERFERONE ALFA-2A 10
Table 5 - Trials by active principleThe first 10 active principles (out of 106) are reported
Pharmaceutical company promother N. CT %1 Roche 54 13.72 Amgen 26 6.63 GlaxoSmithKline 15 3.84 Novo Nordisk 12 3.05 Schering Plough 12 3.06 Wyeth Lederle 12 3.07 Bristol Myers Squibb 11 2.88 Serono International 11 2.89 Chiron 8 2.0
10 MolMed 8 2.011 Merck 8 2.012 Lilly 7 1.813 Novartis 7 1.814 Sanofi-Aventis 7 1.8
Table 6 - Trials by Pharmaceutical Company PromoterTotal CTs involving drugs of biotechnological origin with profit motivated promoter: 395The first 14 (out of 120) promoters accounting for 50.1% of clinical trials are listed
Non-profit promoter N. CT %1 Hospital Trust Policlinico S. Orsola-Malpighi (Bologna) 22 10.52 Hospital Trust S. Giovanni Battista (Turin) 12 5.73 Policlinico Universitario Agostino Gemelli (Rome) 12 5.74 Hospital Trust Padua 7 3.35 Istituto Gaslini (Genoa) 7 3.36 GIMEMA - Gruppo Italiano Malattie EMatologiche dell’Adulto (Rome) 7 3.37 Hospital Trust Universitaria S. Martino (Genoa) 6 2.98 Istituto Europeo di Oncologia (Milan) 5 2.49 Istituto Nazionale per lo Studio e la Cura dei Tumori
Fondazione Pascale (Naples) 5 2.410 Hospital Trust Ospedali Riuniti di Bergamo 4 1.911 Fondazione Ospedale S. Raffaele del Monte Tabor (Milan) 4 1.912 GISL - Gruppo Italiano Studio Linfomi (Modena) 4 1.913 GIMURELL - Gruppo Italiano MUltiREgionale per lo studio
dei Linfomi e delle Leucemie 4 1.914 Università di Udine 4 1.915 Ospedale Oncologico (Bari) 4 1.916 Istituto Nazionale Studio e Cura Tumori (Milan) 4 1.9
Table 7 - Trials by non-profit promoterTotal CTs involving drugs of biotechnological origin with non-profit promoter: 209The first 16 (out of 83) promoters accounting for 53.1% of clinical trials are listed

47Blossom Associati 2008
Networking to enhance businesscompetitiveness - the roleof the Italian Institute forForeign Trade-ICE
I am particularly pleased that ICE has contributed for the secondtime to this prestigious Report. It has immediately establisheditself as required reading for those wishing to gain a comprehensiveview of the biotechnology industry in Italy. We are well awareof the potential that biotech holds for the Italian economy and thatis why we at ICE are stepping up our efforts in this field.
The Italian Institute for Foreign Trade promotes commerce, industrialand technological cooperation, and inward and outward directinvestment through its network of 115 offices in 86 countriesand 17 Regional branches throughout the country. Italian biotechcompanies can rely on ICE’s support in acquiring market intelligenceand in establishing and consolidating their presence abroad.Our activities encompass over 1000 promotional events worldwide,targeting 20,000 companies. Services rendered to Italian firmsand their foreign counterparts yearly amount to 100,000.
A special Action Plan funded by the Ministry for InternationalTrade enables Italy’s biotechnology offering to develop and expand.Through a yearly Promotional Programme, ICE organises theparticipation of Italian companies in the major internationalForums and Conventions, helping to pave the way for commercialagreements and acquisitions involving Italian and foreign companies.Activities are planned in conjunction with Italy’s National Associationof biotechnology companies, Assobiotec, and with the Membersof the Biotechnology, Biosafety and Life Sciences Committee, in orderto establish common strategies.
by Ambassador Umberto Vattani,President Italian Institutefor Foreign Trade

48
Italian Hi-Tech companies, especially biotech companies, canavail themselves of the specific services offered by some of ICE’smain overseas offices: Los Angeles, New York, Toronto, Paris,London, Tokyo, Berlin, Dubai and Shanghai, whose task is to promotetrade in technology and attract foreign investment. Truly a “networkwithin a network”, soon to be boosted by a new service for theprotection of intellectual property rights offered by 14 desks in ouroffices operating in countries such China, India, United Arab Emirates,Brazil, the United States, Russian Federation, South Korea andTurkey. Their task will be to safeguard the “Made in Italy” imageabroad, with particular emphasis on providing Italian companieswith specific support in the field of IPRs.
ICE will soon be launching biotechinitaly.com, a specialised Website that will bring foreign companies directly in touch with Italy’stechnology market; what is more, they will have the opportunity tobenefit from an online matchmaking service, which we are confidentwill foster technological, commercial and industrial cooperationbetween Italian biotech companies and prospective partners overseas.
To encourage mutual contacts among businesses and thescientific and academic world is essential to our mission in this field.We strongly believe that biotech is a fast-growing sector in our countryand that the interaction between production and research isfundamental to the development of a competitive and successfulindustry. The ability to network with the scientific and academicworld is of strategic importance to the development of innovationcapabilities. This is especially true of the biotechnology industry.
Italian biotech typically comprises not only the “BigPharmas”,but a large number of technologically sophisticated start-ups, aswell, along with Universities and Research Centres. Such a compositestructure requires the backing of public institutions, enabling thecreation of networks of excellence and international co-operationprojects. No longer an objective in its own right, competitivenesshas taken on a social purpose. The promotional activities of ICEthus contribute to fostering technology transfer between ResearchCentres and businesses, and the creation of innovative products,processes and services.
Both through its own networks and by entering into strategic allianceswith International Bodies and Organisations, the Italian Institutefor Foreign Trade offers a range of information and services thatcontribute to the creation of value added, thus underscoring the vitalimportance of knowledge in a world in which the emphasis isshifting from the production of material goods to the provision ofrelated services. The ensuing relationship with SMEs allows ICEto offer them its support at every stage of their growth and expansionin the international marketplace.

49Blossom Associati 2008
Cooperating and competing
On 25 April 1953, Nature, one of the mostimportant scientific journals published the resultsof research by James Watson and Francis Crick.In a short article the molecular form of DNA,now known as the “double helix”, was described.The discovery earned the two scientists theNobel Prize in 1962 and gave the world the basisfor the development of modern biotechnology.But what is biotechnology? A good starting pointis most certainly the definition given by theOECD in 1982. According to this organisation,biotechnology is “the application of science andtechnology to living organisms, as well as parts,products and models thereof, to alter living ornon-living materials for the production ofknowledge, goods and services”.
The European Federation of Biotechnology6
defines biotechnology as the “integration of naturalsciences as well as organisms, cells, their partsor molecular analogues in industrial processesfor the production of goods and services”.However, the most complete definition is certainlythat given by the Convention on BiologicalDiversity7: “Biotechnology means any technologicalapplication that uses biological systems, livingorganisms, or derivatives thereof, to make ormodify products or processes for specific use”.
Biotechnologies are all those technologies thatmake use of living organisms (bacteria, animalcells of simple or complex organisms) or theirderivatives (such as enzymes) to produceproducts useful to man in commercial quantitiesdesigned to improve the characteristics ofplants and animals or to develop micro-organismsuseful for specific uses.
6 The European Federation of Biotechnology (E.F.B.) is a Europeannon-profit federation that brings together national associations,universities, scientific institutes, biotech companies and individualresearchers in the field of biotechnology for the purpose ofpromoting biotechnologies in Europe and the world at large.7 The Convention on biological diversity is an internationaltreaty that was adopted in 1992 to safeguard biodiversity, thelong-term use of its elements and the fair sharing of advantagesderiving from the exploitation of genetic resources.
by Federica Bottazzi and Federica Rovida
Blossom Associati Corporate Finance

50
It is immediately clear that this is a far rangingdefinition that attempts to bring together twoworlds that are normally in conflict with oneanother; research aimed at scientific breakthroughsand industry with its sights on profitabilityand competition.
Multidisciplinary is one of the salient featuresof biotechnologies: the most important applicationsare to be found in the medical-pharmaceuticaland agri-foodstuff fields. However, other fieldssuch as industry or the safeguarding of theenvironment, are developing strongly.
White biotechnologies refers to the applicationof industrial processes and the safeguarding ofthe environment, which today are fast growingareas of activity. Biotechnologies are used toreduce the impact of certain industrial processes,monitor environmental pollution and identifypolluting elements.
Another field of application is agriculture andfood processes, generally referred to as Greenbiotechnology. In the agricultural field,biotechnologies are used to modify the geneticcharacteristics of vegetables in order to obtainproducts with specific characteristics such astolerance to herbicides, protection from insectsor bacteria and/or protection from adverseenvironmental conditions. In the field of foodproduction, they can increase the quality andnutritional value of agricultural and animal productsand also improve the processing of foodstuffs.Another area of application at present undergoingdevelopment refers to the improvement in thesafety level of foodstuffs in order to solve thehighly important problem of microbialcontamination.Biotechnologies are used to fight infectionsthroughout the productive process in order toreduce the possibility of allergic reactions andto identify possible dangerous microorganisms,toxins or pathogens.
In addition, reference is often made to otherareas in which of biotechnologies are applied.On the one hand, there are the so-called bluebiotechnologies, referring to the manipulationof aquatic or marine products and, on the other,bio-informatics, or computerised technology,which adapts an informatics approach to resolvebiological type problems. They play a fundamentalrole in the development of new drugs.
Nevertheless, the principal field of applicationis unquestionably health care, the so-calledred biotechnology that employs the newtechnologies in medical-pharmaceutical fields,in order to produce:
1) diagnostic tools, which by acting at a geneticand proteic level can with, extreme precisionand celerity, verify the origin of a possiblepathology. Not only are the techniques ofdiagnosis modified but also the process itself,which by being simplified enables the teststo be carried out by anybody at any time.
2) therapeutic products, which not only improvetoday’s treatment but also develop forms oftreatment which otherwise would not be available.
3) regenerative medicines, which use the naturalcapacity of the human body to maintainand repair itself. Stem cells are an outstandingexample8.
4) vaccines, in other words, organic substancesthat allow the organism to identify andsubsequently fight infective diseases.
However, whatever field is considered, therewill always be the sure knowledge thatbiotechnological companies have innovation intheir DNA, and not only as regards researchand development activities but also, and aboveall, the concept of business itself. In this case,the principal players find themselves in a conditionof having simultaneously to co-operate andcompete in order to reach their objective:knowledge sharing, technological transfer andthe creation of value.At this point it is natural to recur to the notionof system, which functions as the glue bindingthe whole operation together.
Right from their very beginnings, developmentsin biotechnologies always took place within centresof excellence. We can think of San Diego,Cambridge, the Medican Valley, the Biovalleyor the San Francisco Bay Area where in 1976,Genentech, the first biotechnological companyin the pharmaceutical field was set up, whichstill today ranks among the first 10 biotechnologicalcompanies in terms of sales.
The reason for the central role played by the conceptof the system of excellence lies in the typicaladvantages deriving from “geographic proximity”,which entails the simplification of technologicaltransfer and the spread of tacit knowledge.
8 Unlike most of the cells of the body, stem cells are undifferentiated, i.e. they do not have well determined tasks and functions.Consequently, they can be used to create new cells able to replace cells damaged by pathologies of various types and cure diseasescaused by the malfunctioning of cells, such as Alzheimer or Parkinson’s disease.

51Blossom Associati 2008
The first 10 biotech companies in the world
Rank Company Country Turnover R&D expediture Net profit / Employed(milions $) (milions $) (losses)
(milions $) 1 Amgen USA 14,268.0 3,366.0 2,950.0 20,100 2 Genentech USA 9,284.0 1,773.0 2,113.0 10,533 3 Genzyme USA 3,187.0 650.0 – 16.8 + 9,000 4 UCB Belgium 3,169.6 772.6 461.1 8,477 5 Gilead Sciences USA 3,026.1 383.9 – 1,190.0 7,575 6 Serono Switzerland 2,804.9 560.5 735.4 4,775 7 Biogen Idec USA 2,683.0 718.4 217.5 3,750 8 CSL Australia 2,148.3 119.1 86.8 2,895 9 Cephalon USA 1,764.1 403.4 144.8 2,51510 MedImmune USA 1,276.8 448.9 48.7 2,359
The advantages of setting upa biotech system of excellenceare of four types:> Advantages related to
productivity: as regards thebiotechnological sector, wespeak primarily of reductionsin transaction costs because –within a cluster – reciprocalrelationships of trust areestablished, resources arerequired in common andinfrastructure shared, whosecosts would otherwise haveto be borne by each actorindividually, making it moredifficult to enter into newbusiness fields.
> Advantages related to innovation:in this case, proximity toresearch centres of excellenceis of fundamental importancebecause proximity makes itpossible to develop a potentialin terms of innovative capacity.
> Advantages related to newbusinesses: these refer, firstand foremost, to the creationof a fertile environment forthe development of newbiotechnological companies;
> Advantages in terms of thecreation of value: above allthese refer to the value-controlphase correlated to thefundamental role played bytechnological transfer.
A cluster can be considered anintegrated network system inwhich co-operation takes placetogether with transactions ofvarious types between a series ofplayers, as schematically depictedin the chart.
Biotechnological companiesare at the centre of the model.They have developed a seriesof relations with the other nodesof the cluster but especiallywith traditional pharmaceuticalcompanies and in so doing bothare able to overcome certainstructural shortcomings: on theone hand, biotech companiesneed to raise R&D investmentcapital and lack comprehensivedistribution networks andproductive facilities; on the other,traditional pharmaceuticalcompanies need to feed their ownpipelines with innovative projects.
Source: Top 100 biotechnology companies, MedAdNews, June 2007
The biotechnological cluster model
Source: Blossom Associati - CrESIT 2008
Venture Capitalists
Banks
IstitutionalInvestors
Stock Market
Business Angels
INVESTORS
Advisory
Financial
Legal
Human Resources
SERVICESPROVIDERS
Consortia
Hospital
Science Park
Universities
Bio-incubator
FUNDAMENTALRESEARCH
Related Companies
Applied Companies
COMPANIES
Istitutions
Local Istitutions
IndustrialAssociations
European Union
ISTITUTIONS
Biotechnologycompanies
CLUSTER
CapitalProfessional
Services
Fees
Fees
HumanResources
Interest,dividends
Legislative Support
EconomicDevelopmentEmployment
Know how Investments

52
Links are also very importantwith the financial system to whichthe sector companies must turnto raise the capital necessaryfor development. However, themarket operators include not onlybanks and stock exchanges butalso institutional investors suchas private equity and venturecapital and the informal channelsof business angels and, last butnot least, foundations and thelarge corporations.
Within the cluster, there must beclose links with the researchsystem as this provides the inputthat forms the basis for thecorporate development processes:new technologies, new productsand high-level training. Publicand hospital research centresperform a fundamental role,especially as concerns basicresearch. In addition, we shouldremember the scientific andtechnological parks andincubators, which are necessaryto sustain companies especiallyin start-up phases.
The network is completed byregulatory and norm-settinginstitutions operating at aninternational, national and locallevel, institutions that providefinancing in pre-seed phases, and,last but not least, support sectorsthat provide financial, managerial,legal and operative consultancyon matters ranging from thedrawing up of business plans,and the analysis of investmentrisks to accessing subsidisedfinancing for R&D activitiesand the development of newentrepreneurial initiatives.They also put companies intocontact with investors, andprovide legal help concerningthe safeguarding of intellectualproperty and patent law, aswell as training services incooperation with universitiesand other national andinternational activities andtraining for the developmentof innovation technological transferand research.
The top 10 traditional pharmaceutical companies in the world
Rank Company Country Turnover R&D Net profit / Employees(milions of $) (milions of $) (loss)
(milions of $) 1 Johnson & Johnson USA 53,324 7,125 11,053 138,000 2 Pfizer USA 48,371 7,599 19,337 122,200 3 GlaxoSmithKline GB 42,813 6,373 10,135 106,000 4 Novartis Switzerland 37,020 5,349 7,202 102,695 5 Sanofi-Aventis France 35,645 5,565 5,033 100,735 6 Hoffmann-La Roche Switzerland 33,547 5,258 7,318 100,289 7 AstraZeneca GB 26,475 3,902 6,063 98,000 8 Merck & Co. USA 22,636 4,783 4,434 74,372 9 Abbott Laboratories USA 22,476 2,255 1,717 66,80010 Wyeth USA 20,351 3,109 4,197 66,663
Source: Top 100 pharmaceutical companies, MedAdNews, June 2007
Financing by type
Early stage financing Investment in the early phases of a company’s life can be divided into:> seed financing, which refers to the experimental phase of an innovative idea
when it is necessary to demonstrate the technical validity of a product/service;> start up financing, which is undertaken in the start-up phase of activities,
when the commercial potential of a product/service is unknown.Expansion financing or Investment designed to sustain corporate development and growth; the developmentdevelopment capital of business activities can proceed by diversification (internal growth), the acquisition
of companies or business units (external growth) or by cooperation with other companies(networking and clustering).
Bridge financing Bridge financing refers to an advanced phase in corporate development,characterised by the consolidation of the shareholder with a controlling interestand its acquisition of the minority stakes of shareholders intending to disinvest,although it may also take the form of a public listing
Replacement Capital Investment aimed at reorganising the shareholding structure, whereby aninstitutional investor replaces one or more shareholders wishing to disinvest.
Cluster - Venture Investment operations designed to harness together a number of independent companies.Turnaround Investment for the restructuring of lame-duck companies.MBO, LBO, MBI Operations designed to replace all the shareholders of the company with internal
(Management buy-out), or external management (Management buy-in), by adebt funded acquisition (leveraged buy-out)
Profile: Blossom Associati Corporate Finance

The art ofcorporateinnovationis differentfor everycompany
Helping companies improvetheir financial results
blossomassociati.com

Blossom - Venture Capital Screening 2008The latest analyses of corporate finance conducted byBlossom Associati reveal that as of today the companies thatcould be listed on the stock exchange in the coming yearsnumber no more than 3 or 4. A screening of Italian companiesconducted to determine the most interesting targets in the sectorindicate once again that Italy is more suited to venture capitalthan public listing. Companies must first grow, set up an appropriatestructure, create a network, develop research and only when thepipeline has reached a level such as to forecast a two-three yearcash flow can they begin to consider public listing.
In this context, venture capital as an intermediate stage priorto listing is certainly able to provide the acceleration needed.In our sector more than in others, venture capital and specialisedadvisors are essential, as they are only elements with theexpertise to manage associated risks who posses the strategicmanagerial capacity necessary.
For example, a biotech company with a mainly Phase 1 or 2pipeline, without access to capital, know-how and the network,or retail sales would be too great a risk for any operator. Venturecapital investments enable companies to survive for a period ofbetween 18 to 24 months in order to attain a well-definedmilestone that will successively set the premises for another roundof investments, thereby guaranteeing capital gains for the investor.The investments in question albeit relatively modest are repeatedover time. However, the high risk characterising the sector andthe high failure rate of projects make it difficult to plan returnson investments. This, consequently, gives rise to the need tofraction the investments.
by Federica Bottazzi
Blossom Associati CorporateFinance
54

Altro 24%
Austria 5%
Belgium 2%
Denmark 4%France 8%
Germany 17%Ireland 4%
Netherlands 6%
Sweden 4%
Switzerland 11%
United Kingdom 15%
Geographical distributionof Specialised European VC Firms (2008)
Source: Blossom Associati Corporate Finance
Bridge 12%
Expansiondevelopment 39%
Large buyout(150m - 300mequity) 1%
Mid marketbuyout(15m - 150mequity) 7%
Other earlystage 20%
Seed 10%
Start-up 9%
Small buyout(<15m equity) 2%
Financing Stages - Specialised EuropeanVenture Capital Firms (2008)
Source: Blossom Associati Corporate Finance
MinorityEquity 50%
ShareholdersLoans 10%
Debt 6%Investmentin thirdparty fund 2%
Majority Equity 28%
Mezzanine 4%
Source: Blossom Associati Corporate Finance
Type of Financing - Specialised EuropeanVenture Capital Firms (2008)
The ideal situation for many emergent Italian companies withan excellent pipeline, although still in a preliminary phase, wouldbe to find specialised foreign venture capital with the skills,networks and capital flows necessary for accelerating the pipelinedevelopment phase. It is necessary to bear in mind that whileemergent companies compete for financing by submitting businessplans to at least a dozen venture capital firms or financiers, soventure capitalist firms also compete internationally in their effortsto discover the best opportunities and create value at the pointof intersection of three markets: new ideas, capital and talent.For example, it is quite usual for a medium-sized Americanventure capital firm to examine an average of about 6,000 businessplans per year in order to identify the most promising start-upsand companies.
Empirical international evidence as well as our own experienceas strategic advisor reveal some features shared by all the mostpromising companies: a business concept that does not fixlimits to growth potential or value, innovation, understood asa task falling to all in the organisation and, finally, the capacityto create a diversified portfolio of strategic exit strategy optionsevidencing the capital gains realised.
Our screening of international venture capital firms shows anincreasing interest in the biotech sector as illustrated by thepresence of 354 American and European VCs investing or readyto invest in the sector. In the United States there are 194 VCfirms operating in the sector. The areas with the greatestpresence of investors are the San Francisco Bay Area, San Diego,New York and Boston.
In Europe there are 160 VC firms investing in biotechnologies.The nations with the highest VC investments are the UK andGermany followed by Switzerland and France. The classicalinvestment is equity capital financing (78%) with a strongpreference towards a minority shareholding (50%), possiblyas part of a syndicate with other local institutional investors.However, VC firms are also ready to provide other forms offinancing including long-term loans (6%), and mezzanine loans(4%). The latter is usually seen as a form of pre-IPO financing.
55Blossom Associati 2008
Capital contributions from shareholders 82%Programmes co-financed by public sector 61%Banks 28%Venture Capital/Private Equity 20%Business Angels 1%
Source of financing of Italian biotech(% data of all sector companies).
Source: Blossom Associati – CrESIT 2008

56
The 2008 analysis of the structure of the biotechnology sector for health care(Red Biotech), like previous reports, classified Red Biotech companies accordingto the analysis of the corporate models adopted:
> “Born Biotech” or “Pure Biotech”: companies whose core business is mainlyoriented to research and development activities. The marketing of biologicalproducts and the technologies used to develop them is only a marginal activity.“Born Biotech” companies can be differentiated in terms of product, drug agentand biotech platform but they all have one trait in common: the percentageof investments on projects, products, and biotechnological platforms or technologies(InvB) with respect to total investments (Inv) exceeds 70% (InvB/Inv>70%);
> “Pharma Biotech” or “biotech product” companies are those companiesoperating along the entire value chain of the pharmaceutical sector - R&D andthe production and marketing of biotechnological and traditional products.Their reference is the end user, and hence they cover both the primary caresegment9 and the secondary care segment10. These companies havedemonstrated their ability to utilise the returns on the sale of exploitationrights of their findings order to integrate themselves vertically. This gives themthe ability to reach the end-user market directly, an indispensable strategyif the stable cash flow necessary to sustain R&D processes is to be guaranteed.
A further segmentation was applied to Pharma Biotech companies, based on theratio of investments in platforms or biotech technology (InvB) to total investments(Inv). In detail, if the ratio InvB/Inv is greater than 40% of the investments,the company is “Biotech oriented”, while if the ratio InvB/Inv ranges from 2%to 40% the company is Pharma oriented.
Therefore, not only companies that conduct R&D based on traditionaltechnologies but also companies whose core business is oriented towards theproduction or marketing of biotechnological products have been excluded fromthe list of companies prepared according to Blossom Associati - CrESITmethodology. As already mentioned, this research does not intend to surveycompanies engaged on services, regulatory, legal and financial consultancy andgeneric biomedical production.
Methodological Notes
9 This segment of the pharmaceutical market concerns products that patients can purchase and use directly.It covers the most common drugs such as pills, oral solutions, etc.10 This is the pharmaceutical market segment that comprises products whose administration requires hospitalsand specialised medical personnel.

57Blossom Associati 2008
Some additional considerations may assist the understanding of themethodology applied.
Scientific parks and incubators. In this edition we have introduced a significantnovelty by choosing some science and technology parks that, on the basis of aselective and independent criterion, meet the following pre-requisites:
> a strong propensity to support start-ups by sustaining not only managerialdevelopment but also the development of technical, scientific and regulatoryknow-how of international importance;
> a strong propensity to sustain, manage and promote technological transferinternationally;
> a strong propensity to sustain and promote ties with Big Pharma, biotechcompanies, professional and managerial service companies, investors, universities,research centres, hospitals and clinics orientated to research and experimentationat a national and international level;
> the utilisation of structures, technologies and highly qualified researchers and personnel.
Universities. We have identified and analysed the main universities with astrong interest in capitalizing upon their know-how and which over time have beenable to sustain and successfully bring about the spin-off of at least one or moreof the biotech companies that meet the foregoing requisites and in which theyhave shareholdings.
Clinical research. For purposes of identifying research centres and structures,account was taken of the data and information drawn up by AIFA.
Service companies: The 2008 report does not cover complementary product/servicesuppliers that offer products and services with marginal added value and whichcan be broken down into companies offering biotech services and biotech commodities.Biotech service companies make ICT skills available and provide assistance forthe activities of biotech companies involved in R&D processes. Their principalservices refer to the gathering of information from public or private databases,the implementation of IT systems for data management and support for laboratoryand marketing activities. Biotech commodity companies are involved in the productionand sale of the products used in R&D processes. As concerns their positioningin the value chain, both cover the entire range of activities, and adopt businessmodels with a low yield/risk profile and a limited contribution in terms of innovationand value creation. This model is profoundly different from the businessmodel typical of the biotech companies analysed within the framework of theBlossom Associati-CrESIT report.
The use of this methodology does not allow us to estimate the aggregate value ofall activities correlated to the industry, which is – as may be imagined – far widerthan the specifically biotech system.

58
Data and criteria for size segmentation
The selection of the companies was based on 2007 data.The data and analyses contained in the Report refer to the year or years indicatedin the associated tables.
For the classification by size of the companies, reference was made to the Communitydefinition of the company, which came into force on January 1st, 2005.It was introduced by recommendation 361 of 2003, and replaced 96/280/EC withan updated text. In this regard, the following definitions are used:
> small company, refers to a company with fewer than 50 employees and anannual turnover or a budget of no more than 10 million euros (the higher ofthe two figures is used);
> medium-sized company refers to a company with fewer than 250 employeesand an annual turnover of no more than 50 million euros or annual budgetof no more than 43 million euros;
> large company refers to company with more than 250 employees and an annualturnover of over 50 million euros or annual budget of more than 43 million euros(the lower of the two figures is used).
The research areas: segmentation criteria
The companies analysed in this report were classified in terms of their operating area:
The Red Biotech, in which the new technologies are adapted to medical-pharmaceuticalcontexts such as:
> Diagnostic instruments that by acting out a genetic and proteic level can,with extreme precision and celerity, verify the origin of a possible pathology.Not only are the techniques of diagnosis modified but also the process itself, whichby being simplified enables the tests to be carried out by anybody at any time.
> Therapeutic products that not only improve today's treatment but also developtreatment that otherwise would not be available.
> Regenerative medicines that use the natural capacity of the human body tomaintain and repair itself. Stem cells are an outstanding example11.
> Vaccines, in other words, organic substances that allow the organism to identifyand subsequently fight infective diseases.
The White biotechnology12 (or grey biotechnologies refer to the application ofindustrial processes and the safeguarding of the environment, which today arefast growing areas of activity. The biotechnologies are used to reduce the environmentalimpact of certain products and processes13, monitor environmental pollution andidentify polluting elements.
11 Unlike most cells of the body, stem cells are undifferentiated, i.e. they do not have well determinedtasks and functions. Consequently, they can be used to create new cells able to replace cells damagedby pathologies of various types and cure diseases caused by the malfunctioning of cells, such as Alzheimeror Parkinson’s disease.12 White biotechnologies.13 The chemical textile or paper-making industries are examples of such applications.

59Blossom Associati 2008
Green biotechnology, in the agricultural field, is used to modify the geneticcharacteristics of vegetables in order to obtain products with specific characteristicssuch as tolerance to herbicides, protection from insects or bacteria and protectionfrom adverse environmental conditions. In the field of food production, they canincrease the quality and nutritional value of agricultural and animal productsand improve the processing of foodstuffs. A further area of application at presentundergoing development refers to the improvement in the safety level of foodstuffsin order to overcome the highly important problem of microbial contamination.Biotechnologies fight infections throughout the productive process in orderto reduce the possibility of allergic reactions and identify possible dangerousmicroorganisms, toxins or pathogens.
Biotech platforms refer to companies concerned with the development andmarketing of hardware and software technologies to support R&D. Such technologiesmay be broken down into product and process technologies. Bioinformatic companiesimplement hardware and software systems for the generation, integration andmanagement of data produced in the course of drug discovery processes.
In general, the time to market that characterises the different platforms isconsiderably different from that typical of companies oriented to the developmentof new drugs, i.e. Born Biotech or Pharma Biotech. Thus, in the case of thesebiotech companies not only is time to market lower but also their failure rate.In actual fact, the risk/yield profile is much more similar to those of ICT14.
14 Information and communication technology companies, where information technology andtelematics converge upon new methods for the transmission of information. Such methods includenetworks and multimedia.

60
Thanks to this work of analysis and cooperationBlossom Associati and CrESIT are, today, a nationaland international reference point. And as suchwe can provide all the key data on the Italiansector according to specific requirements.Whenever it is necessary to modify some criteriaof analysis, enlarge or modify the objectivesof an analysis, we can reclassify and re-analysethe data by providing the key data on thenational sector while remaining faithful to theunderlying principle based on the adoption of asingle, reliable and accredited database.
Consequently, in order to determine thesample of accredited Italian biotechnologicalcompanies we adopted an analytic selectioncriterion that lays down the following prerequisitesfor each company:
> the legal body in question must be a companyset up to create value and generate profit;
> it must undertake research and developmentwithin the territory of Italy (albeit not on anexclusive or prevalent basis).
> Its R&D activities must concern innovativetechnologies and products based onbiotechnological type platforms, bearing inmind that we have adopted the definitionof biotechnology proposed by the Conventionon Biological Diversity.
Accrediting biotechnological companiesBlossom Associati - CrESIT accreditation
Essentially, our method consists in consistentlyapplying a single definition of the“Biotechnological Sector” throughout the entirestudy. Hence, Blossom Associati, in agreementwith the Research Centre for Economy, Health,Innovation and the Territory (CrESIT) of InsubriaUniversity decided to adopt a single methodologyin order to guarantee valid comparisons betweennational and international findings.
An analysis of the main national and internationalstudies showed that the different methodsused often produce mutually incompatible andsometimes misleading analyses on account ofthe different objectives being pursued.
Therefore, for the purpose of minimising thedifferences encountered, we dedicated ourattention to the main methodologies usedby the various international studies in order toextrapolate the best from each.

61Blossom Associati 2008
In order to guarantee a fully comprehensive analysisable to include the maximum possible numberof companies that meet the foregoing requisites,a far-reaching and in-depth analysis was conductedthroughout the national territory, based upon thefollowing approach:
a) company identification.An initial identification of the set of companiescomplying with the minimum requisites wasconducted, based upon a thoroughgoing,company-by-company analysis. Information wasdirectly acquired on the companies within theambit of official national/regional databank,ministerial web sites, agencies, universities,incubators, science parks, companies, etc.The research was subsequently supplementedby the analysis of chamber of commerce recordsand financial statements. In conclusion, a finalverification was conducted based on direct contactswith companies.
b) company selection.The selection of the companies was the mostcomplex phase as it called for special attentionin assessing whether companies met themethodological requisites we had formulated.An initial selection of the companies was madeby gathering information from the financialstatements of the individual companies, theacquisition of supplementary data on each singlefirm through qualitative questionnaires and theentering of essential information on a databasedesigned by Blossom Associati and CrESIT.Each company was later analysed for initialinclusion or exclusion according to its compliancewith the requisites defined by a scientific committeemade up of Blossom Associati, and CrESIT. Inorder to guarantee the total independence andprofessionalism of our work, the final selectionfor definitive approval remained the prerogativeof Blossom Associati, which, on the basis of allthe information acquired, certified the companiesthat were to be included in the sector.
c) data collection.The collection of the data on the financialstatements was prepared by CrESIT on the basisof indications agreed upon with Blossom Associati.The data was collected by acquiring annualaccounts and chamber of commerce records onthe companies chosen and of all the principaldocuments referring to the industry, in linewith the methodology of analysis proposed.
The numerical evidence set forth in the Reportis the product of statistical analyses by CrESITand Blossom Associati on data and informationfrom the following sources:
> financial statements and notes to the financialstatements filed with the chamber of commerce,for the years 2006, 2005, 2004, 2003 and 2002;
> chamber of commerce records (both ordinaryrecords and records on shareholding structure)produced in the period November-January 2008.
Blossom Associati, Assobiotec and Farmindustriacollected qualitative information from companiesusing a specially prepared questionnaire.The companies responded to the questionnairesin an exhaustive manner. In actual fact, thereply rate was well above the 10% figure obtainedby the best international surveys (Harzing, 1997).On average, the reply rate of companies wasabout 73%.
The data collection process was concludedon February 20th, 2008.
The rigorous application of the methodologydeveloped, and the independence andprofessionalism of Blossom Associati and CrESITin their evaluation of individual cases, led tothe exclusion of many companies, entities andactors that, in many cases, are included inseveral other studies and databases.However, in view of the importance of thework we cannot, a priori, exclude the possibilitythat companies or parks may have beenoverlooked that should have been includedin the list of recognised companies.
Any companies and parks not included in ourlist that believe they meet the requisites indicated,should request Blossom Associati for a qualitativeanalysis form so that they can furnish informationnecessary for the 2009 edition of the Report.
On the other hand, those companies includedamong the recognised companies that considerthey do not meet the requisites defined in themethodology may request removal from the listif they provide Blossom Associati with pertinentreasons and data.

62
1 AB ANALITICA2 ABBOTT3 ABIOGEN PHARMA4 ADALTIS ITALIA5 ADAMANTIO6 ADIENNE PHARMA&BIOTECH7 ADRIACELL8 ADVANCED ANALYTICAL TECHNOLOGIES9 AETHIA
10 AGRIFUTUR11 AGRITEST12 AGROLABO13 ALFA WASSERMANN14 ALLTOX15 ALPHAGENICS16 ALSO BIOTECH17 AMGEN18 ANALISI & CONTROLLI19 ANALLERGO20 ANIDRAL21 APAVADIS22 APULIABIOTECH23 ARETA INTERNATIONAL24 AVANTGARDE25 AXXAM26 BCS BIOTECH27 BGT ITALIA28 BIO & GEO29 BIO DEC30 BIO FLAG31 BIO HI-TECH32 BIO RAD33 BIO3 RESEARCH34 BIOALLERGY INTERNATIONAL35 BIOANALISI CENTRO SUD36 BIOANALISI TRENTINA37 BIOANSWERS38 BIOCI DI CAIOLO CARLO39 BIODIVERSITY40 BIOFARMA41 BIOFIN LABORATORIES42 BIOFUTURA43 BIOGEN-DOMPE'44 BIOGENETICS45 BIO-KER46 BIOMAN47 BIOMAT48 BIONUCLEON49 BIOPAINT50 BIOREP51 BIOSEARCH AMBIENTE52 BIOSENSOR TECHNOLOGIES53 BIOSILAB54 BIOSISTEMA55 BIOSPA56 BIOSPHERE57 BIOSTRANDS58 BIOSYNTH59 BIOTECGEN60 BIOTECK61 BIOTECNE CONSORZIO PER LE RICERCHE62 BIOTEST ITALIA
ITALIANBIOTECHCOMPANY
63 BIOTRACK64 BIOXELL65 BMR GENOMICS66 BOEHRINGER INGELHEIM ITALIA67 BOUTY68 BRANE DISCOVERY69 BSA AMBIENTE70 CAGE CHEMICALS71 CBM72 CCS AOSTA73 CEINGE BIOTECHNOLOGIES AVANZATE74 CELGENE75 CELL THERAPEUTICS EUROPE76 CENTRO BIOTECNOLOGIE AVANZATE77 CHARLES RIVER LABORATORIES78 CHIESI FARMACEUTICI79 CLONIT80 COGEP81 CONGENIA82 COSMO83 COSTANTINO84 CREABILIS BIOTECH85 CUTECH86 CYANINE TECHONOLOGIES87 DAC88 DALTON BIOTECNOLOGIE89 DEGENE90 DEGUSSA TEXTURANT SYSTEMS ITALIA91 DIALECTICA92 DIASORIN93 DIATECH94 DIATHEVA95 DIESSE DIAGNOSTICA SENESE96 DOMPE’ BIOTECH97 DOTT. DINO PALADIN98 ELI LILLY ITALIA99 EOS
100 EPPENDORF101 ERATECH102 ESAOTE103 ESPIKEM104 ETNA BIOTECH105 EURAND106 EUROCLONE107 EUROSPITAL108 EXENIA GROUP109 EXPERTEAM DI DE BORTOLI110 EXPLORA111 FATRO112 FERTIREV113 FIDIA ADVANCED BIOPOLYMERS114 FLAMMA115 FOTOSINTETICA & MICROBIOLOGICA116 GENALTA117 GENEDIA118 GENEXTRA119 GENTIUM120 GENZYME121 GILEAD SCIENCES122 GIO.ECO123 GNOSIS124 GREENLAB

63Blossom Associati 2008
125 GRIFOLS ITALIA126 GUYA BIOSCIENCE127 HMGB BIOTECH128 IDRABEL129 IMED130 INBIOS131 INCURA132 INDENA133 INNOVATE BIOTECHNOLOGY134 INVENTO135 INVITROGEN136 IPSEN137 IST. RICERCHE DI BIOLOGIA MOLECOLARE ANGELETTI138 ISTA139 ISTITUTO DI RICERCHE BIOMEDICHE ANTOINE MARXER140 ITALFARMACO141 JANSSEN CILAG142 KEDRION143 KENTON144 KERYOS145 LAY LINE GENOMICS146 LEA BIOTECH147 LEAF BIOSCIENCE148 LIFELINELAB149 LORENZ BIOTECH150 MEDESTEA RESEARCH & PRODUCTION151 MEDITECKNOLOGY152 MENARINI BIOTECH153 MERCK SERONO154 MERISTEMA155 METAPONTUM AGROBIOS156 MILLIPORE157 MOLECULAR BIOTECHNOLOGY158 MOLMED159 MOLTENI FARMACEUTICI160 MONTEGEN161 NANOVECTOR162 NARVALUS163 NAXOSPHARMA164 NEMO LAB165 NERVIANO MEDICAL SCIENCES166 NEUROGENICS167 NEUROSCIENZE PHARMANESS168 NEWRON PHARMACEUTICALS169 NGB GENETICS170 NICOX RESEARCH171 NIKEM172 NOBIL BIO RICERCHE173 NOTOPHARM174 NOVARTIS FARMA175 NOVO NORDISK FARMACEUTICI176 N.T.I.177 NURAGING BIOTECH178 NUTRISEARCH179 NYCOMED ITALIA180 PHARMESTE181 PHILOGEN182 PIONEER HI-BRED ITALIA183 PLANTECHNO184 POLIMED185 POLIMEKON186 PORTO CONTE RICERCHE
187 PRIGEN188 PRIMM189 PRION DIAGNOSTICA190 PROBIOTICAL191 PROGETTO NATURA192 PROTEGEON BIO193 PROTEIOS194 PROTEOTECH195 PROTERA196 ROCHE197 ROTTAPHARM198 S.A.F.AN. BIOINFORMATICS199 SACACE BIOTECHNOLOGIES200 SANOFI PASTEUR MSD201 SB TECHNOLOGY202 SCHERING-PLOUGH203 SEKMED204 SERVIER ITALIA205 SHAR.DNA206 SIENABIOTECH207 SIGEA208 SIGMA TAU209 SILICON BIOSYSTEMS210 SPIDER BIOTECH211 TALENT212 TARGET HEART BIOTEC213 TECAN ITALIA214 TECNA215 TECNOBIOCHIP216 TECNOBIOMEDICA217 TECNOGEN218 TECTRONIK219 TIB MOLBIOL220 TISSUELAB221 TOP222 TOSCANA BIOMARKERS223 TRANSACTIVA224 UFPEPTIDES225 WETWARE CONCEPTS226 WEZEN BIOPHARMACEUTICALS227 WYETH LEDERLE228 XEPTAGEN
Although extreme care was taken in the compilationof the following list, it should be noted that it is notcomprehensive and may contain omissions and errors,for which no liability can be accepted.Please notify Blossom Associati of any requests foramendments, supplementary information or cancellation,so that the most appropriate initiatives may be taken.

Blossom Associati Professional Servicesare tailored to meet Your needs and
organized to suit Your Team
Helping companiesimprove theirfinancial results
blossomassociati.com

blossomassociati.com
Blossom Associati Management Academy provides a skills platform for Your Management Development and Coaching
LEADERSHIP FINANCE MANAGEMENT
Training Development ProgramsOctober 2008 - July 2009Milan - Italy
[email protected]+39-02-80 50 50 11

Management Consul t ingOutsourcing Profess ional Ser v ices
Corporate Finance
Foro Buonaparte 46 | Mi lan - I ta ly | +39 02 80 50 50 11
info@blossomassociat i.com | www.blossomassociat i.com