Issuer margins for structured products in Germany · Issuer margins for structured products in ......
29
Issuer margins for structured products in Germany by Björn Döhrer/ Lutz Johanning/ Nils Steiner/ Arndt Völkle November 2013 Prof. Dr Lutz Johanning WHU ‐ Otto Beisheim School of Management Chair of Empirical Capital Market Research Burgplatz 2 56179 Vallendar Germany email: [email protected] Björn Döhrer EDG AG email: [email protected] Arndt Völkle EDG AG email: [email protected] Nils Steiner EDA / vwd academy AG email: [email protected]
-
Upload
truongkhanh -
Category
Documents
-
view
223 -
download
1
Transcript of Issuer margins for structured products in Germany · Issuer margins for structured products in ......

Issuer margins for structured products in Germany by Björn Döhrer/ Lutz Johanning/ Nils Steiner/ Arndt Völkle November 2013
Prof. Dr Lutz Johanning
WHU ‐ Otto Beisheim School of Management
Chair of Empirical Capital Market Research
Burgplatz 2
56179 Vallendar
Germany
email: [email protected]
Björn Döhrer
EDG AG
email: [email protected]
Arndt Völkle
EDG AG
email: [email protected]
Nils Steiner
EDA / vwd academy AG
email: [email protected]

2
Table of contents Table of contents ..................................................................................................................................... 2
1 Management Summary ................................................................................................................... 3
2 Definition of the expected issuer margin ........................................................................................ 4
3 Procedure and results of the study ................................................................................................. 6
4 Comparison with the results of other studies ............................................................................... 10
Appendix A: Product selection process for representative and random samples ................................ 14
Appendix B: Valuation procedure, input data and market prices ......................................................... 16
Appendix C: Expected issuer margins - results of the random sample ................................................. 18
Appendix D: Expected issuer margin on issue ....................................................................................... 19
Appendix E: Comparison with other studies ......................................................................................... 24
Appendix F: Analysis of the bid-ask spreads of products without maturity ......................................... 27
References ............................................................................................................................................. 28
This study has been assigned by Deutscher Derivate Verband (DDV), the German Derivatives Association. The authors and involved persons in this study were staff of EDA/ the vwd academy AG, EDG AG, a provider of independent valuation services, and Professor Dr. Lutz Johanning, Academic Director of EDA and EDG, who holds the chair of Empirical Capital Market Research at WHU - Otto Beisheim School of Management in Vallendar, Germany. Professor Dr Lutz Johanning is a member of DDV's Academic Advisory Board. We are deeply grateful to Ralf Andress (Die Welt and Der Zertifikateberater), Daniel Mohr (Frankfurter Allgemeine Zeitung) and Jürgen Röder (Handelsblatt) for their critical input and the discussions concerning the selection process and the overall concept of the study.

3
1 Management Summary Since the beginning of the financial crisis the costs of investment products have been the subject of intensive discussion by financial supervisory authorities, consumer protection organisations and investors. The major concerns are that retail investors will have to shoulder excessive costs and that costs in general are not transparent. During the discussion, cost components incurred when buying a financial product are often not differentiated. So, in a first step all relevant cost components have to be defined and distinguished. Besides acquisition costs, these are in the case of structured (retail) products, in particular, sales commissions and the expected issuer margins. The sales commission is paid for the services provided by the retail bank, primarily to be regarded as the fee paid for investment advice. The expected issuer margin, on the other hand, covers the issuer's operating and structuring costs as well as hedging costs and the cost of capital. In addition, there is the issuer's expected profit which is generally uncertain, for instance with regard to the actual hedging costs. While sales commissions have been disclosed for many years and are therefore transparent for investors, there is no reliable information about the average expected issuer margins. The scope of this study is therefore to determine the expected issuer margins for structured products in Germany in order to give financial supervisory authorities, consumer protection organisations and investors a valid indication about the amount of this rarely known cost component. To calculate the expected issuer margins a representative sample is used that takes account of the actual outstanding investment volumes for structured products. At the same time a second random sample is analysed. The two samples together analyse a total of 3,179 structured products (1,650 structured products in the representative sample and 1,529 in the random sample) as of the valuation date, 31 May 2013. All valuations are performed on the basis of standard valuation models and input factors (prices, implied volatilities, implied dividends, interest rates and an accurate assessment of the issuer risk). The expected issuer margin per product determined in this study results from the difference between the offer price (ask price) for the structured products in question and the valued price (theoretical price). So the theoretical price, which also involves standard assumptions concerning hedging costs and funding revenues, represents an average market price which can also be assumed as a basis for a transaction among professional market participants, such as the purchase of a structured product from another issuer. Any sales commission contained in the price has been deducted from the calculated price difference, so the analysis focuses entirely on the expected issuer margin.1 For the valuation date, 31 May 2013, the representative sample produces an average expected issuer margin of 0.36 percent per annum. This results from the volume-weighted, annualised average2 of the issuer margins of the nine product categories considered. The random sample produces slightly higher results. Here the expected issuer margin amounts to 0.46 percent p.a. on average.3 These differences can be explained by a slightly higher average time to maturity and, in particular, by higher results for products without outstandings.4 Figure 1 shows the results for the representative sample, broken down by product categories. At 0.14 percent p.a. Capital Protection Products with Coupon, the largest product category in terms of outstanding volume, have the lowest expected issuer margin.
1 For a definition of the issuer margin see Chapter 2; for information on the representative as well as the
random sample see Appendix A. 2 The products' average time to maturity is 2.36 years.
3 For the results of the random sample see Appendix C.
4 For the detailed results see Chapter 3 and Appendix C.

4
Uncapped Capital Protection Certificates show an expected issuer margin of 0.73 percent p.a. Together with Capital Protection Products with Coupon, these two product categories account for more than two thirds of the outstanding volume in structured products. Warrants as the smallest product category (share of 0.8 percent of the total volume) have the highest estimated issuer margin of 1.96 percent p.a.
Fig. 1: Expected issuer margins p.a., broken down by product category (representative sample) The results displayed above are valid according to the valuation date, 31 May 2013. Expected issuer margins for structured products at issuance can be determined by means of a cross-sectional regression analysis. The representative sample shows a volume-weighted average expected issuer margin of 0.99 percent p.a. at issuance. Taking into account an average product lifetime of 4.55 years, the nominal value of the expected issuer margin at issuance averages 4.51 percent.5 The results of this study are generally lower than issuer margins calculated in other studies. The reasons for these differences can be diverse. First of all, none of the earlier studies was based on a representative sample. In addition, it can be assumed that expected issuer margins have decreased over time due to increasing efficiency in the structured product market. Furthermore, much of the input data used in earlier studies for valuating structured products is rarely adequate or precise. There are particular shortcomings in the case of implied volatilities, dividends, specific credit risks for the issuer and synchronous time stamps for product prices.
2 Definition of the expected issuer margin The issuer margin is part of the structured product price and the acquisition price respectively that an investor pays on buying a structured product. In order to differentiate the expected issuer margin from other cost components, the structured product price first has to be defined or broken down. In the Notes to the Fairness Code published on 23 October 2013, the Deutscher Derivate Verband has outlined in detail the various price components of structured products. In addition to the theoretical value (or the price of the model components), the structured product price includes hedging costs, funding costs (or funding revenues from the issuer’s point of view), distribution and selling costs (or sales commission) as well as the expected issuer margin. On top of the structured product price, potential acquisition costs for the investor have to be added to (e.g. a front-end load fee where applicable) determine the structured product's acquisition price in total.6 Taking the selected definition as a basis, the expected issuer margin can be seen as a gross amount including actual operating costs for structuring, market making and settlement, as well as a potential expected profit for the issuer. Consequently, the issuer margin in general represents an anticipated value. When the product is sold, the issuer's hedging and funding costs are forecast for the structured product's entire lifetime. However, if the investor prematurely returns the product to the issuer or if the real market parameters differ significantly from those that have been forecast (e.g.
5 For detailed results see Chapter 3 and Appendix D.
6 See Fairness Code, DDV (2013a) as well as the Notes to the Fairness Code, DDV (2013b), page 12 et seq.
Capital
Protection
Products
with Coupon
Uncapped
Capital
Protection
Certificates
Reverse
Convertibles
Express
Certificates
Credit Linked
Notes
Discount
Certificates
Bonus-
Zertifikate
Outperformance
/ Capped
Outperformance
Certificates
Warrants Total
0.14% p.a. 0.73% p.a. 0.65% p.a. 0.66% p.a. 0.37% p.a. 0.50% p.a. 0.52% p.a. 0.93% p.a. 1.96% p.a. 0.36% p.a.

5
volatilities and dividends), the expected issuer margin and the actual issuer margin may differ considerably. As a result, the profit initially expected by the issuer may also turn into a loss ex post. DDV's Fairness Code, in which the issuers that are members of the Association released binding standards for structuring, issuance, marketing, distribution and trading of structured products, inter alia calls for the disclosure of the issuer estimated value (IEV). The difference between the selling price of a structured product at issuance and the issuer estimated value also allows conclusions concerning the amount of the expected issuer margin once any selling and distribution costs have been deducted.7 The issuer estimated value is therefore comparable to the theoretical price used in this study to determine the expected issuer margin, but there are some differences. In this study all products are valued on the basis of average market expectations for input data and the issuers' funding rates. Hedging and funding costs are included as far as they represent average market expectations and standard market assumptions (e.g. barrier shifts in the case of path-dependent components or the implied calculation of funding / credit spreads based on existing bond issues).8 Although the issuer estimated value also takes into account hedging and funding costs, this value is calculated by the issuers themselves and therefore contains internal assumptions regarding input parameters and valuation models. These assumptions can generally be in line with market averages, but may differ significantly in individual cases. The same applies to hedging costs which can be estimated by the issuers on the basis of the individual product or the overall market position. In addition, the actual funding rates may differ from the funding rates based on market parameters, due to an issuer's current liquidity situation. This may also result in discrepancies between the issuer estimated value and the average market price calculated in this study. The calculation of the expected issuer margin, as carried out in this study, is illustrated in Figure 2. The structured product's offer price, seen from the point of view of the structured product's buyer, is taken as a starting point. Accordingly, the displayed issuer margins also include trading costs in the form of the bid-ask spread.9 Sales commissions, which have to be publicly disclosed, are deducted from the difference between the structured product and the theoretical price, at the rate disclosed by the relevant issuers.
7 See DDV (2013a), page 10
8 The buyer of a structured product bears the issuer's default risk (credit risk). For the issuer this results in
funding revenues. The poorer the issuer’s credit rating, the lower the price of the structured product in question, which results in higher funding revenues. . See DDV (2013b), page 12 et seq. Funding revenues, however, not only depend on a bank's credit rating, but also on its funding situation. In times of difficult funding, funding costs are typically lower for the investor. 9 In the case of secondary market products with short holding periods the bid-ask spread may constitute a
substantial part of the expected issuer margin.

6
Fig. 2: Cost components of structured products and expected issuer margin
3 Procedure and results of the study As briefly mentioned, this study gives an overview of the average expected issuer margins for structured products. For this purpose a representative sample with products from nine product categories is build up. After that, expected issuer margins for all selected products are calculated in order to produce volume-weighted averages for all product categories and an overall figure at the end. In addition to the representative sample, a second sample where products have been selected randomly for the same nine product categories is analysed. The product categories for both samples are based on DDV's product classification which consists of 12 product categories in total. These include classical primary market products, such as Capital Protection Products with Coupon and Reverse Convertibles, typical secondary market products,10 such as Discount Certificates and Bonus Certificates, as well as pure leverage products (Warrants and Knock-Out Warrants).11 Out of a total of 12 product categories, the study looks at products from nine product categories (Capital Protection Products with Coupon, Uncapped Capital Protection Certificates, Credit Linked Notes, Reverse Convertibles, Discount Certificates, Express Certificates, Bonus Certificates, Outperformance/Capped Outperformance Certificates and Warrants). Tracker Certificates, Constant Leverage Certificates and Knock-Out Warrants have not been included in the valuation as these products are usually open end and pursue a specific investment objective (e.g. closely tracking the index) or are subject to the continual adjustment of the product terms, which makes it very difficult to perform an exact valuation of these products. Appendix F contains a separate analysis of the bid-ask spread for these product categories.
10
For an explanation of the primary market and the secondary market see comments on page 9. 11
See DDV's product classification at http://www.derivateverband.de/MediaLibrary/Document/Derivate-Liga_A3_2013_EN.pdf
Theoretical (model) price
Expected issuermargin
Structured product price (offer price)
-
=
Consideration of standard assumptions accounting for expected hedging costs
(barrier shifts)
Consideration of funding costs (Calculation on the basis of existing issuer bonds,
funding costs for the investor represent funding revenues for the issuer).
Consideration of trading costs by using the offer price
Distribution and selling costs- Deduction of sales commission included at the valuation date
Contains the following components:
operating costs (staff, platform, trading systems, etc.)
further expected hedging costs and cost of equity
further funding costs depending on issuer’s funding situation
expected profit margin (calculated on the basis of the total portfolio)

7
Having a market share of less than 7 percent of the total outstanding volume, the product categories that have been omitted in the study account for a relatively small proportion of the market.12 Each of the product categories analysed in this study is broken down further according to their relevant product characteristics, such as time to maturity or option strikes. Within these clusters, products are selected on the basis of the volume invested. The study looks at structured products of all issuers represented in the category in question. In total 200 products from each of the nine product categories are selected in this way. However, for Credit Linked Notes only 50 products can be analysed as no ask prices are available for the remaining products at the valuation date, 31 May 2013. The representative sample thus considers a total of 1,650 structured products. In the case of the random sample, 200 products are taken on a random basis from each product category and from all structured products included in the EDG database as of 31 May 2013 neglecting product characteristics and outstanding volumes. The sample for Credit Linked Notes is made up of 50 products, as is the case with the representative selection. The sample is also smaller in the case of Warrants. Here only 79 products are analysed as the remaining 121 Warrants that were randomly selected show characteristics that are exotic in terms of the current market situation (on the valuation date).13 On the whole the random sample thus comprises 1,529 products. Due to the random nature of the selection, the sample largely consists of products without outstanding volumes. In addition, issuers with a large number of products in a certain product category have more products that are analysed.14 To determine the theoretical price, all structured products selected are valued using standard option price models and appropriate methods for each product. While a numerical method and a volatility model are used for exotic options, such as barrier options, closed formulae and the classical Black-Scholes formula can be used for European-style options in equity and index-based investment products. The input factors needed for the various valuation models (volatilities, dividends, interest rates, etc.) are entirely based on observable market parameters. For this purpose (exchange-)traded options are used to calculate implied volatilities (volatility surfaces) and implied dividends for the individual underlying assets. Swap rates are used for the risk-free yield curve. Credit risks and funding costs are considered using credit default swaps (CDS) spreads. CDS spreads sometimes are not reflecting actual market expectations regarding an issuer's default risk, for instance due to lack of liquidity. In these cases the credit risk can be determined by means of issuer-specific spread curves on the basis of existing bonds. The basic option types and the valuation models and methods applied in this study are described in more detail in Appendix B. To calculate the expected issuer margin the theoretical model prices are compared with the ask price for the structured product in question (i.e. the possible buying price that an investor has to pay). The ask price and the price of the underlying asset, which is taken into account in the valuation, are recorded simultaneously (synchronously) in order to avoid differences in valuation due to price changes during the day. The structured product's price data and the price of the underlying asset are recorded on the valuation date, 31 May 2013, before the close of official exchange trading hours, i.e. shortly before 17:30 hours (CET), in order to ensure a liquid trading for the underlying assets.
12
See DDV's market statistics for May 2013, DDV (2013c). 13
As a result, these products have very low prices (less than 50 cents), which could seriously affect the results of the analysis. 14
For an explanation of the taking of samples and descriptive statistics see Appendix A.

8
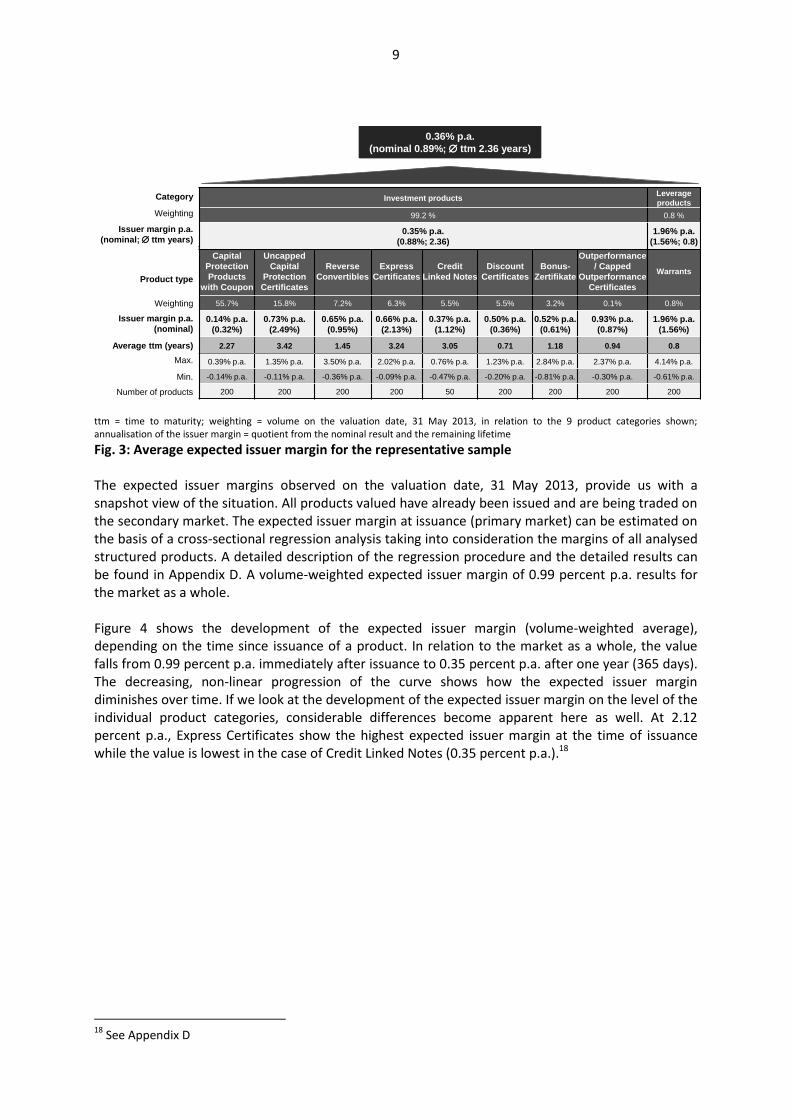
The expected issuer margin, weighted with the relevant volume of the product category, amounts to a total of 0.36 percent per annum (p.a.) for the representative sample. With an average time to maturity of 2.36 years, this corresponds to a nominal expected issuer margin of 0.89 percent (see Fig. 3). At 0.46 percent and 1 percent p.a. the results of the random sample are slightly higher.15 If the results of the representative sample are broken down to the level of the individual product categories they vary considerably. Thus Capital Protection Products with Coupon have the lowest expected issuer margin, amounting to 0.14 percent p.a. These low costs can be explained by the relatively low issuer expenses for hedging and structuring on the one hand and by the high market volume of this product category on the other (55.7 percent of the market volume of the product categories considered in this study). By way of contrast, Outperformance/ Capped Outperformance Certificates, at 0.93 percent p.a., have the highest expected issuer margin, but only a very low market share as they account for only 0.1 percent of the overall volume invested. At the same time, classical primary market products (particularly Uncapped Capital Protection Certificates at 0.73 percent p.a., Reverse Convertibles at 0.65 percent p.a. and Express Certificates at 0.66 percent p.a.) have slightly higher issuer margins in comparison with traditional secondary market products (particularly Discount Certificates at 0.5 percent p.a. and Bonus Certificates at 0.52 percent p.a.). This can be explained by the following differences: primary market products are generally sold to the retail investor through a (bank's own) distribution unit. As a rule, the distribution unit receives intensive support from the issuer (launch of products in accordance with the requirements of the distribution unit, additional documentation, etc.), which is reflected in higher operating costs and higher expected issuer margins. Secondary market products, on the other hand, usually address self-directed investors who obtain their information from publicly available sources. After the existing costs for structuring, marketing, websites and so on the issuer incurs no further expenses. Leverage products, which are represented by the product category of Warrants, have an issuer margin of 1.96 percent p.a. which is significantly higher than the comparable figures for all other investment product categories. This higher-than-average annual margin, however, can be explained by the short average time to maturity of 0.8 years. The maximum and minimum values per annum for the expected issuer margin shown in the following table are calculated by determining the maximum and minimum nominal value for the product category in question and dividing this value by this product's time to maturity.16 For Reverse Convertibles, this results in a maximum expected issuer margin of 3.5 percent p.a.17 and of 0.39 percent p.a. for Capital Protection Products with Coupon.
15
The detailed results of the random sample are presented in Appendix C. 16
The alternative procedure of initially dividing the expected issuer margin by the time to maturity and calculating the maximum and minimum values from this results in high outliers in the case of very short time to maturity, so that the results as a whole are distorted. 17
This product has a time to maturity of little more than one year.
9
ttm = time to maturity; weighting = volume on the valuation date, 31 May 2013, in relation to the 9 product categories shown; annualisation of the issuer margin = quotient from the nominal result and the remaining lifetime Fig. 3: Average expected issuer margin for the representative sample
The expected issuer margins observed on the valuation date, 31 May 2013, provide us with a snapshot view of the situation. All products valued have already been issued and are being traded on the secondary market. The expected issuer margin at issuance (primary market) can be estimated on the basis of a cross-sectional regression analysis taking into consideration the margins of all analysed structured products. A detailed description of the regression procedure and the detailed results can be found in Appendix D. A volume-weighted expected issuer margin of 0.99 percent p.a. results for the market as a whole. Figure 4 shows the development of the expected issuer margin (volume-weighted average), depending on the time since issuance of a product. In relation to the market as a whole, the value falls from 0.99 percent p.a. immediately after issuance to 0.35 percent p.a. after one year (365 days). The decreasing, non-linear progression of the curve shows how the expected issuer margin diminishes over time. If we look at the development of the expected issuer margin on the level of the individual product categories, considerable differences become apparent here as well. At 2.12 percent p.a., Express Certificates show the highest expected issuer margin at the time of issuance while the value is lowest in the case of Credit Linked Notes (0.35 percent p.a.).18
18
See Appendix D
0.36% p.a.
(nominal 0.89%; ttm 2.36 years)
Capital
Protection
Products
with Coupon
Uncapped
Capital
Protection
Certificates
Reverse
Convertibles
Express
Certificates
Credit
Linked Notes
Discount
Certificates
Bonus-
Zertifikate
Outperformance
/ Capped
Outperformance
Certificates
Warrants
55.7% 15.8% 7.2% 6.3% 5.5% 5.5% 3.2% 0.1% 0.8%
0.14% p.a.
(0.32%)
0.73% p.a.
(2.49%)
0.65% p.a.
(0.95%)
0.66% p.a.
(2.13%)
0.37% p.a.
(1.12%)
0.50% p.a.
(0.36%)
0.52% p.a.
(0.61%)
0.93% p.a.
(0.87%)
1.96% p.a.
(1.56%)
2.27 3.42 1.45 3.24 3.05 0.71 1.18 0.94 0.8
0.39% p.a. 1.35% p.a. 3.50% p.a. 2.02% p.a. 0.76% p.a. 1.23% p.a. 2.84% p.a. 2.37% p.a. 4.14% p.a.
-0.14% p.a. -0.11% p.a. -0.36% p.a. -0.09% p.a. -0.47% p.a. -0.20% p.a. -0.81% p.a. -0.30% p.a. -0.61% p.a.
200 200 200 200 50 200 200 200 200
Investment productsLeverage
products
99.2 % 0.8 %
0.35% p.a.
(0.88%; 2.36)
1.96% p.a.
(1.56%; 0.8)
Issuer margin p.a.
(nominal)
Max.
Min.
Product type
Weighting
Weighting
Issuer margin p.a.
(nominal; ttm years)
Category
Number of products
Average ttm (years)

10
Fig.4: Volume-weighted expected issuer margin p.a. depending on the time since launch for the representative sample19
4 Comparison with the results of other studies For purposes of review and comparison of this study, the final chapter gives an overview of the results from earlier studies on issuer margins. Ten studies are described in detail in Appendix E and compared with this survey.20 The aim of this study is to make a representative statement concerning expected issuer margins. Two samples are taken for this purpose - a representative sample and a random sample - with a total of 3,179 products, representing the core of the structured products market. By way of contrast, the ten comparable studies do not take any representative samples, but generally restrict themselves to partial segments of the market, particularly Discount Certificates and Reverse Convertibles with equities and equity indices as underlying assets. Jørgensen/ Nørholm/ Skovmand (2011) analyse only Uncapped Capital Protection Certificates. Furthermore, the samples taken in most comparable studies are small. Exceptions are the work of Stoimenov/ Wilkens (2005) with a sample size of 2,566 products and that of Baule/ Entrop/ Wilkens (2008) with 1,722 products. In a study carried out by the European Securities and Markets Authority on structured products for private investors (ESMA 2013) diverse underlying assets and product types are examined, however the sample, comprising only 76 products, is very small. Such a small sample cannot be seen as representative for the European market as a whole. It can generally be said that, due to the size of their samples and coverage of market segments, none of the comparable studies mentioned are able to make any representative statement regarding a market's expected issuer margins. In most studies the authors limit their research to Discount Certificates, with equities and equity indices as underlying assets, as described above. The valuation is therefore carried out using the classical Black-Scholes model. In the case of barrier products Grünbichler/ Wohlwend (2005), Wallmeier/ Diethelm (2008), Szymanowska/ Horst/ Veld (2009) and the ESMA (2013) study also employ binomial or multi-nominal trees or models with stochastic volatility. This is the approach adopted in this study as well. However, no other study on barrier products takes account of hedging
19
For details on the method of calculation of the results shown in Fig. 4, please see Appendix D 20
See also ESMA (2013), page 22
0.00
0.20
0.40
0.60
0.80
1.00
1.20
0 50 100 150 200 250 300 350 400
Time since issuance (days)
Expected issuer margin p.a. in %(weighted average)

11
costs through barrier shifts. At the end such an assumption leads to an inadequate assessment of the hedging risk. The greatest valuation problems, however, do not arise in relation to the model, but in relation to the selection of data.
As explained in the previous chapter, this study is based on the simultaneous recording of prices for structured products and underlying assets shortly before 17:30 hours (CET). Only Baule/ Rühling/ Scholz (2004) explicitly mention the synchronous capture of prices. As a result, it cannot be ruled out that the other studies contain distorted results due to prices being recorded at different times.
In this study implied volatilities are calculated on the basis of volatility surfaces (determined from implied volatilities). Wallmeier/ Diethelm (2008) and Baule/ Rühling/ Scholz (2004) also use volatility surfaces. In other studies the implied volatility is merely approximated. Wilkens/ Erner/ Röder (2003) calculate the implied volatilities for Discount Certificates and Reverse Convertibles from EUREX options using a three-stage matching procedure and first compare the strike price, then the maturity, and finally the trading time of structured products and EUREX options. Due to the rather poor liquidity and limited availability of benchmarks for individual equities, a difference in the maturities is mandatory. The above-mentioned study uses EUREX options with an average time to maturity of 4 (!) months as a fair benchmark for Discount Certificates with an average time to maturity of 14.4 months. It is a well-known fact that an average time to maturity difference of 10 months can lead to significant valuation differences for option contracts. The empirical models known in the market cause in this case Discount Certificate to be undervalued and therefore the costs to be overestimated.21 Jørgensen/ Nørholm/ Skovmand (2011) use the implied volatilities of a comparable at-the-money option. The ESMA (2013) study works with both implied and historical volatilities.
In the present study dividend expectations are implied from option prices. This is a procedure followed by no other study. Frequently, historical dividends or dividends reported by the media are used, such as by Wilkens/ Erner/ Röder (2003), Stoimenov/ Wilkens (2005), Grünbichler/ Wohlwend (2005), Wallmeier/ Diethelm (2008) and Baule/ Entrop/ Wilkens (2008). The ESMA (2013) report uses dividend forecasts or historical dividends.
The bid-ask spread (i.e. valuation at offer prices) is only considered by Grünbichler/ Wohlwend (2005). This means that the expected issuer margin from the buyer's perspective is underestimated in most analyses.
Most studies do take account of the issuers' credit risk. The models used, however, differ significantly. Wilkens/ Erner/ Röder (2003) work on the general assumption of 1 percent as a
21
Taking account of the empirical observation that the implied volatility smile effect is much greater in the case of shorter time to maturities, this would mean that the volatility selected for implied options that are not at-the-money is too high. As a result, the short component of the structured product is overvalued and ultimately the structured product itself is significantly undervalued. In order to take account of an issuer's default risk in the structured product price, Wilkens/ Erner/ Röder (2003) choose to adjust the interest rate through a general 1 percent mark-up on the Euribor. It is questionable whether an adjustment of this size is reasonable. A further indication of the overvaluation of the adjustment is provided by Benet/ Gianetti/ Pissaris (2006), who carry out a similar study for the US market. They draw attention to what is known as ‘credit enhancement’, which ultimately means that corporate bonds with concave payout profiles (as is the case with Reverse Convertibles and Discount Certificates) have a lower default risk than traditional bonds. This can be explained by a positive correlation between a company's performance and the final cash amount. The overestimation of the adjustment with an interest rate that is probably too high leads to an undervaluation of the structured product's cash component. In addition, if the interest rate is too high, this may increase the value of the call-option component, which leads to an underestimation of the model price in a similar way to that described above.

12
credit risk spread. Wallmeier/ Diethelm (2008) work on an assumption of 0.25 percent, if there are no credit default swap spreads (CDS spreads). In this study, the credit risk is determined by means of issuer bonds if no reliable information can be derived from CDS spreads, for instance due to a lack of liquidity. Szymanowska/ Horst/ Veld (2009) and Baule/ Entrop/ Wilkens (2008) also use credit spreads from issuer bonds. In the ESMA (2013) report, the issuer risk is extracted from issuer bonds, ratings and CDS spreads.
Possible sales commissions, which may be included in the expected issuer margins, are disregarded in all comparative studies. Only Henderson/ Pearson (2011) guess that a part of the high margin of 8.8 percent they observe could be sales commissions. Neglecting to consider possible sales commissions means that expected issuer margins may be overestimated in comparable studies.
The analysis of the model parameters used for the valuation of the products shows many valuation differences, which considerably limits the comparability of the studies. The fact that comparable studies show significant shortcomings in terms of valuation, for instance in the calculation of implied volatilities and dividends, causes doubts on the suitability of these studies for a reliable valuation of expected issuer margins. These shortcomings are also directly apparent in the results, particularly in the minimum values for expected issuer margins. For example, Wilkens/ Erner/ Röder (2003) arrive at a minimal margin of minus 4.2 percent for Reverse Convertibles and of minus 2.3 percent for Discount Certificates. This would imply that the bank selling the structured products suffers a direct loss equivalent to these percentages - a most unrealistic scenario. Negative issuer margins may indeed result from differences in methods and data, but should only be slight in terms of the amounts in question (i.e. only a few basis points). Among other studies, the minimal margins shown in the studies by Stoimenov/ Wilkens (2005) are particularly remarkable, namely minus 16.6 percent in the primary market and minus 22 percent in the secondary market for equity products, as are those of Jørgensen/ Nørholm/ Skovmand (2011), who arrive at a value of minus 4.1 percent for the primary market. Figures like these can only be explained by valuation errors. In this study the minimum expected issuer margin for the secondary market is only minus 0.5 percent.22 In addition to the valuation problems highlighted and the various ranges of products and underlying assets, differences in the periods covered by the studies and the different maturities of the products make it even more difficult to compare the results. Over the years, the market for structured retail derivatives has become increasingly more efficient, which should be generally reflected in the studies by a decline in expected issuer margins. As different product lifetimes should definitely be taken into account, this study quotes expected issuer margins on a per annum (p.a.) basis. As a rule the costs, and therefore the expected issuer margins, rise with the time to maturity.23 If the annual values for expected issuer margins are roughly estimated from the nominal values quoted in the studies and from the average time to maturity (if available), the resulting values are higher than those observed in this study, namely 0.99 percent p.a. for the primary market and 0.36 percent p.a. for the secondary market. For the primary market Stoimenov/ Wilkens (2005) arrive at
22
Even if this figure generally underlines the validity of the valuations carried out in this study, it must nevertheless be assumed that these valuations are different from those made by issuers, as the latter use even more exact data. 23
As Wilkens/ Erner/ Röder (2003) show, structured products, for example, usually have a longer lifetime than available EUREX options. This means that the structured product cannot be replicated with other products. For the issuer this results in higher hedging costs, which are reflected in the price. When discussing the costs that are factored in, account must furthermore be taken of the fact that partial costs may be economically justified (see Benet/ Gianetti/ Pissaris 2006). The justification for an implied premium results from the market enhancement through structured products.

13
an expected issuer margin of between 1.4 percent and 2.7 percent p.a., Jørgensen/ Nørholm/ Skovmand (2011) at a margin of 1.6 percent p.a., and Henderson/ Pearson (2011) at very high margins of 7.7 percent p.a. (equally weighted) and 6.7 percent p.a. (volume-weighted). The ESMA (2013) study determines expected issuer margins of 1.5 percent p.a. without credit risk and 1.8 percent p.a. with credit risk. For the secondary market Wilkens/ Erner/ Röder (2003) even calculate expected issuer margins of between 2.5 percent and 4 percent p.a. for Reverse Convertibles and of between 3.5 percent and 5.7 percent p.a. for Discount Certificates. Future studies should use precise data, as in this study, in order to rule out any valuation errors. An analysis for primary market products can provide further insight into expected issuer margins.

14
Appendix A: Product selection process for representative and random samples Representative sample The representative selection of products is based on product characteristics and the actual volumes invested in such products. Due to the large number of offered products on the structured products market, it is reasonable to examine products with volumes invested, as in this case an investment has already taken place and the issuer margin has already been received. Product characteristics on the other hand play such an important role because they reflect the different nature of the products within a product category. Hence the 12 product categories of the DDV categorisation are subdivided into further subcategories (e.g. structures with caps or reverse structures). Furthermore there are different maturities and differences in the case of moneyness (the relationship between the price of the underlying asset and the strike price, such as in the case of Discount Certificates). All these factors without exception have to be taken into account in a representative selection. In consequence, the representative selection of products is carried out on the basis of classes (clusters), each reflecting all product characteristics. Each of the clusters determined in this way is filled with products, taking account of outstanding volumes. At the end 200 products in total are selected representatively across the individual clusters (i.e. volume-weighted). Particular attention is paid on selecting structured products from all issuers offering products in the individual clusters. Random sample The random product selection is used as a second sample to determine the issuer margin. 200 products from each product category are taken by a random selection process, irrespective of product features and outstanding volumes. The product universe for the random sample is made up from all structured products contained in EDG's databases. Issuers who, in comparison with their competitors, offer more products than average in individual product categories are more often represented in the random sample, as can be expected.
Fig. A1: Procedure for selecting products for representative and random samples In principle, the study analyses structured products with the most common underlying assets. This includes both index-related underlying assets and individual securities such as equities, commodities and currencies as underlying assets. In addition to this, the study analyses interest-linked products (Capital Protection Products with Coupon and Credit Linked Notes).
All structured products tradable at
exchanges in Germany
Representative
selection
Random
selection
Product categories of the DDV
Derivatives League
Subcategories
Issuance /
Maturity
Moneyness
Product
selection
Product
selection
Volume
invested >0

15
Underlying asset Representative
sample Random
Sample Indices 545 452 Interest rate products 250 250 Commodities and currencies 13 10 Equities 842 817 Total 1650 1529 Table A1: Overview of categories of underlying assets for the products analysed in both samples

16
Appendix B: Valuation procedure, input data and market prices To determine the expected issuer margin, all selected structured products are valued using established option pricing models and methods. The structured products are broken down into individual components (options) - as far as possible - so that the combination of the individual derivative components fully reflects the product's pay off conditions.24 ‘Simple’ product categories, such as Discount Certificates, can therefore be replicated through the buy position of a call option with a strike of zero (zero strike calls) and the sell position of a call option with a strike equivalent to the amount of the cap. However, it is not possible or does not make sense to disassemble other product types in this way as the components would be just as complex as the product as a whole. Express Certificates serve as a good example here. Due to the possibility of early redemption, the components showing the annual payments would have to be mutually dependent, i.e. on repayment in the first year the remaining options for the following years expire worthless. Below follows a general discussion of the basic types of options as well as suitable valuation models and methods. European-style options and the Black-Scholes formula European-style options, which can be used for replication as described above, such as in the case of Discount Certificates, are generally valued applying the Black-Scholes model. One assumption made by the Black-Scholes model is constant volatility throughout the maturity of an option.25 As these and other assumptions of the model do not reflect reality, the model is applied in practice with different volatilities per strike price and maturity of options. If the implied volatilities are determined on the basis of traded option prices, a volatility surface dependent on strike price and maturity is the result. There is a formula for valuing European options using the assumption of the Black-Scholes model. In the case of exotic options although a valuation on the basis of Black-Scholes assumptions using a numerical method, such as Monte Carlo simulation, is possible but results in particular can differ significantly from market standards. This will be explained in the next section using the example of a barrier option. Barrier options and path dependency Barrier options are exotic options whose existence depends on whether the underlying asset hits a certain price level (barrier) in a certain period of time or whether it exceeds or stays below this level. When valuing this type of option not only the price of the underlying asset on maturity is relevant, but also the price movements during the option's lifetime. So these options are called ‘path-dependent’. For valuation, it is therefore not only the average volatility for the overall maturity that plays a role, but also how it develops. Hence, in empirical terms, there is a negative correlation between the price of an underlying asset and volatility, i.e. volatility usually increases when prices are falling.26 This logically has significant effects on the price of a barrier option, as rising volatility makes it more likely that the barrier will be reached. The negative correlation between volatility and price development therefore lowers the price. The assumption of constant volatility would thus lead to an overvaluation of the option component. The situation is similar in the case of Express Certificates which are also path-dependent due to the possibility of an early redemption.
24
Due to the put-call parity there are several, equally good ways of replicating a product. 25
See Black/ Scholes (1973), page 640 26
See Ait-Sahalia/ Fan/ Li (2013), page 224

17
In the present study, path-dependent options and products are valued using a determinist volatility model, known as ‘local volatility’ where volatility is modelled as a parameter depending on time and the underlying asset. This model thus takes account of the negative correlation between price and volatility.27 No formula exists for the local volatility model, so that numerical methods, particularly Monte Carlo simulation, are used here. A further assumption made by the Black-Scholes model is the possibility of continuous trading. In reality, however, trading times and the number of trading days are limited, so that this assumption is refuted. New information about the underlying asset outside the trading hours will inevitably lead to jumps in the asset price when exchanges open. To take account for this so called ‘gap risk’, an adjustment to the barrier known as the ‘barrier shift’ is made for barrier options, i.e. the option is valued with a virtual barrier.28 The use of barrier shifts therefore makes it possible to at least partly take account of hedging costs when determining the issuer margin (for the term ‘hedging costs’ please refer to Chapter 229). The exact level of barrier shifts is not generally known to the public. In the present study, an empirical value is therefore taken from past valuation processes and a general barrier shift of 2 percent is assumed (or 1 percent in the case of auto-callable structures such as Express Certificates). Calibration of the valuation models The input factors needed for the various valuation models (volatilities, dividends, interest rates, etc.) are entirely based on observable market parameters. Thus (exchange-)traded options are used, for instance, to calculate implied volatilities and dividends for the individual underlying assets. Swap rates are used for the risk-free yield curve. Consideration of the credit risk The issuer's credit risk is generally shown through outstanding credit default swaps (CDS. If the credit default swaps are not appropriate, for instance due to a lack of liquidity, issuer-specific spread curves are determined on the basis of liquid outstanding bonds (interest products) from the issuer in question. A bootstrap procedure is used for this purpose and it is ensured that the bonds in question reflect the maturities of the structured products being valued as precisely as possible. In this way a specific spread curve is created for each issuer (based on credit default swaps and/or bond spreads) which is used as a tool for valuing the structured products as it shows the credit risk over the same time to maturity.
27
See Dupire (1994) 28
See de Weert (2011), pages 58 to 60 29
As well as DDV (2013b)

18
Appendix C: Expected issuer margins - results of the random sample At 0.46 percent p.a. the results of the random sample for the average expected issuer margin, are generally to some extent higher than the comparable results from the representative sample. This can initially be explained by a slightly higher average time to maturity of 2.58 years; a further factor being the higher results for Warrants (3.57 percent p.a.) and Bonus Certificates (1.06 percent p.a.). In contrast to the representative sample, where the structured products are selected on the basis of the volume invested, the random sample contains many products where no volume is invested. This is the case, for instance, with the Bonus Certificate with an expected issuer margin of 14.5 percent p.a. (maximum rate for Bonus Certificates). This product is a Reverse Bonus Certificate which, due to the positive development of the market (which therefore negatively affects the product) and the short remaining time to maturity of 0.31 years on the relevant valuation date, involves great risks. This may lead to heavy price jumps, both upwards and downwards, with correspondingly high hedging risks for the issuer. These are reflected in the nominal expected issuer margin of 4.45 percent. As no volume is invested in the product, it is quite probable that the issuer of this financial instrument has a very high ask price due to the high hedging costs to be expected and does not even have any interest in selling the product. It can therefore be assumed that the random sample contains products that, due to their structure, do not represent the investment market and do not reflect the current market situation as well.30 Even though the results of the random sample do not differ significantly from those of the representative sample, a slight distortion of the results can be expected in the case of the random sample.
ttm = time to maturity; weighting = volume on the valuation date, 31 May 2013, in relation to the 9 product categories shown, annualisation of the issuer margin = quotient from the nominal result and the remaining lifetime
Fig. C1: Average expected issuer margin for the random sample
30
The Bonus Certificate with the second-highest expected issuer margin p.a. has a rate of 3.09 percent p.a.
0.46% p.a.
(nominal 1.00%; ttm 2.58 years)
Capital
Protection
Products
with Coupon
Uncapped
Capital
Protection
Certificates
Reverse
Convertibles
Express
Certificates
Credit
Linked Notes
Discount
Certificates
Bonus-
Zertifikate
Outperformance
/ Capped
Outperformance
Certificates
Warrants
55.7% 15.8% 7.2% 6.3% 5.5% 5.5% 3.2% 0.1% 0.8%
0.14% p.a.
(0.37%)
0.93% p.a.
(3.13%)
1.11% p.a.
(0.80%)
0.49% p.a.
(1.45%)
0.30% p.a.
(1.14%)
0.87% p.a.
(0.82%)
1.06% p.a.
(0.84%)
1.24% p.a.
(1.35%)
3.57% p.a.
(2.81%)
2.71 3.37 0.79 2.94 3.84 0.94 0.79 1.09 0.79
0.42% p.a. 1.35% p.a. 3.07% p.a. 4.44% p.a. 0.76% p.a. 3.02% p.a. 14.50% p.a. 3.11% p.a. 7.93% p.a.
-0.22% p.a. -0.39% p.a. -0.96% p.a. -0.10% p.a. -0.06% p.a. -0.19% p.a. -0.83% p.a. -0.57% p.a. -0.77% p.a.
200 200 200 200 50 200 200 200 79
Investment productsLeverage
products
99.2 % 0.8 %
0.43% p.a.
(0.98%; 2.57)
3.57% p.a.
(2.81%;0.79)
Issuer margin p.a.
(nominal)
Max.
Min.
Product type
Weighting
Weighting
Issuer margin p.a.
(nominal; ttm years)
Category
Number of products
Average ttm (years)

19
Appendix D: Expected issuer margin on issue The estimate using cross-sectional regression to determine the expected issuer margin on issue is carried out using the following model: Expected issuer margin = b1*DReverse Convertibles + b2*DCredit Linked Notes + b3*DBonus Certificates + b4*DDiscount Certificates + b5*DExpress
Certificates + b6*DUncapped Capital Protection Certificates + b7*DOutperformance Certificates + b8*DCapital Protection Products with Coupon + b9*DReverse Convertibles *Remaining lifetime + b10*DReverse Convertibles*ln(remaining lifetime) + b11*DReverse Convertibles *time since launch + b12*DReverse Convertibles*ln(time since launch) + … (by analogy for the other 7 product types)… + error term
The OLS estimate, adjusted for heteroscedasticity according to White, results in the following estimates:
Adjusted coefficient of determination 0.53
Observations 1450 (Estimate without Warrants)
coefficients standard errors (t) statistical values
DReverse Convertibles 26.234 25.122 1.04
Dcredit Linked Notes -28.842 39.332 -0.73
Dbonus Certificates 32.277 22.405 1.44
Ddiscount Certificates 4.8361 14.327 0.34
Dexpress Certificates 184.73 67.973 2.72
Duncapped Capital Protection Certificates -394.54 65.586 -6.02
Doutperformance Certificates -184.79 57.009 -3.24
Dcapital Protection Products with Coupon 64.951 16.139 4.02
Dreverse Convertibles *remaining lifetime 5.7188 12.078 0.47
Dreverse Convertibles *ln(remaining lifetime) 59.757 24.918 2.40
Dreverse Convertibles *time since launch 22.323 22.902 0.97
Dreverse Convertibles *ln(time since launch) -36.728 11.483 -3.20
Dcredit Linked Notes *remaining lifetime 136.85 21.428 6.39
Dcredit Linked Notes *ln(remaining lifetime) -307.94 58.117 -5.30
Dcredit Linked Notes* time since launch -15.768 17.131 -0.92
Dcredit Linked Notes*ln(time since launch) -3.0212 16.587 -0.18
Dbonus Certificates* remaining lifetime 6.1432 13.341 0.46
Dbonus Certificates*ln(remaining lifetime) 42.529 20.032 2.12
Dbonus Certificates* time since launch 11.978 8.7544 1.37
Dbonus Certificates*ln(time since launch) -33.86 12.357 -2.74
Ddiscount Certificates*remaining lifetime 39.485 11.64 3.39
Ddiscount Certificates*ln(remaining lifetime) -6.9982 11.145 -0.63
Ddiscount Certificates* time since launch -1.188 3.258 -0.36
Ddiscount Certificates*ln(time since launch) -9.7862 4.011 -2.44
Dexpress Certificates* remaining lifetime -107.76 26.872 -4.01
Dexpress Certificates*ln(remaining lifetime) 234.41 62.25 3.77
Dexpress Certificates* time since launch 69.585 27.388 2.54
Dexpress Certificates*ln(time since launch) -161.6 24.287 -6.65 Duncapped Capital Protection Certificates*remaining lifetime 192.77 38.833 4.96

20
Duncapped Capital Protection Certificates*ln(remaining lifetime) -173.39 81.406 -2.13 Duncapped Capital Protection Certificates* time since launch 58.166 11.849 4.91 Duncapped Capital Protection Certificates*ln(time since launch) 44.129 35.851 1.23 Doutperformance Certificates*remaining lifetime 258.72 49.456 5.23 Doutperformance Certificates*ln(remaining lifetime) -145.29 42.805 -3.39 Doutperformance Certificates*time since launch 1.0733 15.625 0.07 Doutperformance Certificates*ln(time since launch) -2.0558 11.585 -0.18 Dcapital Protection Products with Coupon* remaining lifetime 0.97983 6.4791 0.15 Dcapital Protection Products with Coupon*ln(remaining lifetime) -20.286 8.3995 -2.42 Dcapital Protection Products with Coupon* time since launch 15.719 8.2589 1.90 Dcapital Protection Products with Coupon*ln(time since launch) -73.483 17.154 -4.28
Table D1: Results of the cross-sectional regression analysis for the representative sample The following steps have to be carried out to arrive at the results shown in Fig. 4 (only significant regression results on the 1 percent level are used):
1. Variation of the ‘times since issuance‘ (from 1 day, i.e. at issuance, up to 1 year), corresponding adjustment of the time to maturities
2. ‘Times since issuance’ and ‘time to maturity’ are average values for the 8 product types (without Warrants) from the representative sample
3. Example Capital Protection Product with Coupon:
Average time to maturity 2.27 years, average time since issuance 2.61 years
Assuming ‘time since issuance‘ = 1/365 year (=1 day)
Time to maturity = 2.27 years + 2.61 years – 1/365 year 4. Margin p.a. = margin/ Time to maturity 5. Weighted mean = weighting of the margins p.a. for the 8 product types
(investment products only) according to the following table
Note: As Warrants are not included, the remaining products are reweighted, so that the total sum of all weights of all investment products equals 100 percent.
Table D2: Descriptive statistics for the product categories used in the regression analysis for the representative sample
weighting avg. maturity avg. time to maturity avg. time since issuanceReverse Convertibles 0.0725 2.1083 1.4525 0.6558
Credit Linked Notes 0.0549 4.6661 3.0499 1.6162
Bonus Certificates 0.0319 2.2114 1.1793 1.0321
Discount Certificates 0.0549 2.0068 0.7121 1.2948
Express Certificates 0.0637 4.6982 3.2390 1.4592
Uncapped Capital Protection Certificates0.1593 5.9320 3.4170 2.5150
Outperformance Certificates 0.0011 1.7228 0.9404 0.7825
Capital Protection Products with Coupon0.5615 4.8826 2.2658 2.6167
weight. average 1.0000 4.5783 2.3739 2.2044

21
Fig. D1: Expected issuer margin p.a. depending on the time since issuance for the representative sample Using the same procedure, the following results are obtained for the random sample:
Adjusted coefficient of determination 0.37
Observations 1529
coefficients standard error (t) statistical values
DReverse Convertibles 91.276 25.122 1.0442
DCredit Linked Notes 57.564 39.332 -0.7333
DBonus Certificates 150.75 22.405 1.4406
DDiscount Certificates 19.224 14.327 0.3376
DExpress Certificates 107.31 67.973 2.7177
DUncapped Capital Protection Certificates -424.53 65.586 -6.0155
DOutperformance Certificates -179.02 57.009 -3.2414
DCapital Protection Products with Coupon 44.03 16.139 4.0243
DReverse Convertibles*remaining lifetime 28.399 12.078 0.4735 DReverse Convertibles*ln(remaining lifetime) 34.448 24.918 2.3982
DReverse Convertibles*time since launch -28.162 22.902 0.9747
DReverse Convertibles*ln(time since launch) 4.9424 11.483 -3.1984
DCredit Linked Notes*remaining lifetime 120.88 21.428 6.3867
DCredit Linked Notes*ln(remaining lifetime) -316.7 58.117 -5.2987
DCredit Linked Notes*time since launch -28.948 17.131 -0.9204
DCredit Linked Notes*ln(time since launch) -20.646 16.587 -0.1821
DBonus Certificates*remaining lifetime -30.152 13.341 0.4605
0.00
0.50
1.00
1.50
2.00
2.50
0 50 100 150 200 250 300 350 400
Time since issuance (days)
Expected issuer margin p.a. in %Reverse Convertibles
Credit Linked Notes
Bonus Certificates
Discount Certificates
Express Certificates
Uncapped CapitalProtection CertificatesOutperformanceCertificatesCapital Protection Productswith Couponweight. average
1 7 15 30 60 90 120 180 270 365
Reverse Convertibles 1.03 0.70 0.57 0.45 0.34 0.28 0.23 0.16 0.08 0.00
Credit Linked Notes 0.35 0.35 0.35 0.35 0.34 0.33 0.33 0.31 0.30 0.28
Bonus Certificates 0.90 0.61 0.50 0.40 0.30 0.24 0.20 0.14 0.07 0.00
Discount Certificates 0.39 0.39 0.39 0.39 0.39 0.39 0.39 0.39 0.39 0.39
Express Certificates 2.12 1.46 1.20 0.97 0.75 0.63 0.55 0.43 0.33 0.25
Uncapped Capital Protection Certificates 0.82 0.97 1.02 1.07 1.12 1.15 1.17 1.20 1.23 1.25
Outperformance Certificates 1.05 1.05 1.04 1.02 0.99 0.95 0.92 0.84 0.73 0.68
Capital Protection Products with Coupon 1.02 0.73 0.62 0.52 0.42 0.36 0.32 0.27 0.21 0.17
weight. average 0.99 0.77 0.69 0.61 0.54 0.50 0.47 0.42 0.38 0.35
Time since issuance (days)
Expected issuer margin p.a. in %

22
DBonus Certificates*ln(remaining lifetime) 53.31 20.032 2.1230
DBonus Certificates*time since launch -48.357 8.7544 1.3682
DBonus Certificates*ln(time since launch) 0.25193 12.357 -2.7402
DDiscount Certificates*remaining lifetime 68.087 11.64 3.3921
DDiscount Certificates*ln(remaining lifetime) 21.396 11.145 -0.6279
DDiscount Certificates*time since launch 0.65568 3.258 -0.3647
DDiscount Certificates*ln(time since launch) -5.2318 4.011 -2.4398
DExpress Certificates* remaining lifetime -36.083 26.872 -4.0101
DExpress Certificates*ln(remaining lifetime) 51.982 62.25 3.7657
DExpress Certificates*time since launch 69.806 27.388 2.5407
DExpress Certificates*ln(time since launch) -115.82 24.287 -6.6538 DUncapped Capital Protection Certificates*remaining lifetime 215.84 38.833 4.9641 DUncapped Capital Protection Certificates*ln(remaining lifetime) -147.02 81.406 -2.1299 DUncapped Capital Protection Certificates*time since launch 37.343 11.849 4.9090 DUncapped Capital Protection Certificates*ln(time since launch) 44.129 35.851 1.2309 DOutperformance Certificates*remaining lifetime 260.02 49.456 5.2314 DOutperformance Certificates*ln(remaining lifetime) -110.39 42.805 -3.3942 DOutperformance Certificates*time since launch 3.6821 15.625 0.0687 DOutperformance Certificates*ln(time since launch) -19.081 11.585 -0.1775 DCapital Protection Products with Coupon* remaining lifetime -6.7779 6.4791 0.1512 DCapital Protection Products with Coupon *ln(remaining lifetime) 18.161 8.3995 -2.4152 DCapital Protection Products with Coupon *time since launch 42.742 8.2589 1.9032 DCapital Protection Products with Coupon *ln(time since launch) -140.86 17.154 -4.2837
Table D3: Results of the cross-sectional regression analysis in the case of the random sample
(Note: As Warrants are not included, the remaining products are reweighted, so that the total sum of all weights of all investment products equals 100 percent.) Table D4: Descriptive statistics for the product categories used in the regression for the random sample
weighting avg. maturity avg. time to maturity avg. time since issuance
Reverse Convertibles 0.0725 1.2746 0.7244 0.5502
Credit Linked Notes 0.0549 4.8308 3.8436 0.9872
Bonus Certificates 0.0319 1.2479 0.7864 0.4615
Discount Certificates 0.0549 1.7322 0.9407 0.7915
Express Certificates 0.0637 4.5889 2.9471 1.6418
Uncapped Capital Protection Certificates 0.1593 5.9756 3.3735 2.6021
Outperformance Certificates 0.0011 1.6246 1.0865 0.5381
Capital Protection Products with Coupon 0.5615 5.0517 2.7148 2.3368
weight. average 1.0000 4.5759 2.5915 1.9844

23
(Note: As only significant regression results on the 1 percent level are used, no estimates are possible for Reverse Convertibles, Credit Linked Notes, Bonus Certificates and Discount Certificates).
Fig. D2: Expected issuer margin p.a. in percent depending on the time since issuance for the random sample
0.00
0.20
0.40
0.60
0.80
1.00
1.20
1.40
0 50 100 150 200 250 300 350 400
Time since issuance (days)
Expected issuer margin p.a. in %(weighted average)
0.00
0.20
0.40
0.60
0.80
1.00
1.20
1.40
1.60
1.80
2.00
0 50 100 150 200 250 300 350 400
Time since issuance (days)
Expected issuer margin p.a. in % Reverse Convertibles
Credit Linked Notes
Bonus Certificates
Discount Certificates
Express Certificates
Uncapped CapitalProtection CertificatesOutperformanceCertificatesCapital Protection Productswith Couponweight. average
1 7 15 30 60 90 120 180 270 365
Reverse Convertibles 0.00 0.00 0.00 0.00 0.00 0.00 0.00 0.00 0.00 0.00
Credit Linked Notes 0.00 0.00 0.00 0.00 0.00 0.00 0.00 0.00 0.00 0.00
Bonus Certificates 0.00 0.00 0.00 0.00 0.00 0.00 0.00 0.00 0.00 0.00
Discount Certificates 0.00 0.00 0.00 0.00 0.00 0.00 0.00 0.00 0.00 0.00
Express Certificates 1.72 1.24 1.06 0.89 0.74 0.66 0.61 0.55 0.50 0.49
Uncapped Capital Protection Certificates1.01 1.15 1.21 1.26 1.30 1.33 1.34 1.36 1.37 1.38
Outperformance Certificates 1.17 1.16 1.15 1.13 1.09 1.04 1.00 0.90 0.73 0.57
Capital Protection Products with Coupon1.65 1.11 0.90 0.71 0.52 0.41 0.33 0.22 0.10 0.00
weight. average 1.20 0.89 0.76 0.66 0.55 0.48 0.44 0.38 0.31 0.25
Time since issuance (days)
Expected issuer margin p.a. in %

24
Appendix E: Comparison with other studies Author Sample, country, period, product category,
average lifetime Average result/ minimum / maximum
Estimated expected issuer margin p.a.
Method Input data
Wilkens/ Erner/ Röder (2003)
906, Germany, 2001, Equity products, 0.74 to 1.2 years
Secondary market: Reverse Convertibles: 3% / -4.2% / 8.3% Discount Certificates: 4.2% / -2.3% / 20%
Secondary market: Reverse Convertibles: 2.5% - 4% Discount Certificates: 3.5% - 5.7%
Black-Scholes Valuation of closing prices
Discrete dividend estimates by OnVista
Implied volatilities from Eurex options, matching through strike price, maturity, trading time (no volatility surfaces)
Credit risk through Lehman Brothers indices (assumption 1 percent)
No account taken of bid-ask spread
Sales commissions not taken into account
No assumptions regarding hedging costs in the case of barrier products
Baule/ Rühling/ Scholz (2004)
272, Germany, 2003, DAX Discount Certificates
Secondary market: 0.9% / -1.2% / 3.8%
Black-Scholes Valuation at prices before 20.00 hours (CET) (synchronous prices for structured product and DAX index)
Implied volatilities from Eurex options (volatility surfaces)
No statement regarding consideration of the credit risk
No account taken of bid-ask spreads
No information about sales commissions
Stoimenov/ Wilkens (2005)
2566, Germany, 2002, Equity and DAX products, average maturity at issue 1.47 years
Primary market: 3.9% / -16.6% / 35.9% for equity products , 2.1% / 2.1% / 16.3% for DAX products Secondary market: 2.3% / -22% / 27.6% for equity products, -0.1% / -4.7% / 12.9% for DAX products
Primary market: 1.4% - 2.7%
Black- Scholes Valuation at closing prices
Discrete dividend estimates from the media
Implied volatilities from Eurex options (volatility surfaces)
Consideration of the issuer risk from issuer bonds
No account taken of bid-ask spreads
No information as to whether the margin includes sales commissions
No assumptions regarding hedging costs in the case of barrier products
Grünbichler/ Wohlwend (2005)
192, Switzerland, 1999-2000, Equity products, 1.05 years average remaining maturity
Information about differences in volatilities of structured product and comparable Eurex option (negative difference implies disadvantage for investors) Primary market: -4.3% / -19.7% / 8.1%
Black-Scholes; Binomial trees
Closing and settlement prices
Effective and historical dividends
Implied volatilities from Eurex options (no volatility surfaces)
Consideration of the issuer risk from swap rates
Account taken of bid-ask spreads
Sales commissions not taken into account

25
Secondary market: -1.7% / -21.66% / 17%
No assumptions regarding hedging costs in the case of barrier products
Wallmeier/ Diethelm (2008)
468, Switzerland, End of April 2007, Barrier Reverse Convertibles on equities
Primary market: At-the-money volatility: 3.4% / -2.5% / 11.4% Out-of-the-money volatility - barrier: 6% / 1.5% / 12.9%
Black-Scholes, Multi-nominal processing trees
Implied volatility for volatility surfaces (Eurex settlement prices)
Constant dividends from 2006
Credit risk through credit default swaps, if available; otherwise 0.25 percent assumed
No information about time stamps, hedging costs, sales commissions, bid-ask spreads
Szymanowska/ Horst/ Veld (2009)
75, Netherlands, 1999-2002, Reverse Convertibles
Primary market: 5.7% / -0.5% / 13.5% Secondary market: Decrease of price differences six months after issuance
Black-Scholes, Stochastic volatility model
Equity prices from Datastream
Implied volatilities through weighted average from implied volatilities with similar time to maturity and moneyness (no volatility surfaces)
Dividends from Datastream
No specific information regarding time stamps
Consideration of the issuer risk from issuer bonds
No account taken of bid-ask spread
No information about sales commissions
No assumptions regarding hedging costs in the case of barrier products
Baule/ Entrop/ Wilkens (2008)
1722, Germany, 27 February 2004, Discount Certificates, 0.5-2 years lifetime
Secondary market: Five issuers between 0.8% and 1.4%
Black-Scholes No information about time stamps
Implied volatilities through volatility surfaces
Dividend expectations through OnVista
Consideration of the issuer risk from issuer bonds
No account taken of the bid-ask spread
No assumptions regarding hedging costs in the case of barrier products
Jørgensen/ Nørholm/ Skovmand (2011)
300, Denmark, 1998-2009, Uncapped Capital Protection Certificates, 3.8 years lifetime
Primary market: Total costs: 6.2% / -4.1% / 18.8% Hidden costs: 2.8% / -8.3% / 12.6%
Primary market: Total costs: 1.6%
Black- Scholes
Implied volatilities through comparable ATM option
No information about dividends
No specific information about time stamps
No account taken of the issuer risk (LIBOR rates used for discounting the bond components)
No account taken of the bid-ask spread
Sales commissions taken into account (total costs versus hidden costs)
No assumptions regarding hedging costs for barrier products

26
Henderson / Pearson (2011)
64, USA, 2001-2005, Equity index products, 1.15 years average maturity (callable after six months)
Primary market: equally-weighted: 8.8% / 0.6% / 23.5% volume-weighted: 7.7%
Primary market: 7.7% equally-weighted 6.7% volume-weighted
Black-Scholes Implied volatilities from OptionMetrics database (no volatility surfaces)
Equity prices from CRSP, LIBOR from Bloomberg
No information about time stamps
Authors finally suppose that high margins are partially used for sales commission.
No information about dividend estimates, hedging costs, bid-ask spreads, issuer risk
ESMA Report (2013) 76, Europe, 2008-2011, various underlying assets and product types (79 percent equity indices), 3 years
Primary market: without credit risk: 4.6% / -2.6% / 17.8% with credit risk: 5.5%
Primary market: without credit risk: 1.5 % with credit risk: 1.8 %
Black-Scholes, Multi-nominal processing trees, LIBOR-market model
Implied and historical volatility (no information on the calculation of implied volatility)
Dividend forecasts or historical dividends
No information about time stamps
Consideration of the issuer risk from issuer bonds, ratings and credit default swaps
No information about time stamps, hedging costs, bid-ask spreads, sales commissions
The current study 3,179, Germany, 2013, representative and random samples with various underlying assets, (The results of the representative sample with an average remaining maturity of 2.36 years are shown in the table.)
Primary market: 4.5% Secondary market: 0.9% / -0.5% / 8.6%
Primary market: 0.99% Secondary market: 0.36%
Black-Scholes, Multi-nominal processing trees
Matching of time stamps (underlying assets and structured products)
Valuation at prices shortly before 17:30 hours (CET)
Implied dividend estimates from option data
Implied volatilities from volatility surfaces
Account taken of bid-ask spreads
Account taken of the issuer risk through issuer bonds and credit default swaps
Sales commissions captured
Assumptions regarding hedging costs for barrier products

27
Appendix F: Analysis of the bid-ask spreads of products without maturity For structured products without maturity, trading costs in the form of the bid-ask spread play an important role due to the typically short holding period of these products (Constant Leverage Certificates and Knock-Out Warrants) and due to their aim of construction (Tracker Certificates are supposed to track the index/ underlying asset as closely as possible). In addition, there are further cost components such as funding costs or fees (e.g. in the case of self-calculated underlying assets) as well as the treatment of dividends paid on the underlying asset. These cost variables are specified for each product in product information sheets and are therefore transparent. If structured products are held for an extended length of time, investors should generally consider all cost components as well as the issuer risk. The Figure below shows the average bid-ask spreads for the three product categories. The products are selected in the same way as in the representative product selection described in Appendix A on the basis of the same valuation date (31 May 2013). The specified amounts are absolute amounts as it is not possible to specify an annual variable due to the unlimited lifetime of the products. At 0.47 percent and 0.44 percent respectively, Index Certificates and Knock-Out Warrants show comparable results; for Constant Leverage Certificates there is an average bid-ask spread of 0.78 percent.
Fig. F1: Average bid-ask spread of products with unlimited lifetime
Tracker
Certrificates
Constant
Leverage
Certificates
Knock Out
Warrants
0.47% 0.78% 0.44%
2.78% 4.00% 2.41%
0.0% 0.04%. 0.01%
200 200 200
Max.
Min.
Product type
Number of products
Average
bid-ask spread

28
References Ait-Sahalia, Y./ Fan, J./ Li, Y. (2013): The leverage effect puzzle: Disentangling sources of bias at high frequency, in Journal of Financial Economics, number 109, pages 224 to 249. Baule, R./ Entrop, O./ Wilkens, M. (2008): Credit risk and bank margins in structured financial products: Evidence from the German secondary market for Discount Certificates, in Journal of Futures Markets, volume 28 (4), pages 376 to 397. Baule, R./ Rühling, R./ Scholz, H. (2004): Zur Preisstellung der Emittenten von Discountzertifikaten – Eine empirische Untersuchung am deutschen Sekundärmarkt, in Finanz Betrieb, volume 6 , number 1212, pages 825 to 8323. Benet, B. A./ Gianetti, A./ Pissaris, S. (2006): Gains from structured product markets, in The Journal of Banking & Finance, volume 30, pages 111 to 132. Black, F./ Scholes, M. (1973): The Pricing of Options and Corporate Liabilities, in Journal of Political Economy, volume 81 , number 3, pages 637 to 654. Deutscher Derivate Verband (DDV) (2013a): Fairness Code: Voluntary Undertaking by issuers to observe standards with respect to the structuring, issuing, marketing and trading of structured products, Deutscher Derivate Verband, October 2013. Deutscher Derivate Verband (DDV) (2013b): Notes to the Fairness Code, Deutscher Derivate Verband, October 2013. Deutscher Derivate Verband (DDV) (2013c): Deutscher Derivate Verband: The German market for derivative securities, monthly report of May 2013. De Weert, F. (2011): Exotic options trading, John Wiley & Sons. Dupire, B. (1994): Pricing with a smile, in RISK, number 7, pages 18 to 20. European Securities and Markets Authority (ESMA) (2013): Structured products: risk and returns for retail investors, Economic Report number 1, Retailisation in the EU, European Securities and Markets Authority, Paris.
Glaser, M./ Schmitz, P. (2007): Privatanleger am Optionsscheinmarkt in Zeitschrift für Bankrecht und Bankwirtschaft, volume 19, number 3, pages 214 to 230. Grünbichler A./ Wohlwend, H. (2005): The Valuation of Structured Products: Empirical Findings For The Swiss Market, in Financial Markets and Portfolio Management, volume 19(4), pages 361 to 380. Henderson, B./ Pearson, N. (2007): Patterns in the Payoffs of Structured Equity Derivatives, in AFA 2008 New Orleans Meetings Paper. Henderson, B./ Pearson, N. (2011): The dark side of financial innovation: a case study of the pricing of a retail financial product, in Journal of Financial Economics, volume 100 (2), pages 227 to 247. Hull, J. C. (2012): Options, Futures and Other Derivatives, 8th edition, Person Education/ Prentice Hall International.

29
Jørgensen, P./ Nørholm, H./ Skovmand, D. (2011): Overpricing and Hidden Costs of Structured Bonds for Retail Investors: Evidence from the Danish Market for Principal Protected Notes, mimeo. Rudolph, B./ Schäfer, K. (2010): Derivative Finanzmarktinstrumente, second edition, Berlin. Stoimenov, P./ Wilkens, S. (2005): Are structured products ‘fairly’ priced? An analysis of the German market for equity-linked instruments, in Journal of Banking & Finance, volume 29, pages 2971 to 2993. Szymanowska, M./ Horst, J. T. / Veld, C. (2009): Reverse Convertibles Bonds Analyzed, in Journal of Futures Markets, volume 29 (10), pages 895 to 919. Wilkens, S./ Erner, C./ Roder, K. (2003): The Pricing of Structured Products in Germany, in Journal of Derivatives, volume 11, pages 55 to69. Wallmeier, M./ Diethelm, M. (2008): Market Pricing of Exotic Structured Products: The Case of Multi-Asset Barrier Reverse Convertibles in Switzerland, mimeo.