
ISSN : 2454-9150 Cash Holdings Scenario in Indian Manufacturing...
13
International Journal for Research in Engineering Application & Management (IJREAM) ISSN : 2454-9150 Vol-05, Issue-01, April 2019 539 | IJREAMV05I0149207 DOI : 10.18231/2454-9150.2019.0354 © 2019, IJREAM All Rights Reserved. Cash Holdings Scenario in Indian Manufacturing Firms: Evidence from Financial Crisis Maheswar Sethi, Lecturer, P.G. Department of Commerce, Berhampur University, Bhanja Bihar, Berhampur, Ganjam, Odisha, India, [email protected] Rabindra Kumar Swain, Assistant Professor, P.G. Department of Commerce, Utkal University, Vani Vihar, Bhubaneswar, Odisha, India, [email protected] Abstract: This paper investigates the impact of global financial crisis 2008-2009 on cash holdings by using a sample of 500 Indian manufacturing firms. This paper also examines the impact of firm specific determinants such as Firm size, Growth opportunities, Leverage, Cash flow, Dividend, Net working capital, R&D expenditure, Assets tangibility, Profitability, Interest expenses, Cash conversion cycle, Inverse of Altman’s Z Score, Firm age and Cash flow volatility on cash holdings in pre crisis, crisis and post crisis period. Pooled ordinary least squares regression is used for analysing the data. The study finds that financial crisis has impact on cash holdings of the Indian manufacturing firms. Further, the study finds that the impact of firm specific determinants on cash holdings differs in pre crisis, crisis and post crisis period. Keywords: Cash holdings; Determinants; Financial crisis; Trade-off theory; Pecking order theory; Agency theory JEL Classification: G01; G30; G32 I. INTRODUCTION Financial crisis of 2008-2009 has affected firms across the globe and firms have witnessed many substantial changes due to such crisis. Some firms were forced to close and some firms managed to survive. The question arises as to what changes took place in the firms due to such financial crisis and how they managed such changes to ensure their survival. Firms have experienced many changes because of financial crisis. However, this study focuses on what changes have been witnessed in the cash holdings of the Indian manufacturing firms and how the firm specific variables have affected the cash holdings in pre crisis, crisis and post crisis period. Cash is crucial for every business even if holding cash is costly as it carries low financial return and involves agency costs. Cash is the basic input needed to keep the business running and it is the ultimate output the business expects to realise. Hence, every business needs to hold certain amount of cash and such need is propelled by several motives such as transaction motive, precautionary motive, speculative motive, agency motive, firm’s value motive, compensating balance requirement and strategic motive. Holding of cash by firms is also supported by financial theories. Static trade-off theory by Keynes (1936) [1] states that cash holdings of firms are determined by striking a balance between the costs and benefits of holding such cash. The pecking order theory by Myers & Majluf (1984) [5] suggests that firms hold cash because they prefer to finance their investments by internal funds and in case of scarcity of internal funds they go for debt and finally at the end they go for equity. When the firms generate enough funds from operation and the funds are sufficient enough to finance the positive NPV (Net Present Value) project then the firms repay the debt first then pileup cash. Agency theory by Jensen (1986) [6] states that managers hold more cash to pursue their own interests which do not coincide with those of shareholders. On the other hand, capital structure theory by Modigliani & Miller (1958) [2] states that in a friction less world (perfect capital market), firms do not need to hold cash reserve. But in real world, firms operate with lot of frictions (imperfect capital market) where there exist transaction cost, bankruptcy cost, taxes and agency cost. Hence, all these frictions make the cash holdings decision highly important for firms and these frictions emanates from various sources like firm specific factors and micro as well as macroeconomic scenarios. Many studies focusing on firm specific determinants of cash holdings have been undertaken in developed countries but study focusing on firm specific determinants of cash holdings in Indian context is scant. Anand et al. (2012) [43],
Transcript of ISSN : 2454-9150 Cash Holdings Scenario in Indian Manufacturing...

International Journal for Research in Engineering Application & Management (IJREAM)
ISSN : 2454-9150 Vol-05, Issue-01, April 2019
539 | IJREAMV05I0149207 DOI : 10.18231/2454-9150.2019.0354 © 2019, IJREAM All Rights Reserved.
Cash Holdings Scenario in Indian Manufacturing
Firms: Evidence from Financial Crisis Maheswar Sethi, Lecturer, P.G. Department of Commerce, Berhampur University, Bhanja Bihar,
Berhampur, Ganjam, Odisha, India, [email protected]
Rabindra Kumar Swain, Assistant Professor, P.G. Department of Commerce, Utkal University, Vani
Vihar, Bhubaneswar, Odisha, India, [email protected]
Abstract: This paper investigates the impact of global financial crisis 2008-2009 on cash holdings by using a sample of 500
Indian manufacturing firms. This paper also examines the impact of firm specific determinants such as Firm size, Growth
opportunities, Leverage, Cash flow, Dividend, Net working capital, R&D expenditure, Assets tangibility, Profitability,
Interest expenses, Cash conversion cycle, Inverse of Altman’s Z Score, Firm age and Cash flow volatility on cash holdings
in pre crisis, crisis and post crisis period. Pooled ordinary least squares regression is used for analysing the data. The study
finds that financial crisis has impact on cash holdings of the Indian manufacturing firms. Further, the study finds that the
impact of firm specific determinants on cash holdings differs in pre crisis, crisis and post crisis period.
Keywords: Cash holdings; Determinants; Financial crisis; Trade-off theory; Pecking order theory; Agency theory
JEL Classification: G01; G30; G32
I. INTRODUCTION
Financial crisis of 2008-2009 has affected firms across the
globe and firms have witnessed many substantial changes
due to such crisis. Some firms were forced to close and some
firms managed to survive. The question arises as to what
changes took place in the firms due to such financial crisis
and how they managed such changes to ensure their survival.
Firms have experienced many changes because of financial
crisis. However, this study focuses on what changes have
been witnessed in the cash holdings of the Indian
manufacturing firms and how the firm specific variables
have affected the cash holdings in pre crisis, crisis and post
crisis period.
Cash is crucial for every business even if holding cash is
costly as it carries low financial return and involves agency
costs. Cash is the basic input needed to keep the business
running and it is the ultimate output the business expects to
realise. Hence, every business needs to hold certain amount
of cash and such need is propelled by several motives such
as transaction motive, precautionary motive, speculative
motive, agency motive, firm’s value motive, compensating
balance requirement and strategic motive.
Holding of cash by firms is also supported by financial
theories. Static trade-off theory by Keynes (1936) [1] states
that cash holdings of firms are determined by striking a
balance between the costs and benefits of holding such cash.
The pecking order theory by Myers & Majluf (1984) [5]
suggests that firms hold cash because they prefer to finance
their investments by internal funds and in case of scarcity of
internal funds they go for debt and finally at the end they go
for equity. When the firms generate enough funds from
operation and the funds are sufficient enough to finance the
positive NPV (Net Present Value) project then the firms
repay the debt first then pileup cash. Agency theory by
Jensen (1986) [6] states that managers hold more cash to
pursue their own interests which do not coincide with those
of shareholders.
On the other hand, capital structure theory by Modigliani &
Miller (1958) [2] states that in a friction less world (perfect
capital market), firms do not need to hold cash reserve. But
in real world, firms operate with lot of frictions (imperfect
capital market) where there exist transaction cost,
bankruptcy cost, taxes and agency cost. Hence, all these
frictions make the cash holdings decision highly important
for firms and these frictions emanates from various sources
like firm specific factors and micro as well as
macroeconomic scenarios.
Many studies focusing on firm specific determinants of cash
holdings have been undertaken in developed countries but
study focusing on firm specific determinants of cash
holdings in Indian context is scant. Anand et al. (2012) [43],

International Journal for Research in Engineering Application & Management (IJREAM)
ISSN : 2454-9150 Vol-05, Issue-01, April 2019
540 | IJREAMV05I0149207 DOI : 10.18231/2454-9150.2019.0354 © 2019, IJREAM All Rights Reserved.
Al-Najjar (2013) [50], Gautam et al. (2014) [54], Saluja &
Drolia (2015) [59], Cheung (2016) [64] and Maheshwari &
Rao (2017) [65] have studied firm specific determinants of
cash holdings of Indian firms. However, no study has
focused on the impact of financial crisis 2008-2009 on firm’s
cash holdings as well as the impact of firm specific
determinants on cash holdings in pre crisis, crisis and post
crisis period in Indian context.
This study contributes to the existing literature by studying
the impact of financial crisis 2008-2009 on cash holdings of
Indian manufacturing firms and the impact of firm specific
determinants on cash holdings in pre crisis, crisis and post
crisis period. The data set consists of 500 Indian
manufacturing firms over a period from 2005 to 2017. The
study finds that the financial crisis 2008-2009 has impact on
cash holdings of Indian manufacturing firms. Further, the
study finds that the impact of firm specific determinants on
cash holdings also differs in pre crisis, crisis and post crisis
period.
The rest part of this paper is organized as follows. Section II
deals with Review of Literature, section III deals with
Research Methodology, section IV deals with Empirical
Results and Discussion and section V concludes the study.
II. REVIEW OF LITERATURE
This section discusses the literature on impact of financial
crisis on cash holdings and the impact of firm specific
determinants on cash holdings in pre crisis, crisis and post
crisis period from different perspectives.
Al-Amarneh (2015) [62] finds Jordanian firms to hold more
cash during crisis. In pre crisis period cash flow, investment
opportunities, dividend payment and size are positively
related to cash holdings whereas capital expenditure,
leverage, liquid assets substitutes and profitability are
negatively related to cash holdings. During crisis investment
opportunities and profitability are positively related to cash
holdings whereas capital expenditure cash flow, leverage,
dividend payment, liquid assets substitutes and size are
negatively related to cash holdings. In post crisis period
capital expenditure, investment opportunities, leverage,
dividend payment and profitability are positively related to
cash holdings whereas cash flow, liquid assets substitutes,
and size are negatively related to cash holdings.
Kinnunen (2015) [57], in the context of Sweden, finds that
in both pre and post crisis period cash holdings has negative
association with bank debt, size and net working capital
whereas cash holdings has positive association with capital
expenditure, cash flow, cash flow volatility, growth
opportunities, leverage and profitability.
Song & Lee (2012) [41] study the impact of 2008-2009
financial crisis on the firms of 8 East Asian countries namely
Hong Kong, Indonesia, Malaysia, Philippines, Singapore,
South Korea, Taiwan, and Thailand. The study finds that in
pre crisis period profitability has positive association with
cash holdings and net working capital has negative
association with cash holdings. In post crisis period
profitability, growth opportunities, size and dividend have
positive association with cash holdings whereas net working
capital and leverage have negative association with cash
holdings. Growth opportunities, size, leverage and dividend
are insignificant in pre crisis period but significant in post
crisis period whereas cash flow volatility is significant in
both the period.
Pinkowitz et al. (2013) [45] investigate the determinants of
cash holdings of U.S. firms during financial crisis 2008-2009
collecting a data set over 1998-2010. The study finds that
cash holdings increases with growth opportunities and R&D
expenditure whereas cash holdings decreases with size, cash
flow, net working capital and leverage. Further, Dividend
found to have insignificant impact on cash holdings.
Lian et al. (2011) [33] investigate the impact of 2008-2009
financial crisis on corporate cash holdings of Chinese firms
collecting a data set over 1999-2009. The study finds that
during crisis cash holdings increases indicating a positive
relationship between financial crisis and cash holdings.
Further, growth opportunities, cash flow, dividend and cash
flow volatility have positive impact on cash holdings
whereas size, leverage and net working capital have negative
impact on cash holdings.
Bliss et al. (2015) [58], in the context of U.S., find that the
reduction in dividend payment and corporate cash holdings
are positively related during the financial crisis 2008-2009
which means that firms consider reduction in payout as a
source of fund.
Elkinawy & Stater (2007) [22] study the impact of Mexican
crisis (1994-1995) and Brazilian crisis (1999) on corporate
cash holdings of firms in Latin America such as Argentina,
Brazil and Mexico. The study finds that both Mexican and
Brazilian crisis have a different impact on the determinants
of cash holdings. Size, profit, dividend have positive impact
on cash holdings whereas leverage and net working capital
have negative impact on cash holdings in both the crisis
period. ADR (firms cross listed on U.S. stock exchange) and
size-crisis interaction have positive impact on cash holdings
whereas ADR-crisis interaction has negative impact on cash
holdings during Mexican crisis. However, during Brazilian
crisis ADR has negative impact on cash holdings whereas
leverage and ADR-crisis interaction have positive impact on
cash holdings.

International Journal for Research in Engineering Application & Management (IJREAM)
ISSN : 2454-9150 Vol-05, Issue-01, April 2019
541 | IJREAMV05I0149207 DOI : 10.18231/2454-9150.2019.0354 © 2019, IJREAM All Rights Reserved.
Gao & Yun (2009) [27] document that U.S. firm with less
liquidity due to financial crisis 2008-2009 tends to forgo
investment opportunities to accumulate cash but firms with
high liquidity maintain their business activity at pre crisis
level.
Campello et al. (2011) [38] undertake a primary survey of
800 Chief Financial Officers from North America, Europe
and Asia. The survey finds that the negative association
between line of credit and cash holdings is more intensive
during financial crisis 2008-2009 than pre crisis period.
A. Research Gap
From the review of literature, it is found that studies
concerning firm specific determinants of cash holdings in
developed countries are plenty in number but such studies in
Indian context are scant. This study is distinct from prior
studies in three senses. Firstly, country like India is taken as
the sample. Secondly, this study attempts to investigate the
impact of financial crisis 2008-2009 on cash holdings in
Indian context. Thirdly, this study assess the impact of firm
specific parameters on cash holdings in pre crisis, crisis and
post crisis period.
B. Research Questions
Consistent with research gap, the following research
questions are developed.
Does financial crisis have impact on cash holdings
of Indian manufacturing firms?
Do firm specific determinants have different impact
on cash holdings in financial crisis?
C. Objectives of the Study
The objectives of this study are:
To investigate the impact of financial crisis on cash
holdings of Indian manufacturing firms.
To examine the impact of firm specific
determinants on cash holdings in pre crisis, crisis
and post crisis period.
D. Scope of the Study
This study is confined to the investigation of impact of
financial crisis on cash holdings of Indian manufacturing
firms and to examine the impact of firm specific
determinants on cash holdings of Indian manufacturing firms
in pre crisis, crisis and post crisis period. The study has taken
variables such as Firm size, Growth opportunities, Leverage,
Cash flow, Dividend, Net working capital, R&D
expenditure, Assets tangibility, Profitability, Interest
expenses, Cash conversion cycle, Inverse of Altman’s Z
Score, Firm age, Cash flow volatility and Crisis dummy to
study their impact on cash holdings.
E. Rationale of the Study
The financial crisis of 2008-2009 has affected firms across
the globe and forced them to change their cash management
policies. Many firms across the globe were forced to close
down due to liquidity crunch and many firms managed to
survive. In the light of the above backdrop, this study aims at
investigating how global financial crisis 2008-2009 has
changed the cash holdings policies of Indian manufacturing
firms and how firm specific determinants have affected the
cash holdings in pre crisis, crisis and post crisis period.
F. Hypotheses
Based on research gap, this study focuses on two dimensions
i.e., impact of financial crisis on cash holdings of Indian
manufacturing firms and changes in the impact of firm
specific determinants on cash holdings in pre crisis, crisis
and post crisis period. Hence, following two null hypotheses
are developed.
H01: Financial crisis has no impact on cash holdings of
Indian manufacturing firms.
H02: There is no difference in impact of firm specific
determinants on cash holdings in pre crisis, crisis and post
crisis period.
III. RESEARCH METHODOLOGY
This section discusses sample selection, data description and
model specification.
A. Sample Selection and Data Description
The data used in this study relate to Indian manufacturing
firms listed in both National Stock Exchange (NSE) and
Bombay Stock Exchange (BSE). The data are collected from
PROWESS data base of CMIE (Centre for Monitoring
Indian Economy). This study is confined to listed
manufacturing firms because listed firms are required to
follow the norms prescribed by Securities and Exchange
Board of India (SEBI) for financial reporting. Firms from
banking and financial services are excluded from the sample
as the regulation and financial reporting practice followed by
those firms differ from others. In addition, firms with
missing data are excluded. Thus, a data set of 6,500 firm-
year observation is obtained for 500 sample firms over the
study period from 2005 to 2017. Table 1 shows the sample
selection procedure. To study the impact of crisis on cash
holdings the data set is categorised into 3 different periods
such as pre crisis period (2005-2007), crisis period (2008-
2009) and post crisis period (2010-2017).
Table 1. Sample Selection Procedure
Criterion
Number
of Firms
Initial sample Manufacturing firms collected
from PROWESS database of CMIE 17807
Minus firms with missing financial statement
information 17307
Final sample 500
Source: Authors’ own collection.

International Journal for Research in Engineering Application & Management (IJREAM)
ISSN : 2454-9150 Vol-05, Issue-01, April 2019
542 | IJREAMV05I0149207 DOI : 10.18231/2454-9150.2019.0354 © 2019, IJREAM All Rights Reserved.
B. Model Specification
Consistence with literature, our dependent variable is cash holdings. The independent variables are firm size, growth opportunities,
leverage, cash flow, dividend, net working capital, R&D expenditure, assets tangibility, profitability, interest expenses, cash
conversion cycle, inverse of Altman’s Z score, firm age, cash flow volatility and crisis dummy. To test the hypotheses four models
are developed. Model I depicts the impact of financial crisis on cash holdings of Indian manufacturing firms where crisis dummy is
used as primary explanatory variable and firm specific determinants are used as control variables. Model II, Model III and Model
IV depict the impact of firm specific determinants on cash holdings in pre crisis, crisis and post crisis period respectively. The four
models are as follows:
(I)DUMCβCFVβAGEβ1/ZβCCCβINEβPFTβ
TANβD&RβNWCβDIVβCFβLEVβGOPβSIZEβCASH
εit15it14it13it12it11it10it9
it8it7it6it5it4it3it2it10it α
(II)CFVβAGEβ1/ZβCCCβINEβPFTβ
TANβD&RβNWCβDIVβCFβLEVβGOPβSIZEβCASH
εit14it13it12it11it10it9
it8it7it6it5it4it3it2it10it α
(III)CFVβAGEβ1/ZβCCCβINEβPFTβ
TANβD&RβNWCβDIVβCFβLEVβGOPβSIZEβCASH
εit14it13it12it11it10it9
it8it7it6it5it4it3it2it10it α
(IV)CFVβAGEβ1/ZβCCCβINEβPFTβ
TANβD&RβNWCβDIVβCFβLEVβGOPβSIZEβCASH
εit14it13it12it11it10it9
it8it7it6it5it4it3it2it10it α
Where,
CASH it = Cash holdings, measured as ratio of cash and cash equivalents to net assets (total assets minus cash and cash
equivalents). The underlying reason for deflating cash and cash equivalents by net assets is that a firm’s ability to generate future
profit depends upon its net assets. Further, the objective of deflating cash by net assets is to remove the problem of circularity.
Hence, all other variables are also deflated by net assets.
SIZE it = Size of the firm, measured as natural logarithm of net assets.
GOP it = Growth opportunities, measured as market-to-book ratio. Market-to-book ratio is calculated as ratio of book value of net
assets minus book value of equity plus market value of equity to net assets.
LEV it = Leverage, measured as ratio of total debt to net assets.
CF it = Cash flow, measured as ratio of cash flow from operation to net assets.
DIV it = A dummy variable for dividend that takes a value 1 if a firm pays dividend and 0 otherwise.
NWC it = Net working capital, measured as ratio of net working capital minus cash and cash equivalents to net assets.
R&D it = Research and Development expenditure, measured as ratio of R&D expenditure to net assets.
TAN it = Tangibility of assets, measured as ratio of fixed assets to net assets.
PFT it = Profitability, measured as ratio of EBIT (Earnings before Interest and Taxes) to net assets.
INE it = Interest expenses, measured as ratio of interest expenses to net assets.
CCC it = Length of cash conversion cycle, measured as natural logarithm of inventory conversion period plus debtor conversion
period minus creditor deferment period.
1/Z it = Inverse of adjusted version of Altman’s Z score (1968).
AGE it = Age, measured as natural logarithm of number of year since incorporation of firm.
CFV it = Cash flow volatility, measured as the volatility of a firm's cash flow from operation over the time period. It is the mean of
the standard deviations of cash flow over net assets.
DUMC it = A dummy variable for crisis that takes a value 1, for period between 2008 and 2009 and 0 otherwise.
IV. EMPIRICAL RESULTS AND DISCUSSION
This section discusses the empirical results and findings of the study.
A. Trend Analysis
Trends of Cash Holdings

International Journal for Research in Engineering Application & Management (IJREAM)
ISSN : 2454-9150 Vol-05, Issue-01, April 2019
543 | IJREAMV05I0149207 DOI : 10.18231/2454-9150.2019.0354 © 2019, IJREAM All Rights Reserved.
Figure 1 depicts the trend of cash holdings over the study period from 2005 to 2017 and it shows a fluctuating trend. Further, the
trends of cash holdings in pre crisis period (2005-2007), crisis period (2008-2009) and post crisis period (2010-2017) are shown
separately to get more insight from the trends of cash holdings. Figure 2 depicts the trend of cash holdings in pre crisis period. It
shows an upward trend from 2005 to 2006 but from 2006 to 2007 it starts declining which signals the start of crisis. Figure 3
depicts the trend of cash holdings in the crisis period from 2008 to 2009. In 2008, cash holdings declines very sharply because that
period is the peak of the crisis and after 2008 cash holdings start increasing. Figure 4 showing cash holdings in post crisis period
depicts that the upward trend of cash holdings started in crisis period continues till 2010 and after that it starts decreasing.
From the above analysis it is clear that there is a sharp decline in cash holdings of Indian manufacturing firms in 2008 and after
2008 there is a sharp increase in cash holdings which signals the existence of impact of financial crisis on cash holdings of Indian
manufacturing firms.
0.00
0.02
0.04
0.06
0.08
0.10
2003 2005 2007 2009 2011 2013 2015 2017
Figure:1 Trend of Cash Holdings over
the Study Period (2005-2017)
0.00
0.02
0.04
0.06
0.08
0.10
2004 2005 2006 2007 2008
Figure: 2 Trend of Cash Holdings in
Pre Crisis Period (2005-2007)
0.00
0.02
0.04
0.06
0.08
0.10
2007 2008 2009 2010
Figure: 3 Trend of Cash Holdings in
Crisis Period (2008-2009)
0.00
0.02
0.04
0.06
0.08
0.10
2008 2010 2012 2014 2016 2018
Figure: 4 Trend of Cash Holdings in
Post Crisis Period (2010-2017)

International Journal for Research in Engineering Application & Management (IJREAM)
ISSN : 2454-9150 Vol-05, Issue-01, April 2019
544 | IJREAMV05I0149207 DOI : 10.18231/2454-9150.2019.0354 © 2019, IJREAM All Rights Reserved.
B. Descriptive Statistics
Table 2. Descriptive Statistics
Pre Crisis Crisis Post Crisis
Mean Median S.D. Min Max Mean Median S.D. Min Max Mean Median S.D. Min Max
CASH 0.078 0.028 0.141 0.000 1.650 0.076 0.025 0.202 0.001 3.510 0.052 0.014 0.140 0.000 2.494
SIZE 8.162 8.015 1.443 4.824 13.960 8.633 8.456 1.485 5.288 14.620 9.143 8.946 1.582 5.100 15.510
GOP 1.866 1.344 1.582 0.398 21.750 1.340 0.993 1.061 0.211 10.920 1.814 1.139 1.876 -0.115 23.350
LEV 0.640 0.646 0.189 0.131 1.699 0.627 0.649 0.186 0.033 1.846 0.607 0.606 0.286 -0.471 5.374
CF 0.096 0.088 0.098 -0.254 0.618 0.094 0.088 0.106 -0.375 0.631 0.088 0.083 0.096 -0.487 1.069
DIV 0.843 1.000 0.364 0.000 1.000 0.789 1.000 0.408 0.000 1.000 0.717 1.000 0.451 0.000 1.000
NWC 1.189 0.859 1.539 -0.530 27.120 0.503 0.426 0.456 -0.604 5.102 0.084 0.079 0.276 -4.770 1.879
R&D 0.006 0.000 0.017 0.000 0.160 0.006 0.000 0.017 0.000 0.192 0.006 0.001 0.016 0.000 0.237
TAN 0.659 0.637 0.281 0.032 1.703 0.621 0.599 0.285 0.033 2.042 0.615 0.587 0.314 0.036 2.764
PFT 1.266 1.121 0.666 0.040 6.721 1.198 1.030 0.740 0.007 6.295 1.143 1.036 0.723 -0.002 8.990
INE 0.022 0.020 0.016 0.000 0.115 0.026 0.025 0.019 0.000 0.105 0.026 0.021 0.025 0.000 0.290
CCC 4.295 4.469 0.982 -2.526 7.240 4.281 4.459 1.055 -2.207 9.287 4.379 4.486 1.115 -4.605 12.620
1/Z 0.174 0.156 0.105 0.017 1.947 0.216 0.177 0.462 0.024 14.170 0.215 0.162 0.628 -14.610 24.320
AGE 3.365 3.258 0.584 1.609 4.970 3.461 3.367 0.533 2.079 4.984 3.621 3.526 0.467 2.303 5.037
CFV 0.086 0.074 0.048 0.019 0.474 0.086 0.074 0.048 0.019 0.474 0.086 0.074 0.048 0.019 0.474
Source: Authors’ own calculation.
The descriptive statistics of the firm specific parameters under study are reported in table 2. It depicts that the average cash holdings of Indian manufacturing firms stands at 7.6
% in crisis period as against 7.8% and 5.2% in pre crisis and post crisis period respectively. It indicates that there is decrease in cash holdings in crisis period as compared to pre
crisis period and also there is further decrease in cash holdings in post crisis period as compared to crisis period.
C. Correlation Matrix
Table 3. Correlation Matrix (Karl Pearson)
SIZE GOP LEV CF DIV NWC R&D TAN PFT INE CCC 1/Z AGE CFV
1 0.15 0.01 0.00 0.11 -0.21 0.05 -0.19 -0.19 -0.08 -0.07 0.03 0.27 -0.15 SIZE
1 -0.05 0.35 0.14 0.02 0.18 -0.21 0.22 -0.28 -0.13 -0.10 0.09 0.21 GOP
1 -0.12 -0.32 -0.12 -0.12 0.17 0.01 0.58 -0.06 0.06 -0.12 0.04 LEV
1 0.19 0.01 0.10 0.15 0.29 -0.12 -0.17 -0.08 0.02 0.12 CF
1 0.10 0.11 -0.18 0.17 -0.41 -0.09 -0.13 0.07 -0.01 DIV
1 0.03 -0.09 0.15 -0.11 0.00 -0.05 -0.18 0.05 NWC
1 -0.11 -0.01 -0.16 -0.01 -0.04 0.00 0.17 R&D
International Journal for Research in Engineering Application & Management (IJREAM)
ISSN : 2454-9150 Vol-05, Issue-01, April 2019
545 | IJREAMV05I0149207 DOI : 10.18231/2454-9150.2019.0354 © 2019, IJREAM All Rights Reserved.
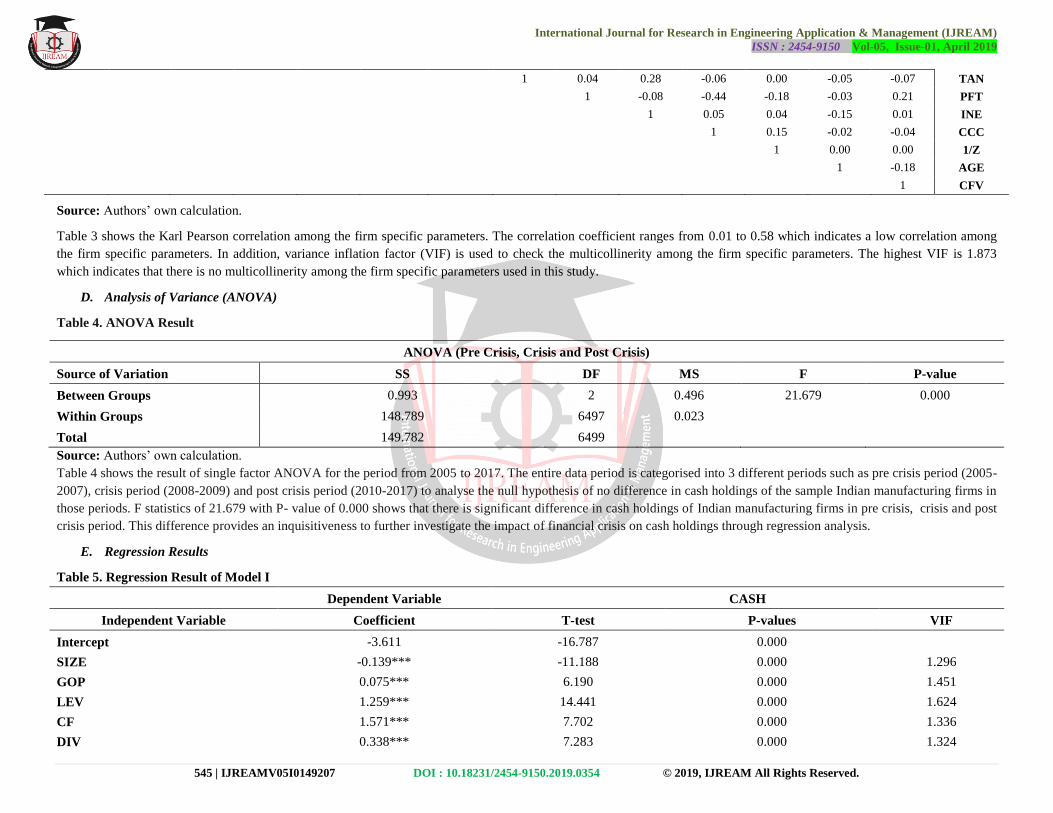
1 0.04 0.28 -0.06 0.00 -0.05 -0.07 TAN
1 -0.08 -0.44 -0.18 -0.03 0.21 PFT
1 0.05 0.04 -0.15 0.01 INE
1 0.15 -0.02 -0.04 CCC
1 0.00 0.00 1/Z
1 -0.18 AGE
1 CFV
Source: Authors’ own calculation.
Table 3 shows the Karl Pearson correlation among the firm specific parameters. The correlation coefficient ranges from 0.01 to 0.58 which indicates a low correlation among
the firm specific parameters. In addition, variance inflation factor (VIF) is used to check the multicollinerity among the firm specific parameters. The highest VIF is 1.873
which indicates that there is no multicollinerity among the firm specific parameters used in this study.
D. Analysis of Variance (ANOVA)
Table 4. ANOVA Result
ANOVA (Pre Crisis, Crisis and Post Crisis)
Source of Variation SS DF MS F P-value
Between Groups 0.993 2 0.496 21.679 0.000
Within Groups 148.789 6497 0.023
Total 149.782 6499
Source: Authors’ own calculation.
Table 4 shows the result of single factor ANOVA for the period from 2005 to 2017. The entire data period is categorised into 3 different periods such as pre crisis period (2005-
2007), crisis period (2008-2009) and post crisis period (2010-2017) to analyse the null hypothesis of no difference in cash holdings of the sample Indian manufacturing firms in
those periods. F statistics of 21.679 with P- value of 0.000 shows that there is significant difference in cash holdings of Indian manufacturing firms in pre crisis, crisis and post
crisis period. This difference provides an inquisitiveness to further investigate the impact of financial crisis on cash holdings through regression analysis.
E. Regression Results
Table 5. Regression Result of Model I
Dependent Variable CASH
Independent Variable Coefficient T-test P-values VIF
Intercept -3.611 -16.787 0.000
SIZE -0.139*** -11.188 0.000 1.296
GOP 0.075*** 6.190 0.000 1.451
LEV 1.259*** 14.441 0.000 1.624
CF 1.571*** 7.702 0.000 1.336
DIV 0.338*** 7.283 0.000 1.324

International Journal for Research in Engineering Application & Management (IJREAM)
ISSN : 2454-9150 Vol-05, Issue-01, April 2019
546 | IJREAMV05I0149207 DOI : 10.18231/2454-9150.2019.0354 © 2019, IJREAM All Rights Reserved.
NWC 0.095*** 4.718 0.000 1.127
R&D 4.240*** 3.820 0.000 1.088
TAN -0.250*** -3.889 0.000 1.262
PFT 0.185*** 6.155 0.000 1.541
INE -20.674*** -19.328 0.000 1.873
CCC -0.021 -1.167 0.243 1.306
1/Z -0.047 -1.391 0.164 1.062
AGE 0.003 0.088 0.930 1.169
CFV 0.070 0.176 0.860 1.184
DUMC 0.410*** 8.448 0.000 1.024
F- test F(15, 6484) 103.594 0.000
Adjusted R2 0.191
Observations 6500
Source: Authors’ own calculation.
Note: ***, ** and * indicate significant level at 1%, 5% and 10% respectively.
Table 5 shows the result of regression analysis of Indian manufacturing firms for the period from 2005 to 2017 using crisis as a target variable. Crisis variable is used as dummy
variable that takes a value 1, for period between 2008 and 2009 and 0 otherwise. To study the impact of crisis on cash holdings, crisis dummy is used as primary explanatory
variable and other variables such as firm size, growth opportunities, leverage, cash flows, dividend, net working capital, R&D expenditure, assets tangibility, profitability,
interest expenses, cash conversion cycle, inverse of Altman’s Z score, firm age and cash flow volatility are used as control variables. The crisis dummy (Coefficient 0.410, P-
value 0.000) has significant impact on cash holdings. This result indicates that crisis is a factor that influences the cash holdings of Indian manufacturing firms. Further, this
analysis provides an inquisitiveness to investigate the impact of firm specific determinants on cash holdings in pre crisis, crisis and post crisis period.
Table 6. Regression Result of Model II, Model III and Model IV
Pre Crisis (Model II) Crisis (Model III) Post Crisis (Model IV)
Dependent Variable CASH
Independent Variable Coefficient T-test P-values Coefficient T-test P-values Coefficient T-test P-values VIF
Intercept -3.666 -8.565 0.000 -4.173 -8.530 0.000 -3.835 -12.830 0.000
SIZE -0.053** -2.027 0.043 -0.050* -1.663 0.097 -0.149*** -9.143 0.000 1.296
GOP 0.093*** 3.599 0.000 -0.002 -0.042 0.967 0.066*** 4.396 0.000 1.451
LEV 1.982*** 9.284 0.000 1.581*** 5.828 0.000 1.203*** 9.580 0.000 1.624
CF 1.640*** 4.166 0.000 1.879*** 4.456 0.000 1.462*** 5.233 0.000 1.336
DIV -0.064 -0.640 0.522 0.107 1.011 0.312 0.360*** 5.927 0.000 1.324
NWC -0.012 -0.530 0.596 0.046 0.488 0.626 0.453*** 3.950 0.000 1.127

International Journal for Research in Engineering Application & Management (IJREAM)
ISSN : 2454-9150 Vol-05, Issue-01, April 2019
547 | IJREAMV05I0149207 DOI : 10.18231/2454-9150.2019.0354 © 2019, IJREAM All Rights Reserved.
R&D 4.593** 2.298 0.022 1.787 0.773 0.440 4.561*** 2.952 0.003 1.088
TAN -0.435*** -3.298 0.001 -0.232 -1.489 0.137 -0.216** -2.557 0.011 1.262
PFT -0.124* -1.748 0.081 0.212*** 3.060 0.002 0.234*** 5.926 0.000 1.541
INE -18.173*** -6.969 0.000 -26.759*** -9.305 0.000 -18.516*** -14.082 0.000 1.873
CCC 0.038 0.960 0.337 0.023 0.528 0.598 -0.036 -1.537 0.124 1.306
1/Z -2.188*** -4.947 0.000 -0.132 -1.493 0.136 -0.017 -0.450 0.652 1.062
AGE 0.032 0.517 0.605 0.039 0.503 0.615 0.045 0.857 0.392 1.169
CFV -0.057 -0.078 0.938 1.497 1.677 0.094 0.429 0.794 0.427 1.184
F- test F(14, 1485) 19.911 0.000 F(14, 985) 16.471 0.000 F(14, 3985) 62.792 0.000
Adjusted R2
0.150
0.178
0.178
Observations 1500
1000
4000
Source: Authors’ own calculation.
Note: ***, ** and * indicate significant level at 1%, 5% and 10% respectively.

International Journal for Research in Engineering Application & Management (IJREAM)
ISSN : 2454-9150 Vol-05, Issue-01, April 2019
548 | IJREAMV05I0149207 DOI : 10.18231/2454-9150.2019.0354 © 2019, IJREAM All Rights Reserved.
Table 6 shows the result of Pooled Ordinary Least Squares
regression measuring the impact of firm specific
determinants on cash holdings in three different periods such
as pre crisis (Model II), crisis (Model III) and post crisis
period (Model IV).
The result finds that the adjusted R2 in pre crisis, crisis and
post crisis period is 0.150, 0.178 and 0.178 respectively. It
indicates that the models explain 15%, 17.8% and 17.8% of
cash holdings in pre crisis, crisis and post crisis period
respectively.
Firm size (SIZE) has significantly negative association with
cash holdings in pre crisis (-0.053, 0.043), crisis (-0.050,
0.097) and post crisis period (-0.149, 0.000). It means large
firms hold less cash than small firms in all periods which
support the trade-off theory. However, the impact of size in
crisis period is less as compared to pre crisis and post crisis
period which states that large firms becomes less
conservative in financial crisis.
Growth opportunities (GOP) have positive impact on cash
holdings in pre crisis (0.093, 0.000) and post crisis period
(0.066, 0.000) which supports both trade-off theory and
pecking order theory. However, in crisis period such impact
is found to be insignificant (-0.002, 0.967) due to absence of
investment opportunities.
Leverage (LEV) has significantly positive impact on cash
holdings in pre crisis (1.982, 0.000), crisis (1.581, 0.000) and
post crisis period (1.203, 0.000). This result shows that firms
having more debt hold more cash in all the periods to avoid
bankruptcy and high cost of raising further debt. Moreover,
leverage has less impact on cash holdings in crisis period.
Cash flow (CF) is positively associated with cash holdings in
pre crisis (1.640, 0.000), crisis (1.879, 0.000) and post crisis
period (1.462, 0.000). It means firm with more cash flows
hold more cash for future investment in all periods which
supports the pecking order theory. Moreover, the impact of
cash flow on cash holdings is more in crisis period as
compared to pre crisis and post crisis period.
Dividend (DIV) has positive impact on cash holdings in post
crisis period (0.360, 0.000) which means that dividend
paying firms hold more cash. However, in pre crisis (-0.064,
0.522) and crisis period (0.107, 0.312) such impact is
insignificant.
Net working capital (NWC) is found to have positive impact
on cash holdings in post crisis period (0.453, 0.000). It
shows that in post crisis period, firm’s major portion of the
net working capital consists of highly liquid assets.
However, such impact is insignificant in both pre crisis (-
0.012, 0.596) and crisis period (0.046, 0.626).
R&D expenditure (R&D) is positively associated with cash
holdings in both pre crisis (4.593, 0.022) and post crisis
period (4.561, 0.003) which states that firms making
expenditure on R&D hold more cash because R&D driven
innovations are difficult to finance through external
financing due to their uncertain outcome, intangible nature
and asymmetric information problems. However, such
impact is insignificant in crisis period (1.787, 0.440).
The study finds assets tangibility (TAN) to have negative
impact on cash holdings in both pre crisis (-0.435, 0.001)
and post crisis period (-0.216, 0.011). This is because, firms
with more collateral as fixed assets encounter less problem
in issuing debt. Hence, such firms have less need to hold
cash reserve. But such impact is insignificant in crisis period
(-0.232, 0.137) because in crisis, access to debt financing is
very tight despite of collaterals.
Profitability (PFT) is negatively associated with cash
holdings in pre crisis period (-0.124, 0.081) which supports
the trade-off theory that profit is an immediate source of
liquidity for firms. However, profitability is positively
associated with cash holdings in crisis (0.212, 0.002) and
post crisis period (0.234, 0.000) which supports the pecking
order theory that more profitable firms hold more cash for
future needs.
The impact of interest expenses (INE) on cash holdings is
negative in pre crisis (-18.173, 0.000), crisis (-26.759, 0.000)
and post crisis period (-18.516, 0.000). This indicates that
firms paying more interest hold less cash. Moreover, such
impact is more in crisis period as compared to pre crisis and
post crisis period.
The impact of cash conversion cycle (CCC) on cash holdings
is insignificant in pre crisis (0.038, 0.337), crisis (0.023,
0.598) and post crisis period (-0.036, 0.124).
Inverse of Altman’s Z score (1/Z) has negative impact on
cash holdings in pre crisis period (-2.188, 0.000) which
states that financially distressed firms hold less cash due to
reduced financial performance. However, such impact is not
significant in crisis (-0.132, 0.136) and post crisis period (-
0.017, 0.652).
Firm age (AGE) does not have significant impact on cash
holdings in pre crisis (0.032, 0.605), crisis (0.039, 0.615) and
post crisis period (0.045, 0.392).
In line with the trade-off theory, Cash flow volatility (CFV)
has positive impact on cash holdings in crisis period (1.497,
0.094). This is because firms with more volatile cash flow
hold more cash as buffer. However, such impact becomes
International Journal for Research in Engineering Application & Management (IJREAM)
ISSN : 2454-9150 Vol-05, Issue-01, April 2019
549 | IJREAMV05I0149207 DOI : 10.18231/2454-9150.2019.0354 © 2019, IJREAM All Rights Reserved.
insignificant in pre crisis (-0.057, 0.938) and post crisis
period (0.429, 0.427).
F. Findings
This study finds that the financial crisis of 2008-2009 has
impact on cash holdings of Indian manufacturing firms and
the impact of firm specific determinants on cash holdings
also differs in pre crisis, crisis and post crisis period. Firm
size has negative impact on cash holdings in all the periods
which support the trade-off theory. Growth opportunities
have positive impact cash holdings in pre crisis and post
crisis period which supports both trade-off theory and
pecking order theory. However, the impact of growth
opportunities is insignificant in crisis period. Leverage has
positive impact on cash holdings in pre crisis, crisis and post
crisis period. Cash flow is positively associated with cash
holdings in pre crisis, crisis and post crisis period which
supports the pecking order theory. Dividend has positive
impact on cash holdings in post crisis period. However, such
impact is insignificant in pre crisis and crisis period. Net
working capital has positive impact on cash holdings in post
crisis period. However, such impact is insignificant in pre
crisis and crisis period. R&D expenditure is positively
associated with cash holdings in pre crisis and post crisis
period. However, such association is insignificant in crisis
period. Assets tangibility is found to have negative impact
on cash holdings in pre crisis and post crisis period.
However, such impact is insignificant in crisis period.
Profitability is negatively associated with cash holdings in
pre crisis period which supports the trade-off theory.
However, profitability is positively associated with cash
holdings in crisis and post crisis period which supports the
pecking order theory. The impact of interest expenses on
cash holdings is negative in pre crisis, crisis and post crisis
period. Inverse of Altman’s Z score has negative impact on
cash holdings in pre crisis period. However, such impact is
insignificant in crisis and post crisis period. Cash flow
volatility has positive impact on cash holdings in crisis
period which is in line with the trade-off theory. However,
such impact becomes insignificant in pre crisis and post
crisis period. The impact of cash conversion cycle and firm
age on cash holdings is insignificant in pre crisis, crisis and
post crisis period.
V. CONCLUSION
This study investigates the impact of financial crisis 2008-
2009 on cash holdings of Indian manufacturing firms.
Further, the study examines the impact of firm specific
determinants such as Firm size, Growth opportunities,
Leverage, Cash flow, Dividend, Net working capital, R&D
expenditure, Assets tangibility, Profitability, Interest
expenses, Cash conversion cycle, Inverse of Altman’s Z
Score, Firm age and Cash flow volatility on cash holdings in
pre crisis, crisis and post crisis period. The study finds that
financial crisis has impact on cash holdings of Indian
manufacturing firms. Further, it demonstrates that the impact
of firm specific determinants on cash holdings differs in pre
crisis, crisis and post crisis period. In pre crisis period,
Growth opportunities, Leverage, Cash flow and R&D
expenditure have positive impact on cash holdings whereas
Firm size, Assets tangibility, Profitability, Interest expenses
and Inverse of Altman’s Z Score have negative impact on
cash holdings. However, the impact of Dividend, Net
working capital, Cash conversion cycle, Firm age and Cash
flow volatility is insignificant. In crisis period, Leverage,
Cash flow, Profitability and Cash flow volatility have
positive impact on cash holdings whereas Firm size and
Interest expenses have negative impact on cash holdings.
However, the impact of Growth opportunities, Dividend, Net
working capital, R&D expenditure, Assets tangibility, Cash
conversion cycle, Inverse of Altman’s Z Score and Firm age
is insignificant. In post crisis period, Growth opportunities,
Leverage, Cash flow, Dividend, Net working capital, R&D
expenditure and Profitability have positive impact on cash
holdings whereas Firm size, Assets tangibility and Interest
expenses have negative impact on cash holdings. However,
the impact of Cash conversion cycle, Inverse of Altman’s Z
Score, Firm age and Cash flow volatility is insignificant.
This study is limited to Indian manufacturing firms only and
the study considers only fourteen determinants of cash
holdings which are not exhaustive. The findings of this study
are useful for corporate boards, managers, investors and
rating agencies while taking decisions. The study has further
scope to extend the work to other concerns and to study
other variables which may have impact on cash holdings.
REFERENCES
[1] Keynes, J. M. (1936). The General Theory of
Employment, Interest and Money. In the 1973 edition of
the Collected Writings of John Maynard Keynes, Vol. 7.
Edited by Donald Moggridge, London: Macmillan for the
Royal Economic Society.
[2] Modigliani, F., & Miller, M. (1958). The Cost of Capital,
Corporation Finance and the Theory of Investment. The
American Economic Review, 48(3), 261-297. Retrieved
from http://www.jstor.org/stable/1809766
[3] Tobin, J. (1958). Liquidity preference as behavior
towards risk. The review of economic studies, 25(2), 65-
86.
[4] Altman, E. I. (1968). Financial ratios, discriminant
analysis and the prediction of corporate bankruptcy. The
journal of finance, 23(4), 589-609.
[5] Myers, S. C., & Majluf, N. S. (1984). Corporate financing
and investment decisions when firms have information

International Journal for Research in Engineering Application & Management (IJREAM)
ISSN : 2454-9150 Vol-05, Issue-01, April 2019
550 | IJREAMV05I0149207 DOI : 10.18231/2454-9150.2019.0354 © 2019, IJREAM All Rights Reserved.
that investors do not have. Journal of financial
economics, 13(2), 187-221.
[6] Jensen, M. C. (1986). Agency costs of free cash flow,
corporate finance, and takeovers. The American economic
review, 76(2), 323-329.
[7] John, T. A. (1993). Accounting measures of corporate
liquidity, leverage, and costs of financial
distress. Financial Management, 91-100.
[8] Kim, C. S., Mauer, D. C., & Sherman, A. E. (1998). The
determinants of corporate liquidity: Theory and
evidence. Journal of financial and quantitative
analysis, 33(3), 335-359.
[9] Opler, T., Pinkowitz, L., Stulz, R., & Williamson, R.
(1999). The determinants and implications of corporate
cash holdings. Journal of financial economics, 52(1), 3-
46.
[10] Harford, J. (1999). Corporate cash reserves and
acquisitions. The Journal of Finance, 54(6), 1969-1997.
[11] Pinkowitz, L., & Williamson, R. (2001). Bank power
and cash holdings: Evidence from The Review of
Financial Studies, 14(4), 1059-1082.
[12] Deloof, M. (2001). Belgian intragroup relations and the
determinants of corporate liquid reserves. European
Financial Management, 7(3), 375-392.
[13] Dittmar, A., Mahrt-Smith, J., & Servaes, H. (2003).
International corporate governance and corporate cash
holdings. Journal of Financial and Quantitative
analysis, 38(1), 111-133.
[14] Ozkan, A., & Ozkan, N. (2004). Corporate cash holdings:
An empirical investigation of UK companies. Journal of
Banking & Finance, 28(9), 2103-2134.
[15] Almeida, H., Campello, M., & Weisbach, M. S. (2004).
The cash flow sensitivity of cash. The Journal of
Finance, 59(4), 1777-1804.
[16] Ferreira, M. A., & Vilela, A. S. (2004). Why do firms
hold cash? Evidence from EMU countries. European
Financial Management, 10(2), 295-319.
[17] D'Mello, R., Krishnaswami, S., & Larkin, P. J. (2005).
An Analysis of the Corporate Cash Holding Decision.
Department of Economics and Finance Working Papers,
1991-2006. Paper 35. University of New Orleans.
Available at http://scholarworks.uno.edu/econ_wp/35.
[18] Nguyen, P. (2005). How Sensitive are Japanese Firms to
Earnings Volatility? Evidence from Cash Holdings.
Working paper, University of New South Wales.
[19] Bhat, R., & Bachhawat, S. (2005). Cash and Cash-
Equivalent Holdings of Companies: Does the Number of
Block-Shareholders Matter? Economic and Political
Weekly, 4785-4788.
[20] Saddour, K. (2006). The determinants and the value of
cash holdings: Evidence from French firms (No. halshs-
00151916).
[21] Drobetz, W., & Grüninger, M. C. (2006). Corporate cash
holdings: Evidence from Switzerland (No. 07/06). WWZ
Forschungsbericht.
[22] Elkinawy, S., & Stater, M. (2007, June). Cash holdings
and firm value during Latin American financial crises.
In FMA Annual Meeting Program.[Online] Recuperado
de:
http://myweb.lmu.duccfcindex_filesFall07/Susan_Cash_
Holdings_and_Firm_Value_in_Latin_America. pdf (24
de febrero de 2014).
[23] Foley, C. F., Hartzell, J. C., Titman, S., & Twite, G.
(2007). Why do firms hold so much cash? A tax-based
explanation. Journal of Financial Economics, 86(3), 579-
607.
[24] Harford, J., Mansi, S. A., & Maxwell, W. F. (2008).
Corporate governance and firm cash holdings in the
US. Journal of financial economics, 87(3), 535-555.
[25] Bates, T. W., Kahle, K. M., & Stulz, R. M. (2009). Why
do US firms hold so much more cash than they used
to?. The journal of finance, 64(5), 1985-2021.
[26] Hardin, W. G., Highfield, M. J., Hill, M. D., & Kelly, G.
W. (2009). The determinants of REIT cash holdings. The
Journal of Real Estate Finance and Economics, 39(1),
39-57.
[27] Gao, P., & Yun, H. (2009). Commercial paper, lines of
credit, and the real effects of the financial crisis of 2008:
Firm-level evidence from the manufacturing
industry. Notre Dame University, manuscript.
[28] Duchin, R. (2010). Cash holdings and corporate
diversification. The Journal of Finance, 65(3), 955-992.
[29] Chen, N., & Mahajan, A. (2010). The Euro and Corporate
Liquidity. International Research Journal of Finance and
Economics, 36, 113-146.
[30] Paskelian, O. G., Bell, S., & Nguyen, C. V. (2010).
Corporate governance and cash holdings: A comparative
analysis of Chinese and Indian firms. The International
Journal of Business and Finance Research, 4(4), 59-73.
[31] Fresard, L. (2010). Financial strength and product market
behavior: The real effects of corporate cash holdings. The
Journal of finance, 65(3), 1097-1122.
[32] Lins, K. V., Servaes, H., & Tufano, P. (2010). What
drives corporate liquidity? An international survey of
cash holdings and lines of credit. Journal of financial
economics, 98(1), 160-176.
[33] Lian, Y., Sepehri, M., & Foley, M. (2011). Corporate
cash holdings and financial crisis: an empirical study of
Chinese companies. Eurasian Business Review, 1(2),
112-124.
[34] Shah, A. (2011). The corporate cash holdings:
Determinants and implications. African Journal of
Business Management, 5(34), 12939-12950.
[35] Kim, J., Kim, H., & Woods, D. (2011). Determinants of
corporate cash-holding levels: An empirical examination
of the restaurant industry. International Journal of
Hospitality Management, 30(3), 568-574.
[36] Subramaniam, V., Tang, T. T., Yue, H., & Zhou, X.
(2011). Firm structure and corporate cash
holdings. Journal of Corporate Finance, 17(3), 759-773.
[37] Tong, Z. (2011). Firm diversification and the value of
corporate cash holdings. Journal of Corporate
Finance, 17(3), 741-758.
[38] Campello, M., Giambona, E., Graham, J. R., & Harvey,
C. R. (2011). Liquidity management and corporate

International Journal for Research in Engineering Application & Management (IJREAM)
ISSN : 2454-9150 Vol-05, Issue-01, April 2019
551 | IJREAMV05I0149207 DOI : 10.18231/2454-9150.2019.0354 © 2019, IJREAM All Rights Reserved.
investment during a financial crisis. The Review of
Financial Studies, 24(6), 1944-1979.
[39] Gogineni, S., Linn, S., & Yadav, P. (2012). Evidence on
the determinants of cash holdings by private and public
companies. Available at
SSRN: https://ssrn.com/abstract=2022689 or http://dx.do
i.org/10.2139/ssrn.2022689
[40] Gill, A., & Shah, C. (2012). Determinants of corporate
cash holdings: Evidence from Canada. International
Journal of Economics and Finance, 4(1), 70-79.
[41] Song, K. R., & Lee, Y. (2012). Long-term effects of a
financial crisis: Evidence from cash holdings of East
Asian firms. Journal of Financial and Quantitative
Analysis, 47(3), 617-641.
[42] Ogundipe, L. O., Ogundipe, S. E., & Ajao, S. K. (2012).
Cash holding and firm characteristics: Evidence from
Nigerian emerging market. Journal of Business
Economics and Finance, 1(2), 45-58.
[43] Anand, L., Varaiya, N. P., & Thenmozhi, M. (2012).
Corporate Governance and Firm’s Cash Holdings:
Evidence From India. http://ssrn.com/abstract=2258266.
[44] Chua, S. H. (2012). Cash holdings, Capital structure and
Financial flexibility (Doctoral dissertation, University of
Nottingham).
[45] Pinkowitz, L., Stulz, R. M., & Williamson, R. (2013). Is
there a US high cash holdings puzzle after the financial
crisis?. Fisher College of Business Working Paper,
(2013-03), 07.
[46] Akguc, S., & Choi, J. J. (2013). Cash holdings in private
and public firms: Evidence from Europe. Working paper,
Department of Finance, Temple University, Fox School
of Business, Philadelphia, PA 19122, United States.
[47] Gao, H., Harford, J., & Li, K. (2013). Determinants of
corporate cash policy: Insights from private
firms. Journal of Financial Economics, 109(3), 623-639.
[48] Anjum, S., & Malik, Q. A. (2013). Determinants of
corporate liquidity-An analysis of cash holdings. Journal
of Business and Management, 7(2), 94-100.
[49] Ali, A., & Yousaf, S. (2013). Determinants of cash
holding in German market. Journal of Business and
Management, 12(6), 28-34.
[50] Al-Najjar, B. (2013). The financial determinants of
corporate cash holdings: Evidence from some emerging
markets. International business review, 22(1), 77-88.
[51] Mugumisi, N., & Mawanza, W. (2014). Corporate cash
holding under liquidity crisis: A Panel analysis of
Zimbabwean firms. Research Journal of Economics &
Business Studies, 3(3), 66-76.
[52] Megginson, W. L., Ullah, B., & Wei, Z. (2014). State
ownership, soft-budget constraints, and cash holdings:
Evidence from China’s privatized firms. Journal of
Banking & Finance, 48, 276-291.
[53] Nyborg, K. G., & Wang, Z. (2014). Stock liquidity and
corporate cash holdings: Feedback and the Cash as
Ammunition Hypothesis.
[54] Gautam, V., Singh, A., & Gaurav, S. (2014). Cash
holdings and finance constraints in Indian manufacturing
firms. Research in Applied Economics, 6(3), 56-75.
[55] Wang, Y., Ji, Y., Chen, X., & Song, C. (2014). Inflation,
operating cycle, and cash holdings. China Journal of
Accounting Research, 7(4), 263-276.
[56] Bashir. M. M. S. (2014). Determinants of Corporate Cash
Holdings: Panal Data Analysis: Pakistan. International
Journal of Current Research, 6(2), 5316-5318.
[57] Kinnunen, R. (2015). Is cash still king?–A study of the
firm characteristics that determine the cash holding levels
of Swedish corporations and the impact of the 2008
financial crisis on corporate cash policies.
[58] Bliss, B. A., Cheng, Y., & Denis, D. J. (2015). Corporate
payout, cash retention, and the supply of credit: Evidence
from the 2008–2009 credit crisis. Journal of Financial
Economics, 115(3), 521-540.
[59] Saluja, M. S. & Drolia, A. (2015). Effect of Credit Rating
on Cash Holding and Earning Momentum of Indian
Companies. Indian Journal of Applied Research, 5(2),
98-100.
[60] Arata, N., Sheng, H. H., & Lora, M. I. (2015).
Internationalization and corporate cash holdings:
Evidence from Brazil and Mexico. Revista de
Administração Contemporânea, 19(SPE), 1-19.
[61] Stone, A. L., & Gup, B. E. (2015). Do Business Cycles
Influence Corporate Cash Holdings? Electronic copy
available at: http://ssrn.com/abstract=2594332
[62] Al-Amarneh, A. (2015). Corporate cash holdings and
financial crisis: Evidence from Jordan. Int. Bus. Res, 8(5),
212-222.
[63] Mesfin, E. A. (2016). THE FACTORS AFFECTING
CASH HOLDING DECISIONS OF
MANUFACTURING SHARE COMPANIES IN
ETHIOPIA. International Journal of Advanced Research
in Management and Social Sciences, 5(3), 48-67.
[64] Cheung, A. W. K. (2016). Corporate social responsibility
and corporate cash holdings. Journal of Corporate
Finance, 37(C), 412-430.
[65] Maheshwari, Y., & Rao, K. V. (2017). Determinants of
Corporate Cash Holdings. Global Business Review, 18(2),
416-427.
[66] Chauhan, Y., Pathak, R., & Kumar, S. (2018). Do bank-
appointed directors affect corporate cash
holding? International Review of Economics &
Finance, 53, 39-56.


![ISSN : 2454-9150 Design and Thermal Analysis of Thermoelectric …ijream.org/papers/IJREAMV04I1248124.pdf · 2019-04-22 · P. Mohamed Shameer, D. Christopher [5] has worked on Design](https://static.fdocuments.net/doc/165x107/5f48036df7027f35374056d8/issn-2454-9150-design-and-thermal-analysis-of-thermoelectric-2019-04-22-p-mohamed.jpg)


![ISSN : 2454-9150 The Dufour and Thermal Diffusion Effects ...ijream.org/papers/IJREAMV05I0250080.pdf · properties. Hari et al. [6] also investigated radiation and chemical reaction](https://static.fdocuments.net/doc/165x107/5f1752049a3d711dbd69a8bf/issn-2454-9150-the-dufour-and-thermal-diffusion-effects-properties-hari-et.jpg)


![ISSN : 2454-9150 Analysis of Hybrid Lottery …ijream.org/papers/IJREAMV04I0945024.pdfscheduling, Round Robin, Lottery Scheduling etc. [1,4, 17]. Lottery scheduling is one of the efficient](https://static.fdocuments.net/doc/165x107/5e9219b8a064b2785853ed1e/issn-2454-9150-analysis-of-hybrid-lottery-scheduling-round-robin-lottery-scheduling.jpg)


![International Journal for Research in Engineering ...ijream.org/papers/IJREAMV05I0957001.pdf · ISSN : 2454-9150 Vol-05, Issue-09, Dec 2019 1 ... (Lambert et al., 1998) [3]. ... Abdul](https://static.fdocuments.net/doc/165x107/5fc0e96bfee64e00e67c5b8d/international-journal-for-research-in-engineering-issn-2454-9150-vol-05-issue-09.jpg)


