
ISO New England – Results of Ancillary Service Pilot Programs · PDF fileISO New England...
21
ISO New England – Results of Ancillary Service Pilot Programs: Jon Lowell and Henry Yoshimura ISO New England October 25-26, 2011 • Alternative Technology Regulation Pilot Program • Demand Response Reserves Pilot Program
Transcript of ISO New England – Results of Ancillary Service Pilot Programs · PDF fileISO New England...

ISO New England – Results of
Ancillary Service Pilot Programs:
Jon Lowell and Henry Yoshimura
ISO New England
October 25-26, 2011
• Alternative Technology Regulation Pilot Program
• Demand Response Reserves Pilot Program

Alternative Technology Regulation
Pilot Program

Alternative Technology Regulation Pilot
Program • Why?
– Stakeholder request
– Low risk opportunity to evaluate new
technologies
– Allow new technologies to experience realistic
operation
– Minimal impact on the existing regulation
market
3
• What?
– Limited to 13 MW total to ensure no threat to reliability
– Incremental to existing regulation market
– Participants operate as “price-takers”
– Will continue until permanent market changes are approved and implemented
• When?
– Commenced 11/2008; closed to new entrants after 11/2009
• Expected to re-open Q2 2012
– Will continue until permanent market changes are approved and implemented

Principal Issues
• Can these new technologies perform as advertised? – So far, the answer is yes
• What issues have been identified? – Managing state-of-charge for storage resources with limited energy storage (i.e.
less than 2 hours)
– Cost-effective metering and communications for geographically dispersed
resources (electric vehicles, demand response)
• Benefits of “fast response” vs. “sustained response” – AGC dispatch sends new set points every 4 seconds
– Many/most of the new technologies can move from top to bottom of their
regulating range within a single 4-second cycle
– NERC compliance criteria based on 15-minute intervals
• “Fast” is better than “slow”, but: – Faster response is unlikely to reduce noncompliance risk
– Might allow reduced regulation requirement
– Current New England requirement is ~65MW for a 28,000 MW summer peak
system.
4
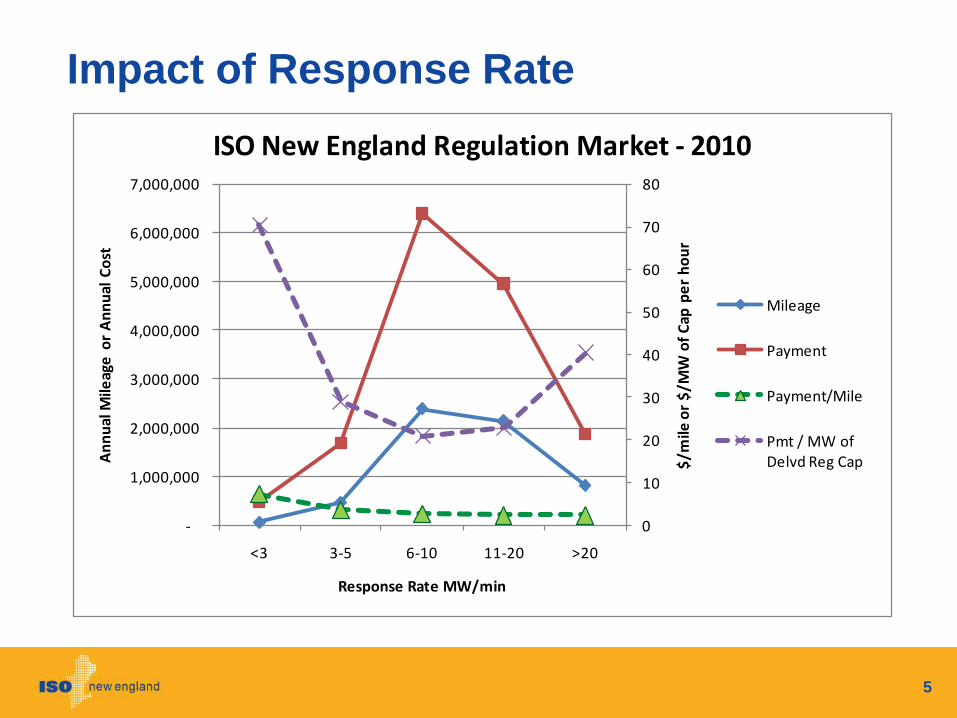
Impact of Response Rate
5
0
10
20
30
40
50
60
70
80
-
1,000,000
2,000,000
3,000,000
4,000,000
5,000,000
6,000,000
7,000,000
<3 3-5 6-10 11-20 >20
$/m
ile o
r $
/MW
of
Cap
pe
r h
ou
r
An
nu
al M
ileag
e o
r A
nn
ual
Co
st
Response Rate MW/min
ISO New England Regulation Market - 2010
Mileage
Payment
Payment/Mile
Pmt / MW of Delvd Reg Cap

Factors Affecting Regulation Market
Economics
• Late-2005 – implemented service payment and
separated resource-specific
opportunity costs from the
Regulation Clearing Price
• Early-2007 – Bidders fully adjusted to market
design
– minor improvements in selection
algorithm
• 2009 – Reduction in requirements
– Lower gas prices reduced
opportunity costs
• Future? – Uniform clearing price
– New technologies
6
0
10
20
30
40
50
60
70
80
90
0
20
40
60
80
100
120
140
160
2005 2006 2007 2008 2009 2010
Re
g P
mts
$m
Re
g R
eq
m M
W
Regulation Market
Reg Requirement MW Reg Pmts to Resources

Pilot Program – Interested Technologies
• Currently participating – Flywheels
– Residential electric thermal storage
• Qualified to participate, but not online – NaS batteries
– Commercial/industrial load control
– HVDC power electronics
• Expressions of Interest – Lithium-ion batteries
– Electric vehicles
– Buoyancy energy storage
– Wind-powered microgrid
7

Where Are We Heading?
• ISO-NE is moving to eliminate the “pilot” status and allow full
participation of these new technologies in the regulation market – Timing mostly depends on scope of forthcoming rules related to FERC’s
February 2011 Regulation NOPR
• May preserve the Pilot Program infrastructure as a technology
sandbox – Innovation doesn’t occur on schedule
– Will shorten or avoid delays related to stakeholder and regulatory
processes
• Develop cost-effective approaches to metering and settlement
to accommodate geographically dispersed “smart-grid”
applications – Expensive solutions will be a significant barrier to entry
8
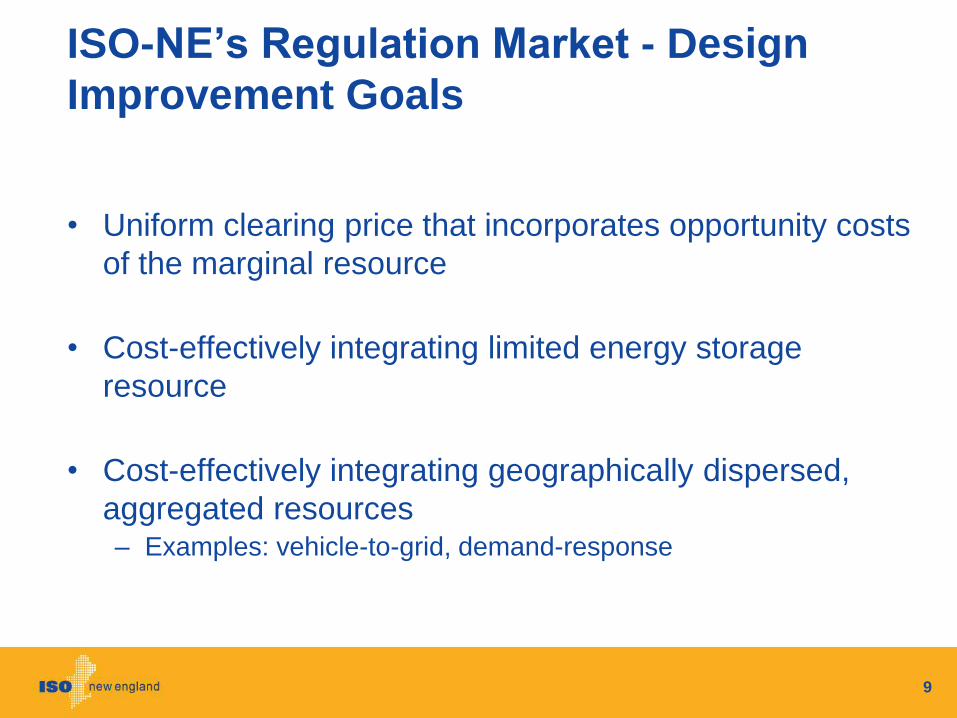
ISO-NE’s Regulation Market - Design
Improvement Goals
• Uniform clearing price that incorporates opportunity costs
of the marginal resource
• Cost-effectively integrating limited energy storage
resource
• Cost-effectively integrating geographically dispersed,
aggregated resources – Examples: vehicle-to-grid, demand-response
9

Demand Response Reserves Pilot
Program

Demand Response in Reserve Markets
• Demand Response is currently not eligible to provide
reserves to the wholesale electric system
– Dispatchable demands are eligible to provide reserves
• Demand Response Reserves Pilot started in 2006
• 50 MW test over a multi-year period to demonstrate
performance during reserve activation events
• Can Demand Response provide a product similar to 10
and 30-minute spinning and non-spinning reserves?
11

Participating Asset Types
• Load Reduction – The most common load reduction technology/strategy included
lighting and HVAC usage
– Asset performance was assessed by comparing actual metered
load during an event to an asset-specific estimated baseline
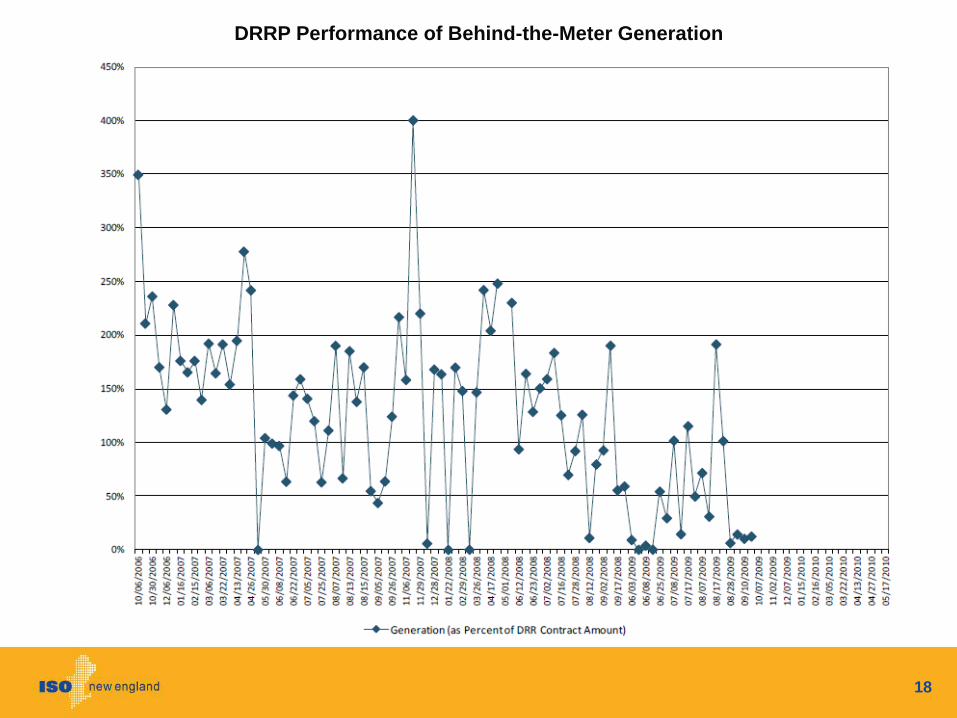
• Behind-the-Meter Generation – Asset performance assessed solely on the metered generation at
the time of an event
• Direct Load Control – Centralized control of a specific end-use across a large number
of small customers – e.g., residential air conditioner curtailment
– Asset performance was assessed by comparing actual metered
load during an event to a control group
12

Participating Industries
• Grocery Stores
• Manufacturing
• Large Retail
• Education Sector
• Wastewater Treatment Facilities
• Aggregated Air Conditioning Curtailment
• Behind-the-Meter Generators (regardless of their industry
of origin)
13

Demand Response Reserves Pilot Summary
• Pilot ran from October 2006
to May 2010
– Asset types include load
reductions, Behind the Meter
Generation, direct load
control (i.e. aggregated air
conditioner curtailment)
• 109 assets participated in at
least one season; 35 assets
participated in all seasons
– Assets enrolled in six
seasons; 26.4 MW per
season on average
– 107 events
14
0%
20%
40%
60%
80%
100%
120%
140%
160%
180%
10
/06
/20
06
10
/30
/20
06
12
/06
/20
06
01
/16
/20
07
02
/15
/20
07
03
/06
/20
07
03
/22
/20
07
04
/13
/20
07
04
/26
/20
07
05
/30
/20
07
06
/08
/20
07
06
/22
/20
07
07
/05
/20
07
07
/25
/20
07
08
/07
/20
07
08
/13
/20
07
08
/15
/20
07
09
/05
/20
07
09
/26
/20
07
11
/06
/20
07
11
/29
/20
07
12
/28
/20
07
01
/22
/20
08
02
/29
/20
08
03
/26
/20
08
04
/17
/20
08
05
/01
/20
08
06
/12
/20
08
06
/23
/20
08
07
/02
/20
08
07
/16
/20
08
07
/28
/20
08
08
/12
/20
08
09
/02
/20
08
09
/17
/20
08
06
/03
/20
09
06
/08
/20
09
06
/25
/20
09
07
/08
/20
09
07
/17
/20
09
08
/07
/20
09
08
/17
/20
09
08
/28
/20
09
09
/10
/20
09
10
/07
/20
09
11
/02
/20
09
12
/07
/20
09
01
/15
/20
10
02
/16
/20
10
03
/05
/20
10
03
/22
/20
10
04
/13
/20
10
04
/27
/20
10
05
/17
/20
10
Total Load Relief as Percent of DRR Contract Amount (Mean MW) Session Average Linear Trend
DR Reserve Pilot Performance

15
DRRP Performance of Load Reduction

16

17
18
DRRP Performance of Behind-the-Meter Generation

19
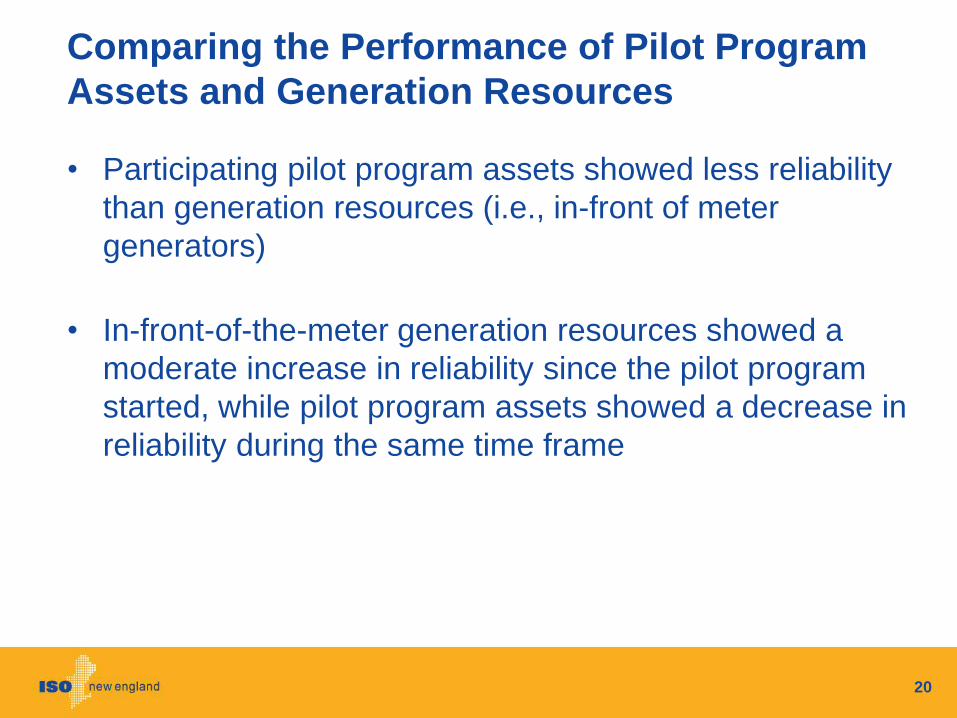
Comparing the Performance of Pilot Program
Assets and Generation Resources
• Participating pilot program assets showed less reliability
than generation resources (i.e., in-front of meter
generators)
• In-front-of-the-meter generation resources showed a
moderate increase in reliability since the pilot program
started, while pilot program assets showed a decrease in
reliability during the same time frame
20

Recommendations for Further Research
• Investigate / implement: – Performance erosion
– Audit day behavior
– Weather-based performance metrics
– Penalties for over-performance
– Tools to assist asset providers to set goals and
maintain performance
– Change rules regarding re-submission of data
– Special metering requirements for behind-the-meter
generation assets
21


![[England] Pan London Personal Education Plan Pilot Presentation (2008)](https://static.fdocuments.net/doc/165x107/55a3fd931a28ab9c1e8b45b4/england-pan-london-personal-education-plan-pilot-presentation-2008.jpg)


