Is Response to Fire Influenced by Dietary Specialization ... · Is Response to Fire Influenced by...
10
Is Response to Fire Influenced by Dietary Specialization and Mobility? A Comparative Study with Multiple Animal Assemblages Xavier Santos 1 * . , Eduardo Mateos 2. , Vicenc ¸ Bros 3 , Lluı´s Brotons 4,5 , Eva De Mas 6 , Joan A. Herraiz 7 , Sergi Herrando 4,8 ,A ` ngel Min ˜o 3 , Josep M. Olmo-Vidal 9 , Javier Quesada 8,10 , Jordi Ribes 10 , Santiago Sabate ´ 5,11 , Teresa Sauras-Yera 12 , Antoni Serra 2 , V. Ramo ´ n Vallejo 12,13 , Amador Vin ˜ olas 10 1 CIBIO/InBIO (Centro de Investigac ¸a ˜o em Biodiversidade e Recursos Gene ´ ticos), Universidade do Porto, Vaira ˜ o, Portugal, 2 Departament de Biologia Animal, Universitat de Barcelona, Barcelona, Spain, 3 Parc Natural de Sant Llorenc ¸ del Munt i l’Obac, Oficina Te ` cnica de Parcs Naturals, Diputacio ´ de Barcelona, Barcelona, Spain, 4 Grup d’Ecologia del Paisatge, A ` rea de Biodiversitat, CEMFOR-CTFC (Centre Tecnolo ` gic Forestal de Catalunya), Solsona, Spain, 5 CREAF(Centre de Recerca Ecolo ` gica i Aplicacions Forestals), Universitat Auto ` noma de Barcelona, Bellaterra, Spain, 6 Departamento de Ecologı ´a Evolutiva, de la Conducta y Conservacio ´ n, Estacio ´ n Experimental de Zonas A ´ ridas, CSIC (Consejo Superior de Investigaciones Cientı ´ficas), Almerı ´a, Spain, 7 AIM (Asociacio ´n Ibe ´ rica de Mirmecologia), Facultat de Cie ` ncies, Universitat de Girona, Girona, Spain, 8 ICO (Institut Catala ` d’Ornitologia), Museu de Cie ` ncies Naturals de Barcelona, Barcelona, Spain, 9 Servei de Biodiversitat i Proteccio ´ dels Animals, Direccio ´ General del Medi Natural i Biodiversitat, Barcelona, Spain, 10 Museu de Cie ` ncies Naturals de Barcelona, Barcelona, Spain, 11 Departament d’Ecologia, Universitat de Barcelona, Barcelona, Spain, 12 Departament de Biologia Vegetal, Universitat de Barcelona, Barcelona, Spain, 13 Fundacio ´ n CEAM. Parque Tecnolo ´ gico, Paterna, Spain Abstract Fire is a major agent involved in landscape transformation and an indirect cause of changes in species composition. Responses to fire may vary greatly depending on life histories and functional traits of species. We have examined the taxonomic and functional responses to fire of eight taxonomic animal groups displaying a gradient of dietary and mobility patterns: Gastropoda, Heteroptera, Formicidae, Coleoptera, Araneae, Orthoptera, Reptilia and Aves. The fieldwork was conducted in a Mediterranean protected area on 3 sites (one unburnt and two burnt with different postfire management practices) with five replicates per site. We collected information from 4606 specimens from 274 animal species. Similarity in species composition and abundance between areas was measured by the Bray-Curtis index and ANOSIM, and comparisons between animal and plant responses by Mantel tests. We analyze whether groups with the highest percentage of omnivorous species, these species being more generalist in their dietary habits, show weak responses to fire (i.e. more similarity between burnt and unburnt areas), and independent responses to changes in vegetation. We also explore how mobility, i.e. dispersal ability, influences responses to fire. Our results demonstrate that differences in species composition and abundance between burnt and unburnt areas differed among groups. We found a tendency towards presenting lower differences between areas for groups with higher percentages of omnivorous species. Moreover, taxa with a higher percentage of omnivorous species had significantly more independent responses of changes in vegetation. High- (e.g. Aves) and low-mobility (e.g. Gastropoda) groups had the strongest responses to fire (higher R scores of the ANOSIM); however, we failed to find a significant general pattern with all the groups according to their mobility. Our results partially support the idea that functional traits underlie the response of organisms to environmental changes caused by fire. Citation: Santos X, Mateos E, Bros V, Brotons L, De Mas E, et al. (2014) Is Response to Fire Influenced by Dietary Specialization and Mobility? A Comparative Study with Multiple Animal Assemblages. PLoS ONE 9(2): e88224. doi:10.1371/journal.pone.0088224 Editor: Brock Fenton, University of Western Ontario, Canada Received October 13, 2013; Accepted January 3, 2014; Published February 7, 2014 Copyright: ß 2014 Santos et al. This is an open-access article distributed under the terms of the Creative Commons Attribution License, which permits unrestricted use, distribution, and reproduction in any medium, provided the original author and source are credited. Funding: This study was partially supported by the ‘‘Conveni de Collaboracio ´ per al desenvolupament del Pla de gestio ´ integral per a la conservacio ´ dels sistemes naturals de la Xarxa de Parcs Naturals’’ signed by Obra Social La Caixa and the Diputacio ´ de Barcelona, and by the projects CGL2011-29539 and Consolider Montes CSD2008-00040 granted by the Spanish Ministry of Education and Science (MEC). Xavier Santos is supported by a post-doctoral Grant (SFRH/ BPD/73176/2010) from Fundac ¸a ˜o para a Cie ˆ ncia e a Tecnologia (FCT, Portugal). The funders had no role in study design, data collection and analysis, decision to publish, or preparation of the manuscript. Competing Interests: The authors have declared that no competing interests exist. * E-mail: [email protected] . These authors contributed equally to this work. Introduction Wildfires are natural disturbances that have shaped vegetation composition and structure, and influenced the associated faunas in almost all regions of the world [1]. In the Mediterranean Basin, characterized by a long, dry period with irregular rainfall, the combination of climatic and current anthropogenic effects have defined fire as a common disturbance [2]. Consequently, both natural and human-induced fires have modelled the landscape and are a fundamental element to understand Mediterranean ecosys- tem functioning and structure [3]. Over the short term, fire may act as an environmental filter that selects species better adapted to the narrow postfire environmental conditions [4]. Early postfire succession increases open areas and favours a shift in dominant species, often leading to different animal assemblages in burnt compared with unburnt areas [5–6], [7–8], [9–10]. Knowledge on how species respond to fire is a challenge, since responses vary greatly depending on particular life PLOS ONE | www.plosone.org 1 February 2014 | Volume 9 | Issue 2 | e88224
Transcript of Is Response to Fire Influenced by Dietary Specialization ... · Is Response to Fire Influenced by...

Is Response to Fire Influenced by Dietary Specializationand Mobility? A Comparative Study with Multiple AnimalAssemblagesXavier Santos1*., Eduardo Mateos2., Vicenc Bros3, Lluıs Brotons4,5, Eva De Mas6, Joan A. Herraiz7,
Sergi Herrando4,8, Angel Mino3, Josep M. Olmo-Vidal9, Javier Quesada8,10, Jordi Ribes10,
Santiago Sabate5,11, Teresa Sauras-Yera12, Antoni Serra2, V. Ramon Vallejo12,13, Amador Vinolas10
1 CIBIO/InBIO (Centro de Investigacao em Biodiversidade e Recursos Geneticos), Universidade do Porto, Vairao, Portugal, 2 Departament de Biologia Animal, Universitat de
Barcelona, Barcelona, Spain, 3 Parc Natural de Sant Llorenc del Munt i l’Obac, Oficina Tecnica de Parcs Naturals, Diputacio de Barcelona, Barcelona, Spain, 4 Grup
d’Ecologia del Paisatge, Area de Biodiversitat, CEMFOR-CTFC (Centre Tecnologic Forestal de Catalunya), Solsona, Spain, 5 CREAF(Centre de Recerca Ecologica i Aplicacions
Forestals), Universitat Autonoma de Barcelona, Bellaterra, Spain, 6 Departamento de Ecologıa Evolutiva, de la Conducta y Conservacion, Estacion Experimental de Zonas
Aridas, CSIC (Consejo Superior de Investigaciones Cientıficas), Almerıa, Spain, 7 AIM (Asociacion Iberica de Mirmecologia), Facultat de Ciencies, Universitat de Girona,
Girona, Spain, 8 ICO (Institut Catala d’Ornitologia), Museu de Ciencies Naturals de Barcelona, Barcelona, Spain, 9 Servei de Biodiversitat i Proteccio dels Animals, Direccio
General del Medi Natural i Biodiversitat, Barcelona, Spain, 10 Museu de Ciencies Naturals de Barcelona, Barcelona, Spain, 11 Departament d’Ecologia, Universitat de
Barcelona, Barcelona, Spain, 12 Departament de Biologia Vegetal, Universitat de Barcelona, Barcelona, Spain, 13 Fundacion CEAM. Parque Tecnologico, Paterna, Spain
Abstract
Fire is a major agent involved in landscape transformation and an indirect cause of changes in species composition.Responses to fire may vary greatly depending on life histories and functional traits of species. We have examined thetaxonomic and functional responses to fire of eight taxonomic animal groups displaying a gradient of dietary and mobilitypatterns: Gastropoda, Heteroptera, Formicidae, Coleoptera, Araneae, Orthoptera, Reptilia and Aves. The fieldwork wasconducted in a Mediterranean protected area on 3 sites (one unburnt and two burnt with different postfire managementpractices) with five replicates per site. We collected information from 4606 specimens from 274 animal species. Similarity inspecies composition and abundance between areas was measured by the Bray-Curtis index and ANOSIM, and comparisonsbetween animal and plant responses by Mantel tests. We analyze whether groups with the highest percentage ofomnivorous species, these species being more generalist in their dietary habits, show weak responses to fire (i.e. moresimilarity between burnt and unburnt areas), and independent responses to changes in vegetation. We also explore howmobility, i.e. dispersal ability, influences responses to fire. Our results demonstrate that differences in species compositionand abundance between burnt and unburnt areas differed among groups. We found a tendency towards presenting lowerdifferences between areas for groups with higher percentages of omnivorous species. Moreover, taxa with a higherpercentage of omnivorous species had significantly more independent responses of changes in vegetation. High- (e.g. Aves)and low-mobility (e.g. Gastropoda) groups had the strongest responses to fire (higher R scores of the ANOSIM); however, wefailed to find a significant general pattern with all the groups according to their mobility. Our results partially support theidea that functional traits underlie the response of organisms to environmental changes caused by fire.
Citation: Santos X, Mateos E, Bros V, Brotons L, De Mas E, et al. (2014) Is Response to Fire Influenced by Dietary Specialization and Mobility? A Comparative Studywith Multiple Animal Assemblages. PLoS ONE 9(2): e88224. doi:10.1371/journal.pone.0088224
Editor: Brock Fenton, University of Western Ontario, Canada
Received October 13, 2013; Accepted January 3, 2014; Published February 7, 2014
Copyright: � 2014 Santos et al. This is an open-access article distributed under the terms of the Creative Commons Attribution License, which permitsunrestricted use, distribution, and reproduction in any medium, provided the original author and source are credited.
Funding: This study was partially supported by the ‘‘Conveni de Collaboracio per al desenvolupament del Pla de gestio integral per a la conservacio delssistemes naturals de la Xarxa de Parcs Naturals’’ signed by Obra Social La Caixa and the Diputacio de Barcelona, and by the projects CGL2011-29539 andConsolider Montes CSD2008-00040 granted by the Spanish Ministry of Education and Science (MEC). Xavier Santos is supported by a post-doctoral Grant (SFRH/BPD/73176/2010) from Fundacao para a Ciencia e a Tecnologia (FCT, Portugal). The funders had no role in study design, data collection and analysis, decision topublish, or preparation of the manuscript.
Competing Interests: The authors have declared that no competing interests exist.
* E-mail: [email protected]
. These authors contributed equally to this work.
Introduction
Wildfires are natural disturbances that have shaped vegetation
composition and structure, and influenced the associated faunas in
almost all regions of the world [1]. In the Mediterranean Basin,
characterized by a long, dry period with irregular rainfall, the
combination of climatic and current anthropogenic effects have
defined fire as a common disturbance [2]. Consequently, both
natural and human-induced fires have modelled the landscape and
are a fundamental element to understand Mediterranean ecosys-
tem functioning and structure [3].
Over the short term, fire may act as an environmental filter that
selects species better adapted to the narrow postfire environmental
conditions [4]. Early postfire succession increases open areas and
favours a shift in dominant species, often leading to different
animal assemblages in burnt compared with unburnt areas [5–6],
[7–8], [9–10]. Knowledge on how species respond to fire is a
challenge, since responses vary greatly depending on particular life
PLOS ONE | www.plosone.org 1 February 2014 | Volume 9 | Issue 2 | e88224
histories of each species [11–12], [13]. Some taxonomic groups
undergo a postfire increase in the number of species [8–14], other
groups show a reduction [9], [15–16], and still others display
specific differences within the group (e.g. amphibians [17], reptiles
[18–19], arthropods [2], birds [20]).
The response of animal communities to fire is driven primarily
by habitat characteristics, i.e. vegetation structure and composition
[21], [22–23]. Several studies have documented that animal
communities respond to fire following habitat changes over
postfire succession (e.g. [9] for snails, [18] for reptiles, [24] for
birds]. These examples support the habitat-accommodation model
of succession (but see [25]), which states that species enter a
community when their preferred habitat type has developed and
then decline as the plant succession proceeds beyond their optimal
habitat conditions [26].
Specific functional traits have proved an excellent approach for
understanding the mechanisms of community responses to fire
[13–27]. Disturbances such as fire are processes which alter the
niche opportunities available to the species in a system, causing
shifts in available resources, and inflicting impacts on the niche
relationships of the organisms [28]. Thus, the response of
organisms to fire may be mediated by their ecological specializa-
tion in resource use. In a general way, the disturbance theory states
that specialist species are negatively affected by disturbance, while
generalist species benefit from it (e.g. [29–30]). In stable
environments, generalists cannot outperform specialists due to
the inherent extra physiological and behavioural costs associated
with generalists, which accommodate multiple prey types, variable
environments, or activity timing [31]. In variable environments,
however, these costs may be small in comparison to the benefits
inherent to the increased plasticity, and therefore generalists may
gain an advantage with respect to specialists [30]. Hence,
ecosystems characterized by abrupt environmental changes
triggered by disturbances would promote generalist species [29].
In our study, we have examined the taxonomic and functional
response to fire by eight terrestrial animal taxa including
invertebrate non-arthropod, arthropod, and vertebrate groups.
Species were classified according to their dietary habits following a
dietary specialization and mobility gradients. Our objective was to
compare responses to fire among taxonomic groups (i.e. species
composition per taxon) and functional traits (i.e. dietary-special-
ization and mobility). We tested whether taxa with a higher
proportion of dietary generalists (i.e. omnivorous) had lower
responses to fire, that is, whether species composition and
abundance were more similar between burnt and unburnt sites
(Hypothesis 1). In a broad sense, we assume that omnivores are the
most generalist species as they can potentially exploit a wider
number of food resources. For this reason, we expect that
taxonomic groups having a higher proportion of omnivorous
species would be more prone to have responses unrelated to shifts
in plant composition (Hypothesis 2). We also tested whether
mobility, a key factor in the dispersal capacity of animals, might
influence species composition and abundance among groups
(Hypothesis 3). Although post-fire recovery may not depend on
recolonization rates (see [32]), this attribute is expected to enable
species to select adequate habitats in a contrasting (burnt-unburnt)
environment.
This study was conducted in a natural park located in north-
eastern Spain and affected by a large fire in 2003. Partial results in
the park have previously been reported for snails [9], [33–34],
reptiles [19], and Hymenoptera [35], showing contrasting
responses among species to taxonomic and functional levels.
These preliminary results encouraged a comparative analysis with
the general aim of analysing how responses of a set of animal
organisms diverge after being affected by the same disturbance.
This comparative study is meant to identify which groups are
more sensitive to postfire habitat changes, and to categorize the
sign and magnitude by which each group is affected by fire. The
identification of the communities most sensitive to fire is critical to
anticipate the impact of projected future changes in the fire regime
driven by climate change [36] and thereby guide postfire
management efforts to conserve biodiversity (e.g. [37–38]).
Materials and Methods
Study Area and Fire HistoryThe field work was conducted in Sant Llorenc del Munt i
l’Obac Natural Park (Barcelona province, NE Spain). This reserve,
located in the Catalan Pre-coastal Mountain Range, has a total
area of 13,694 hectares. The park is composed of a polymictic
conglomerate ground made up of a deposition of pebbles from a
varied origin cemented by an argillaceous and calcareous matrix.
The climate of the study area is subhumid Mediterranean with
mean annual temperature 12.2uC, ranging from 3.7uC in the
coldest month and 22.1uC in the hottest month. Rainfall, reaching
around 600 mm annually, is higher in spring and autumn than in
summer. Thus, the area is prone to fast-spreading fires during hot,
dry summers. The typical forest tree in the Park is Holm oak
Quercus ilex. However, in peripheral lowland areas of the park,
Holm oak was partially replaced by vineyards at the beginning of
the 20th century, but, after the devastating Phylloxera plague, the
fields were abandoned and replaced by Aleppo Pine Pinus halepensis
and Black Pine Pinus nigra. The understory of these pine forests is
composed mainly of Holm oak and Mediterranean shrub species.
The study area burned in August 2003 during a summer crown
fire that affected 4,443 ha on the eastern border of the park, with
1,778 ha of this lying inside the park. Driven by wind, the entire
area burned in just one day (10 August 2003). The burnt area was
dominated by pines with small patches of Holm oak forests,
abandoned agricultural lands, and scrublands (see more details in
[34]). Timber removal began soon after the fire, and two years
later most of the area was almost completely logged with only
woody debris remaining on the ground. After the logging, a sub-
area was also subsoiled to plant mainly coniferous stands.
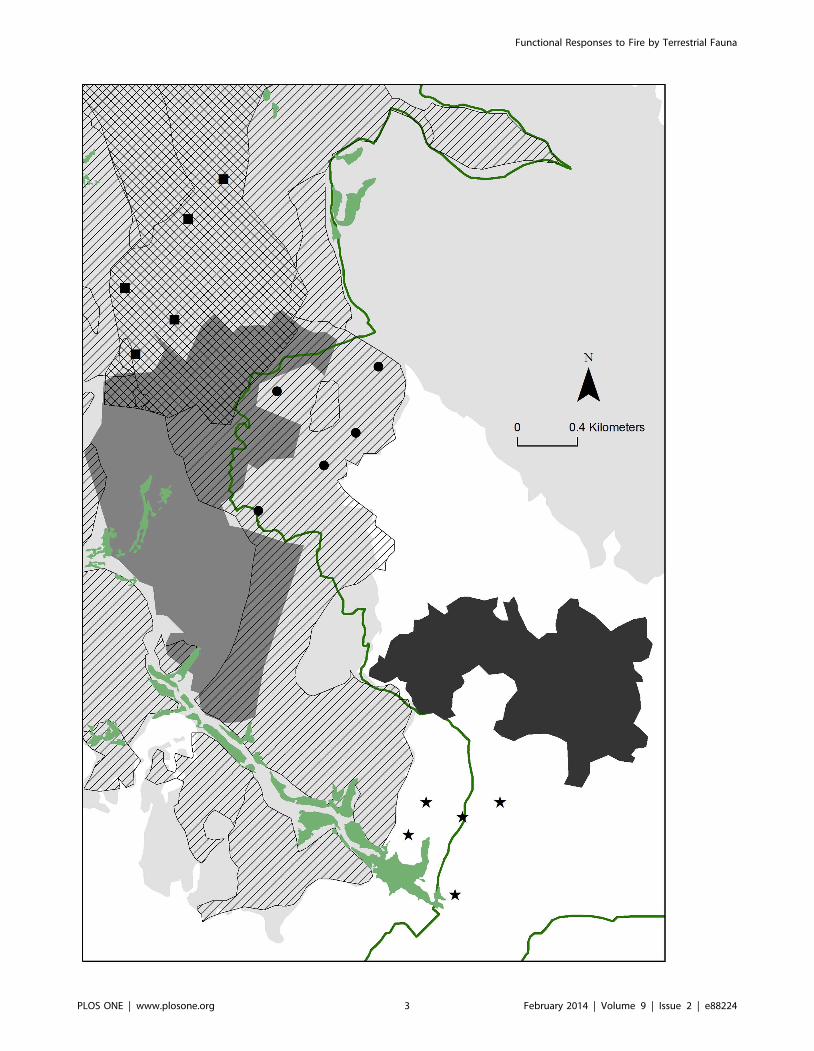
Site SelectionSampling points were selected taking into account postfire
management applied in the study area (Figure 1). According to
these practices, we defined two different burnt areas: ‘‘Logging’’
was the area burnt only in 2003 with subsequent logging; and
‘‘Subsoiling’’ was the area burnt only in 2003 with subsequent
logging and subsoiling. Logging (removal of the burnt tree trunks)
and subsoiling (breaking up the soil 60 cm in depth to increase soil
volume) may have different impacts on ecosystem function and
structure, as well as on animal and plant diversity (see [39] for the
logging impact); for this reason, both areas were separately
considered in further analyses. Additionally, we established an
unburnt reference area (‘‘Unburnt’’) in a pine forest near the fire
edge with the same dominant tree species of the burnt area before
the fire (Figure 1).
Surveys were conducted in five spatial replicates (hereafter,
sampling points) per area (Figure 1). Sampling points at the
unburnt area and those with the same post-fire practice were
spatially clustered since few areas achieved the criteria to be
sampled. The five unburnt sampling points were clustered in one
area; therefore, the unburnt data would provide an a priori weak
reference point from which to infer differences between burnt and
Functional Responses to Fire by Terrestrial Fauna
PLOS ONE | www.plosone.org 2 February 2014 | Volume 9 | Issue 2 | e88224
Functional Responses to Fire by Terrestrial Fauna
PLOS ONE | www.plosone.org 3 February 2014 | Volume 9 | Issue 2 | e88224

unburnt sites. However, three main arguments give credibility to
the selection of unburnt points: 1) burnt and unburnt sampling
points were selected within similar environmental conditions (i.e.
orientation, slope, and soil composition), in order to control biases
in the sampling design related to factors that might influence fauna
and flora composition; 2) three independent criteria (number of
trees, snail assemblages, and bird censuses) indicate that environ-
mental conditions and fauna composition before the fire were
similar between the unburnt and burnt areas (see more details in
the next section); and 3) the distance between the five unburnt
points (mean score = 466 m, range 247–689) is far enough for low-
mobility species. Although the clustering might affect especially
high-mobility species such as birds, Herrando et al. [5] demon-
strated in an area less than 100 km far from the Sant Llorenc del
Munt Natural Park that the bird species composition and
abundance of different unburnt points surrounding a 5000-ha fire
were very similar, in contrast to the diverse bird communities
within the burnt area.
Furthermore, the main objective of our study was to examine
differences among taxonomic and functional groups in a scenario
disturbed by the fire, not differences among areas. For this reason,
the potential effects of the clustering selection of replicates
constrained by the management plans did not compromise the
results or further discussion.
Pre-fire Vegetation StructureWe examined the pre-burnt vegetation structure using an aerial
photograph taken in 2001, two years before the fire. At each
sampling point, we counted the number of trees in a 50-m buffer
and checked differences among sites. This analysis demonstrated
that the average number of pines within each buffer did not differ
between the three areas (Logging area: mean = 94.6 pines; s.e.
16.4, range 62–151; Subsoiling area: mean = 66.6 pines; s.e. 20.7,
range 19–132; Unburnt area: mean = 93.6 pines; s.e. 22.2, range
44–147; Kruskal-Wallis test H = 1.58, d.f. = 2, p = 0.45). Conse-
quently the three areas were considered similar before the 2003
fire in terms of the main element of the habitat structure.
Avifaunal surveys made before the 2003 fire (unpublished data) as
well as post-fire analysis of shells from dead gastropods collected at
the burnt area [9] also suggested that the three areas were similar
before the 2003 fire in terms of faunal composition.
Fauna and Flora SamplingAt each sampling point, we recorded the relative abundance of
eight taxonomic animal groups namely Gastropoda (GAS),
Heteroptera (HET), Formicidae (FOR), Coleoptera (COL),
Araneae (ARA), Orthoptera (ORT), Reptilia (REP), and Aves
(BIR). All the animal groups were sampled at the same points
during June and July 2007, i.e. four years after the fire. This short
sampling period precluded a complete identification of the animal
communities (this was not an objective of this study) although it
allowed a direct comparison among taxonomic groups. Censuses
were taken using the most cost-effective species-specific methods
for each taxon (Text S1 in File S1). Vegetation was sampled
during the same period, in 2065 m2 field plots in each area and
replicate. All the plant species detected (grass, shrubs, and trees)
were identified to the species level for further analyses.
The sampling was conducted under permits of the Servei de
Biodiversitat i Proteccio dels Animals (Direccio General del Medi
Natural i Biodiversitat, Catalan Government, Spain) and Sant
Llorenc del Munt i l’Obac Natural Park (Diputacio de Barcelona,
Spain).
Functional-trait ClassificationSpecies found in the study area were classified according to diet
and mobility by researchers who are specialized in each taxonomic
group and are authors of this multi-taxonomic study. Diet is only
one component of the functional complexity of organisms,
although it is key to examine how organisms respond to land-
use changes from a functional perspective [40], and it is the easiest
trait known for a set of species such as those examined in the
present study. Although dietary details are not complete for many
species found in the study area, we grouped them according to
their dietary habits as zoophagous, phytophagous, saprovorous, or
omnivorous. As omnivorous species are predatory and phytoph-
agous at the same time, these species were considered more
generalist in their dietary habitats than the others. Taxonomic
groups were classified as high-mobility (Aves, Orthoptera and
vegetation Coleoptera), medium-mobility (soil and vegetation
Formicidae and Araneida), or low-mobility (soil Gastropoda,
Reptiles, soil Heteroptera, and soil Coleoptera ) groups. Arthro-
pods were collected with two sampling methods (pitfalls and nets).
Due to logistic limitations, only Coleoptera and Formicidae were
classified to the species level from specimens collected with both
sampling methods as these taxa have high species richness and
functional diversity. Pitfalls and net sweeping encompass a very
different fraction of arthropod communities (from ground and
vegetation, respectively). Therefore, we analyzed separately ant
and beetle communities collected by both methods. For the rest of
the groups, we classified just the fraction that a priori was of most
interest in terms of functional diversity, species richness or
singularity.
Statistical ProceduresFor each sampling point and animal group, we measured the
total number of specimens, species richness, and evenness.
Evenness refers to how close in numbers each taxonomic group
in a sampling point is, and was measured as the reciprocal form of
Simpson’s index divided by the number of species in the sample
[41]. Evenness ranged from 0 to 1 (the lower the variation in
communities between the species, the higher the evenness). For
each animal group, species richness and evenness per sampling
point were compared among the three areas by an ANOVA or the
Kruskal-Wallis test after checking the homogeneity of variances by
the Levene test. Overall species richness and evenness per
sampling point were also calculated pooling the data of all the
animal groups. When differences were significant, post hoc
comparisons were checked with Student-Newman-Keuls tests.
Relative abundance data recorded per sampling point were then
analysed at three different levels:
1) At a taxonomic level, animal species were grouped into 10
taxonomic categories (soil and vegetation Coleoptera and
Formicidae were considered separately). Given the low
Figure 1. Location of the study area and sampling points. Geographic location of the study area in south-western Europe (A), area burnt in2003 (grey lines) with respect the Natural Park perimeter (dotted line) (B) and distribution of sites sampled (C). Symbols of sampling points: unburntarea (stars), subsoiling (squares), and logging (circles). Black area: perimeter of Sant Llorenc Savall village; light grey area: perimeter of the fire in 2003;dark grey: perimeter of a previous fire occurred in 1972; green: open areas. Green line: limits of the Natural Park. Postfire management after the fire in2003: logged (dashed area), and subsoiled (squared area).doi:10.1371/journal.pone.0088224.g001
Functional Responses to Fire by Terrestrial Fauna
PLOS ONE | www.plosone.org 4 February 2014 | Volume 9 | Issue 2 | e88224

number of replicates per area, we removed from taxonomic
analyses (PCA and ANOSIM) those animal species with very
low occurrences (less than three records on the complete
sampling). A high number of rare species can affect similarity
analyses between pairs of sites. With this procedure, we
avoided biases by excluding species with very low occurrence
due to their scarcity or low detectability.
From the animal species abundance matrix at each sampling
point, we carried out a principal component analysis (PCA) to
show the similarity in animal composition between areas. Animal
species scores were log-transformed (log x+1) and divided by the
standard deviation (see [42]) in order to avoid differences in
species abundance due to different sampling methodologies used
with soil animals (pit-fall traps) and vegetation animals (sweep-
netting). The PCA analysis was made using CANOCO software
[42].
Differences in animal-species composition (using abundance
data) between pairs of sampling points were quantified by the
Bray-Curtis similarity index. From the similarity matrix, we
performed an ANOSIM [43], which gives a general R-value and
allows pairwise comparisons between the three areas. In an effort
to avoid biases due to the existence of aggregate species with large
sample sizes at a single sampling point, before the similarity and
ANOSIM analyses, relative abundances of soil and vegetation
Coleoptera and Gastropoda were sqr-transformed, and relative
abundance values of soil and vegetation Formicidae and total
fauna were log-transformed (log x+1).
To compare responses to fire among animal communities, we
used the scores of the R statistics found in the pairwise
comparisons of the ANOSIM in a principal component analysis
(PCA); those communities with similar responses were expected to
show similar R scores in the pairwise comparisons between areas
and then to be grouped in the biplot of the two more explicative
factors of the PCA.
2) At a functional level, and within each taxonomic group, the
matrix of dietary-trait abundance values was examined
following the same procedures as for the species-abundance
matrix: firstly, we performed a PCA with abundance values
of each feeding group per sampling point; secondly, we
quantified differences between areas by the Bray-Curtis
similarity index, and thirdly, we performed an ANOSIM.
3) Finally, we compared the taxonomic and functional respons-
es between animal groups and vegetation. This relationship
was analysed using a battery of Mantel tests. To perform this
analysis, we first created a vegetation-similarity matrix
comparing plant composition between pairs of the
2065 m2 field plots. The Mantel test then compared the
Bray-Curtis similarity matrix of vegetation with the Bray-
Curtis similarity matrix of each faunal group (abundance);
each comparison gave a Rho statistic and p values which
summarized differences between matrices. These element-by-
element correlations of two similarity matrices were con-
ducted by the RELATE routine in PRIMER software [43].
To check our hypotheses, the general R-value (taxonomic
similarity among areas) and the Rho statistic (similarity in the
responses between plants and animals) calculated for each animal
group were correlated to the total percentage of omnivorous
species found within each group (Hypothesis 1 and 2). We also
checked whether similarities among areas for each taxonomic
group were related to mobility patterns (Hypothesis 3).
Results
Taxonomic ComparisonsOverall, we recorded 4606 individuals from 274 animal species
(26 molluscs, 213 arthropods and 35 vertebrates, Table S1 in File
S1) and identified 135 plant species (Table S2 in File S1). The
mean number of animal species recorded per site did not differ
among areas (ANOVA test F2,14 = 1.505, P = 0.26) whereas
evenness marginally differed (F2,14 = 3.647, P = 0.06), being higher
in the unburnt area. For each animal group, the comparison in
species richness and evenness among the three areas showed
different responses: for some groups, the highest scores were at
unburnt sites (e.g. Gastropoda and Aves in species richness),
whereas for others at burnt sites (e.g. vegetation Coleoptera).
Araneae had higher species richness in the area subsoiled, and
higher evenness in the area logged. We found no differences for
the rest of the groups (Figure S1 in File S1).
The total number of species (and specimens) found was 147
(1836) at Logging, 140 (1613) at Subsoiling, and 161 (1157) at
Unburnt areas. After removing animal species with a low number
of individuals, we maintained for further analyses 4439 individuals
from 152 species (105 in area Logging, 102 in area Subsoiling, and
103 in area Unburnt). The number of species found exclusively in
one area was low: 5 species in Logging, 10 in Subsoiling, and 24 in
Unburnt, this result indicating that most species were likely found
in at least two different areas. The ANOSIM analysis showed that
all the animal assemblages except vegetation Formicidae,
Orthoptera, and soil Coleoptera differed overall among sampling
areas (R statistic and percentage of the adjusted statistic ,5%,
Table S3 in File S1). When all the animals for each sampling point
were pooled, pairwise comparisons also proved significant, hence
demonstrating that the faunal composition and species abundance
differed among the three areas. ANOSIM scores were similar for
the overall and taxonomic groups when rare species were not
excluded. Vegetation showed significant differences in plant
composition except for the comparison between the areas Logging
and Subsoiling (Table S3 in File S1).
In the PCA biplot drawn from the relative abundance values of
the 152 animal species, axis 1 (variance explained = 21.2%) clearly
discriminated the unburnt area from the two burnt areas. The two
burnt areas had more similar species composition (Figure 2A). In
the PCA biplot drawn with the R scores of the pairwise
comparisons between the three areas, the first axis explained a
significant amount of variation (variance explained = 94.0%) and
discriminate between unburnt and burnt areas (Figure 3). Animal
groups showed a gradient of taxonomic response to fire: Aves,
vegetation Coleoptera and Gastropoda were the groups with the
strongest response to fire (positive values in axis 1, Figure 3), and
soil Formicidae and Orthoptera showing the lowest response.
Dietary Functional ComparisonsAt a functional level, the highest number of species correspond-
ed to zoophagous and phytophagous dietary types, whereas the
abundance of phytophagous and omnivorous individuals was
larger (Table 1). The PCA biplot drawn from the relative
abundances of the four functional dietary classes per sampling
point, clearly discriminated the unburnt area from the two burnt
areas (axis 1; variance explained = 27.5%), the two burnt areas
having more similar dietary composition (Figure 2B; Table 1). The
ANOSIM showed differences in the abundance of the four dietary
types between unburnt and the two burnt areas (Table S4 in File
S1), especially due to the highest proportion of zoophagous
animals in the unburnt area (Table 1). For each animal group,
only Araneae, Aves, and vegetation Coleoptera showed significant
Functional Responses to Fire by Terrestrial Fauna
PLOS ONE | www.plosone.org 5 February 2014 | Volume 9 | Issue 2 | e88224

variation in the overall proportion of functional groups between
areas (R statistic and percentage of the adjusted statistic ,5%,
Table S4 in File S1). We found no significant correlation between
the proportion of omnivorous species within each taxonomic
group and their taxonomic and functional differences among
areas, i.e. R scores (Hypothesis 1; Figure 4A; Spearman
correlation, P.0.5).
Comparison of Animal and Plant CompositionThe similarity matrix between sampling points based on
presence/absence of plant species and similarity matrices based
on abundances of each animal group, were compared by Mantel
tests. The Rho statistic of each comparison showed a significant
association between vegetation and fauna in four out of 10 groups,
namely Aves, Gastropoda, vegetation Coleoptera and soil
Heteroptera (Table 2). Notably, taxonomic groups with higher
Rho values (more similar responses between animals and plants)
Figure 2. Principal component analysis biplots according the taxonomic and functional responses to fire. (A) PCA based on thestandardized relative abundances of 152 animal species sampled after removing rare species (less than three records) at the 15 sampling points(numbered from 11 to 35). Each number indicates the position of one sampling site, and the polygons join sites of the same area. Points U1 toU5 = unburnt pine forest (‘‘U’’), L1 to L5 = logging (‘‘L’’), S1 to S5 = subsoiling (‘‘S’’). Axis 1 (horizontal) = 21.2% of explained variance, axis 2(vertical) = 11.8%. (B) PCA based on the abundances of the four feeding groups (zoophagous, phytophagous, saprovorous, and omnivorous) collectedat the 15 sampling points (numbered from 11 to 35). Each number indicates the position of one sampling site, and the polygons join sites of the samearea. Points U1 to U5 = unburnt pine forest (‘‘U’’), L1 to L5 = logging extraction (‘‘L’’), S1 to S5 = subsoiling (‘‘S’’). Axis 1 (horizontal) = 27.5% of explainedvariance, axis 2 (vertical) = 15.3%.doi:10.1371/journal.pone.0088224.g002
Figure 3. Principal Component Analysis biplot based on R scores of the pairwise comparisons between the three areas for eachanimal group. Axis 1 (horizontal) = 94.0% of variance explained, axis 2 (vertical) = 6.0%. Acronyms of the three areas: unburnt ‘‘U’’, logging ‘‘L’’, andsubsoiling ‘‘S’’. Acronyms of animal groups: Gastropoda (GAS), Heteroptera (HET), Formicidae (FOR), Coleoptera (COL), Araneida (ARA), Orthoptera(ORT), Reptilia (REP), and Aves (BIR). Animal group acronym followed by –v or –s means vegetation or soil group respectively. Except FOR-s and ORT-v, animal groups tend to have their maximum R scores in burnt (L or S) versus unburnt (U) areas in the ANOSIM pairwise comparisons.doi:10.1371/journal.pone.0088224.g003
Functional Responses to Fire by Terrestrial Fauna
PLOS ONE | www.plosone.org 6 February 2014 | Volume 9 | Issue 2 | e88224

had a lower number of omnivorous (generalist) species (Pearson
correlation r = 20.768, P = 0.009; Figure 4B) and specimens
(r = 20.750 P = 0.01). This result suggests that the response of
animals to fire is likely governed by changes in vegetation
composition for those groups with a higher number of dietary
specialists (Hypothesis 2).
Mobility Functional ComparisonsThe highest mobility and lowest mobility groups (Aves and
Gastropoda, respectively) showed the strongest response to fire
(positive values in axis 1, Figure 3). We found a pattern accounting
for higher responses to fire (higher differences) in high- and low-
mobility than in medium-mobility groups (Hypothesis 3;
Figure 4C); these differences, however, had no statistical support
(Kruskal-Wallis test H = 0.704, d.f. = 2, P = 0.76).
Discussion
Our study, made in an early stage of the post-fire succession,
highlights notable differences in animal composition between
burnt and unburnt areas. Although the sampling design was
constrained by the clustered distribution of replicates, especially
the unburnt ones, there are several independent pieces of evidence
showing that sites were similar in fauna and flora prior to the fire
[5–9]; this finding gives more confidence that our results represent
a real effect of past burning. The sampling design precludes to
conclude that differences between burnt and unburnt areas are
exclusively the result of fire. However, similarity among areas in
pre-fire habitat and fauna, and differences in post-fire habitat
structure supports the contention that variation in animal
composition is related to fire. The low number of exclusive species
suggests that differences are due primarily to the replacement of
dominant species among areas. It is known that postfire
simplification in vegetation structure may cause replacements of
dominant species [5–9], which, as the present study shows, can
affect a diverse array of animal assemblages.
Comparing responses to fire among the animal groups, we
found clear evidence that animal communities did not respond
uniformly to early postfire succession, as reported by [44] in
arthropod communities in temperate forests. We found a response
gradient, with some taxonomic groups showing a strong response
to fire (Aves, vegetation Coleoptera, and Gastropoda) whereas
other groups did not (Orthoptera, Formicidae). The fact that
different groups responded differentially to the same disturbance
emphasizes the importance of taking into account the degree to
which a taxon may be used as a surrogate for the effects of
disturbances on the whole ecosystem. Importantly, this specific-
taxon variation seems at least partially related to functional traits
of each group.
Figure 4. Figures of the three hypotheses tested. (A) Correlationbetween the proportion of omnivorous species within each taxonomicgroup and their taxonomic differences, i.e. R scores, among areas(Hypothesis 1). R values were calculated by ANOSIM; higher scoresmean higher differences in species abundance and composition amongareas. Pearson correlation line is showed. (B) Correlation between theproportion of omnivorous species within each group and their plant-animal similarity responses, i. e. Rho scores, among areas (Hypothesis 2).Rho values were calculated by Mantel tests; higher scores means moresimilar responses between plants and animals. Pearson correlation lineis showed. (C) Differences in R values for the taxonomic groupsclassified according to their mobility (Hypothesis 3). R values werecalculated with ANOSIM; higher scores mean higher differences inspecies abundance and composition among areas.doi:10.1371/journal.pone.0088224.g004
Table 1. Number of species and specimens according to diet.
Number of species and percentage per area
‘‘U’’ ‘‘L’’ ‘‘S’’ Total
Zoo 51 (31.7) 40 (27.2) 46 (32.9) 90 (32.8)
Phy 54 (33.5) 61 (41.5) 58 (41.4) 105 (38.3)
Sap 17 (10.6) 8 (5.4) 9 (6.4) 23 (8.4)
Omn 39 (24.2) 38 (25.9) 27 (19.3) 56 (20.4)
Total 161 147 140 274
Number of specimens and percentage per area
‘‘U’’ ‘‘L’’ ‘‘S’’ Total
Zoo 175 (15.1) 115 (6.3) 136 (8.4) 426 (9.2)
Phy 418 (36.1) 528 (28.8) 450 (27.9) 1396 (30.3)
Sap 32 (2.8) 70 (3.8) 85 (5.3) 187 (4.1)
Omn 532 (46.0) 1123 (61.2) 942 (58.4) 2597 (56.4)
Total 1157 1836 1613 4606
Zoophagous (Zoo), phytophagous (Phy), saprovorous (Sap), and omnivorous(Omn). For each area, the five sampling points were pooled. Abbreviations ofthe three areas are unburnt (‘‘U’’), logging (‘‘L’’), and subsoiling (‘‘S’’).doi:10.1371/journal.pone.0088224.t001
Functional Responses to Fire by Terrestrial Fauna
PLOS ONE | www.plosone.org 7 February 2014 | Volume 9 | Issue 2 | e88224

Responses to Fire According to the Number of GeneralistSpecies
The Mantel tests suggest that plants and animals showed similar
trends in their responses to fire (see also [45]). This conclusion
supports the general acceptance that habitat attributes (vegetation
structure and cover) may be keystones of animal responses to fire
(e.g. [45–46]). We failed to detect a correlation between the
response to fire (overall R values for each animal group) and
proportion of generalist species (Hypothesis 1). However, we found
a significant correlation in the similarity of animal-plant responses
and the proportion of generalist species (Hypothesis 2) as groups
with large numbers of omnivorous (generalist) species (i.e.
Formicidae and Orthoptera, Table 2) had more vegetation-
independent responses. For omnivorous species, postfire shifts in
plant composition appears to be unimportant, compared to feeder-
specialist species. As expected, Formicidae and Orthoptera were
also the most resilient groups, this indicating a link between
resilience and non-specialization in functional traits. Resilience,
the ability of a species/community/system to recover from an
environmental change [47], has been linked to the diversity of
responses [48] at the ecosystem level, to diversity and heteroge-
neity [49] at the community level, and to particular functional
traits (e.g. generalist species) [50] at the species level. Ecological
theory predicts that specialist species would be favoured in stable
systems whereas abrupt environmental changes triggered by
disturbances would promote generalist species [29]. Based on a
set of species and taxonomic groups, our results indicate that fire
favoured the maintenance of generalist (omnivorous) species, this
fact reflecting high resilience in these taxa. However, strong
taxonomic differences in the majority of groups suggest a
replacement of non-generalist species from unburnt to burnt
habitats. This apparent contradiction of the theory has been
detected in a bird community [51], the authors arguing that
ecological specialization cannot be measured in a single gradient
due to the multidimensionality of the ecological niche, and
particular characteristics of each type of disturbance may have
specific consequences on the responses of communities. This high
degree of heterogeneity make it difficult to build general ecological
trends based on the response of organisms to disturbance, and
underscores the value of comparing the response of a number of
taxonomic groups to a single disturbance, as shown in the present
study.
Response to Fire According to Animal MobilityWithin the taxonomic groups examined, Aves was the group
with the highest mobility and the strongest response to fire at
taxonomic and functional levels. Its high species and functional
diversity, and sensitivity to habitat structure make birds a valuable
indicator of habitat changes [52]. As expected, Aves react
markedly to environmental changes due to their recolonization
abilities in burnt and postfire managed burnt habitats [7–20].
However, other groups with lower mobility such as Gastropoda
and Araneida also proved to be good indicators of habitat
variation in fire-prone areas (see also [53], [54–55]). Unexpect-
edly, Gastropoda and Aves showed a similar response with lower
species richness in burnt than unburnt sites. For Gastropoda, this
pattern may be caused by the high mortality directly inflicted by
fire and low recolonization rates [9] despite the availability of
cryptic refuges in burnt areas [56]. For Aves, this pattern appears
to be related to the higher complexity of the habitat structure at
unburnt sites coupled with their dispersal capacity along the
postfire succession [7–57]. The similar response displayed by
taxonomic groups with contrasting activity and dispersal patterns
(i.e. Aves and Gastropoda) illustrates how fire exerts strong effects
from the microhabitat to the landscape scale. We found no
statistical support for differences among groups according to their
mobility (Figure 4C), probably due to a high variability of this
functional trait among species of a particular taxon.
Biodiversity Conservation and Habitat HeterogeneitySpecies replacement in our study area suggests expansion into
burnt areas of threatened species such as the gastropod Xerocrassa
montserratensis [58], and the bird Alectoris rufa (red-legged partridge)
[59]. These results support the idea that fire may play a critical
role for some threatened Mediterranean species [60], [24–33]. In
the Mediterranean basin, during the second half of the 20th
Table 2. Mantel test results (Rho statistic) of the comparison between similarity matrices of vegetation and taxonomic faunalgroups.
Species Specimens
Rho P %Zoo %Phy %Sap %Omn %Zoo %Phy %Sap %Omn
GAS SOIL 0.320 0.0022 7.7 76.9 15.4 0.0 1.9 95.7 2.5 0.0
ARA SOIL 0.104 0.2510 100.0 0.0 0.0 0.0 100.0 0.0 0.0 0.0
HET SOIL 0.318 0.0009 25 75 0.0 0.0 34.1 65.9 0.0 0.0
FOR SOIL 20.068 0.6652 6.7 10 0.0 83.3 0.8 6.3 0.0 92.9
FOR VEG 0.004 0.4873 0.0 5.6 0.0 94.4 0.0 57.6 0.0 42.4
COL SOIL 0.121 0.1974 22.2 29.6 48.1 0.0 7.3 16.7 76.0 0.0
COL VEG 0.454 0.0004 17.2 70.3 9.4 3.1 7.1 81.2 5.4 6.3
ORT VEG 20.072 0.6857 0.0 28.6 0.0 71.4 0.0 37.4 0.0 62.6
REP 0.225 0.0992 100.0 0.0 0.0 0.0 100.0 0.0 0.0 0.0
BIR 0.349 0.0080 62.1 31 0.0 6.9 67.8 29.9 0.0 2.3
Total Fauna 0.299 0.0099 32.8 38.3 8.4 20.4 9.2 30.3 4.1 56.4
Similarity matrices were constructed with the Bray-Curtis index. Rho = Rho statistics of RELATE routine, p = Monte Carlo Permutation test of significance (9999permutations). %Zoo = percentage of zoophagous species/specimens, %Phy = percentage of phytophagous species/specimens, %Sap = percentage of saprovorousspecies/specimens, %Omn = percentage of omnivorous species/specimens. Phytophagous category include species that feed on mushrooms or any plant part (i.e.leaves, wood, roots, seeds, pollen, and nectar). For abbreviations of groups, see text (Material and methods).doi:10.1371/journal.pone.0088224.t002
Functional Responses to Fire by Terrestrial Fauna
PLOS ONE | www.plosone.org 8 February 2014 | Volume 9 | Issue 2 | e88224

century the coniferous forest area increased by pine forestation as
well as by natural pine recolonization due mainly to land
abandonment [3]. In Catalonia (NE Spain) this increase reached
130% [61]. Most wildfires in the Mediterranean basin are
currently affecting these pine forests. The short-term direct
consequence is the recovery of open areas and, as our results
show, the expansion and recolonization of open-habitat species of
a wide variety of taxa. This is particularly important, since
European biodiversity indicators for species of vertebrates (e.g.
birds) and invertebrates (e.g. butterflies) have shown sharp declines
of open-specialist species in the last few decades [62–63]. This
trend suggests that early postfire-succession stages coupled with
other processes such as traditional land uses, may play a role in the
overall conservation of biodiversity in the Mediterranean basin.
The current trend of the abandonment of traditional agriculture in
this region [64] can magnify the usefulness of manipulative
experiments such as prescribed fires to manage the conservation of
Mediterranean biodiversity, as has been reported in other regions
of the world [65].
Although fire promotes the expansion of some threatened open-
area species, many species exclusive of unburnt sites in the study
area were negatively affected by fire. In fact, fire fosters landscape
heterogeneity [49], creating a mosaic of open, forest, and ecotonal
areas. The positive role of habitat heterogeneity on biodiversity is a
well-known and predictable rule in ecology [66–67]. To maximize
biodiversity, habitat management may provide mosaics of open
and forest areas [68], hence maximizing the expansion of both
open- and forest-specialist species and thus improving the changes
of colonization of burnt areas after new disturbances [7].
Conclusions and Perspectives for ConservationalManagement Plans
Our study has demonstrated that, four years after the fire, the
majority of animal groups and plants surveyed reflect significant
differences between burnt and unburnt sites, and also several
differences among burnt areas submitted to different postfire
management practices. Differences are driven primarily by
vegetation, as we found complementary patterns in plant and
animal composition, especially for those animal groups with many
specialist species in feeding habits. The increased diversity at a
landscape level and the link between vegetation and animal
patterns in disturbed areas give extraordinary importance to
postfire management practices (see for example [69]). The main
objective of managers in wildlife reserves is to maintain the natural
biodiversity, emphasizing the preservation of endemic species. Our
study as well as other previous works demonstrate that the
maintenance of landscape heterogeneity of fire mosaics may be an
appropriate management practice [70], [37]. In areas historically
disturbed by humans and severely affected by fire, future
experimental management and subsequent wildlife monitoring
should be conducted in order to 1) validate the effectiveness of
practices in terms of benefits for biodiversity, 2) recognize
ecological mechanisms related to animal-plant interactions in
successional trajectories, and 3) identify reliable indicators (e.g.
species interactions and particular species) of postfire processes.
Supporting Information
File S1 Supporting information file including Text S1,Tables S1–S4, and Figure S1. Text S1. Description of thesampling methods. Table S1. Basic data of the 15sampled plots and abundances of animal species: burnt
logging (L1 to L5), burnt subsoiling (S1 to S5) and unburnt (U1 to
U5); Data: species included (Y) and excluded (N) in statistical
analyses according to the number of records. FG (feeding groups):
zoophagous (1), phytophagous (2), saprovorous (3) and omnivorous
(4). Table S2. List of plant species and presence in thethree areas: logging (‘‘L’’), subsoiling (‘‘S’’) and unburnt (‘‘U’’).
Table S3. R values and significance (* denotes p,0.05)from the ANOSIM taxonomic analysis of each animalgroup. The last rows are R values for the overall animal
(abundance) and plant (presence/absence) species. The Global R
column indicates the overall comparison of the three areas. The
rest of the columns indicate the pairwise comparison between
areas, with the R value and significance. Acronyms of the three
areas are unburnt reference (‘‘U’’), logging (‘‘L’’) and subsoiling
(‘‘S’’). For acronyms of groups, see text. Table S4. R values andsignificance (* denotes p,0.05) from the ANOSIMfunctional (dietary) analysis of each animal group. The
Global R column indicates the overall comparison among the
three areas. The rest of the columns indicate the pairwise
comparison between areas, with the R value and signification.
Acronyms of the three areas are unburnt reference (‘‘U’’), logging
(‘‘L’’) and subsoiling (‘‘S’’). For acronyms of groups, see text.
Figure S1. Comparison of the total number of animalspecies and evenness among areas for each animalgroup: unburnt ‘‘U’’, logging ‘‘L’’ and subsoiling ‘‘S’’. Each
column represents average scores 6 standard error. Each figure
includes the ANOVA or Kruskall-Wallis tests, and letters refer to
post hoc comparisons between areas.
(DOCX)
Acknowledgments
We thank Xavier Espadaler for classification of ant species, the people of
the Sant Llorenc del Munt i l’Obac Natural Park for their logistic support,
and especially Daniel Guinart for encouraging preliminary studies
concerning the effects of fire at the Natural Park. Pau Panella and Paulo
Lago helped us during vegetation field sampling. Gregorio Moreno-Rueda,
Zbyszek Boratynski, and Jorge Castro revised an early version of the
manuscript. David Nesbitt was responsible for language editing.
Author Contributions
Conceived and designed the experiments: XS. Performed the experiments:
XS EM VB SS TS-Y. Analyzed the data: XS EM. Wrote the paper: XS
EM. Classified animals to species level: VB EDM JAH JMO-V JR AV.
Discussed early drafts of the manuscript: XS EM LB SH SS. Discussed the
final draft according to specific expertise of each researcher: XS EM VB
LB EDM JAH SH AM JMO-V JQ JR SS TS-Y AS VRV AV.
References
1. Bond WJ, Woodward FI, Midgley GF (2005) The global distribution of
ecosystems in a world without fire. New Phytologist 165: 525–538.
2. Keeley JE, Bond WJ, Bradstock RA, Pausas JG, Rundel PW (2012) Fire in
Mediterranean Ecosystems: Ecology, Evolution and Management. Cambridge
University Press.
3. Blondel J, Aronson J, Bodiou J-Y, Bœuf W (2010) The Mediterranean Region.
Biological biodiversity in space and time. Oxford University Press.
4. Pausas JG, Verdu M (2008) Fire reduces morphospace occupation in plant
communities. Ecology 89: 2181–2186.
5. Herrando S, Brotons L, Llacuna S (2003) Does fire increase the spatial
heterogeneity of bird communities in Mediterranean landscapes? Ibis 145: 307–
317.
6. Moretti M, Obrist MK, Duelli P (2004) Arthropod biodiversity after forest fires:
winners and losers in the winter fire regime of the southern Alps. Ecography 27:
173–186.
Functional Responses to Fire by Terrestrial Fauna
PLOS ONE | www.plosone.org 9 February 2014 | Volume 9 | Issue 2 | e88224

7. Brotons L, Pons P, Herrando S (2005) Colonisation of dynamic Mediterranean
landscapes: where do birds come from after fire? J Biogeogr 32: 789–798.8. Apigian KO, Dahlsten DL, Stephens SL (2006) Fire and fire surrogate treatment
effects on leaf litter arthropods in a western Sierra Nevada mixed-conifer forest.
For Ecol Manage 221: 110–122.9. Santos X, Bros V, Mino A (2009) Recolonization of a burnt Mediterranean area
by terrestrial gastropods. Biodiv Conserv 18: 3153–3165.10. Santos X, Cheylan M (2013). Taxonomic and functional response of a
Mediterranean reptile assemblage to a repeated fire regime. Biol Conserv 168:
90–98.11. Caturla RN, Raventos J, Guardia R, Vallejo VR (2000) Early post-fire
regeneration dynamics of Brachypodium retusum Pers. Beauv. in old fields of theValencia region eastern Spain. Acta Oecol 21: 1–12.
12. Pausas JG, Verdu M (2005) Plant persistence traits in fire-prone ecosystems ofthe Mediterranean Basin: A phylogenetic approach. Oikos 109: 196–202.
13. Moretti M, de Bello F, Roberts SPM, Potts SG (2009) Taxonomical vs.
functional responses of bee communities to fire in two contrasting climaticregions. J Animal Ecol 78: 98–108.
14. Orgeas J, Andersen AN (2001) Fire and biodiversity: responses of grass-layerbeetles to experimental fire regimes in an Australian tropical savanna. J Appl
Ecol 38: 49–62.
15. Sackmann P, Farji-Brener A (2006) Effect of fire on ground beetles and antassemblages along an environmental gradient in NW Patagonia: Does habitat
type matter? Ecoscience 13: 360–371.16. Sileshi G, Mafongoya PL (2006) The short-term impact of forest fire on soil
invertebrates in the miombo. Biodiv Conserv 15: 3153–3160.17. Westgate MJ, Driscoll DA, Lindenmayer DB (2012) Can the intermediate
disturbance hypothesis and information on species traits predict anuran
responses to fire? Oikos 121: 1516–1524.18. Driscoll DA, Henderson MK (2008) How many common reptile species are fire
specialists? A replicated natural experiment highlights the predictive weakness ofa fire succession model. Biol Conserv 141: 460–471.
19. Santos X, Poquet JM (2010) Ecological succession and habitat attributes affect
the post-fire response of a Mediterranean reptile community. Eu J Wild Res 56:895–905.
20. Rost J, Clavero M, Brotons L, Pons P (2012) The effect of postfire salvagelogging on bird communities in Mediterranean pine forests: the benefits for
declining species. J Appl Ecol 49: 644–651.21. Briani DC, Palma ART, Vieira EM, Henriques RPB (2004) Post-fire succession
of small mammals in the Cerrado of central Brazil. Biodiv Conserv 13: 1023–
1037.22. Madden EM, Hansen AJ, Murphy RK (1999) Influence of prescribed fire history
on habitat and abundance of passerine birds in northern mixed-grass prairie.Can Field Nat 113: 627–640.
23. Valentine LE, Schwarzkopf L (2009) Effects of weed-management burning on
reptile assemblages in Australian tropical savannas. Conserv Biol 23: 103–113.24. Brotons L, Herrando S, Pons P (2008) Wildfires and the expansion of threatened
farmland birds: the ortolan bunting, Emberiza hortulana, in Mediterraneanlandscapes. J Appl Ecol 45: 1059–1066.
25. Lindenmayer DB, Wood JT, MacGregor C, Michael DR, Cunningham RB, etal. (2008) How predictable are reptile responses to wildfire? Oikos 117: 1086–
1097.
26. Fox BJ (1982) Fire and mammalian secondary succession in an Australiancoastal heath. Ecology 63: 1332–1341.
27. Arnan X, Cerda X, Rodrigo A, Retana J (2013) Response of ant functionalcomposition to fire. Ecography 36: 0012011.
28. Shea K, Roxburgh SH, Rauschert ESJ (2004) Moving from pattern to process:
coexistence mechanisms under intermediate disturbance regimes. Ecol Let 7:491–508.
29. Futuyma DJ, Moreno G (1988) The evolution of ecological specialization.Annual Rev Ecol System 19: 207–233.
30. Richmond CE, Breitburg DL, Rose KA (2005) The role of environmental
generalist species in ecosystem function. Ecol Model 188: 279–295.31. Levins R (1968) Evolution in changing environments. Princeton University
Press.32. Banks SC, Dujardin M, McBurney L, Blair D, Barker M, et al. (2011) Starting
points for small mammal population recovery after wildfire: recolonisation orresidual populations? Oikos 120: 26–37.
33. Santos X, Bros V, Ros E (2012) Contrasting responses of two xerophilous land
snails to fire and natural reforestation. Contrib Zool 81: 167–180.34. Bros V, Moreno-Rueda G, Santos X (2011) Does postfire management affect the
recovery of Mediterranean communities? The case study of terrestrialgastropods. For Ecol Manage 261: 611–619.
35. Mateos E, Santos X, Pujade-Villar J (2011) Taxonomic and functional responses
to fire and post-fire management of a Mediterranean Hymenoptera community.Environ Manag 48: 1000–1012.
36. IPCC (2007) Climate Change 2007: Working Group II: Impacts, Adaption andVulnerability. University of Bern.
37. Driscoll DA, Lindenmayer DB, Bennett AF, Bode M, Bradstock RA, et al.(2010a) Fire management for biodiversity conservation: Key research questions
and our capacity to answer them. Biol Conserv 143: 1928–1939.
38. Driscoll DA, Lindenmayer DB, Bennett AF, Bode M, Bradstock RA, et al.(2010b) Resolving conflicts in fire management using decision theory: asset-
protection versus biodiversity conservation. Conserv Let 3: 215–223.
39. Lindenmayer DB, Noss RF (2006) Salvage logging, ecosystem processes, and
biodiversity conservation. Conserv Biol 20: 949–958.
40. Vandewalle M, de Bello F, Berg MP, Bolger T, Doledec S, et al. (2010)
Functional traits as indicators of biodiversity response to land use changes across
ecosystems and organisms. Biodiv Conserv 19: 2921–2947.
41. Krebs CJ (1999) Ecological Methodology. 2nd ed. Benjamin Cummings.
42. ter Braak CJF, Smilauer P (1997–2002) Canoco for windows version 4.5.
Biometrics-Plant Research International.
43. PRIMER-E (2001) Primer 5 for Windows version 5.2.2. PRIMER-E ltd.
44. Moretti M, Duelli P, Obrist MK (2006) Biodiversity and resilience of arthropod
communities after fire disturbance in temperate forests. Oecologia 149: 312–
327.
45. Moretti M, Legg C (2008) Combining plant and animal traits to assess
community functional responses to disturbance. Ecography 31: 1–11.
46. Arnan X, Rodrigo A, Retana J (2006) Post-fire recovery of Mediterranean
ground ant communities follows vegetation and dryness gradients. J Biogeogr 33:
1246–1258.
47. Isaac JL, Vanderwal J, Johnson CN, Williams SE (2009) Resistance and
resilience: quantifying relative extinction risk in a diverse assemblage of
Australian tropical rainforest vertebrates. Divers Distrib 15: 280–288.
48. Elmqvist T, Folke C, Nystrom M, Peterson G, Bengtsson J, et al. (2003)
Response diversity, ecosystem change, and resilience. Front Ecol Environ 1:
488–494.
49. Bengtsson J (2002) Disturbance and resilience in soil animal communities.
Eu J Soil Biol 38: 1192125.
50. Norden N, Chazdon RL, Chao A, Jiang Y-H, Vılchez-Alvarado B (2009)
Resilience of tropical rain forests: tree community reassembly in secondary
forests. Ecol Let 12: 385–394.
51. Clavero M, Brotons L, Herrando S (2010) Bird community specialization, bird
conservation and disturbance: the role of wildfires. J Animal Ecol 80: 128–136.
52. Gregory R, van Strien A, Vorisek P, Gmelig Meyling A, Noble D, et al. (2005)
Developing indicators for European birds. Phil Trans Royal Soc B 360: 269–
288.
53. Buddle CM, Spence JR, Langor DW (2000) Succession of boreal forest spider
assemblages following wildfire and harvesting. Ecography 23: 424–436.
54. Niwa CG, Peck RW (2002) Influence of prescribed fire on carabid beetle
(Carabidae) and spider (Araneae) assemblages in forest litter in Southwestern
Oregon. Environ Entomol 31: 785–796.
55. Pearce JL, Venier LA (2006) The use of ground beetles (Coleoptera: Carabidae)
and spiders (Araneae) as bioindicators of sustainable forest management: A
review. Ecol Indicators 6: 780–793.
56. Kiss L, Magnin F (2006) High resilience of Mediterranean land snail
communities to wildfires. Biodiv Conserv 15: 2925–2944.
57. Gil-Tena A, Brotons L, Saura S (2009) Mediterranean forest dynamics and
forest bird distribution changes in the late 20th century. Global Change Biol 15:
474–485.
58. IUCN (2009) IUCN Red List of Threatened Species. Version 2009.1. Available:
www.iucnredlist.org. Accessed 2009 Jun 15.
59. Estrada J, Pedrocchi V, Brotons L, Herrando S (eds) (2004) Atles dels ocells
nidificants de Catalunya 1999–2002. Institut Catala d’Ornitologia/Lynx
Edicions.
60. Moreira F, Ferreira PG, Rego FC, Bunting S (2001) Landscape changes and
breeding bird assemblages in northwestern Portugal: the role of fire. Landscape
Ecol 16: 175–187.
61. Peix i Massip J (1999) Foc Verd II: programa de gestio del risc d’incendi forestal.
Direccio General del Medi Natural, Generalitat de Catalunya.
62. Van Swaay CAM, Van Strien AJ, Harpke A, Fontaine B, Stefanescu C, et al.
(2012) The European Butterfly Indicator for Grassland species 1990–2011.
Report VS2012.019, De Vlinderstichting, Wageningen.
63. PECBMS (2009) The state of Europe’s Common Birds 2008. CSO/RSPB.
64. Rey Benayas JM, Martins A, Nicolau JM, Schultz JJ (2007) Abandonment of
agricultural land: an overview of drivers and consequences. CAB Reviews:
Perspectives in Agriculture, Veterinary Science, Nutrition and Natural
Resources 2(57): 1–14.
65. Gaines WL, Lyons AL, Weaver K, Sprague A (2011) Monitoring the short-term
effects of prescribed fire on an endemic mollusk in the dry forests of the eastern
Cascades, Washington, USA. For Ecol Manage 261: 1460–1465.
66. Ricklefs RE (1977) Environmental heterogeneity and plant species diversity: a
hypothesis. Am Nat 111: 376–381.
67. Tews J, Brose U, Grimm V, Tielborger K, Wichmann MC, et al. (2004) Animal
species diversity driven by habitat heterogeneity/diversity: the importance of
keystone structures. J Biogeogr 31: 79–92.
68. Pons P, Lambert B, Rigolot E, Prodon R (2003) The effects of grassland
management using fire on habitat occupancy and conservation of birds in a
mosaic landscape. Biodiv Conserv 12: 1843–1860.
69. Castro J, Moreno-Rueda G, Hodar JA (2009) Experimental test of postfire
management in pine forests: impact of salvage logging versus partial cutting and
nonintervention on bird–species assemblages. Conserv Biol 24: 810–819.
70. Bradstock RA, Bedward M, Gill AM, Cohn JS (2005) Which mosaic? A
landscape ecological approach for evaluating interactions between fire regimes,
habitat and animals. Wild Res 32: 409–423.
Functional Responses to Fire by Terrestrial Fauna
PLOS ONE | www.plosone.org 10 February 2014 | Volume 9 | Issue 2 | e88224