IRPC Investor Update - listed company
44
INVESTOR UPDATE May 2020
Transcript of IRPC Investor Update - listed company

INVESTOR UPDATE
May 2020

2
AGENDA
Strategic Direction
Performance Highlight
Projects Update
Company Profile
Industry Outlook
Appendix

47.55%
5.19%
8.95%
38.30%
Others
Introduction to IRPCIntegrated Petrochemical Complex
3
Shareholding Structure*
PTT secures 100% crude procurement for IRPC at the market price
Receive 90 days credit term from PTT
Petroleum Product off-take and swap agreement with PTT group on arm-length basis
Strong support of credit facilities from PTT thru Intercompany Borrowing & Lending (ICBL) program
IRPC are under umbrella of PTT group’s centraltreasury management framework
PTT
Crude Procurement &
Credit Term
Product Swaps and Off-takes
Financial and Risk Control
Systems
Operational & Strategic Relationships with PTT Group
Complex & Facilities
*Note: as of Feb 2020
• Integrated petrochemical complex: Upstream to downstream in a single complex
• Locate in Industrial Area: Eastern Seaboard Area of Thailand, 200 km. from Bangkok and 30 km. from Map Ta Phut Industrial Area
• Facility Support:- Deepest sea port- Tank Farm and Power Plant- Thailand’s main coastal highway
Market Cap. : 59,260 MB
(as of May 19, 2020)
Credit Rating
A-(tha) Stable Outlook
Thai NVDR
Foreign

4
Petroleum and Petrochemical Capacity
Petroleum
Port and Tank Services
Utilities307 MW Power plant
Facilities & Utilities
Refinery• LPG• Naphtha• Gasoline• Diesel• Fuel Oil
Lube Base• Lube Base Oil• Asphalt
Olefins• Ethylene• Propylene• Butadiene
Aromatics• Benzene• Toluene• Mixed Xylene
Styrenics• EBSM
Polyolefins• HDPE• PP
Polystyrenics• ABS• PS• EPS
Petrochemical Capacity• Monomer 1,848 KTA• Polymer 1,267 KTA
3,115 KTA
Crude Refining Capacity
215 KBD
Freehold Land~4,000 Acres
(~10,000 Rais)
1,221
367
915
352
920
215
Unit: KTA
Unit: KBD
Unit: KTA260
5 Depots
Petrochemical

5
IRPC’s Profile
Refinery Capacity : 215 KBD (crude distillation unit)
Petrochemical Capacity : 3,115 KTA (Olefins, Aromatics, Styrenics,
Polyolefins, Polystyrenics)
1
PP’s leading producer in South-East Asia: 775 KTA
HDPE pipe grade 140 KTA
ABS 179 KTA: The Largest producer in Thailand
2
Lube base oil : 320 KTA
Asphalt : 600 KTA
3
55% of specialty petrochemical portfolio
PPC to add more specialty Petrochemical Products
Specialty : 10-20% higher margin vs Commodity
5
Integrated
Petrochemical Complex &
Product Diversification
Remarkable Position
in ASEAN
Polymer Market
The largest lube base oil capacity
in Thailand
Power & Utility business : ~ 1.0 $/bbl to GIM
Additional contribution from utility JV starting from 2018
Stable income from Port and Tank business
4 Sustained earnings
from facility
and utility businesses
Specialty Petrochemical
to capture
higher margin

6
Petroleum and Petrochemical Value Chain Optimized Configuration & Product Diversification
Olefins Plant PropyleneEthyleneAcetylene Butadiene
180 KTA360 KTA6 KTA56 KTA
Vacuum Gas Oil (VGO)
PP
PS
ABS/SAN
EPS
CCM
Acetylene Black
HDPEEthylene
Acetylene
Propylene
Benzene
TolueneMixed Xylene
Butadiene
CD1
Ethylene
EBSM
4 KTA
140 KTA
775 KTA
Ethylene Rich Gas
DCC
Propylene 132 KTA
ADU1 65 KBD
ADU2 150 KBD
215 KBD
Naphtha
Reformate
UHV
Ethylene Propylene 320 KTA
73 KTA
Lube BaseLube Base Oil Asphalt
320 KTA600 KTA
BTX Benzene TolueneMixed Xylene
114 KTA132 KTA121 KTA 31 KTA
57 KTA
179 KTA
125 KTA
48 KTA
260 KTAStyrene Monomer
Acrylonitrile
Feed (Crude Oil / Condensate)Transportation FuelDiesel/JetGasolineFuel Oil
PRP
HS ATB
Propylene 100 KTA
Pyrolysis Gasoline Raffinate
Styrene Monomer
LS ATB
For sale
HS ATB
68% 17% 6% 9%
2019 Crude/Condensate Portfolio
Middle east Far east Domestic Others

Polyolefins Products
7
PP Polypropylene has medium transparency. It features such significant properties as high stiffness, high surface hardness, high heat and medium impact strength. It can be used for the manufacture of kitchenware, household items, stretch tape, electrical parts, fertilizer bags, sugar bags, woven bags, hot fill bags, etc.
Resin Appearance Sample
PE High Density Polyethylene (HDPE) has an opaque appearance. Products exhibit high tensile, impact strength and high chemical resistance.

Styrenics Products
8
Acrylonitrile Butadiene Styrene (ABS) features such significant properties as high impact strength, high heat and chemical resistance, high stiffness and high gloss including weather resistance. It is mainly used for the manufacturing of electrical parts, automotive parts, bicycle parts, household items, kitchenware, office supplies, toy, etc
Polystyrene (PS) can be divided into 2 types as follows; General Purpose Polystyrene (GPPS) has significant properties of transparency, rigidity, and process ability which are ideal for production of products, such as electrical parts, cassette tapes, CD boxes, household items, including foam boxes, food tray, etc. High Impact Polystyrene (HIPS) has significant properties of high impact strength, and process ability which are suitable for producing electrical parts, frame of TV, air conditioner, computers, toys, sanitary wares, office suppliers, plastic cup and tray, etc.
ABS
PS
Resin Appearance Sample

9
AGENDA
Strategic Direction
Performance Highlight
Projects Update
Company Profile
Industry Outlook
Appendix

QoQ 24%
30
31
32
33
10
Key DriversCrude oil price collapse amid Saudi Arabia – Russia price war & COVID-19 pandemic
30
40
50
60
70
80
Brent Dubai
Crude Oil Price (avg)
Gross Refining Margin (GRM)
Foreign Exchange (avg)
Product to Feed Margin (PTF)
Unit: $/bbl Unit : THB/USD
Unit: $/bbl Unit: $/bbl
YoY 56%
QoQ 52%
YoY 18%
31.8
Dubai QoQ 18%
Dubai YoY 20%
QoQ depreciated 3%
YoY appreciated 1%
31.8
1Q19 2Q19 3Q19 4Q19 1Q20
Brent 63.2 68.8 61.9 63.2 50.3
Dubai 63.5 67.4 61.2 62.1 50.71Q19 2Q19 3Q19 4Q19 1Q20
30.9 30.5 31.5
5.2 5.2
2.5 1.9 1.7
0.8
2017 2018 2019 1Q19 4Q19 1Q20
8.3 7.3
5.1 5.7
3.8 4.7
2017 2018 2019 1Q19 4Q19 1Q20
YoY 52% YoY 30%

53.269.4 63.5 63.5 62.1
50.7
11
Key Performance
20,420 18,344
5,940 2,355 543
(6,436)
Net Sales (net excise tax)
Unit: MB
EBITDA
Unit: MB
Performance by Business
Net ProfitUnit: MB
Petroleum Petrochemical Utilities & Others
Net Sales(net excise tax)
Dubai (Avg.)Unit: $/bbl
197,594 258,919
216,577
54,274 50,337 43,617
Crude Run (KBD)
EBITDA
Net Profit
Market GIM ($/bbl)
Acct. GIM ($/bbl)
Net Stock G/(L)($/bbl)
YoY 115%
YoY 68%
YoY 16%
Operating NINet Income
8,621 8,859
(2,982)(780)
(2,330)(43)
11,354 7,735
(1,174)
153
(513)
(8,905)
2017 2018 2019 1Q19 4Q19 1Q20
1Q20 VS 4Q19200 190 188
QoQ 13%
YoY 20%
QoQ, YoY – n.a.
180 208 197
14.48 13.60 8.70
1.01 (0.50) 0.27
15.49 13.10 8.97
QoQ , YoY – n.a.
QoQ 98%
YoY 94%
8.68 6.76 6.82
1.26 1.38 (12.66)
9.94 8.14 (5.84)
(107%) (95%)
102%
(83%)(20%)
3%
5%
(20%)
115%
(93%)
(17%)
10%
72%
27%
1%
69%
29%
2%
4Q19 1Q20 4Q19 1Q204Q19 1Q20
4Q19 1Q20 4Q19 1Q204Q19 1Q20
4Q19 1Q20 4Q19 1Q204Q19 1Q20

12
Net Profit: 1Q20 VS 4Q19Net Stock loss & unrealized loss on derivatives resulted in a drop of Net Profit
60
Net Loss 4Q19
Margin Net Stock loss
OPEX & Selling
Exp.
Oil Hedging
Unrealized
Financial Derivatives
FX Tax & Others
Net Loss 1Q20
Operating Income 98%
Net Income – n.a.(513) (8,905)
(2,330) (43)
Unit: MB

13
AGENDA
Strategic Direction
Performance Highlight
Projects Update
Company Profile
Industry Outlook
Appendix

14
Projects UpdatedFloating Solar Project with Electricity 12.5 MW ABS Expansion: Increasing ABS specialty by 6,000 MTA
Construction ProgressABS Expansion
Project Objective : Increase 6,000 MTA of Specialty
ABS Powder. Recovery Vapor Butadiene
278 MTA from Flare.
CAPEX : ~ 430 MB
IRR : ~ 17%Project Progressas of April 2020
: 80% of Target
Installing equipment and
Piping work under
progression
MC : 3Q20
COD : 3Q20
Project Progressas of April 2020
Project Objective : To produce electricity 12.5 MW Floating Support material by
own HDPE BOI Privilege
Area: Reservoir in Industrial Park
Usage: Internal use at PP Plant
CAPEX : ~ 550 MB
IRR : ~ 17%
Floating Solar
: 99% of Target
Construction Progress
MC : April 2020
COD : 2Q20

15
UHV project : Major CAPEXImprove product yield and earnings
IRPC’s refined Production Yield
Upstream project for Hygiene & Value-added Products
Objective : Upgrade low value to high valued-added products
Investment : $ 1.1 bn
COD : Jul. 2016
Benefit : GIM 1.5-2.0 $/ bblAssumption : Spread propylene to FO ~ 500-600 $/ton
RDCC unit Feed Cut-in
@ Jun 16 COD @ Jul 16
HYVAHL unit Feed Cut-in
HS-ATB @ Jul 16 COD @ Jul 16
Performance Guarantee Test RDCC run 100%
@ Oct 2016
Plant Acceptance
(PAC)
Jan 2017
43%
80%
99%
2016A 2017A 2018A
Upgrade to High Valued-Added products
131
123
163
367
220
326
74
HSFO
LPG
Ethylene
HYVAHL
Propylene
Naphtha
FO/FG
Middle Distillates
RDCC
C4 Raffinate III
Internal use & Loss
Unit : KTA
16%
5%
23%
9%
9%
26%
12%
Flow Diagram
LSFO
UHV
Designed Yield
23%8% 11%
4%2%
2%
14%
10%15%
11% 11%
40%
38%
45%
47% 47%
5%
10%
8%12% 12%
16%
21%
16%16% 16%
2%
5%3% 5% 5%6%1% 4% 4%
2% 1% 1%
IRPC IRPC+UHV IRPC2015A
IRPC2018A
IRPC2019A
Ethylene
Propylene
LPG
Naphtha
Gasoline
Diesel/Jet Fuel
Lube Oil
LSFO 0.5%S
HSFO
Designed Yield

CompoundingHouse
PP inline compound
16
PPE&PPC Benefit EnhancementFulfill UHV benefits thru higher margin on PPE & PPC
Random PP• Pipe grade• Hygiene
Super Clear PP• Container box• Medical Device
Block-CO PP• Household Material• Heavy-duty
HOMO PP• Film application• Fiber grade
PP Specialty•Frozen food packaging•Lamination•Health care
PP Compound• Automotive:
pumper, instrument panel, etc
PPE 160 KTA PPC 140 KTA
Total PP 775 KTA in 2017
PP Existing 475 KTA
PP Expansion and PP Compound Project
Lower cost : PPC production by Inline process technology
Note: Cost Saving • No Packing & Logistic• No 2nd Extruder Process
PP Marketing Strategy : Sales Plan
Y2017
Volume: 600 Ktons
Y2022
Volume: 760 Ktons
PP Expansion Project (PPE) Licensor : Novolen Capacity : 160 KTA PMC : Foster Wheeler EPC : Sinopec
• CAPEX : $ 236 mn• GIM 0.8-1.0 $/bbl• COD : 4Q17
Random PP4%
Homo PP
75%
Block-CO PP21%
PP Compound11%
Random PP10%
Homo PP
58%
Block-CO PP21%
PP Compound & Specialties (PPC) Licensor : JPP Capacity : 140 KTA PMC : Foster Wheeler EPC : Sinopec

17
AGENDA
Strategic Direction
Performance Highlight
Projects Update
Company Profile
Industry Outlook
Appendix

Impact of the outbreak of COVID-19 and mitigation strategies
Spunbond
Face Shield
Alcohol
Key Actions for supporting the COVID-19 outbreak Our Survival Mode
Modular room
Negative-pressure Bed
Business Continuity Management (BCM)
Employees Protection
Social Contribution
Liquidity management
Production and marketing strategies alignment
Tighten Operating expenses (OPEX)
Capital spending plan (CAPEX) Reconsideration
Strengthen IRPC projects
18

19
Survival Mode
1. Maintain Market Position
2. CAPEX & OPEX Reduction
3. Strengthen IRPC

20
1. Maintain Market PositionRelationship-based strategies and Portfolio management
Key challenges and mitigation: Protect domestic market share and search for new territories
Petrochemical ProductsPetroleum Products
-1.0 -0.5 0.0
Diesel
Gasoline
Jet
Lube
IRPC MKT
-30%
-20%
Overall reduction in demand, decline across Petroleum products portfolio especially gasoline and jet
-100%
-50%
-40%
-30%
-10%
Impact across petrochemical, some sectors harder hit especially automotive, electronic and industrial while packaging and consumer remains strong
Key challenges and mitigation: Closely monitor customer’s inventory & adjust proportion export
%Market demand decline (2Q20F)
▪ Keep contract of domestic demand based on market decline to maintain market share
▪ Export sales to countries those are not lockdown or partial lockdown
▪ Jet is only 4-5% of refinery portfolio, swap to diesel pool
▪ Lube products group : maintain South East Asia and China customers
▪ Demand decline both domestic and export
▪ Demand decline both domestic and export
Key challenges Mitigation Key challenges Mitigation
No impact
▪ Secure order with contract customer
▪ Review and negotiate with strategic partner to ensure order
▪ Spot order move to focus area
▪ Closely monitor and follow up customer’s inventory to immediate response after lock down
-0.5 -0.3 0.0
Polystyrenics
Polyolefins
IRPC MKT
-30%
-20%
-30%
-25%
%Market demand decline (2Q20F)
Stress case Stress case

21
2. CAPEX & OPEX ReductionTotal 5 years CAPEX plan decreased ̴ 48% and OPEX decreased ̴ 13% after review
41,598
15,009
12,355
10,870
2,176
2020-2024Plan
2020-2024Review
53,953
28,055
-48%
Strengthen IRPC
General CAPEX
4,010 2,159
2,952
2,367
254
2020 Plan
6,962
254
2020 Review
4,780-31%
CAPEX Reduction 2020-2024 (MB)
CAPEX 2020 (MB)
OPEX Reduction 2020 (MB)
2020 Plan 2020 Review2020 Plan 2020 Review
Projects
-13%

22
3. Strengthen IRPCDriven performance by “Strengthen IRPC” program to deliver benefit
Significant EBITDA impact (total value estimated at 4,600+ MB)
▪ “Strengthen core business IRPC”
▪ Cross functional team from Operation , Commercial , Business development , ISC M&R and RD to
– Safety
– Reliability
– Productivity
– Increase specialties products
– Conversion cost reduction
– Enhance value of idle asset
– Inventory management
– Increase distribution channel
▪ Project governance by IRPC ourselves
Benefit Forecasted for 2020 ≈ 1,904 MB (Off PL 640 MB)
MB
Overview of impact and capital required
254
1,530
392
2,1761,904
7731,069
855
4,600
20222020 2021 2023 total
CAPEX
Benefit
886
1,904
329
E4E
Breakthrough Project
IRPC 4.0
total
MB
689

23
3.1 Inventory ManagementMinimize inventory and keep less
Spare Part Management:Minimize stock and more cooperation with partner / supplier
Total Spare Part2,200 MB
Fast Move200 MB
Min - Max500 MB
Non/Slow Move1,500 MB
Method
Challenge reason to stock
Co-develop strategy with supplier
Co-develop strategy with group
Crude & Product Inventory:Reduce product and intermediate
2020 2021 2022
200
400 400
3 Phases development during 2020 – 2022
Targetsaving ~ 1,000 MB
11.010.6
0.0
5.0
10.0
0.0
5.0
10.0
15.0
Existing Target Y20
Reduce product & intermediate inventory ~400K Barrels
-4%
Million bbl
Unit: MB

24
3.2 STARGATE
Project description :
Provide strategic gateway for domestic market via pipeline system
Support UCF project
Scope:
Margin improvement
Increase competitive advantage in domestic oil market
CAPEX : Minimal or none
Margin Improvement : 500 - 600 MB
COD : 2Q2023
STARGATE
Future Opportunity

25
AGENDA
Strategic Direction
Performance Highlight
Projects Update
Company Profile
Industry Outlook
Appendix

26
Crude Oil Outlook
Source: Platts
2Q20 oil demand growth heavily fall to 18.9 MMB/D due to coronavirus triggered lockdown but will be getting better in 2H20 amid concern on economic activities
So far, 13.2 MMB/D of shut ins announced from core OPEC (6.1), Russia (2.1), Canada (1.0), US (1.7) and Other International (2.3)*
* As of 12/5/2020
Remark : Additional cut in Jun 1.18 from Saudi, UAE and Kuwait and US estimate to cut up to 3 MMB/D (Total reduction in Jun ~17.38 MMB/D)

27
Singapore Crack Spread on Dubai
Source: FGE
$/bbl
Weak demand of Gasoline and Kero/Jet drive lower crack spread while lifting of lockdown help crack move up slowly
Huge drop in demand but now see positive growth sign
Source: Platts

28
IMO 2020
Weekly worldwide demand for marine fuels YoY change 2020 vs 2019
Source: IHS
Tanker demand support from storage opportunities for
crude oil and refined products as contango market
Increase of Middle Distillate demand blend into bunkers
Source: Platts
Share of Bunker Sales by Product
Notes: * Tanker includes crude, refined products, LPG and chemicals ** Cruise ships and other passenger vessels under other

29
Petrochemical Outlook : Polypropylene
Polypropylene world operating rate
Previous forecast
World : Addition Capacity
Regional Polypropylene Net Trade Polypropylene Per Capita Consumption
>80%
World’s per capita Consumption at 9.9 kg up from 9.6 kg in 2018Is expected to reach 11.6 kg by 2024
World
Mainly export from ME to Asia
Global operating rates averaged 86% for 2019-2024Strong demand by NEA, SEA, India due to continued urbanization

30
Petrochemical Outlook : HDPE
HDPE world operating rate World : Addition Capacity
Regional HDPE Net Trade Southeast Asia : HDPE Trade
>80%
Mainly export from ME to Asia
Global operating rates averaged 84% for 2019-2024Low-cost producers MDE, NAM is pressuring high-cost producers
Southeast Asia : Net import

31
Petrochemical Outlook: ABS
World : ABS Supply & Demand
World: 2019 ABS Demand by Region
World : ABS Capacity Addition by Region
World : ABS Demand by Application

32
AGENDA
Strategic Direction
Performance Highlight
Projects Update
Company Profile
Industry Outlook
Appendix

0.31
0.19
-0.04
0.04
-0.26
0.46 0.48
0.56
0.38
-0.06
0.08 0.10 0.08
0.22 0.230.29
0.10
0.08 0.08 0.10
0.100.04
0.09
0.180.12
0.19
2010 2011 2012 2013 2014 2015 2016 2017 2018 2019
EPS
Year Dividend
1H Dividend
2H Dividend
33
Dividend Policy & PaymentIRPC is firmly committed to pay dividend at no less than 25% of net income
58% 63%
25% 25% 25%
48% 48% 52% 50%
25%
Dividend Yield 2.8% 2.9% 1.9% 3.1% 2.6% 5.1% 4.8% 4.1% 3.3% 2.7%
Share Price 1 6.50 4.08 4.12 3.26 3.06 4.30 4.80 7.05 5.75 3.68
IRPC pay at 48-63% payout ratio with average dividend yield of 3.3%
Dividend Payout
Unit: THB
Div. Policy ≥ 25%
Note: 1 Closing price at the end of period
N.A.N.A.N.A. N.A.

34
CAPEX Plan in 2020 – 2024(Business Plan)
264 194
88
3,675
14,428
11,315
2,965 1,570
2,164
3,797
1,392
1,632 1,255
225
-
-
-3,785
2,839
2,365
6,962
9,097
20,590
12,707
4,597
2020 2021 2022 2023 2024
E4E, IRPC 4.0
MARS project
General & Maintenance Project
Others
UCF Project
Unit: MB
10,555 ,
19%
458 , 1%
32,472 ,
60%
8,989 ,
17%
1,480 , 3%
IRPC 5 year CAPEX Plan
General & Maintenance Project
E4E, IRPC 4.0
Others
Total *
53,953 MB
UCF Project
MARS Project
* Excluding study projects for investment opportunities of 14,108 MB
Remark: Data as of Dec, 2019

ST Loan21%
LT Loan (USD)10%LT Loan (THB)
59%
Bond (THB)10%
Leasing0.4%
5,694 6,443 6,942 6,765 12,652 1,957 - 1,305 1,305
1,957
-6,889
- -
-
7,652
13,332
8,247 8,070
14,609
2020 2021 2022 2023 >2023
THB Bond
USD Loan
THB Loan
35
Financial PositionSecuring liquidity in response to COVID-19
121,991 121,362
12,212 14,523
40,611 32,681
3,036 12,273
83,402 73,008
4,860 5,217
52,071 51,910
37,517 50,705
Maturity of Long-term Borrowing
Debt ProfileStatements of Financial Position
Cash Flow
Unit : MB
Remark: Long-term debt as at 31 March 2020
Unit: MB
PP&E(incl.
investment properties and ROU)
Other Non-CA
CashOther CurrentLiabilities
LT Borrowing incl. current port.
Shareholders’Equity
Mar. 2020Dec. 2019
Other CA
Other Non-CurrentLiabilities
Beginning Cash
1 Jan 2020
Ending Cash31 Mar 2020
Cash Flow from
Operating
Unit: MB
Cash Flow from
Investing
Cash Flow from
Financing
Net Debt = 53,589 MB
Ex. Rate = 32.83 Baht/$
Financial Ratios
< 1.0x
Net D/E CA/CL
177,850 180,839Interest Rate Currency
Float 80% THB 90%
Fixed 20% USD 10%
2%

(31)(46)
13
(40)
98
27
2017 2018 2019 1Q19 4Q19 1Q20
36
Petroleum Spread
602 518 490 482 553 536
2017 2018 2019 1Q19 4Q19 1Q20
498 447 321 330 384 370
2017 2018 2019 1Q19 4Q19 1Q20
(2.3) (2.6) (4.9)
0.6
(18.7)(7.4)
2017 2018 2019 1Q19 4Q19 1Q20
12.5 14.6 13.7 12.8 14.3 11.0
2017 2018 2019 1Q19 4Q19 1Q20
14.9 10.5 9.0
3.7
12.9
6.7
2017 2018 2019 1Q19 4Q19 1Q20
500SN – FO 180 3.5%S Spread
150 BS – FO 180 3.5%S Spread
Asphalt – FO 180 3.5%S Spread
$/BBL
$/BBL
$/BBL
Lube Base SpreadRefinery Spread
Gas oil - Dubai
ULG 95 - Dubai
HSFO - Dubai
0.7
(2.4)(6.6) (7.5)
(2.2) (2.9)
2017 2018 2019 1Q19 4Q19 1Q20
Naphtha - Dubai$/BBL
$/TON
$/TON
$/TON
YoY 28%
YoY 5%
YoY 128%
YoY 88%
YoY 6%
YoY 14% QoQ 48%
QoQ 23%
QoQ 60%
QoQ 4%
QoQ 3%
QoQ 72%
YoY – N/A QoQ 48%

52.4 60.8 58.0
14.2 14.0 13.4
6.4 7.0
6.9
1.8 1.7 1.7
58.8 67.8 64.9
16.0 15.7 15.2
2017 2018 2019 1Q19 4Q19 1Q20
Lube Base
Refinery
1Q20 Market GRM was $0.8/bbl: QoQ & YoY: declined as a decrease in products spread & higher crude
premium
37
Petroleum Business2019: Dropping products spread led to lower GRM1Q20: Falling Gasoline & Diesel spreads plus high crude premium led to negative refinery margin
Refinery ProductionCrude Intake
Unit : Mbbl
3.1 3.5 1.1 0.8
0.1 (0.9)
2.1 1.7
1.3 1.1 1.6 1.7
5.2 5.2
2.5 1.9 1.7 0.8
2017 2018 2019 1Q19 4Q19 1Q20
Lube Base
Refinery
Crude intake (Mbbl)
Market GRMSales Volume & Revenue
Unit : $/bbl
Sales Volume
Revenue
65.576.1 72.0
67% 66% 69% 66% 68% 72%
33% 34% 31% 34% 32% 28%
2017 2018 2019 1Q19 4Q19 1Q20
Sweet Crude
Sour Crude
180 208 197
119,015 163,724 136,670
33,336 32,193 26,384
16,110
19,229 16,781
4,437 3,823 3,860
135,125
182,953 153,451
37,773 36,016 30,244
2017 2018 2019 1Q19 4Q19 1Q20
Lube Base
Refinery
200 190 188 Crude Run (KBD)
84% 97% 92%
2019 MKT GRM was $2.5/bbl: $2.8/bbl decrease as lower petroleum spread, especially Diesel and Gasoline
2.1 3.2 3.5 2.0 5.1 5.3Premium over Dubai ($/bbl)
YoY 5%
65% 63% 68% 64% 68% 71%
18% 15% 17% 22% 16% 16%7% 8% 6% 6% 6% 5%10% 14% 9% 8% 10% 8% Others
Domestic
Far East
Middle East
93% 89% 87% % Utilization
YoY 4%
YoY 20%(price 15%, volume 5%)
YoY 4%
YoY 16% (price 12%, volume 4%)
Unit : Mbbl
Unit : MB
84% 97% 92% 93% 89% 87% % Utilization
76% 85% 82% 84% 84% 79% Lube Base
80% 99% 102% 70% 112% 93% RDCC
YoY 6%
QoQ 2%
YoY 5%
QoQ 4%
YoY 4%
QoQ 3%
18.0 17.5 17.1
QoQ 16%(price 12%, volume 4%)
YoY 56%
QoQ 52% YoY 52%
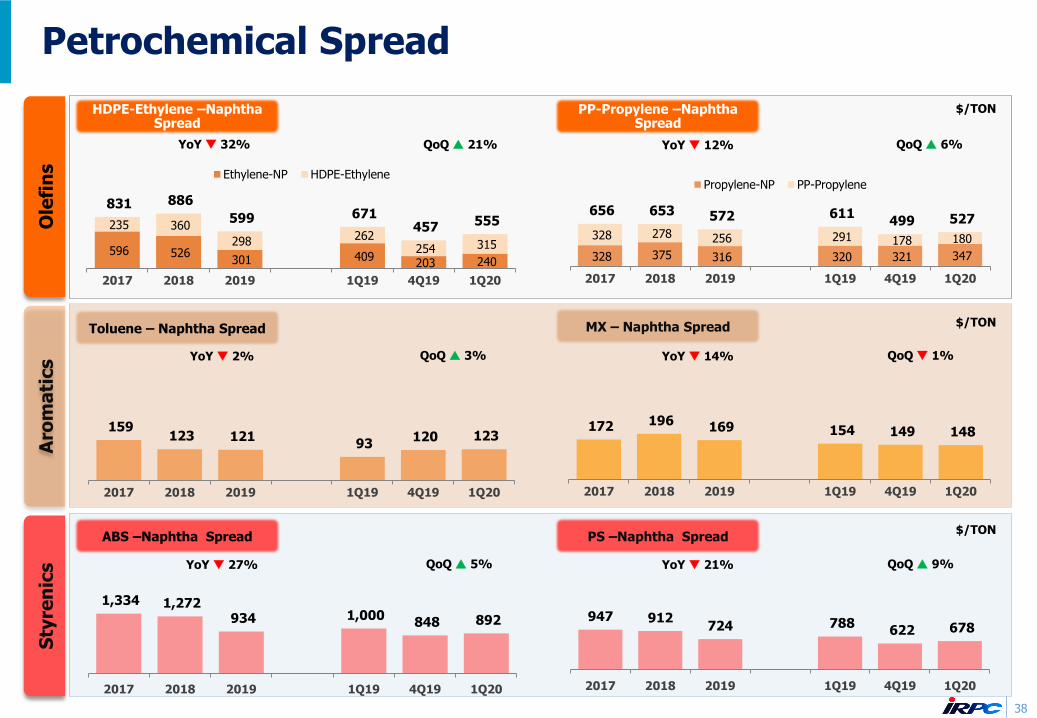
Petrochemical Spread
1,334 1,272 934 1,000
848 892
2017 2018 2019 1Q19 4Q19 1Q20
159 123 121
93 120 123
2017 2018 2019 1Q19 4Q19 1Q20
596 526 301 409
203 240
235 360
298 262 254 315
831 886
599 671 457 555
2017 2018 2019 1Q19 4Q19 1Q20
Ethylene-NP HDPE-Ethylene
172 196 169 154 149 148
2017 2018 2019 1Q19 4Q19 1Q20
947 912724 788
622 678
2017 2018 2019 1Q19 4Q19 1Q20
328 375 316 320 321 347
328 278 256 291 178 180
656 653 572 611 499 527
2017 2018 2019 1Q19 4Q19 1Q20
Propylene-NP PP-Propylene
HDPE-Ethylene –Naphtha Spread
PP-Propylene –Naphtha Spread
MX – Naphtha SpreadToluene – Naphtha Spread
PS –Naphtha SpreadABS –Naphtha Spread
Ole
fin
sS
tyre
nic
sA
rom
ati
cs
38
YoY 32%
YoY 2%
YoY 27%
$/TON
YoY 12%
YoY 14%
YoY 21%
$/TON
$/TON
QoQ 21% QoQ 6%
QoQ 3%
QoQ 9% QoQ 5%
QoQ 1%

3.0 2.6 1.5 1.5 1.3 1.2
5.2 4.7 3.5 4.2
2.5 3.4
8.3 7.3
5.1 5.7
3.8 4.7
2017 2018 2019 1Q19 4Q19 1Q20
Olefins &Polyolefins
Aromatics &Styrenics
24,684 28,760 21,985 5,642 5,150 4,407
35,044 43,980
37,671
9,987 8,277 8,090
59,728
72,740
59,656
15,629 13,427 12,497
2017 2018 2019 1Q19 4Q19 1Q20
Olefins &Polyolefins
Aromatics &Styrenics
39
Petrochemical Group2019 : According to Trade War, products spread dropped caused the decrease PTF1Q20 : Sharp fall in Naphtha price support Petrochemical product spread
Production
Market PTF
Sales Volume and Revenue
631 728 702 181 168 155
952 1,107 1,117
282 266 274
1,583 1,835 1,819
463 434 429
2017 2018 2019 1Q19 4Q19 1Q20
Olefins &Polyolefins
Aromatics &Styrenics
Revenue
YoY 1%
Unit : KMT
Crude intake (Mbbl)
Unit : $/bbl
350 400 395 107 91 92
12 28 9
8
313 338 300
50 88 81
317 295
246
68 53 60
600
807 828
186 199 209
1,591 1,868 1,777
411 431 450
2017 2018 2019 1Q19 4Q19 1Q20
Polyolefins
Olefins
Polystyrenics
Styrenics
Aromatics
Unit : KMT Sales Volume
Unit : MB
YoY 5%
YoY 18%
QoQ 24% YoY 30%
YoY 20%(price 13%, volume 7%)
QoQ 7%(price 6%, volume 1%)
YoY 18%(price 17%, volume 1%)
87% 94% 95% 89% 90% 95% % Utilization
91% 90% 92% 83% 88% 92% Polyolefins
83% 100% 98% 97% 92% 99% Olefins
90% 101% 93% 82% 96% 94% % Utilization
88% 93% 83% 69% 95% 88% Polystyrenics
100% 110% 94% 57% 104% 105% Styrenics
88% 103% 101% 107% 92% 93% Aromatics
YoY 9%
QoQ 4%
QoQ 1%
YoY 7%
65.576.1 72.0
18.0 17.5 17.1
1Q20 : Petrochemical revenue was Bt 12 bn
QoQ : 7% decrease from 6% price decrease & 1% vol. decrease
YoY : 20% decrease from 13% price decrease & 7% vol. decrease
1Q20 Market PTF was $4.7/bbl:
QoQ : $0.9/bbl increase as higher products spread
YoY : $1.0/bbl decrease as lower products spread
2019 : Petrochemical revenue was Bt 60 bn
YoY : 18% decrease from 17% price decrease & 1% vol. decrease
2019 Market PTF was $5.1/bbl:
YoY : $2.3/bbl decrease as lower products spread through trade war tension

1,629 1,947 2,071
534 531 505
916
1,034 1,153
277 303 308
196
245
246
61 60 63
2,741
3,226 3,470
872 894 876
2017 2018 2019 1Q19 4Q19 1Q20
Other
Steam
Electricity
40
Power & Utility 2019: U-Rate of power & utility declined owing to the planned shutdown of RDCC plant1Q20 : Increasing margin due to higher steam u-rate
Utilization Rate
GIM
Revenue
1.01 1.08
1.19 1.10
1.24 1.32
2017 2018 2019 1Q19 4Q19 1Q20
Power &Utility
Unit : $/bbl
Unit : MB
75% 79% 71% 67% 71% 71%
2017 2018 2019 1Q19 4Q19 1Q20
Electricity
73% 79%60% 59% 60% 66%
2017 2018 2019 1Q19 4Q19 1Q20
Steam
YoY 10%
YoY 19%
YoY 8%
YoY 20%
QoQ 6%
QoQ 2%
YoY 0.5%
YoY 8%
2019 U-Rate of Steam was 60%; 19%
2019 U-Rate of Electricity was 71%; 8%
YoY : decrease due to the planned shutdown of RDCC plant
2019 : Power & Utility revenue was 3,470 MB
YoY : 8% increase from higher electricity sales vol. & avg. selling prices of steam
YoY 7%
QoQ 6%
YoY 4%
QoQ - Unchanged
1Q20 U-Rate of Steam was 66%; 6% QoQ, 7% YoY
QoQ & YoY : increase after industrial area customers return to normal operations
1Q20 U-Rate of Electricity was 71%; Unchanged QoQ, 4% YoY
QoQ & YoY : increase owing to planned shutdown of RDCC plant in 1Q19
1Q20 : Power & Utility revenue was 876 MB
QoQ : 2% decrease from lower electricity sales vol. to EGAT VS higher steam vol. to IRPC industrial area customers
YoY : 0.5% increase from higher steam sales vol. VS lower electricity sales vol.

Accounting GIM
2019 Acct GIM was $9.0/bbl,
YoY: $4.1/bbl due to $0.3/bbl net stock gain compared to net stock loss of $0.5/bbl in 2018 & $4.9/bbl lower market GIM
1Q20 Acct GIM was $-5.8/bbl,
QoQ: $14.0/bbl due to $12.7/bbl net stock loss compared to $1.4/bbl net stock gain in 4Q19
YoY: $15.8/bbl due to $12.7/bbl net stock loss compared to net stock gain of
$1.3/bbl in 1Q19 and $1.9/bbl lower market GIM
3.0 2.6 1.5 1.5 1.3 1.2
5.2 4.7 3.5 4.2 2.5 3.4
8.3 7.3 5.1 5.7
3.8 4.7
Aromatics&Styrenics Olefins
14.5 13.6 8.7 8.7 6.8 6.8
1.7
(0.5) (0.03)
1.3 0.7
(13.3)(0.7)
0.01 0.3 0.7 0.6
15.5 13.1 9.0
9.9 8.1
(5.8)
Market GIM Stk G/(L) & LCM Hedging
5.2 5.2 2.5 1.9 1.7 0.8
8.3 7.3 5.1 5.7 3.8 4.7
1.0 1.1
1.2 1.1 1.2 1.3
14.5 13.6
8.7 8.7 6.76 6.82
Petroleum Petrochem Power & Utility
3.1 3.5 1.1
0.8 0.1 (0.9)
2.1 1.7
1.3 1.1 1.6 1.7
5.2 5.2
2.5 1.9 1.7 0.8
2017 2018 2019 1Q19 4Q19 1Q20
Refinery Lube Base
11,663 12,858 5,504 1,084 931 449
18,443 18,085
11,379 3,247 2,014 2,503
2,264 2,663
2,672
627 660 713
32,370 33,607
19,555
4,958 3,605 3,665
2017 2018 2019 1Q19 4Q19 1Q20
32,370 33,607 19,555
4,958 3,605 3,665
3,720
(1,268) (62)
719 363
(7,134)(1,452)
30
676 1 373
323
34,638 32,370
20,169
5,678 4,341
(3,146)2017 2018 2019 1Q19 4Q19 1Q20
Market GIM
Unit: $/bbl
Accounting GIM
Unit: $/bbl
Unit: MB
Market GIM by business
Unit: $/bblPetrochemical
Petroleum
Unit: MB
41
Gross Integrated Margin (GIM)2019: The market downturn towards global threaten had led to the decline in MKT GIM1Q20 : The COVID-19 outbreak affected to stock loss
YoY 36%
YoY 32%
YoY 42%
YoY 38%
YoY 22%
QoQ 1%
YoY 26%
QoQ 2%
Market GIM
2019 Market GIM was $8.7/bbl,
YoY: $4.9/bbl due to lower products spread
1Q20 Market GIM was $ 6.8/bbl,
QoQ: $0.1/bbl from higher petrochemical spreads versus lower petroleum spreads
YoY: $1.9/bbl due to lower spread & higher crude premium
YoY 159%
QoQ 172%
YoY 155%
QoQ 172%

42
Important Events in History
2009 2011 2013 2015 2016
HISTORY
KEY MILESTONES OF THE DECADE
• Increased refinery capacity from 65 kbd to 215 kbd
• Entered Rehabilitation Plan
Successful Rehabilitation new major shareholders:
Founded by “Leophairatana” Family as TPI
IPO Restructuring Plan was approved
Exited from Rehabilitation
plan and Registered as
IRPC Plc.
Operated first LDPE plant in
SEA
Debt Moratorium
MOF was appointed as plan
administrator
1978 1982 1995 1997 2000 2003 2004 2005 2006
Efficiency improvement#1 under “DELTA” Project
Capacity Increase: ABS/SAN to 179 KTA
Efficiency improvement#2 :
Launched “EVEREST” project
Business Improvement under Phoenix
Project
Commenced operation of
Combined Heat and Power Project
(CHP I)
• Commenced UHV project in July 2016
• PTT 31.5%• Gov’t (Vayupak) Fund
10%• Gov’t Saving Bank 10%• Gov’t Pension Fund
Group 10%
UHV: Upstream Project for Hygiene and Value Add Products
2017
• Commenced PPE project in Sept. 2017
• Commenced PPC project in Dec. 2017
2018
• Launched “GDP” project : Growth, Digital, People

Plant
2020
Jan Feb Mar Apr May Jun Jul Aug Sep Oct Nov Dec Total
Pe
tro
leu
m
ADU1 0
ADU2 0
Hyvahl 31 31
RDCC 0
LUBE 0
Pe
tro
ch
em
ica
l
EBSM 0
HDPE 6 6 12
PP 20 20
ABS/SAN 23 23
PS 13 13
43
Maintenance Shutdown Plan 2020

This presentation material has been prepared solely for informational purposes only. IRPC is furnishing it solely for use by prospective investors / analysts in the
proposed event. IRPC makes no representations or warranties as to the accuracy or completeness of such information. By accepting this material each recipient
agrees that IRPC shall not have any liability for any representations (express or implied) contained in, or for any omissions from this presentation.
The information contained herein does not purport to be all-inclusive or to contain all of the Information that may be material to the recipient’s decision. Each recipient
of the information and data contained herein should perform its own independent investigation and analysis of the transaction and the creditworthiness of IRPC . Reference in this Disclaimer to this shall include references to the Appendices (if any) hereto.
Investor Relations Contact: [email protected]
Tel. +662-765-7380, Fax. +662-765-7379
Thank You
Disclaimers