IRP Public Input Meeting - Rocky Mountain Power Public Input Meeting June 10, 2004. 2 ... Dummy...
77
IRP Public Input Meeting IRP Public Input Meeting June 10, 2004
Transcript of IRP Public Input Meeting - Rocky Mountain Power Public Input Meeting June 10, 2004. 2 ... Dummy...

IRP Public Input MeetingIRP Public Input Meeting
June 10, 2004
2
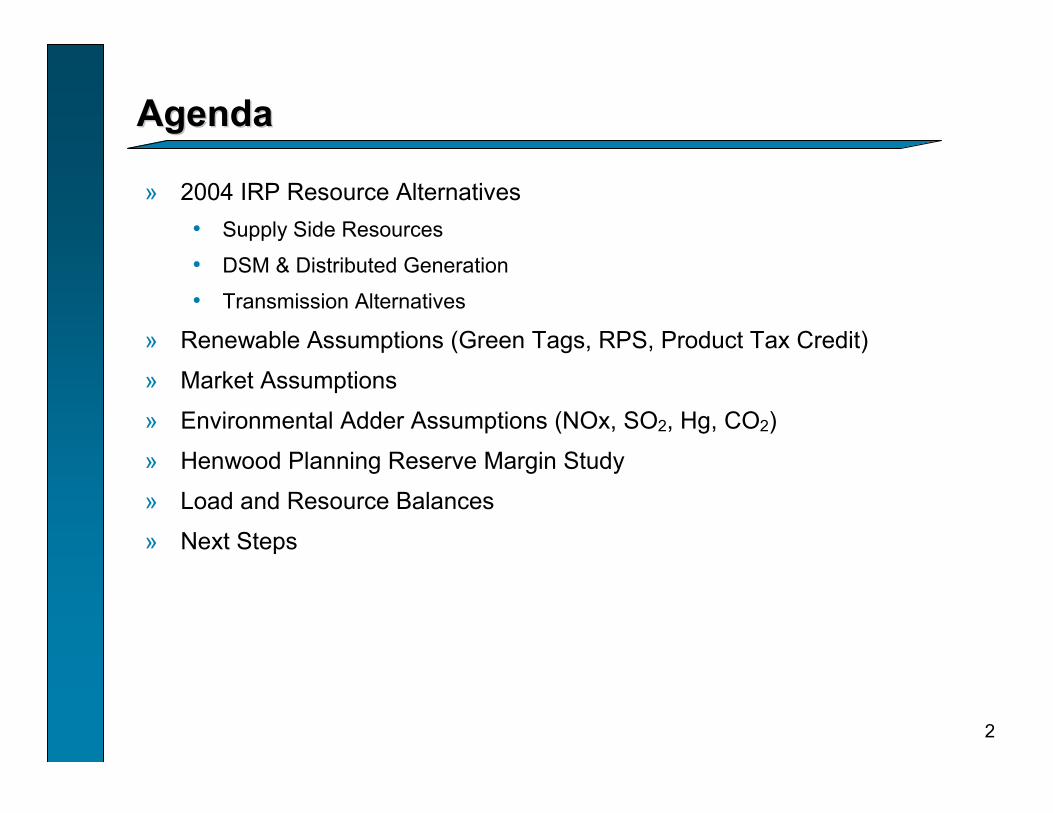
AgendaAgenda
» 2004 IRP Resource Alternatives• Supply Side Resources
• DSM & Distributed Generation
• Transmission Alternatives
» Renewable Assumptions (Green Tags, RPS, Product Tax Credit)
» Market Assumptions
» Environmental Adder Assumptions (NOx, SO2, Hg, CO2)
» Henwood Planning Reserve Margin Study
» Load and Resource Balances
» Next Steps

2004 Resource Alternatives2004 Resource Alternatives
Jim Lacey, Mike Koszalka & Melissa Seymour
4
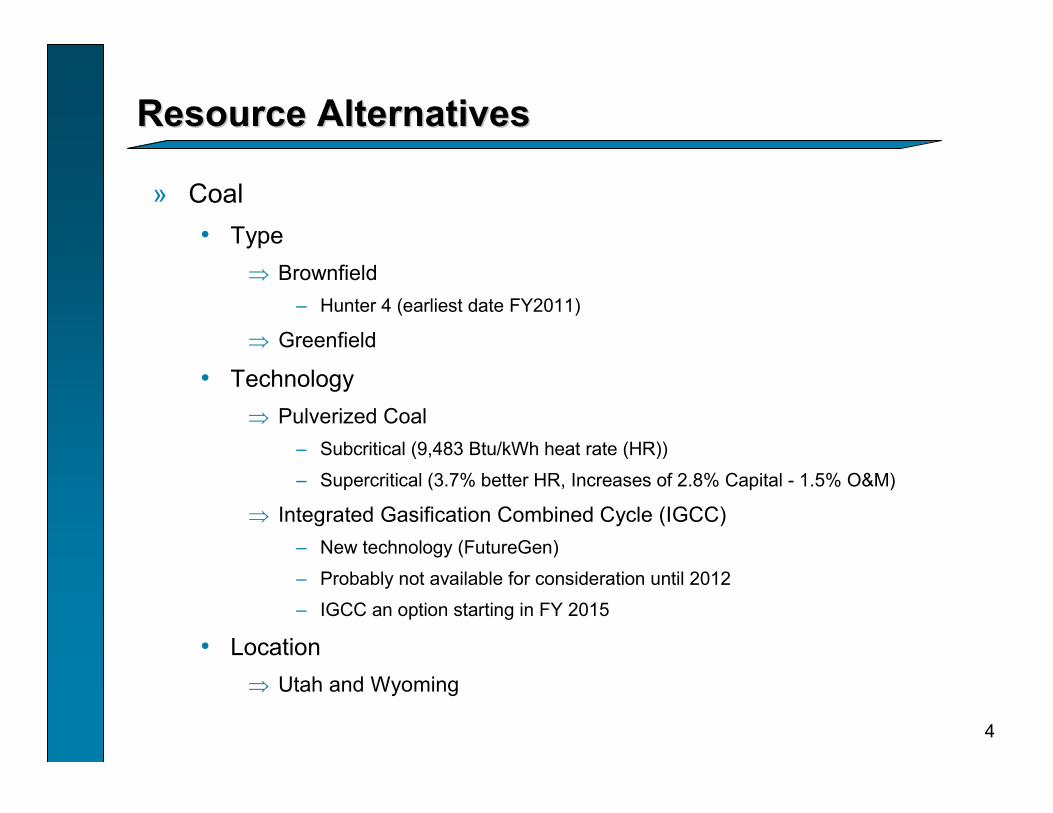
Resource AlternativesResource Alternatives
» Coal• Type
⇒ Brownfield– Hunter 4 (earliest date FY2011)
⇒ Greenfield
• Technology⇒ Pulverized Coal
– Subcritical (9,483 Btu/kWh heat rate (HR))
– Supercritical (3.7% better HR, Increases of 2.8% Capital - 1.5% O&M)
⇒ Integrated Gasification Combined Cycle (IGCC)– New technology (FutureGen)
– Probably not available for consideration until 2012
– IGCC an option starting in FY 2015
• Location⇒ Utah and Wyoming

5
Resource AlternativesResource Alternatives
» Natural Gas• Type
⇒ Simple Cycle Combustion Turbine (SCCT)– Aero and Frame
– Flexibility is key
⇒ Combined Cycle Combustion Turbine (CCCT)– Wet and Dry Cooled
– Duct Firing
• New Technology⇒ Intercooled Aero SCCT
• Location⇒ System
6
Intercooled Simple CycleIntercooled Simple Cycle
» New Technology• Not expected to be available till FY2008 at the earliest
• Considered as an option starting in FY 2010
• Vendor specific to GE
» Comparison (East Side ~ 4250 ft):
$730$560$682Capital Cost ($/kW)
392424Lead Time (Months)
7,1868,35210,225Heat Rate (Btu/KWh)
4508740MW
“F” CCCTIntercooledAero SCCT

7
Resource AlternativesResource Alternatives
» Renewables• Projected costs are higher consistent with the Renewables
RFP responses
• Wind
• Geothermal
» Storage• Pumped Hydro
• Compressed-Air Energy Storage (CAES)

8
Resource OptionsResource Options
» Distributed Resources (PacEast/PacWest)• DG projects will displace least cost plan resources at the avoided cost
(indifference cost to customers) as they are constructed on customer facilities. QF’s can be proposed by customers at any time.
• Technologies⇒ CHP
⇒ Solar (PV)
⇒ Fuel Cells
⇒ Microturbines (Demonstration project, 200 Market Bldg, Portland)
⇒ Battery Storage (Castle Valley VRB demonstration project)
• Costs updated
» Demand Side • Class 1 Load Control Summer loads (PacEast/PacWest)
• Class 1 Load Control Winter (PacWest)
• Class 2 Resources treated as decrements to load

9
Transmission OptionsTransmission Options
» Support Supply Side Options• Cost of building transmission to integrate supply-side alternatives
» Regional Transmission Initiatives• Rocky Mountain Area Transmission Study (RMATS) & Northwest
Transmission Assessment Committee (NTAC) scenarios⇒RMATS report expected in July
⇒NTAC result may not be available for use in 2004 IRP
• Later years – FY2013 and beyond

Renewables AssumptionsRenewables Assumptions
Christine Jerko

11
Production Tax CreditProduction Tax Credit
» Definition• Created in 1992 to support development of wind and biomass
• Provides 1.8 cents/kWh for the first 10 years of a project’s output
» Current Status• Renewal required after December 31, 2003 but did not occur
⇒Broad support for the PTC, however there was not broad support for the energy bill in which is was embedded
• Progressive support in 2004⇒The Senate recently passed a corporate tax bill including the PTC
⇒House leadership has indicated interest in the bill’s energy provisions
12
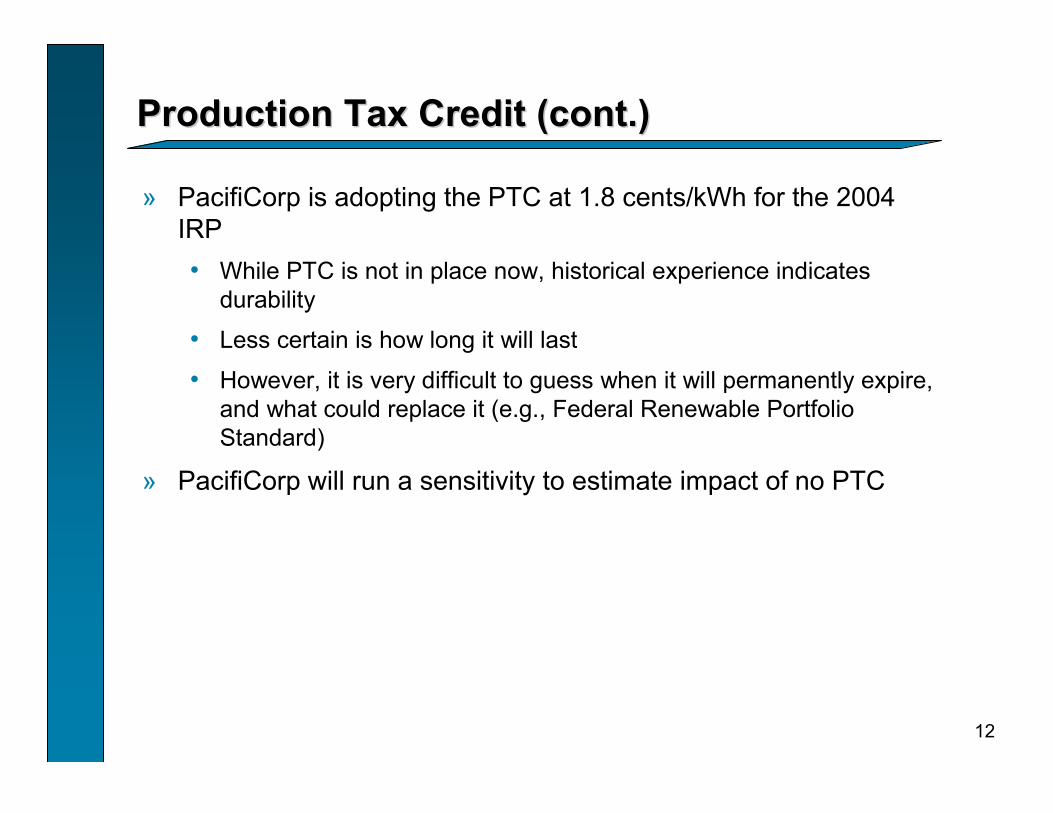
Production Tax Credit (cont.)Production Tax Credit (cont.)
» PacifiCorp is adopting the PTC at 1.8 cents/kWh for the 2004 IRP • While PTC is not in place now, historical experience indicates
durability
• Less certain is how long it will last
• However, it is very difficult to guess when it will permanently expire, and what could replace it (e.g., Federal Renewable Portfolio Standard)
» PacifiCorp will run a sensitivity to estimate impact of no PTC

13
Green TagsGreen Tags
» A green tag represents a unit of generation from renewables• Renewable generation whose tags are sold is considered to be “null
power” – that is, power without renewable characteristics
» There are regional, national and international markets for greentags
» Green tags are used for two main purposes• Voluntary “green power” programs, (e.g. Blue Sky)
• Compliance with renewable portfolio standards
» Tags are theoretically priced at the difference between the ‘all-in’ renewable cost and the prevailing market price

14
Green Tags (cont.)Green Tags (cont.)
» PacifiCorp will valued tags at $5/MWh for first five years of a new project• Consistent with the 2003 IRP
• Reflects market-clearing prices
• In addition our stakeholders placed value on “new” renewable projects for supplying our Blue Sky subscriptions
• The $5/MWh value translates into approximately $2/MWh levelized over 20 years for a 20 year purchase contract or a plant with a 20 year life⇒Plants or contracts less than 20 years will be valued at a fraction of the
20 year amount

15
Renewable Portfolio Standard AssumptionsRenewable Portfolio Standard Assumptions
» Based on California State Law• 20% of California load must be met with renewable energy or small
hydro projects.
• For PacifiCorp⇒energy from 2003 small hydro projects serves as starting point
⇒Linear projection through 2017 to meet 20% of load
⇒Starting at 5MW in 2005 up to 20MW in 2017

Market AssumptionsMarket Assumptions
Christine Jerko

17
Role of Markets in 2004 IRPRole of Markets in 2004 IRP
» Purpose• Physical balancing
⇒ Interconnected with WECC
• Not used in Portfolio Build Targets⇒Difficult to predict the numerous fundamental drivers of market size
» Application⇒Market is assumed to exist at least up to the point that we have firm
transmission rights (FTR)
⇒Markets will also economically interact with contractual obligations if they exist within the market boundaries
⇒FTR out of the market plus contractual purchases comprise potential market purchase depth, FTR into the market plus contractual sales comprise potential market sales depth
18
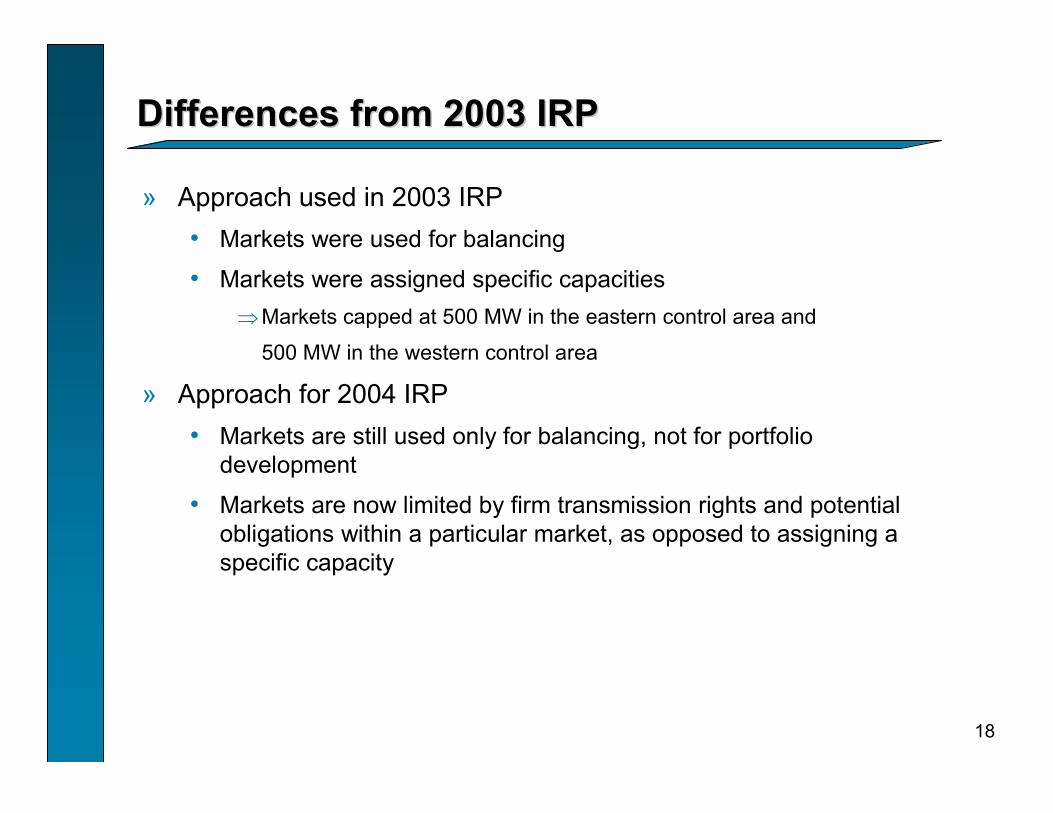
Differences from 2003 IRPDifferences from 2003 IRP
» Approach used in 2003 IRP• Markets were used for balancing
• Markets were assigned specific capacities⇒Markets capped at 500 MW in the eastern control area and
500 MW in the western control area
» Approach for 2004 IRP• Markets are still used only for balancing, not for portfolio
development
• Markets are now limited by firm transmission rights and potential obligations within a particular market, as opposed to assigning a specific capacity
19
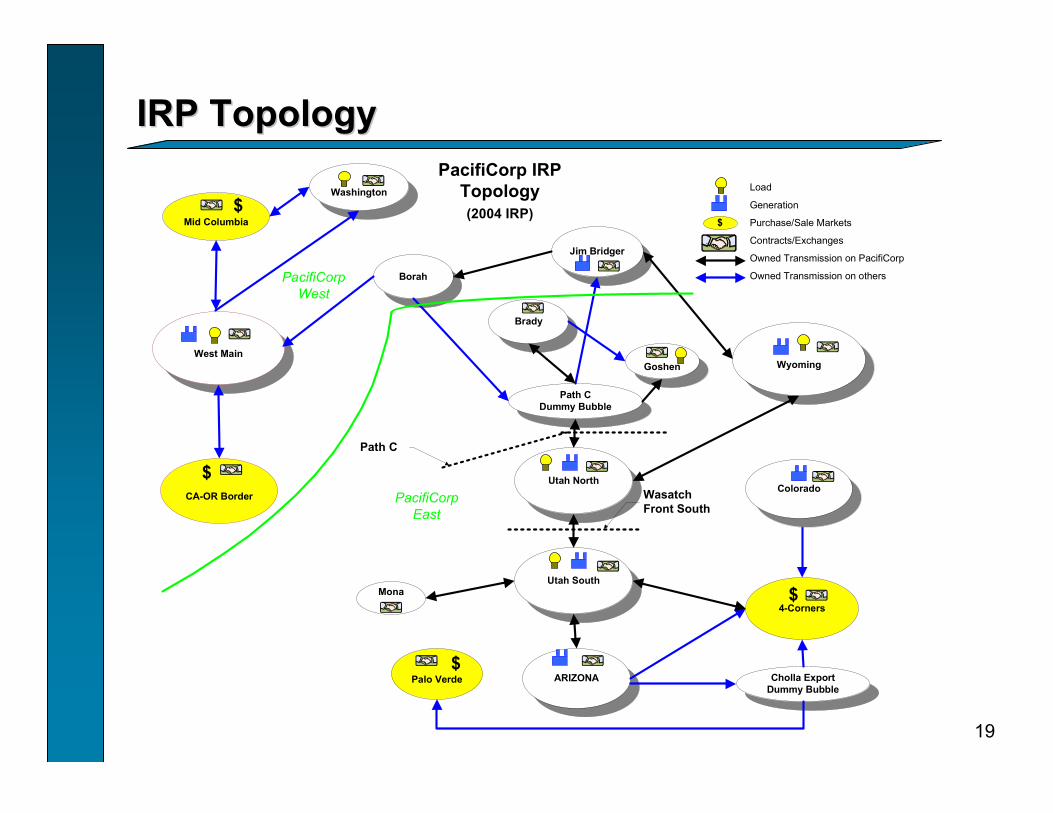
IRP TopologyIRP Topology
West Main
ARIZONA
Wyoming
CA-OR Border
Borah
Jim Bridger
Palo Verde
Path CDummy Bubble
Utah North
Goshen
Mona
PacifiCorp IRP Topology(2004 IRP)
PacifiCorp East
$
$
Path C
4-Corners
$
Load
Generation
Purchase/Sale Markets
Contracts/Exchanges
Owned Transmission on PacifiCorp
Owned Transmission on others
Utah South
Wasatch Front South
Brady
$
Cholla ExportDummy Bubble
Colorado
Washington
Mid Columbia
PacifiCorp West
$

Environmental Adder Environmental Adder AssumptionsAssumptions
Bill Edmonds

21
Climate Change Policy OverviewClimate Change Policy Overview» Significant risk surrounding future CO2 regulations to warrant continued
consideration in planning. » Uncertainty around climate change in a number of areas:
• Timing/Stringency of requirements• Compliance mechanisms
» Climate Change is not addressed by adding control technology to our existing generation facilities• DSM, increased renewable energy, increased hydroelectric use, fuel switching,
distributed generation, improved efficiency, off-system efforts» Policy
• International: In 2001, the Bush Administration withdrew from the Kyoto Protocol; other nations moving forward to ratify.
• Domestic: President Bush’s Global Climate Change Initiative -- 18 % intensity reduction by 2012; Carper/Lieberman -- impose a 2000 ton emissions cap in 2010; Jeffords -- 1990 levels by 2009.⇒ In October 2003, McCain/Lieberman congressional debate on carbon restrictions led to a
43-55 vote against. ⇒ Currently, not enough votes for either 3P or 4P bill -- prospects dim heading into
Presidential election year.• State: Some states considering policy moves in GHGs (e.g. voluntary registry,
Renewable Portfolio Standard, and emission caps.)

22
2004 CO2004 CO22 IRP AssumptionsIRP Assumptions» Previous IRP contained base case of $8 in 2008 with a 2000 cap.» Company reconfirms the necessity to use a CO2 adder to address risk. The
2004 IRP Model will include:• carbon adders as a proxy for the wide range of potential CO2 policy scenarios;• baseline cap closely mimicking likely US policy options;• probabilistic curve incorporating policy timing uncertainty
» Base Case: 2004 IRP curve has a gradual climb to an inflation adjusted $8.73 price with a 2000 cap. • Reflects timing uncertainty. Even though legislation may pass before 2010,
implementation would not occur until 2010 – 2012 timeframe. • Better aligns with blending of market and fundamental forecasts in the Forward Price
Curve
» By 2010 we’re reasonably certain that a climate change policy will begin.• 2010 - $4.18/ton (50% chance of occurrence)• 2011 - $6.40/ton (75% chance of occurrence)• 2012 - $8.73/ton (most likely chance of occurrence)
» Additional sensitivities run: 0, $2 with a 2000 cap in 2015, $25 and $40 with a 1990 cap in FY 2009

23
SOSO22, , NOxNOx and Hgand Hg
» The 2004 IRP Model includes environmental adders for SO2, NOx, and Hg (mercury).• SO2, NOx and Hg numbers based on PIRA study on emissions costs and timing.• Existing and future resources are penalized according to their emissions of SO2 ,
NOx, & Hg.
Note: SO2 and NOx are $/ton, Hg is $/lb
$46,091 $41,339NA2010~34 Ton Cap (backstop price); 15 ton cap in later yearsHg
$2,370 $2,126 NA2010National Annual Trading (0.15 to0.25 lb/MMBtu System Target)NOx
$988 $886 $337 2010~ Halving of Current Acid Rain CapSO2
201520102004StartPolicy
» Previous IRP assumptions
Note: Prices are $/ton
$2,757 $2,437 NA2008National Annual Trading Program with SCR Setting PricesNOx
$446 $394 $226 1995Title IV Acid Rain ProgramSO2
201520102004StartPolicy

Henwood Planning Reserve Henwood Planning Reserve Margin StudyMargin Study
Carl Huppert – Sr. Project Manager
Henwood Energy Services, Inc.

25
Agenda Agenda –– Planning Reserve Margin StudyPlanning Reserve Margin Study
» Historical approaches to Loss of Load
» Regional Criteria and Studies
» General Study Approach
» Overview of PacifiCorp Analysis
» Modeling Steps
» Results
» Observations
» Recommendations

26
Historical Loss of Load Probability AnalysisHistorical Loss of Load Probability Analysis
» Probabilistic –• deploys the fundamental data regarding unit capacity, random and
planned outage rate, and load demand
Sample Station Innage/Outage Rates Capacity FOR Innage Rate
Unit A 50 .05 .95 Unit B 100 .07 .93 Unit C 200 .10 .90
System 350

27
Historical Loss of Load Probability AnalysisHistorical Loss of Load Probability Analysis
Sample Combined Station Outage Probabilities On
Outage MW of outage In Service Probability
None 0 A,B,C .95*.93*.90=.79515 A 50 B,C .05*.93*.90=.04185 B 100 A,C .95*.07*.90=.05985 C 200 A,B .95*.93*.10=.08835
A,B 150 C .05*.07*.90=.00315 A,C 250 B .05*.93*.10=.00465 B,C 300 A .95*.07*.10=.00665
A,B,C 350 None .05*.07*.10=.00035 1.00000
Consider the probability of not being able to supply a 220 MW load demand. If 220 MW or less capacity is in service, a 220 MW load cannot be served. Since the capacity of the three-unit system is 350 MW, the load could not be supplied if (350-220) or 130 MW of capacity or more is on outage. According to the data in the table above, the probability of 130 MW or more on outage is:
.08835+.00315+.00465+.00665+.00035=.10315 This is the probability of not meeting a peak load of 220 MW in one day.

28
Historical Loss of Load Probability AnalysisHistorical Loss of Load Probability Analysis
» Look at each daily peak in a year and determine the probability of not meeting the peak in each day
» Sum the probabilities for all days
» A sum of 1.0 means there is a probability of 1-day outage in one year
» A sum of probabilities of 0.1 means there is a probability of 1-day outage in 10 years
29
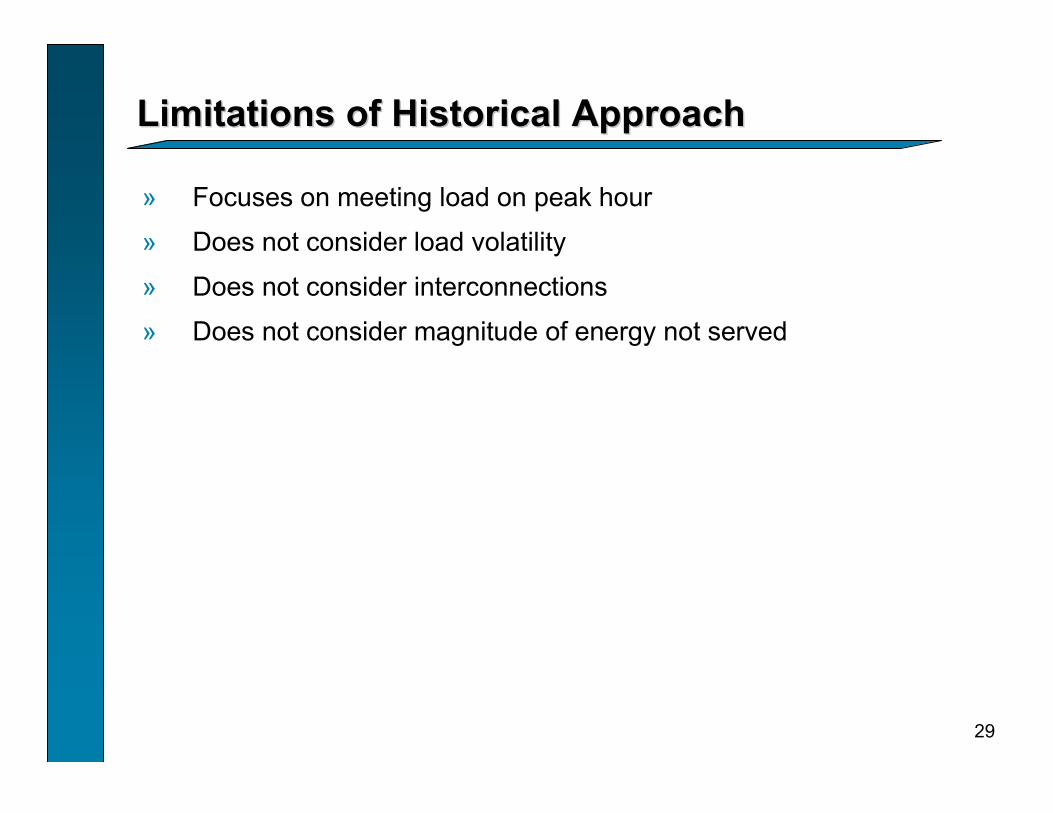
Limitations of Historical Approach Limitations of Historical Approach
» Focuses on meeting load on peak hour
» Does not consider load volatility
» Does not consider interconnections
» Does not consider magnitude of energy not served
30
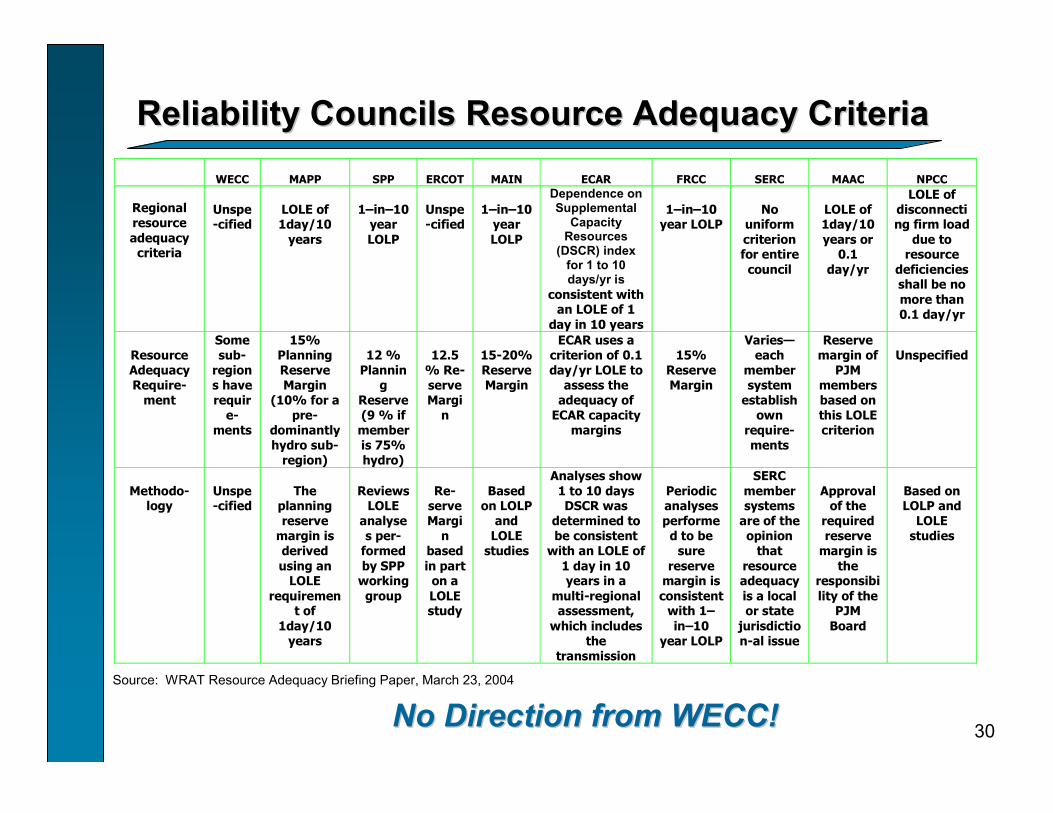
Reliability Councils Resource Adequacy CriteriaReliability Councils Resource Adequacy Criteria
WECC
MAPP
SPP
ERCOT
MAIN
ECAR
FRCC
SERC
MAAC
NPCC
Regional resource adequacy
criteria
Unspe-cified
LOLE of 1day/10
years
1–in–10
year LOLP
Unspe-cified
1–in–10
year LOLP
Dependence on Supplemental
Capacity Resources
(DSCR) index for 1 to 10 days/yr is
consistent with an LOLE of 1
day in 10 years
1–in–10
year LOLP
No
uniform criterion for entire council
LOLE of 1day/10 years or
0.1 day/yr
LOLE of disconnecting firm load
due to resource
deficiencies shall be no more than 0.1 day/yr
Resource Adequacy Require-
ment
Some sub-
regions have requir
e-ments
15% Planning Reserve Margin
(10% for a pre-
dominantly hydro sub-
region)
12 %
Planning
Reserve (9 % if
member is 75% hydro)
12.5
% Re-serve Margi
n
15-20% Reserve Margin
ECAR uses a criterion of 0.1 day/yr LOLE to
assess the adequacy of
ECAR capacity margins
15%
Reserve Margin
Varies—each
member system
establish own
require-ments
Reserve margin of
PJM members based on this LOLE criterion
Unspecified
Methodo-
logy
Unspe-cified
The
planning reserve
margin is derived using an
LOLE requiremen
t of 1day/10
years
Reviews
LOLE analyses per-
formed by SPP
working group
Re-
serve Margi
n based in part on a LOLE study
Based
on LOLP and
LOLE studies
Analyses show 1 to 10 days DSCR was
determined to be consistent
with an LOLE of 1 day in 10 years in a
multi-regional assessment,
which includes the
transmission
Periodic analyses performe
d to be sure
reserve margin is consistent
with 1–in–10
year LOLP
SERC member systems
are of the opinion
that resource adequacy is a local or state
jurisdiction-al issue
Approval
of the required reserve
margin is the
responsibility of the
PJM Board
Based on LOLP and
LOLE studies
Source: WRAT Resource Adequacy Briefing Paper, March 23, 2004
No Direction from WECC!No Direction from WECC!
31
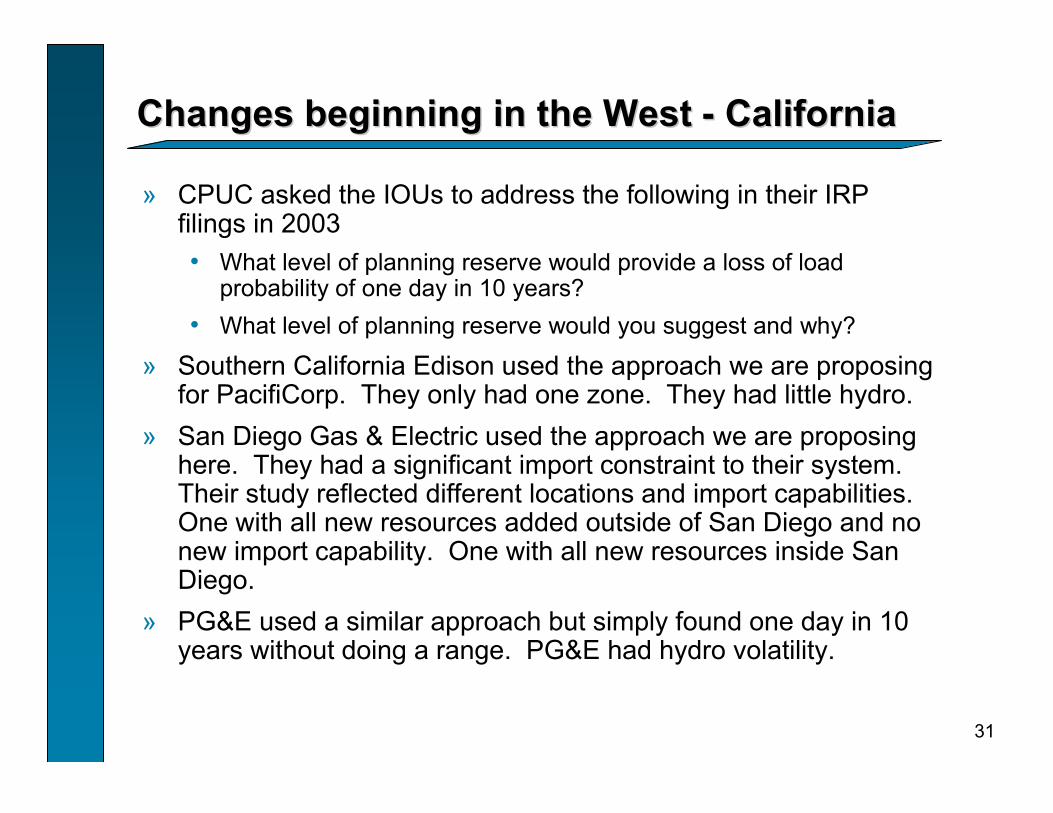
Changes beginning in the West Changes beginning in the West -- CaliforniaCalifornia
» CPUC asked the IOUs to address the following in their IRP filings in 2003• What level of planning reserve would provide a loss of load
probability of one day in 10 years?• What level of planning reserve would you suggest and why?
» Southern California Edison used the approach we are proposing for PacifiCorp. They only had one zone. They had little hydro.
» San Diego Gas & Electric used the approach we are proposing here. They had a significant import constraint to their system.Their study reflected different locations and import capabilities. One with all new resources added outside of San Diego and no new import capability. One with all new resources inside San Diego.
» PG&E used a similar approach but simply found one day in 10 years without doing a range. PG&E had hydro volatility.

32
Changes beginning in the West Changes beginning in the West -- ColoradoColorado
» Public Service of Colorado (PSCo) used similar approach to determine appropriate planning reserve margin for their IRP portfolio build-out
» PSCo used the 1 day in 10 year result (16-17%) as the reserve level above the base demand forecast
33
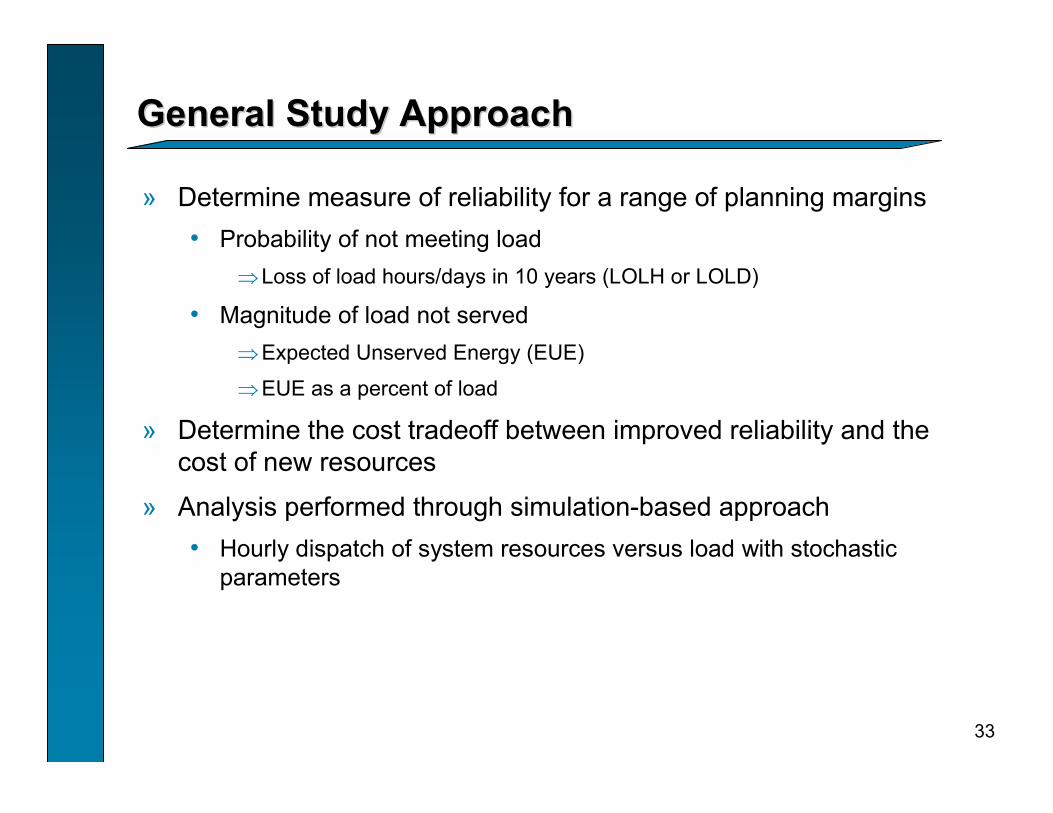
General Study ApproachGeneral Study Approach
» Determine measure of reliability for a range of planning margins• Probability of not meeting load
⇒Loss of load hours/days in 10 years (LOLH or LOLD)
• Magnitude of load not served⇒Expected Unserved Energy (EUE)
⇒EUE as a percent of load
» Determine the cost tradeoff between improved reliability and thecost of new resources
» Analysis performed through simulation-based approach • Hourly dispatch of system resources versus load with stochastic
parameters

34
Overview of PacifiCorp Analysis Overview of PacifiCorp Analysis
» Modeled PacifiCorp system• Inputs consistent with 2004 IRP
• Two-bubble topology
• Fiscal Year 2009 used as test year
• Interconnection to WECC markets via firm transmission
» Hourly economic dispatch• Stochastic inputs of hydro and load via 100 Iterations of Monte
Carlo draws
» Build out to test range of reserve margins • Used SCCT to build reserve margin ($72/kw-yr)
» Measurement of loss of load hours and expected unserved energy
35
Portrayal of PacifiCorp SystemPortrayal of PacifiCorp System
East Market
West Market
PacifiCorp West
PacifiCorp East
(loads, resources & contracts)
(loads, resources & contracts)
Access
Access
36
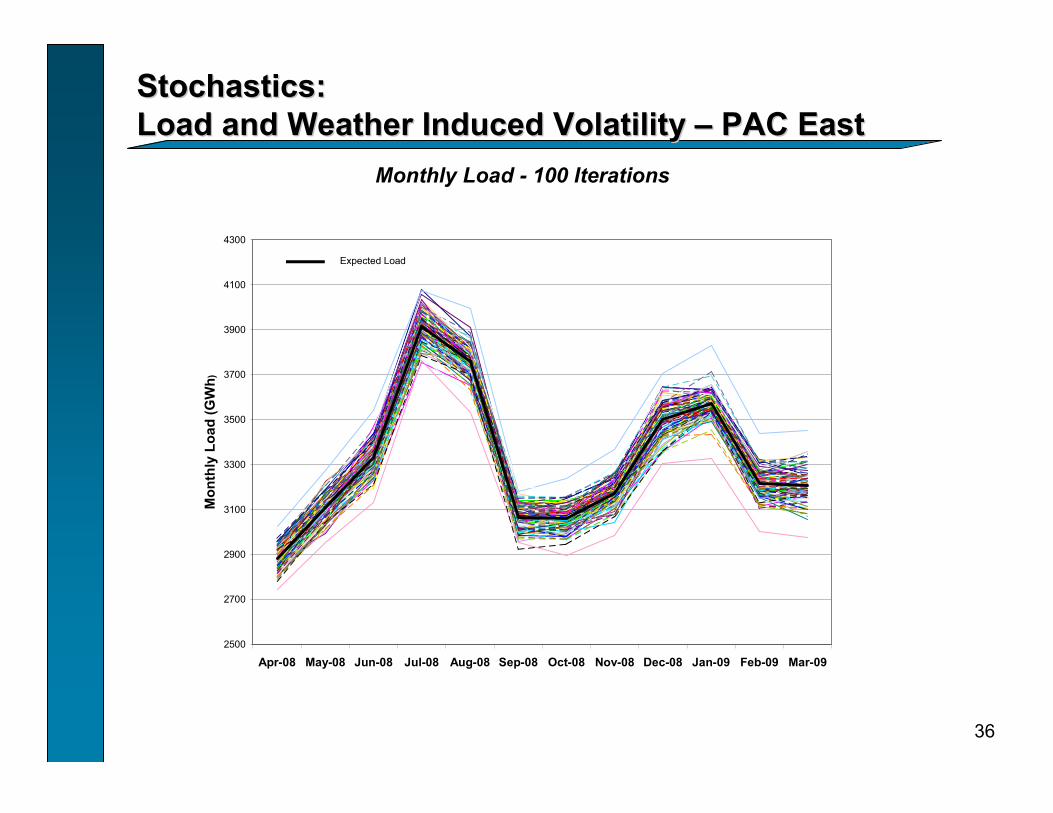
Stochastics:Stochastics:Load and Weather Induced VolatilityLoad and Weather Induced Volatility –– PAC EastPAC East
Monthly Load - 100 Iterations
2500
2700
2900
3100
3300
3500
3700
3900
4100
4300
Apr-08 May-08 Jun-08 Jul-08 Aug-08 Sep-08 Oct-08 Nov-08 Dec-08 Jan-09 Feb-09 Mar-09
Mon
thly
Loa
d (G
Wh )
Expected Load
37
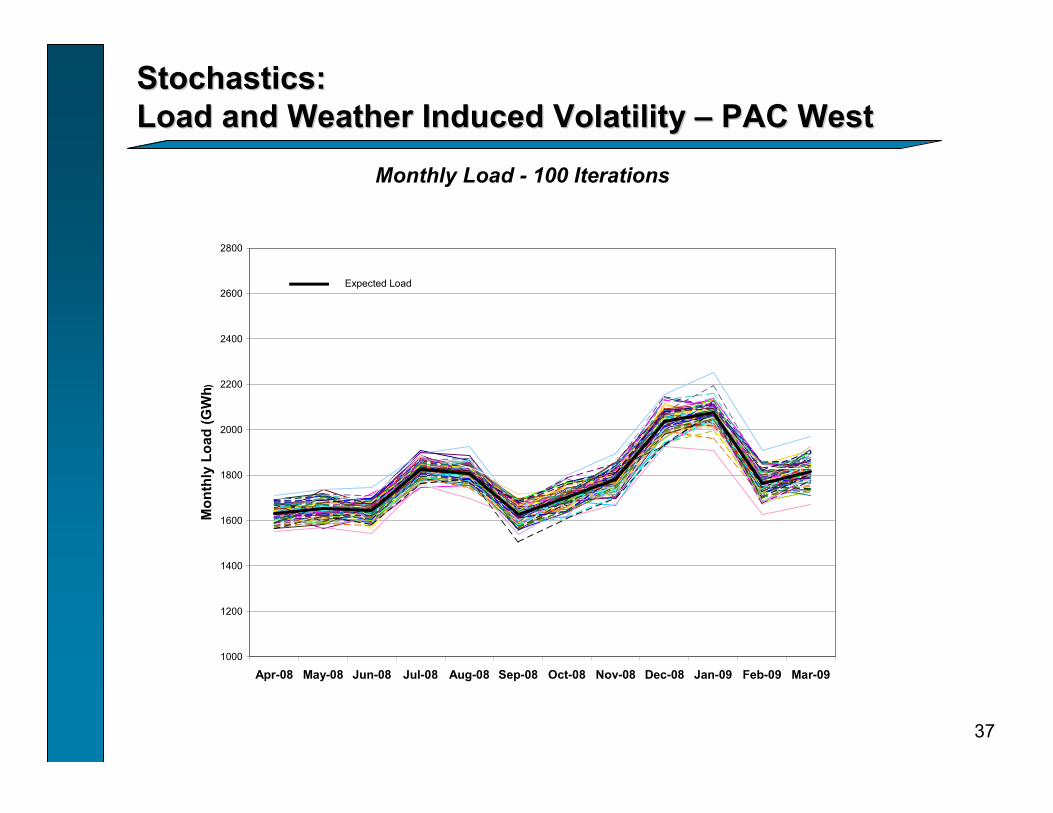
Stochastics:Stochastics:Load and Weather Induced VolatilityLoad and Weather Induced Volatility –– PAC WestPAC West
Monthly Load - 100 Iterations
1000
1200
1400
1600
1800
2000
2200
2400
2600
2800
Apr-08 May-08 Jun-08 Jul-08 Aug-08 Sep-08 Oct-08 Nov-08 Dec-08 Jan-09 Feb-09 Mar-09
Mon
thly
Loa
d (G
Wh )
Expected Load

38
Stochastics:Stochastics:Hydro Volatility Hydro Volatility –– PacifiCorpPacifiCorp
0
50
100
150
200
250
300
350
400
450
500
550
600
650
700
750
800
1/3/
2005
1/17
/200
5
1/31
/200
5
2/14
/200
5
2/28
/200
5
3/14
/200
5
3/28
/200
5
4/11
/200
5
4/25
/200
5
5/9/
2005
5/23
/200
5
6/6/
2005
6/20
/200
5
7/4/
2005
7/18
/200
5
8/1/
2005
8/15
/200
5
8/29
/200
5
9/12
/200
5
9/26
/200
5
10/1
0/20
05
10/2
4/20
05
11/7
/200
5
11/2
1/20
05
12/5
/200
5
12/1
9/20
05
Date
GW
h
Projected Weekly PacifiCorp West Generation – by Exceedence Level
39
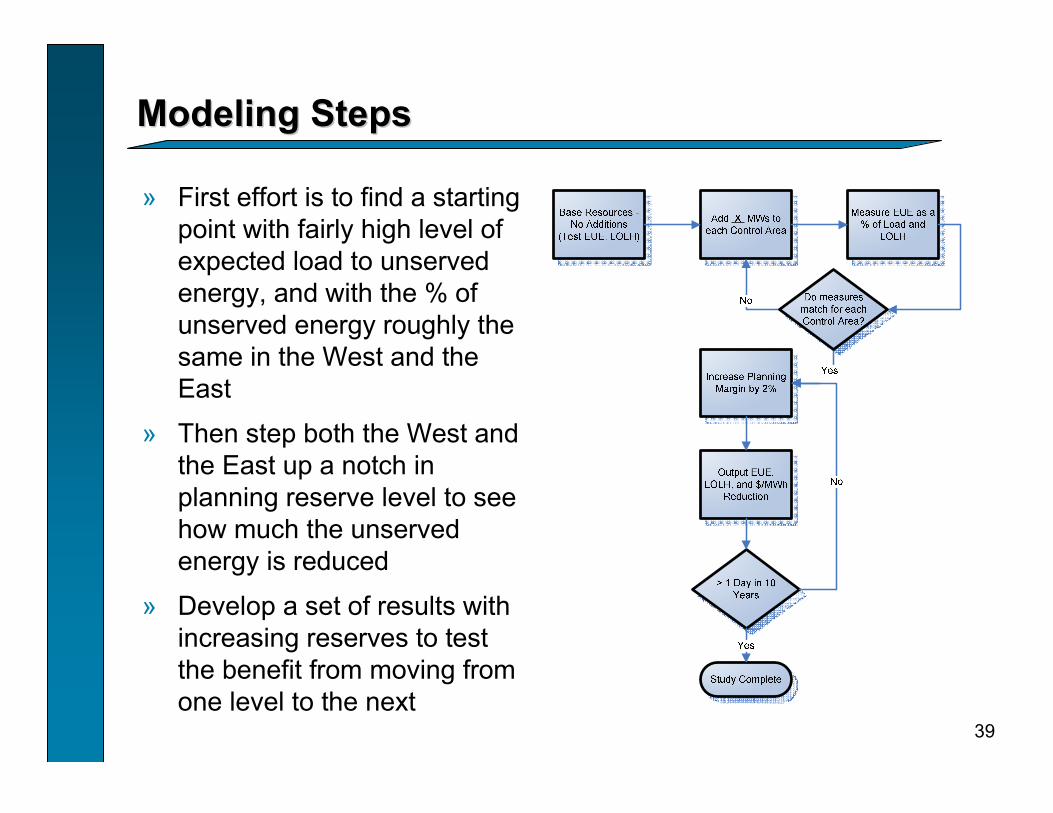
Modeling StepsModeling Steps
» First effort is to find a starting point with fairly high level of expected load to unserved energy, and with the % of unserved energy roughly the same in the West and the East
» Then step both the West and the East up a notch in planning reserve level to see how much the unserved energy is reduced
» Develop a set of results with increasing reserves to test the benefit from moving from one level to the next
40
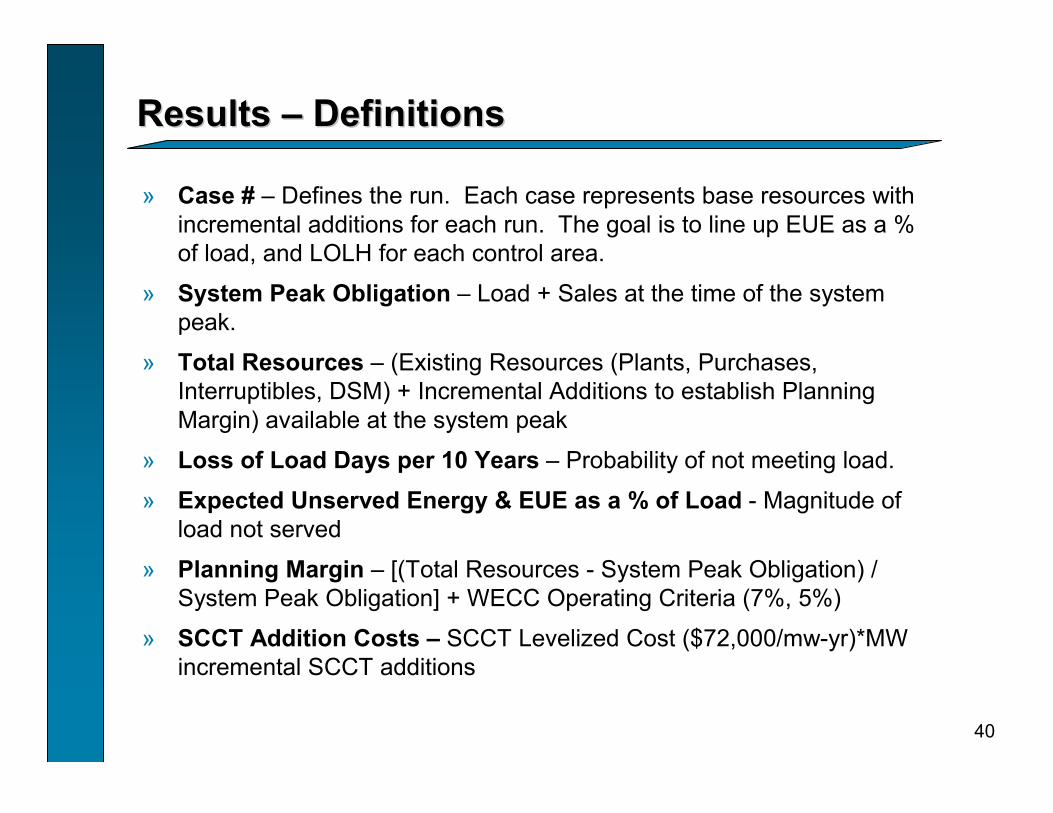
Results Results –– DefinitionsDefinitions
» Case # – Defines the run. Each case represents base resources with incremental additions for each run. The goal is to line up EUE as a % of load, and LOLH for each control area.
» System Peak Obligation – Load + Sales at the time of the system peak.
» Total Resources – (Existing Resources (Plants, Purchases, Interruptibles, DSM) + Incremental Additions to establish Planning Margin) available at the system peak
» Loss of Load Days per 10 Years – Probability of not meeting load.
» Expected Unserved Energy & EUE as a % of Load - Magnitude of load not served
» Planning Margin – [(Total Resources - System Peak Obligation) / System Peak Obligation] + WECC Operating Criteria (7%, 5%)
» SCCT Addition Costs – SCCT Levelized Cost ($72,000/mw-yr)*MW incremental SCCT additions

41
Results Results –– Loss of Load Days in 10 Years Loss of Load Days in 10 Years -- EastEast
0.0
0.5
1.0
1.5
2.0
2.5
3.0
3.5
4.0
4.5
12.9% 13.9% 14.9% 15.9% 16.8% 17.8% 18.8% 19.8% 20.8% 21.8% 22.8%
Planning Margin
Loss
of L
oad
Day
s

42
Results Results –– Loss of Load Days in 10 Years Loss of Load Days in 10 Years -- WestWest
0.0
0.5
1.0
1.5
2.0
2.5
3.0
3.5
4.0
13.4% 14.3% 15.2% 16.1% 17.0% 17.8% 18.7% 19.6% 20.5% 21.4% 22.2%
Planning Margin
Loss
of L
oad
Day
s

43
Results Results –– Expected Unserved Energy Vs. Reserve Margin Expected Unserved Energy Vs. Reserve Margin -- EastEast
0
50
100
150
200
250
300
350
400
450
500
550
600
650
700
750
800
850
13.9% 14.9% 15.9% 16.8% 17.8% 18.8% 19.8% 20.8% 21.8% 22.8%
Planning Margin
EUE
Red
uctio
n (M
Wh)

44
Results Results –– Expected Unserved Energy Vs. Reserve Margin Expected Unserved Energy Vs. Reserve Margin -- WestWest
0.0
25.0
50.0
75.0
100.0
125.0
150.0
175.0
200.0
225.0
14.3% 15.2% 16.1% 17.0% 17.8% 18.7% 19.6% 20.5% 21.4% 22.2%
Planning Margin
EUE
Red
uctio
n (M
Wh)

45
Results Results –– Cost of Reducing LOLDCost of Reducing LOLD in 10 Years in 10 Years -- EastEast
$0
$20,000
$40,000
$60,000
$80,000
$100,000
$120,000
12.9% 13.9% 14.9% 15.9% 16.8% 17.8% 18.8% 19.8% 20.8% 21.8% 22.8%
Planning Margin
Cum
ulat
ive
Cos
ts fo
r Inc
reas
ing
Plan
ning
Mar
gin
($00
0/yr
)
0.0
0.5
1.0
1.5
2.0
2.5
3.0
3.5
4.0
4.5
LOLD
in 1
0 Ye
ars
AdditionsLOLD

46
Results Results –– Cost of Reducing LOLDCost of Reducing LOLD in 10 Years in 10 Years -- WestWest
$-
$10,000
$20,000
$30,000
$40,000
$50,000
$60,000
13.4% 14.3% 15.2% 16.1% 17.0% 17.8% 18.7% 19.6% 20.5% 21.4% 22.2%
Planning Margin
Cum
ulat
ive
Cos
ts fo
r Inc
reas
ing
Plan
ning
Mar
gin
($00
0/yr
)
0.0
0.5
1.0
1.5
2.0
2.5
3.0
3.5
4.0
LOLD
in 1
0 Ye
ars
AdditionsLOLD
47
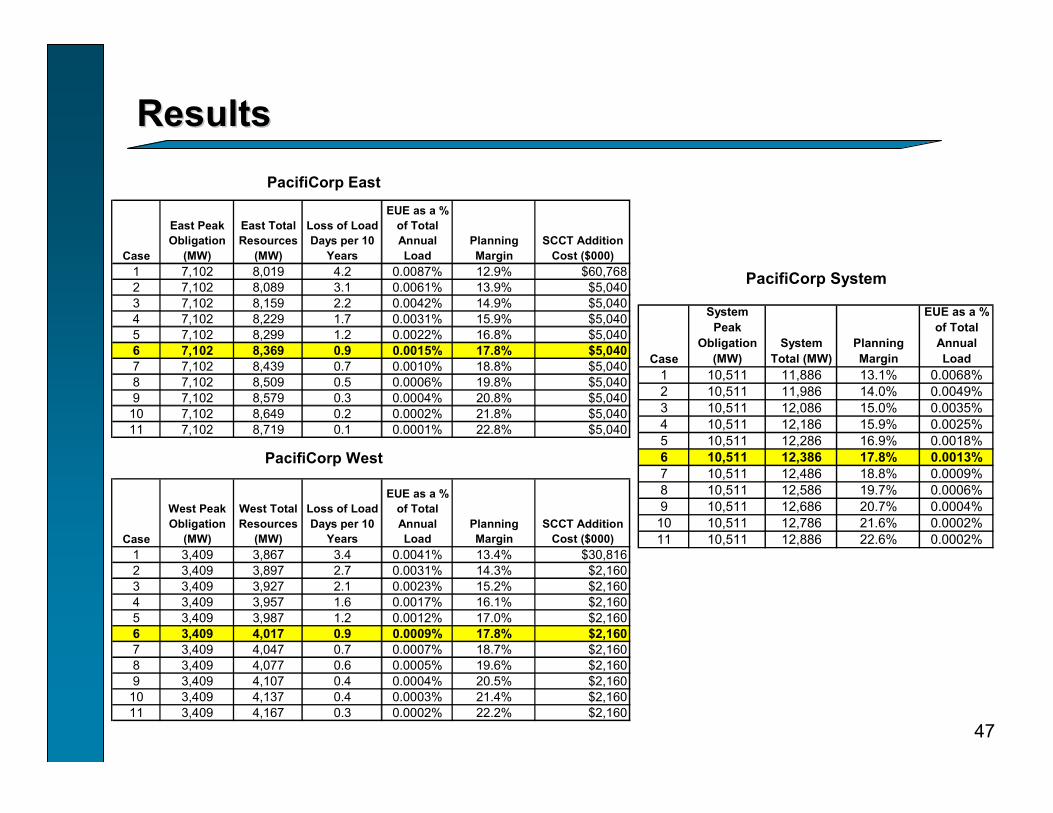
ResultsResults
Case
System Peak
Obligation (MW)
System Total (MW)
Planning Margin
EUE as a % of Total Annual Load
1 10,511 11,886 13.1% 0.0068%2 10,511 11,986 14.0% 0.0049%3 10,511 12,086 15.0% 0.0035%4 10,511 12,186 15.9% 0.0025%5 10,511 12,286 16.9% 0.0018%6 10,511 12,386 17.8% 0.0013%7 10,511 12,486 18.8% 0.0009%8 10,511 12,586 19.7% 0.0006%9 10,511 12,686 20.7% 0.0004%10 10,511 12,786 21.6% 0.0002%11 10,511 12,886 22.6% 0.0002%
PacifiCorp SystemCase
East Peak Obligation
(MW)
East Total Resources
(MW)
Loss of Load Days per 10
Years
EUE as a % of Total Annual Load
Planning Margin
SCCT Addition Cost ($000)
1 7,102 8,019 4.2 0.0087% 12.9% $60,7682 7,102 8,089 3.1 0.0061% 13.9% $5,0403 7,102 8,159 2.2 0.0042% 14.9% $5,0404 7,102 8,229 1.7 0.0031% 15.9% $5,0405 7,102 8,299 1.2 0.0022% 16.8% $5,0406 7,102 8,369 0.9 0.0015% 17.8% $5,0407 7,102 8,439 0.7 0.0010% 18.8% $5,0408 7,102 8,509 0.5 0.0006% 19.8% $5,0409 7,102 8,579 0.3 0.0004% 20.8% $5,04010 7,102 8,649 0.2 0.0002% 21.8% $5,04011 7,102 8,719 0.1 0.0001% 22.8% $5,040
Case
West Peak Obligation
(MW)
West Total Resources
(MW)
Loss of Load Days per 10
Years
EUE as a % of Total Annual Load
Planning Margin
SCCT Addition Cost ($000)
1 3,409 3,867 3.4 0.0041% 13.4% $30,8162 3,409 3,897 2.7 0.0031% 14.3% $2,1603 3,409 3,927 2.1 0.0023% 15.2% $2,1604 3,409 3,957 1.6 0.0017% 16.1% $2,1605 3,409 3,987 1.2 0.0012% 17.0% $2,1606 3,409 4,017 0.9 0.0009% 17.8% $2,1607 3,409 4,047 0.7 0.0007% 18.7% $2,1608 3,409 4,077 0.6 0.0005% 19.6% $2,1609 3,409 4,107 0.4 0.0004% 20.5% $2,16010 3,409 4,137 0.4 0.0003% 21.4% $2,16011 3,409 4,167 0.3 0.0002% 22.2% $2,160
PacifiCorp East
PacifiCorp West
48
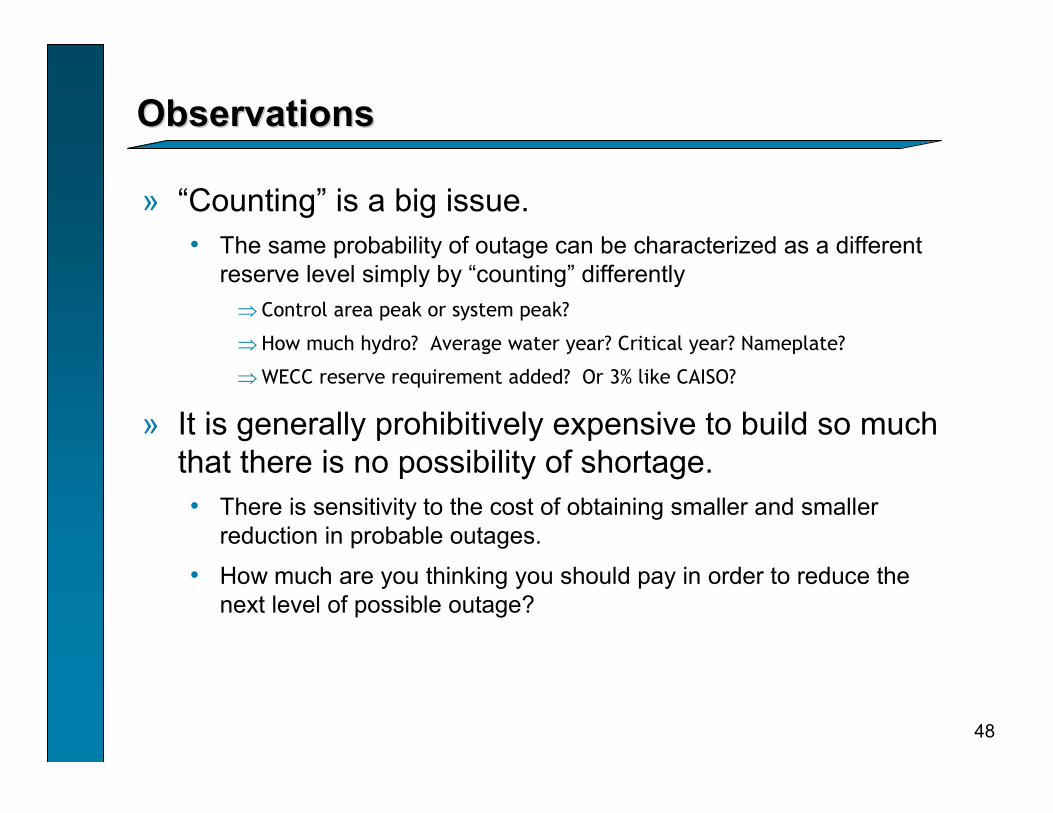
ObservationsObservations
» “Counting” is a big issue. • The same probability of outage can be characterized as a different
reserve level simply by “counting” differently⇒ Control area peak or system peak?
⇒ How much hydro? Average water year? Critical year? Nameplate?
⇒ WECC reserve requirement added? Or 3% like CAISO?
» It is generally prohibitively expensive to build so much that there is no possibility of shortage. • There is sensitivity to the cost of obtaining smaller and smaller
reduction in probable outages.
• How much are you thinking you should pay in order to reduce the next level of possible outage?

49
Observations Observations (continued)(continued)
» West• Hydro volatility
• Large units in a small system⇒Each Bridger unit is roughly 10% of West peak load
» Generally Accepted Resource Reliability Criteria Across US ?• 1 day in 10 years loss of load probability
50
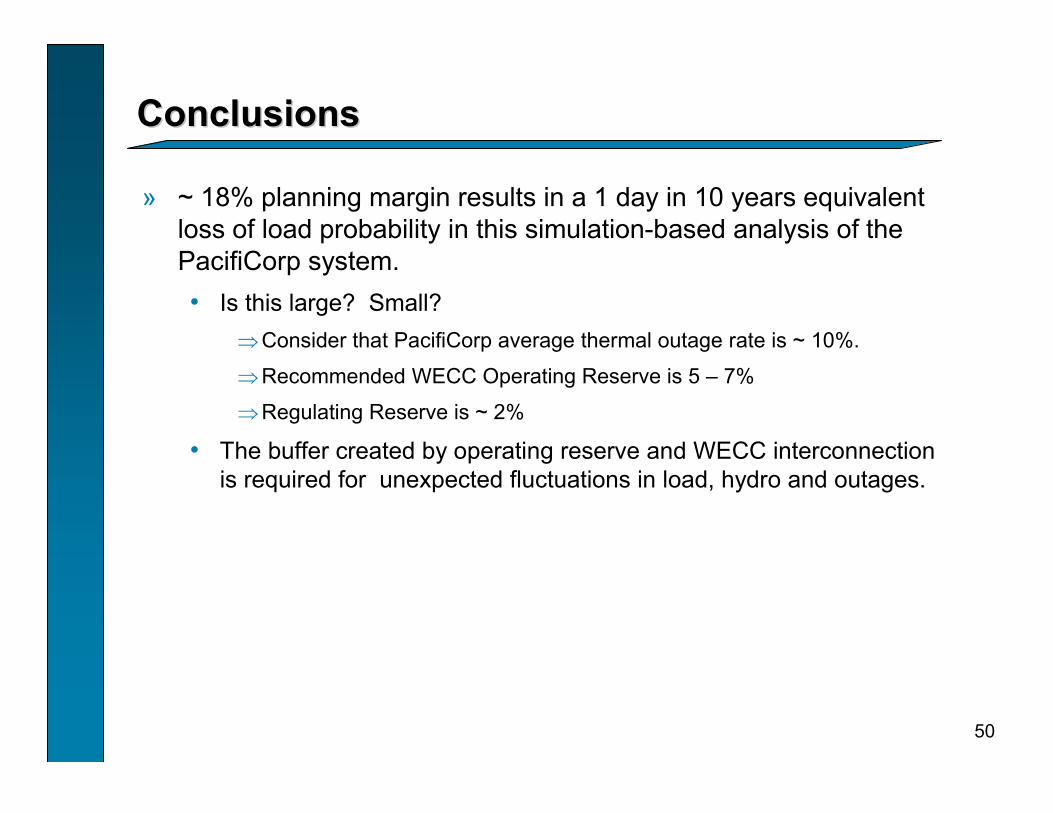
ConclusionsConclusions
» ~ 18% planning margin results in a 1 day in 10 years equivalent loss of load probability in this simulation-based analysis of the PacifiCorp system.• Is this large? Small?
⇒Consider that PacifiCorp average thermal outage rate is ~ 10%.
⇒Recommended WECC Operating Reserve is 5 – 7%
⇒Regulating Reserve is ~ 2%
• The buffer created by operating reserve and WECC interconnectionis required for unexpected fluctuations in load, hydro and outages.
Load/Resource BalancesLoad/Resource Balances
Melissa Seymour
52
L&R AgendaL&R Agenda
» Review Major Assumptions
» Capacity Charts
» Net Position Duration Curves
» Energy Graphs

53
Major Assumptions Common to All Major Assumptions Common to All L&R’sL&R’s
» Currant Creek, Lake Side, and all contracts as of May 1, 2004 are included (i.e. DG&T)
» West Valley Lease• For FY 2006 – FY 2008, assume either extension of West Valley or
equivalent purchase
• For FY 2009 and beyond, L&R will be not include West Valley lease
» Current DSM programs and the two new RFP Class 2 Programs
» For planning purposes, there are no plant retirements in the Action Plan horizon (3-5 years)
» 90 MW QF in Utah included (1/1/2006)
» 1,400 MW of Renewable Generation included• 20% Planning Credit at Peak
• Modeled after characteristics of currently owned wind generation

54
Capacity ChartsCapacity Charts
» Capacity Charts show the Peak Obligation plus the Planning Margin requirement as compared to the Available Resources for the peak load hour • Peak Obligation = Load + Sales
• Coincident peak Planning Margin = 18%
• Non-coincident Planning Margins = 16.5% (East) and 16.2% (West)
• Available Resources = Available (Thermal + Hydro + Purchases + Interruptible + Class 1 DSM)
» Results are shown for the system coincident peaks, and for the non-coincident peak for each control area

55
-
2,000
4,000
6,000
8,000
10,000
12,000
14,000
2006 2007 2008 2009 2010 2011 2012 2013 2014 2015Fiscal Year
MW
s
Available Resources
Resource Deficit
Peak Obligation + Planning Margin
Coincident Peak Coincident Peak –– SystemSystem
» > 4,000 MW of need by FY 2015

56
2004 IRP Waterfall Chart 2004 IRP Waterfall Chart -- SystemSystem
» Waterfall charts identifies the major components that define the need in FY 2015.
» The major contributors to the short position include peak load growth, contract expirations, and planning margin
1100
(1800)
1300
(400)
(1900)
(2100)(300)
(4,500)
(3,500)
(2,500)
(1,500)
(500)
500
1,500
L/R Balance(FY2006)*
Planning MarginRequirement at18% (FY2006)**
Additions fromFY2006 toFY2015***
Retirements/ De-Rates
ContractExpiration Load Growth
18% PlanningMargin (FY2015)
****
MW
* L/R Balance is PacifiCorp's total resources less its total peak requirement** L/R Balance with 18% planning margin requirement*** Includes Lake Side, Currant Creek (245 MW), and renewables (1300 MW multiplied by 0.2, or 260 MW)**** Incremental planning margin requirement by FY2015
57
-
1,000
2,000
3,000
4,000
5,000
6,000
7,000
8,000
9,000
10,000
2006 2007 2008 2009 2010 2011 2012 2013 2014 2015Fiscal Year
MW
s
Available Resources
Peak Obligation + Planning Margin
Resource Deficit
West to East Transfer Limit
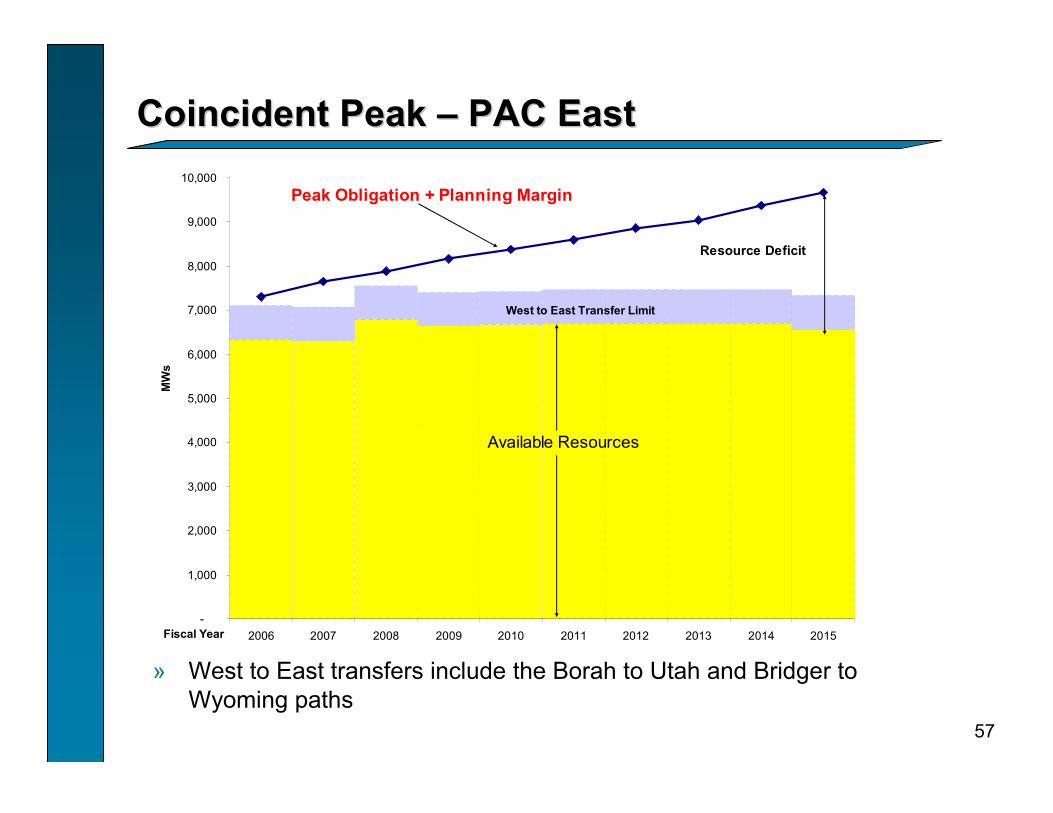
Coincident Peak Coincident Peak –– PAC EastPAC East
» West to East transfers include the Borah to Utah and Bridger to Wyoming paths

58
-
1,000
2,000
3,000
4,000
5,000
6,000
7,000
8,000
9,000
10,000
2006 2007 2008 2009 2010 2011 2012 2013 2014 2015Fiscal Year
MW
s
Available Resources
Peak Obligation + Planning Margin
Coincident Peak Coincident Peak –– PAC WestPAC West
» 2008: TransAlta purchase ends» 2009: Clark County contract ends» 2013: BPA contract ends
Resource Deficit

59
NonNon--Coincident Peak Coincident Peak –– PAC EastPAC East
» West to East transfers include the Borah to Utah and Bridger to Wyoming paths
-
1,000
2,000
3,000
4,000
5,000
6,000
7,000
8,000
9,000
10,000
2006 2007 2008 2009 2010 2011 2012 2013 2014 2015Fiscal Year
MW
s
Available Resources
Peak Obligation + Planning Margin
Resource Deficit
West to East Transfer Limit
60
-
1,000
2,000
3,000
4,000
5,000
6,000
7,000
8,000
9,000
10,000
2006 2007 2008 2009 2010 2011 2012 2013 2014 2015Fiscal Year
MW
s
Available Resources
Peak Obligation + Planning Margin
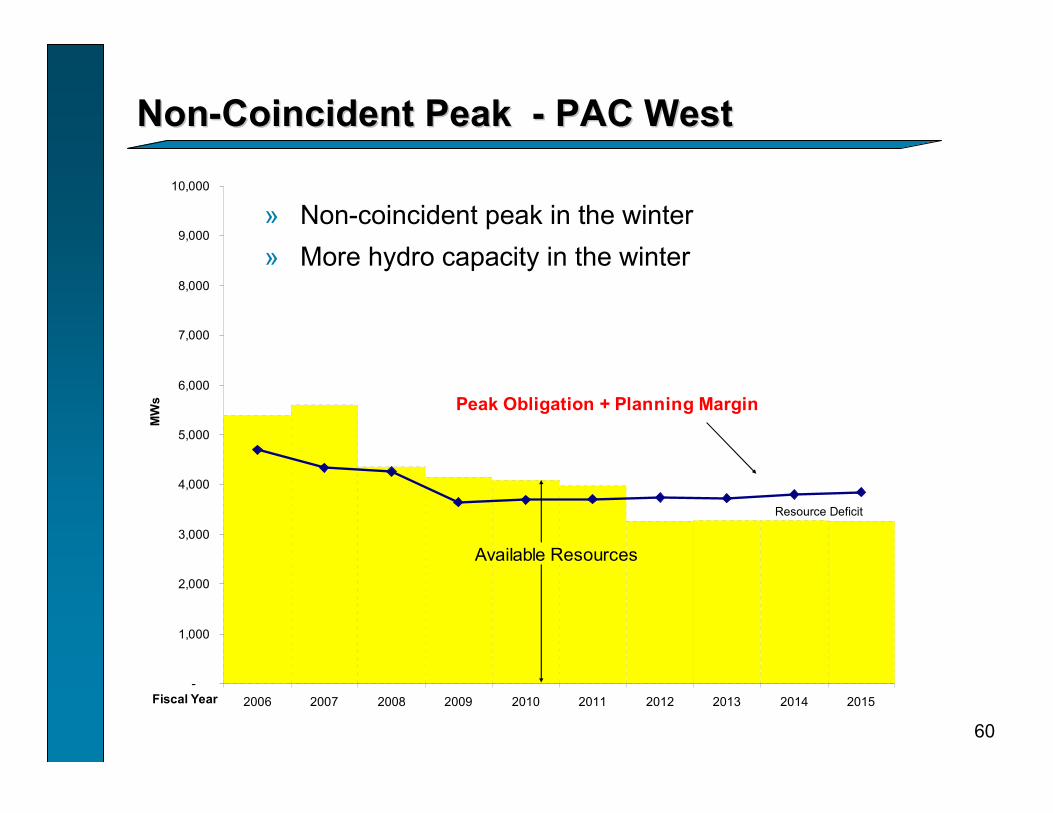
NonNon--Coincident Peak Coincident Peak -- PAC WestPAC West
» Non-coincident peak in the winter » More hydro capacity in the winter
Resource Deficit

61
Net Position Duration CurvesNet Position Duration Curves
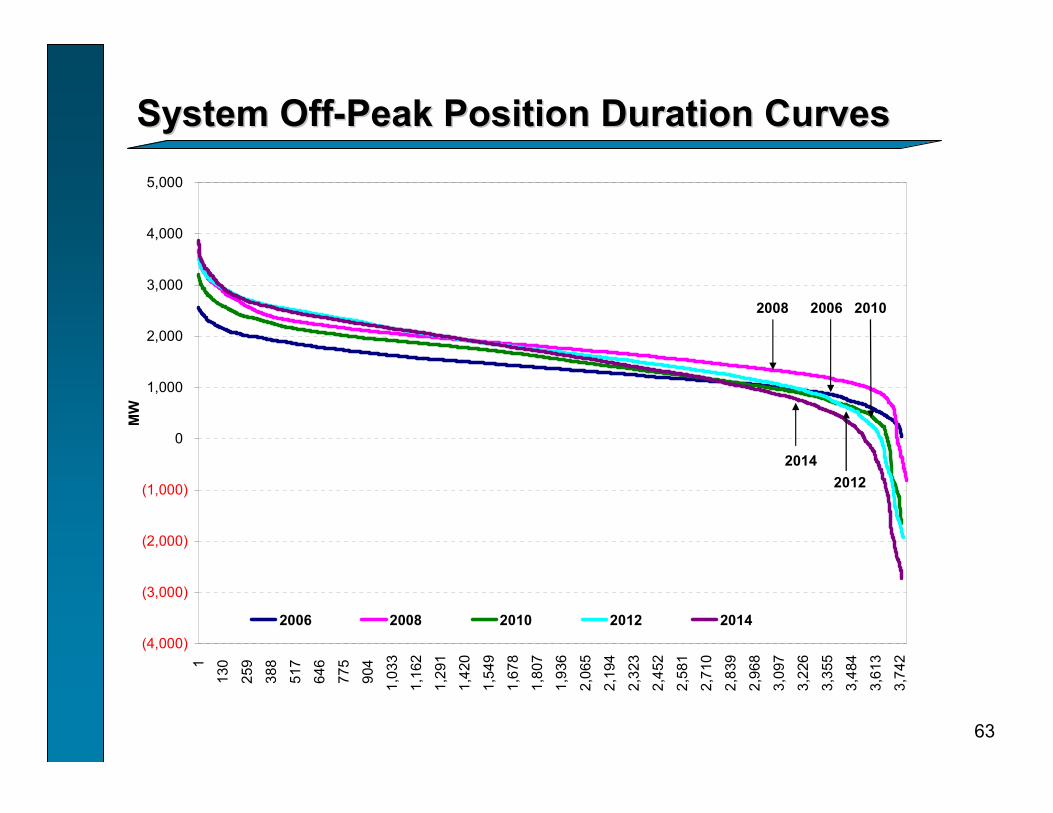
» Constructed by computing the net position for each hour of a year, sorting them in descending order, and graphing them starting with the longest position
» Net Position = Thermal + Exchange + Hydro + Wind + Interruptible + DSM + Purchase + Imports (into Control Area) –WECC Reserves - Sale - Load - Exports (out of Control Area)
» Measures the number of hours per year the net position is at or above a given level
» De-rated thermal capacity included for forced outages
» On-Peak hours are weekdays & Saturday hour ending 7:00 am to 10:00 pm; Off-Peak hours are all other hours

62
System OnSystem On--Peak Position Duration CurvesPeak Position Duration Curves
» 2008 curve is above 2006 due to the addition of Currant Creek & Lake Side
(5,000)
(4,000)
(3,000)
(2,000)
(1,000)
0
1,000
2,000
3,000
4,000
1
170
339
508
677
846
1,01
5
1,18
4
1,35
3
1,52
2
1,69
1
1,86
0
2,02
9
2,19
8
2,36
7
2,53
6
2,70
5
2,87
4
3,04
3
3,21
2
3,38
1
3,55
0
3,71
9
3,88
8
4,05
7
4,22
6
4,39
5
4,56
4
4,73
3
4,90
2
MW
2006 2008 2010 2012 2014
2006 2008 2010
2012
2014
63
System OffSystem Off--Peak Position Duration CurvesPeak Position Duration Curves
(4,000)
(3,000)
(2,000)
(1,000)
0
1,000
2,000
3,000
4,000
5,0001
130
259
388
517
646
775
904
1,03
3
1,16
2
1,29
1
1,42
0
1,54
9
1,67
8
1,80
7
1,93
6
2,06
5
2,19
4
2,32
3
2,45
2
2,58
1
2,71
0
2,83
9
2,96
8
3,09
7
3,22
6
3,35
5
3,48
4
3,61
3
3,74
2
MW
2006 2008 2010 2012 2014
20062008 2010
20122014

64
West OnWest On--Peak Position Duration CurvesPeak Position Duration Curves
(3,000)
(2,000)
(1,000)
0
1,000
2,000
3,000
4,0001
173
345
517
689
861
1,03
3
1,20
5
1,37
71,
549
1,72
11,
893
2,06
5
2,23
72,
409
2,58
12,
753
2,92
5
3,09
7
3,26
9
3,44
13,
613
3,78
53,
957
4,12
9
4,30
14,
473
4,64
54,
817
4,98
9
MW
2006 2008 2010 2012 2014
2006 2008 2010
2012 2014

65
West OffWest Off--Peak Position Duration CurvesPeak Position Duration Curves
(3,000)
(2,000)
(1,000)
0
1,000
2,000
3,000
4,0001
128
255
382
509
636
763
890
1,01
7
1,14
4
1,27
1
1,39
8
1,52
5
1,65
2
1,77
9
1,90
6
2,03
3
2,16
0
2,28
7
2,41
4
2,54
1
2,66
8
2,79
5
2,92
2
3,04
9
3,17
6
3,30
3
3,43
0
3,55
7
3,68
4
MW
2006 2008 2010 2012 2014
2006
20082010 2012
2014

66
East OnEast On--Peak Position Duration CurvesPeak Position Duration Curves
(3,000)
(2,000)
(1,000)
0
1,000
2,000
3,000
4,0001
170
339
508
677
846
1,01
5
1,18
4
1,35
3
1,52
2
1,69
1
1,86
0
2,02
9
2,19
8
2,36
7
2,53
6
2,70
5
2,87
4
3,04
3
3,21
2
3,38
1
3,55
0
3,71
9
3,88
8
4,05
7
4,22
6
4,39
5
4,56
4
4,73
3
4,90
2
MW
2006 2008 2010 2012 2014
2006 2008 2010
2012
2014

67
East OffEast Off--Peak Position Duration CurvesPeak Position Duration Curves
(3,000)
(2,000)
(1,000)
0
1,000
2,000
3,000
4,0001
130
259
388
517
646
775
904
1,03
3
1,16
2
1,29
1
1,42
0
1,54
91,
678
1,80
7
1,93
6
2,06
5
2,19
4
2,32
3
2,45
2
2,58
12,
710
2,83
92,
968
3,09
7
3,22
6
3,35
5
3,48
4
3,61
3
3,74
2
MW
2006 2008 2010 2012 2014
2006 2008 2010
20122014

68
Energy GraphsEnergy Graphs
» The energy graphs show the net position by month for on-peak and off-peak hours for each Control Area
» Includes average monthly outages and the WECC reserve requirement
» All results are shown after transfer

69
West Energy CurvesWest Energy Curves
(2,000)
(1,500)
(1,000)
(500)
0
500
1,000
1,500
2,000
2,500
Apr
-05
Jul-0
5O
ct-0
5Ja
n-06
Apr
-06
Jul-0
6O
ct-0
6Ja
n-07
Apr
-07
Jul-0
7O
ct-0
7Ja
n-08
Apr
-08
Jul-0
8O
ct-0
8Ja
n-09
Apr
-09
Jul-0
9O
ct-0
9Ja
n-10
Apr
-10
Jul-1
0O
ct-1
0Ja
n-11
Apr
-11
Jul-1
1O
ct-1
1Ja
n-12
Apr
-12
Jul-1
2O
ct-1
2Ja
n-13
Apr
-13
Jul-1
3O
ct-1
3Ja
n-14
Apr
-14
Jul-1
4O
ct-1
4Ja
n-15
MW
a
PAC West Off-PeakPAC West On-Peak

70
East Energy CurvesEast Energy Curves
(2,000)
(1,500)
(1,000)
(500)
0
500
1,000
1,500
2,000
2,500
Apr
-05
Jul-0
5O
ct-0
5Ja
n-06
Apr
-06
Jul-0
6O
ct-0
6Ja
n-07
Apr
-07
Jul-0
7O
ct-0
7Ja
n-08
Apr
-08
Jul-0
8O
ct-0
8Ja
n-09
Apr
-09
Jul-0
9O
ct-0
9Ja
n-10
Apr
-10
Jul-1
0O
ct-1
0Ja
n-11
Apr
-11
Jul-1
1O
ct-1
1Ja
n-12
Apr
-12
Jul-1
2O
ct-1
2Ja
n-13
Apr
-13
Jul-1
3O
ct-1
3Ja
n-14
Apr
-14
Jul-1
4O
ct-1
4Ja
n-15
MW
a
PAC East Off-PeakPAC East On-Peak

71
Portfolio Construction TargetsPortfolio Construction Targets
» Automatic Resource Addition Logic Tool will use planning margin target as constraint
» Manual portfolio construction process will use L&R balances to construct portfolios• Coincident peak capacity charts will be used to determine build
target
• Duration curves and energy graphs will be used to determine the type and timing of portfolio resource additions
72
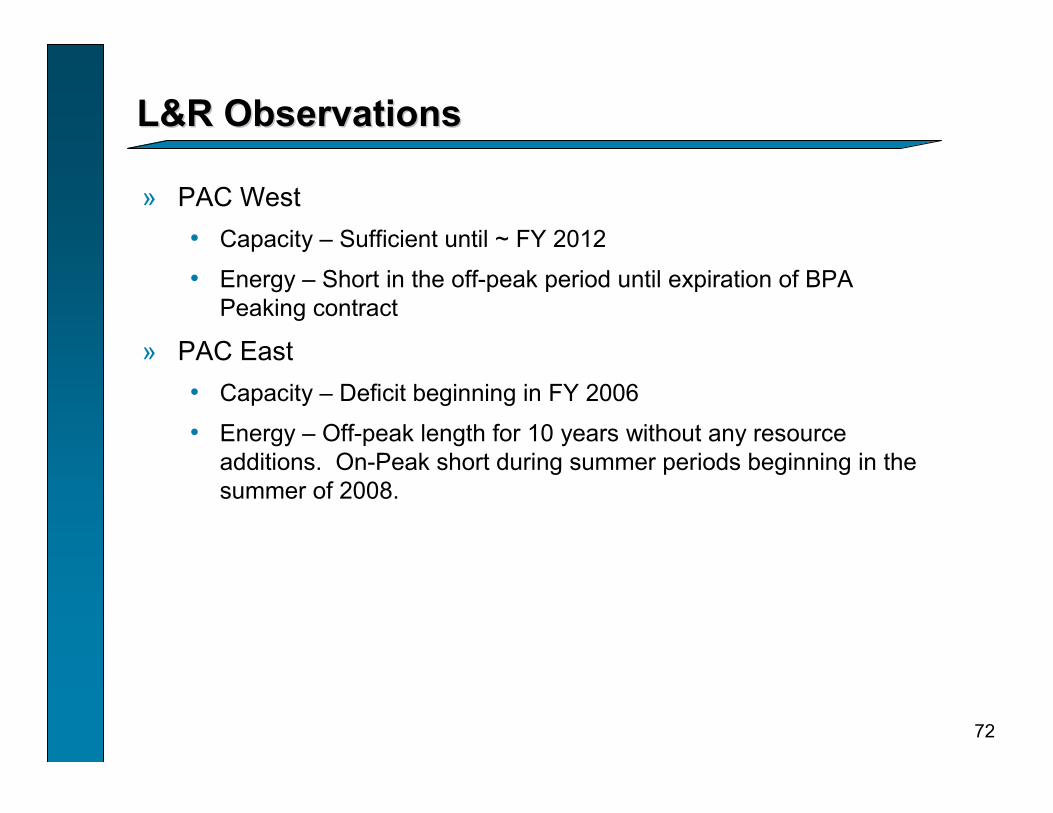
L&R ObservationsL&R Observations
» PAC West • Capacity – Sufficient until ~ FY 2012
• Energy – Short in the off-peak period until expiration of BPA Peaking contract
» PAC East • Capacity – Deficit beginning in FY 2006
• Energy – Off-peak length for 10 years without any resource additions. On-Peak short during summer periods beginning in the summer of 2008.

Next StepsNext Steps
Melissa Seymour
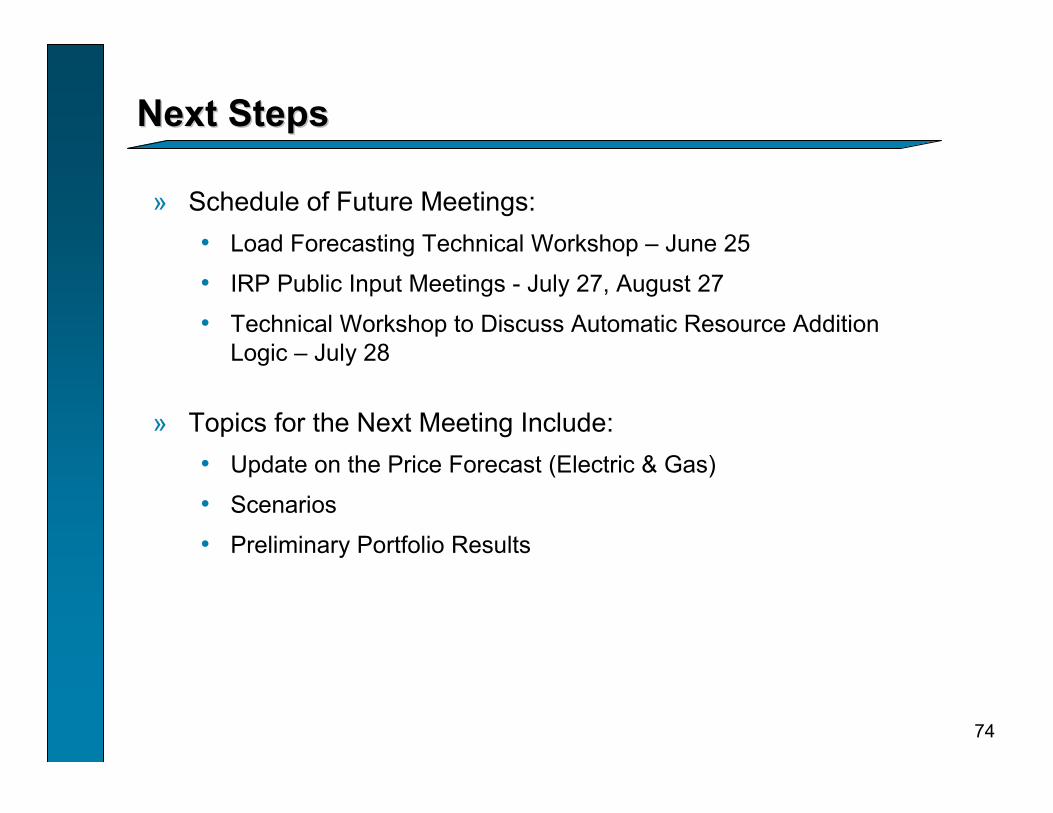
74
Next StepsNext Steps
» Schedule of Future Meetings:• Load Forecasting Technical Workshop – June 25
• IRP Public Input Meetings - July 27, August 27
• Technical Workshop to Discuss Automatic Resource Addition Logic – July 28
» Topics for the Next Meeting Include:• Update on the Price Forecast (Electric & Gas)
• Scenarios
• Preliminary Portfolio Results

HandoutsHandouts

PacifiCorp 2004 Integrated Resource Plan DRAFT Public Input Meeting June 10, 2004
Fuel Installation Location Technology
Plant Lead Time - Months
Average Capacity MW
Not Incl. Degradation
Maximum Capacity
Addition per Site
Capital Cost in $/kW
(Average)Design Plant Life in Years
Annual Avg. Heat Rate
HHV - Incl. Degradation (Btu/kWh)
Maint. Outage Rate
(1-EAF-EFOR)
Equivalent Forced
Outage Rate (EFOR)
Var. O&M $/MWh
Fixed O&M in $/kW-yr
CoalBrownfield PC Subcritical Coal PAC East Pulverized Coal-Subcritical 52 575 575 $1,687 40 9,483 5.00% 4.00% $0.80 $32.23
Brownfield PC Supercritical Coal PAC East Pulverized Coal-Supercritical 52 575 575 $1,735 40 9,129 5.00% 4.00% $0.78 $33.77Greenfield PC Coal PAC East Pulverized Coal 63 575 1,150 $1,729 40 9,483 5.00% 4.00% $0.80 $38.78
Greenfield IGCC Coal PAC East Integrated Gasification Combined Cycle 66 368 1,104 $2,171 40 8,311 15.00% 10.00% $1.83 $30.52Greenfield PC 2 Coal PAC East Pulverized Coal 66 575 1,150 $1,813 40 9,483 5.00% 4.00% $0.80 $38.78
Natural GasGreenfield SCCT Aero Nat. Gas PAC East Aero SCCT 24 80 400 $682 25 10,225 5.00% 5.22% $4.00 $13.01Intercooled Aero SCCT Nat. Gas PAC East Intercooled CT 24 87 435 $560 25 8,352 5.00% 5.22% $4.20 $9.05
Greenfield Internal Combustion Engines Nat. Gas PAC East Natural Gas Engines 24 165 165 $633 25 8,700 5.00% 3.00% $5.50 $12.72SCCT Frame Nat. Gas PAC East Frame SCCT 30 280 1,120 $555 35 10,990 4.90% 2.80% $5.35 $10.97
CCCT (2x1) - 4250 feet (Wet Cooling) Nat. Gas PAC East Wet Cooling CCCT 39 450 450 $730 35 7,186 4.95% 2.80% $3.17 $8.85 Wet CCCT Duct Firing (2x1) Nat. Gas PAC East Duct Firing with Wet Cooling CCCT 39 110 110 $186 35 8,868 4.95% 2.80% $0.10 $2.80
CCCT 2x1 - 5100 feet (Dry Cooling) Nat. Gas PAC East Dry Cooling CCCT 36 420 420 $789 35 7,462 4.95% 2.80% $3.27 $10.63Dry CCCT Duct Firing 2x1 Nat. Gas PAC East Duct Firing with Dry Cooling CCCT 36 105 105 $207 35 9,512 4.95% 2.80% $0.10 $2.93CCCT (2x1) - (Dry Cooling) Nat. Gas PAC East Dry Cooling CCCT 32 420 420 $682 35 7,462 4.95% 2.80% $3.18 $4.66 Dry CCCT Duct Firing (2x1) Nat. Gas PAC East Duct Firing with Dry Cooling CCCT 32 105 105 $207 35 9,512 4.95% 2.80% $0.10 $2.93
Greenfield SCCT Aero Nat. Gas PAC West - Elevation 1500 ' Aero SCCT 24 89 447 $595 25 10,225 5.00% 5.22% $3.58 $11.64Intercooled Aero SCCT Nat. Gas PAC West - Elevation 1500 ' Intercooled CT 24 97 486 $501 25 8,352 5.00% 5.22% $3.76 $8.10
Greenfield SCCT Frame Nat. Gas PAC West - Elevation 1500 ' Frame SCCT 30 313 1,252 $497 35 10,990 4.90% 2.80% $4.79 $11.42Greenfield Internal Combustion Engines Nat. Gas PAC West - Elevation 1500 ' Natural Gas Engines 24 165 165 $633 25 8,700 5.00% 3.00% $5.50 $12.72Greenfield CCCT 2x1 - (Wet Cooling) Nat. Gas PAC West - Elevation 1500 ' Wet Cooling CCCT 36 503 1,006 $653 35 7,186 4.95% 2.80% $2.83 $9.51
Greenfield CCCT Duct Firing 2x1 - (Wet Cooling) Nat. Gas PAC West - Elevation 1500 ' Duct Firing with Wet Cooling CCCT 36 123 246 $167 35 8,868 4.95% 2.80% $0.10 $2.50Greenfield CCCT 2x1 - (Dry Cooling) Nat. Gas PAC West - Elevation 1500 ' Dry Cooling CCCT 36 469 939 $706 35 7,462 4.95% 2.80% $2.93 $9.51
Greenfield CCCT Duct Firing 2x1 - (Dry Cooling) Nat. Gas PAC West - Elevation 1500 ' Duct Firing with Dry Cooling CCCT 36 117 235 $185 35 9,512 4.95% 2.80% $0.10 $2.62Greenfield SCCT Aero Nat. Gas PAC West - Sea Level Aero SCCT 24 94 471 $566 25 10,225 5.00% 5.22% $3.40 $11.06Intercooled Aero SCCT Nat. Gas PAC West - Sea Level Intercooled CT 24 102 512 $476 25 8,352 5.00% 5.22% $3.57 $7.69
Greenfield SCCT Frame Nat. Gas PAC West - Sea Level Frame SCCT 30 329 1,318 $472 35 10,990 4.90% 2.80% $4.55 $10.85Greenfield Internal Combustion Engines Nat. Gas PAC West - Sea Level Natural Gas Engines 24 165 165 $633 25 8,700 5.00% 3.00% $5.50 $12.72Greenfield CCCT 2x1 - (Wet Cooling) Nat. Gas PAC West - Sea Level Wet Cooling CCCT 36 529 1,059 $620 35 7,186 4.95% 2.80% $2.69 $9.04
Greenfield CCCT Duct Firing 2x1 - (Wet Cooling) Nat. Gas PAC West - Sea Level Duct Firing with Wet Cooling CCCT 36 129 259 $158 35 8,868 4.95% 2.80% $0.10 $2.38Greenfield CCCT 2x1 - (Dry Cooling) Nat. Gas PAC West - Sea Level Dry Cooling CCCT 36 494 988 $670 35 7,462 4.95% 2.80% $2.78 $9.04
Greenfield CCCT Duct Firing 2x1 - (Dry Cooling) Nat. Gas PAC West - Sea Level Duct Firing with Dry Cooling CCCT 36 124 247 $176 35 9,512 4.95% 2.80% $0.10 $2.49Renewables
East Side Wind (34.5% CF) n/a PAC East Wind 12 50 400 $1,256 20 n/a n/a n/a $0.00 $40.63West Side Wind (33.5% CF) n/a PAC West - Elevation 1500 ' Wind 12 50 300 $1,251 20 n/a n/a 5.00% $0.00 $29.56
East Side Geothermal Geothermal PAC East Various (RFP Data) 24 30 70 $1,650 35 n/a 2.50% 1.00% $2.34 $80.17West Side Geothermal Geothermal PAC West - Elevation 1500 ' Various (RFP Data) 24 40 55 $2,310 35 n/a 4.50% 2.00% $2.34 $93.47
StoragePumped Storage Water/coal PAC East Pumped Hydro 36 200 400 $871 35 0 n/a n/a $0.52 $40.63
Compressed Air Energy Storage (CAES) Gas/Coal PAC East CAES 36 323 323 $799 25 4,330 4.90% 2.80% $1.41 $5.53Compressed Air Energy Storage (CAES) Gas/Coal PAC West - Elevation 1500 ' CAES 36 361 361 $715 25 4,330 4.90% 2.80% $1.26 $4.95Compressed Air Energy Storage (CAES) Gas/Coal PAC West - Sea Level CAES 36 380 380 $679 25 4,330 4.90% 2.80% $1.20 $4.70
Distributed GenerationCHP Nat. Gas PacWest Cogeneration 24 6 6 $919 20 12,590 5.00% 10.0% $5.39 $23.06CHP Nat. Gas PacWest Cogeneration 24 11 11 $833 20 11,765 5.00% 10.0% $5.39 $23.06CHP Nat. Gas PacWest Cogeneration 24 28 28 $718 20 9,945 5.00% 10.0% $4.49 $23.06CHP Nat. Gas PacWest Cogeneration 24 45 45 $630 20 9,220 5.00% 10.0% $3.59 $23.06CHP Nat. Gas PacEast Cogeneration 24 5 5 $1,112 20 12,590 5.00% 10.0% $6.51 $27.89CHP Nat. Gas PacEast Cogeneration 24 9 9 $1,008 20 11,765 5.00% 10.0% $6.51 $27.89CHP Nat. Gas PacEast Cogeneration 24 23 23 $869 20 9,945 5.00% 10.0% $5.43 $27.89CHP Nat. Gas PacEast Cogeneration 24 37 37 $762 20 9,220 5.00% 10.0% $4.34 $27.89
Microturbines Nat. Gas PAC East Gas Turbine 12 0.034 0.343 $1,776 15 15,075 1.00% 1.00% $8.75 $410.02Microturbines Nat. Gas PAC West - Elevation 1500 ' Gas Turbine 12 0.035 0.355 $1,934 15 15,075 1.00% 1.00% $6.53 $356.65Microturbines Nat. Gas PAC West - Sea Level Gas Turbine 12 0.033 0.334 $2,030 15 15,075 1.00% 1.0% $6.20 $338.82
Fuel Cells Nat. Gas PAC East SOFC 12 0.271 3 $3,342 25 7,580 1.00% 1.00% $22.16 $50.89Fuel Cells Nat. Gas PAC West - Elevation 1500 ' SOFC 12 0.279 3 $3,249 25 7,580 1.00% 1.00% $21.54 $49.48Fuel Cells Nat. Gas PAC West - Sea Level SOFC 12 0.279 3 $3,249 25 7,580 1.00% 1.0% $21.54 $49.48
Solar Solar PAC East PV 24 0.108 0.108 $5,309 20 n/a n/a n/a $0.19 $21.24Demand Side (Class 1 Load Control)
Res./Small Comm'l Air Conditioner Control none PacWest Radio Control 36 45 45 n/a 10 n/a 0.00% 0.00% $0.00 $58.35Electric Space/Water Heat Control none PacWest Radio Control 36 45 45 n/a 10 n/a 0.00% 0.00% $0.00 $58.35
Commercial Lighting Control none PacWest Radio Control 36 45 45 n/a 10 n/a 0.00% 0.00% $0.00 $58.35Commercial Cooling Control none PacEast/PacWest Radio Control 36 44 44 n/a 10 n/a 0.00% 0.00% $0.00 $58.90
Irrigation Control none PacEast/PacWest Radio Control 36 44 44 n/a 10 n/a 0.00% 0.00% $0.00 $27.19
Supply Side Resources - CY 2004 $
Page 1 of 2

PacifiCorp 2004 Integrated Resource Plan DRAFT Public Input Meeting June 10, 2004
Supply Side Resources - CY 2004 $
Minimum Load as a percent of Capacity
Minimum Time to Full
Load in Minutes
(Warm Start)
Average Down
Time in Minutes
Cost per Startup (Fuel to
Sync. only)SO2 in
lbs/MMBtuNOx in
lbs/MMBtu
Hg in lbs/trillion
BtuCO2 in
lbs/mmBtu CommentsCoal
Brownfield PC Subcritical 25% 240 720 $15,907 0.059 0.072 0.6 205 Costs based on Hunter 4 Consortium ProposalBrownfield PC Supercritical 25% 240 720 $15,907 0.059 0.072 0.6 205 Data Taken from S&W report dated May 2004.
Greenfield PC 25% 240 720 $15,907 0.059 0.072 0.6 205 Costs based on modified Hunter 4 Consortium ProposalGreenfield IGCC 25% 360 720 $4,483 0.030 0.050 0.6 205 Assume Technology not available for decision till 2006 at earliestGreenfield PC 2 25% 240 720 $15,907 0.059 0.072 1.5 210 Costs based on modified Hunter 4 Consortium Proposal
Natural GasGreenfield SCCT Aero 25% 10 30 $73 0.00059 0.0181 0.255 118 Costs/Performance based on WV and Gadsby 2002 FERC Form 1Intercooled Aero SCCT 25% 10 30 $73 0.00059 0.0110 0.255 118 Not available till 2008 - Capital increased 15% (1 Unit vs 4 Unit comparison)
Greenfield Internal Combustion Engines 50% 10 10 $700 0.00059 0.0200 0.255 118SCCT Frame 25% 25 60 $897 0.00059 0.0323 0.255 118 Two machines - S&W cost study for NBA - VOM based on 8 hour/start
CCCT (2x1) - 4250 feet (Wet Cooling) 25% 130 0 $897 0.00059 0.0110 0.255 118 Not specific to Gadsby Repower Wet CCCT Duct Firing (2x1) 25% 20 0 $0 0.00059 0.0110 0.255 118 Only Available with base CCCT
CCCT 2x1 - 5100 feet (Dry Cooling) 25% 130 0 $897 0.00059 0.0110 0.255 118Dry CCCT Duct Firing 2x1 25% 20 0 $0 0.00059 0.0110 0.255 118 Only Available with CCCTCCCT (2x1) - (Dry Cooling) 25% 130 0 $1,793 0.00059 0.0110 0.255 118 Not available till 2008 Dry CCCT Duct Firing (2x1) 25% 20 0 $0 0.00059 0.0110 0.255 118 Only Available with CCCT
Greenfield SCCT Aero 25% 10 30 $73 0.00060 0.0181 0.255 118 Based on East numbers adjusted by elevation factorIntercooled Aero SCCT 25% 10 30 $73 0.00059 0.0110 0.255 118 Not available till 2008 - Capital increased 15% (1 Unit vs 4 Unit comparison)
Greenfield SCCT Frame (2-7FA) 25% 25 60 $897 0.00060 0.0323 0.255 118 Based on East numbers adjusted by elevation factorGreenfield Internal Combustion Engines 50% 10 10 $700 0.00060 0.0200 0.255 118Greenfield CCCT 2x1 - (Wet Cooling) 25% 130 0 $897 0.00060 0.0110 0.255 118 Longer Permit Time for Wet - Use West Side Dry Fixed O&M
Greenfield CCCT Duct Firing 2x1 - (Wet Cooling) 25% 20 0 $0 0.00060 0.0110 0.255 118 Longer Permit Time for Wet - Use Gadsby Repower Dry Fixed O&MGreenfield CCCT 2x1 - (Dry Cooling) 25% 130 0 $897 0.00060 0.0110 0.255 118 Based on Utah numbers adj. elev. factor
Greenfield CCCT Duct Firing 2x1 - (Dry Cooling) 25% 20 0 $0 0.00060 0.0110 0.255 118 Based on Utah numbers adj. elev. factorGreenfield SCCT Aero 25% 60 30 $73 0.00060 0.0181 0.255 118 Based on East numbers adjusted by elevation factorIntercooled Aero SCCT 25% 10 30 $73 0.00059 0.0110 0.255 118 Not available till 2008 - Capital increased 15% (1 Unit vs 4 Unit comparison)
Greenfield SCCT Frame 25% 25 60 $897 0.00060 0.0323 0.255 118 Based on East numbers adjusted by elevation factorGreenfield Internal Combustion Engines 50% 10 10 $700 0.00060 0.0200 0.255 118Greenfield CCCT 2x1 - (Wet Cooling) 25% 0 30 $897 0.00060 0.0110 0.255 118 Longer Permit Time for Wet - Use West Side Dry Fixed O&M
Greenfield CCCT Duct Firing 2x1 - (Wet Cooling) 25% 0 10 $0 0.00060 0.0110 0.255 118 Longer Permit Time for Wet - Use Gadsby Repower Dry Fixed O&MGreenfield CCCT 2x1 - (Dry Cooling) 25% 0 60 $897 0.00060 0.0110 0.255 118 Based on Utah numbers adjusted by elevation factor
Greenfield CCCT Duct Firing 2x1 - (Dry Cooling) 25% 0 0 $0 0.00060 0.0110 0.255 118 Based on Utah numbers adjusted by elevation factorOther - Renewables
East Side Wind (34.5% CF) 5% 10 0 $0 0.00000 0.0000 0.000 0 Based on 2004 Renewables RFP average responsesWest Side Wind (33.5% CF) 5% 10 0 $0 0.00000 0.0000 0.000 0 Based on 2004 Renewables RFP average responses
East Side Geothermal 25% 60 240 n/a 0.00000 0.0000 0.000 0 Based on RFP Responses (assume fixed O&M includes steam charge)West Side Geothermal 25% 60 240 n/a 0.00000 0.0000 0.000 0 Based on RFP Responses (assume fixed O&M includes steam charge)
StoragePumped Storage 20% 15 480 $0 0.10000 0.4000 3.000 204 Capacity Factor limited to 17% - cost based on system average coal
Compressed Air Energy Storage (CAES) 20% 15 480 $897 0.00059 0.0110 0.255 118 Heat rate for CT = 4,330 Btu/kWh / 0.765 kWh power needed for each kWhCompressed Air Energy Storage (CAES) 20% 15 480 $897 0.00060 0.0181 0.255 118 Heat rate for CT = 4,330 Btu/kWh / 0.765 kWh power needed for each kWhCompressed Air Energy Storage (CAES) 20% 15 480 $897 0.00060 0.0181 0.255 118 Heat rate for CT = 4,330 Btu/kWh / 0.765 kWh power needed for each kWh
Distributed GenerationCHP 0% 120 480 N/A 0.00147 0.0870 0.255 118 CHP information from two sources:CHP 0% 120 480 N/A 0.00147 0.0850 0.255 118 (1) "Gas-Fired Distributed Energy Resource Technolygy Characterization,"CHP 0% 120 480 N/A 0.00147 0.0900 0.255 118 NREL, November, 2003CHP 0% 120 480 N/A 0.00147 0.0870 0.255 118 (2) 2003 IRP assumptions if no updated information from NRELCHP 0% 120 480 N/A 0.00147 0.0870 0.255 118 East units adjusted for altitude: 5% from sea level to 1,500 ft. andCHP 0% 120 480 N/A 0.00147 0.0850 0.255 118 12% for 1,500 ft. to East elevations.CHP 0% 120 480 N/A 0.00147 0.0900 0.255 118CHP 0% 120 480 N/A 0.00147 0.0870 0.255 118
Microturbines 25% 5 240 $0.54 0.00147 0.0338 0.255 118 Microturbine information from two sources:Microturbines 25% 5 240 $0.54 0.00147 0.0338 0.255 118 (1) "Gas-Fired Distributed Energy Resource Technolygy Characterization,"Microturbines 25% 5 240 $0.54 0.00147 0.0338 0.255 118 NREL, November, 2003 (2) 2003 IRP
Fuel Cells 25% 30 240 $6.00 0.00000 0.0070 0.000 118Fuel Cells 25% 30 240 $6.00 0.00000 0.0070 0.000 118Fuel Cells 25% 30 240 $6.00 0.00000 0.0070 0.000 118
Solar 25% 60 720 $0.00 0.00000 0.0000 0.000 0 Data sources: NWPPC, ETO, Sanida Nationa LabsDemand Side (Class 1 Load Control)
Res./Small Comm'l Air Conditioner Control 0% 10 n/a $0.00 0.00000 0.00000 0.00000 0.00000 100 hours per year maximum use, 6 hours per 24 hour period, June-Sept.Electric Space/Water Heat Control 0% 10 n/a $0.00 0.00000 0.00000 0.00000 0.00000 100 hours per year maximum use, 6 hours per 24 hour period, Dec-Feb
Commercial Lighting Control 0% 10 n/a $0.00 0.00000 0.00000 0.00000 0.00000 100 hours per year maximum use, 6 hours per 24 hour period, all monthsCommercial Cooling Control 0% 10 n/a $0.00 0.00000 0.00000 0.00000 0.00000 100 hours per year maximum use, 6 hours per 24 hour period, June-Sept.
Irrigation Control 0% 10 n/a $0.00 0.00000 0.00000 0.00000 0.00000 4 days per week, 6 hours/day, June-mid-Sept.
Emissions
Page 2 of 2