ELECTRA IRP ELECTRA/EriGrid Workshop · ELECTRA IRP ELECTRA/EriGrid Workshop 06 September 2016,...
13
ELECTRA IRP ELECTRA/EriGrid Workshop 06 September 2016, Kassel Henrik Bindner, Mattia Marinelli and With input from WP8 participants Future decision support systems – in view of WoC concept www.ElectraIRP.eu The research leading to these results has received funding from the European Union Seventh Framework Programme (FP7/2007- 2013) under grant agreement n° 609687
Transcript of ELECTRA IRP ELECTRA/EriGrid Workshop · ELECTRA IRP ELECTRA/EriGrid Workshop 06 September 2016,...
ELECTRA IRP ELECTRA/EriGrid Workshop
06 September 2016, Kassel
Henrik Bindner, Mattia Marinelli
and
With input from WP8 participants
Future decision support systems –
in view of WoC concept
www.ElectraIRP.eu
The research leading to these results has
received funding from the European Union
Seventh Framework Programme (FP7/2007-
2013) under grant agreement n° 609687
2 ELECTRA/EriGrid workshop
06 September 2017, Kassel
Content
I. Demonstration of visualisation techniques
II. Decision support system
III. Conclusion
3 ELECTRA/EriGrid workshop
06 September 2017, Kassel
Control rooms and the Web-of-Cells
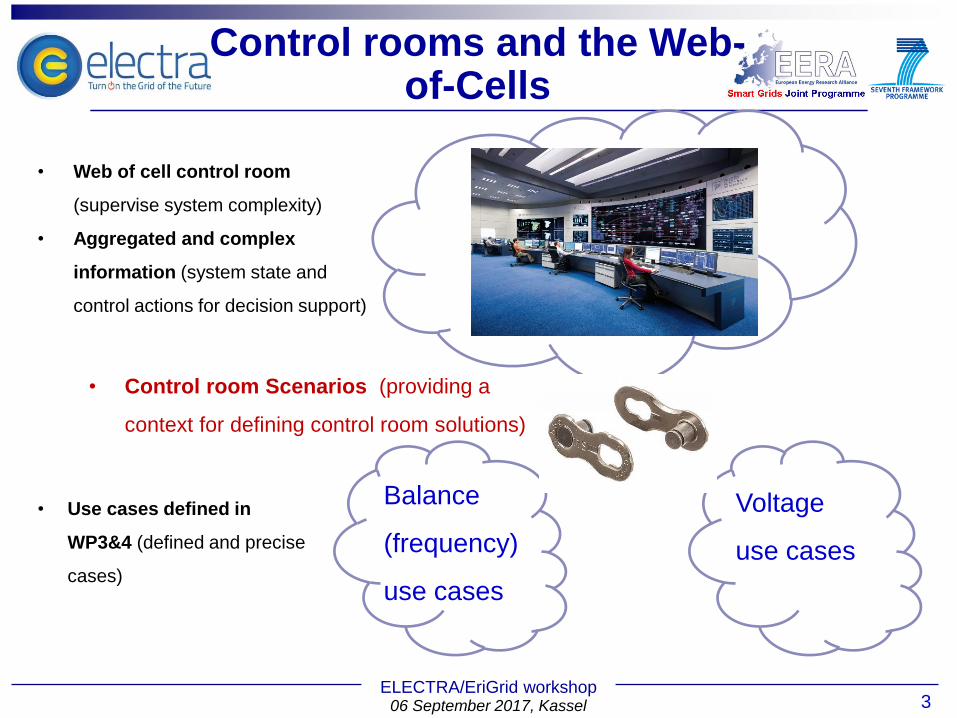
• Web of cell control room
(supervise system complexity)
• Aggregated and complex
information (system state and
control actions for decision support)
• Use cases defined in
WP3&4 (defined and precise
cases)
Balance
(frequency)
use cases
Voltage
use cases
• Control room Scenarios (providing a
context for defining control room solutions)
4 ELECTRA/EriGrid workshop
06 September 2017, Kassel
Methodology adopted
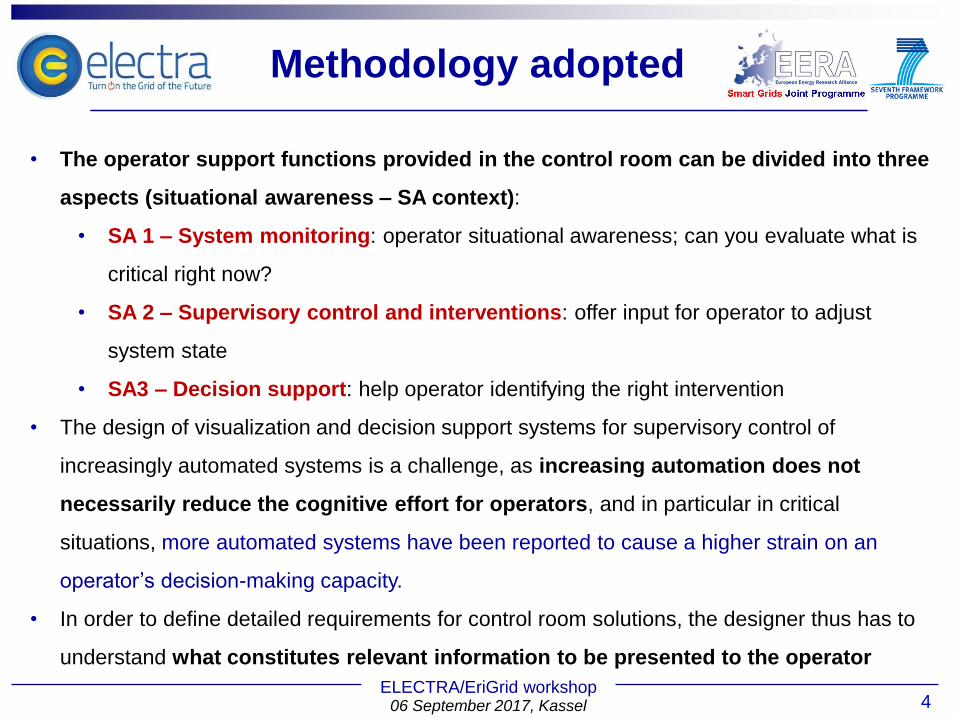
• The operator support functions provided in the control room can be divided into three
aspects (situational awareness – SA context):
• SA 1 – System monitoring: operator situational awareness; can you evaluate what is
critical right now?
• SA 2 – Supervisory control and interventions: offer input for operator to adjust
system state
• SA3 – Decision support: help operator identifying the right intervention
• The design of visualization and decision support systems for supervisory control of
increasingly automated systems is a challenge, as increasing automation does not
necessarily reduce the cognitive effort for operators, and in particular in critical
situations, more automated systems have been reported to cause a higher strain on an
operator’s decision-making capacity.
• In order to define detailed requirements for control room solutions, the designer thus has to
understand what constitutes relevant information to be presented to the operator
5 ELECTRA/EriGrid workshop
06 September 2017, Kassel
Visualization strategy
• This grid visualisation, as developed within this WP, is a dynamically built graph
containing information and elements relevant to the selected perspective on the
system.
• New perspectives can be opened with a click, such as:
• Inter-cell view: This is the top-level view on the network that shows cells and tie-lines
running between them.
• Intra-cell view: Shows buses and lines within a cell, as well as the tie-lines and
corresponding neighbouring cells.
• Local view: Here, the devices and lines connected to one bus along with its associated
cell are presented to the operator.
• Global physical view: The buses and lines of the entire grid are shown as a graph
6 ELECTRA/EriGrid workshop
06 September 2017, Kassel
Visualization strategy - PNDC
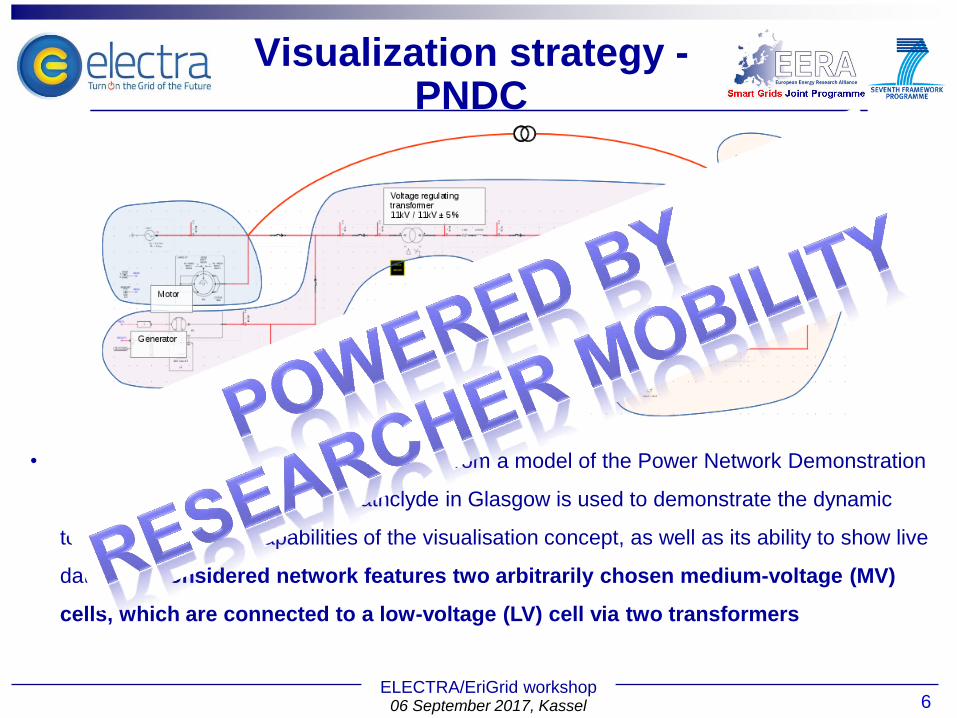
• In the first case, simulated data obtained from a model of the Power Network Demonstration
Centre (PNDC) at University Strathclyde in Glasgow is used to demonstrate the dynamic
topology generation capabilities of the visualisation concept, as well as its ability to show live
data. The considered network features two arbitrarily chosen medium-voltage (MV)
cells, which are connected to a low-voltage (LV) cell via two transformers
7 ELECTRA/EriGrid workshop
06 September 2017, Kassel
Visualization strategy - PNDC
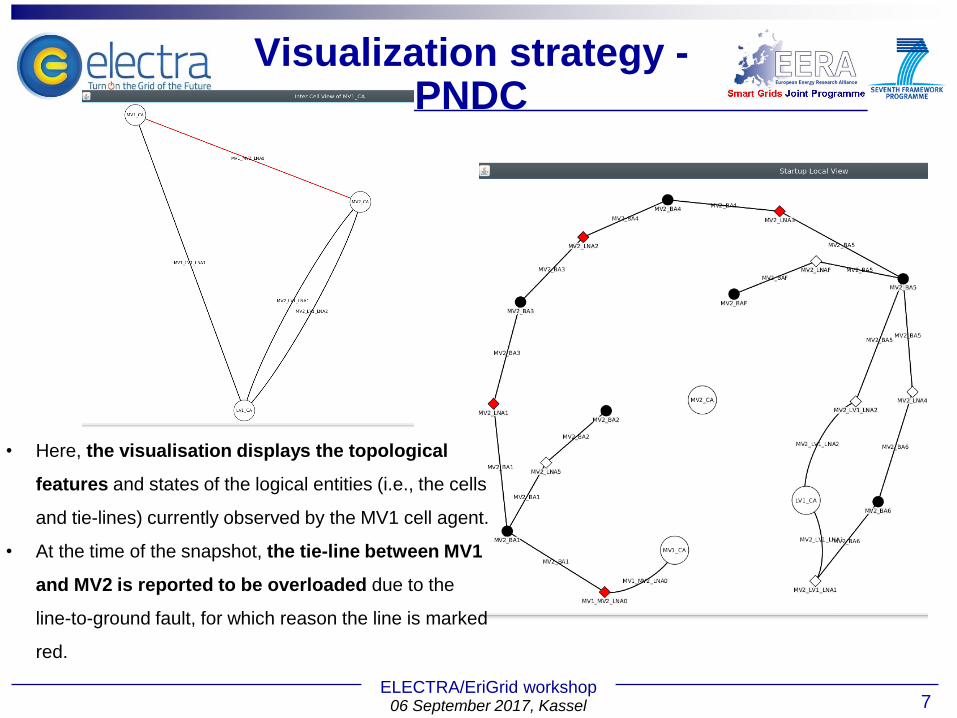
• Here, the visualisation displays the topological
features and states of the logical entities (i.e., the cells
and tie-lines) currently observed by the MV1 cell agent.
• At the time of the snapshot, the tie-line between MV1
and MV2 is reported to be overloaded due to the
line-to-ground fault, for which reason the line is marked
red.
8 ELECTRA/EriGrid workshop
06 September 2017, Kassel
Visualization strategy - SYSLAB
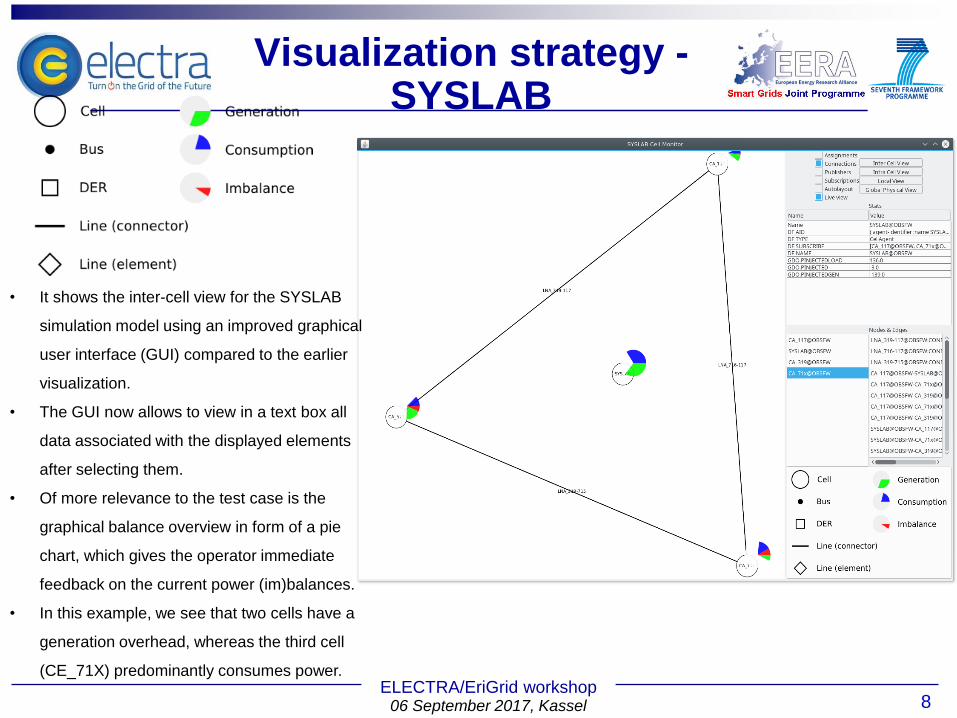
• It shows the inter-cell view for the SYSLAB
simulation model using an improved graphical
user interface (GUI) compared to the earlier
visualization.
• The GUI now allows to view in a text box all
data associated with the displayed elements
after selecting them.
• Of more relevance to the test case is the
graphical balance overview in form of a pie
chart, which gives the operator immediate
feedback on the current power (im)balances.
• In this example, we see that two cells have a
generation overhead, whereas the third cell
(CE_71X) predominantly consumes power.
9 ELECTRA/EriGrid workshop
06 September 2017, Kassel
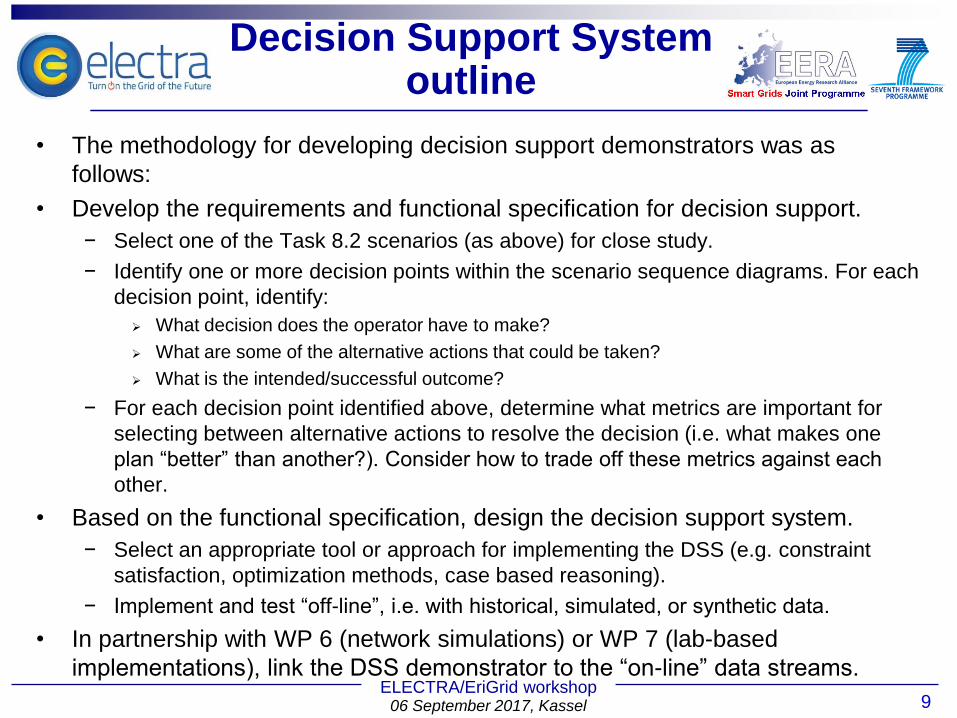
Decision Support System outline
• The methodology for developing decision support demonstrators was as
follows:
• Develop the requirements and functional specification for decision support.
− Select one of the Task 8.2 scenarios (as above) for close study.
− Identify one or more decision points within the scenario sequence diagrams. For each
decision point, identify:
What decision does the operator have to make?
What are some of the alternative actions that could be taken?
What is the intended/successful outcome?
− For each decision point identified above, determine what metrics are important for
selecting between alternative actions to resolve the decision (i.e. what makes one
plan “better” than another?). Consider how to trade off these metrics against each
other.
• Based on the functional specification, design the decision support system.
− Select an appropriate tool or approach for implementing the DSS (e.g. constraint
satisfaction, optimization methods, case based reasoning).
− Implement and test “off-line”, i.e. with historical, simulated, or synthetic data.
• In partnership with WP 6 (network simulations) or WP 7 (lab-based
implementations), link the DSS demonstrator to the “on-line” data streams.
10 ELECTRA/EriGrid workshop
06 September 2017, Kassel
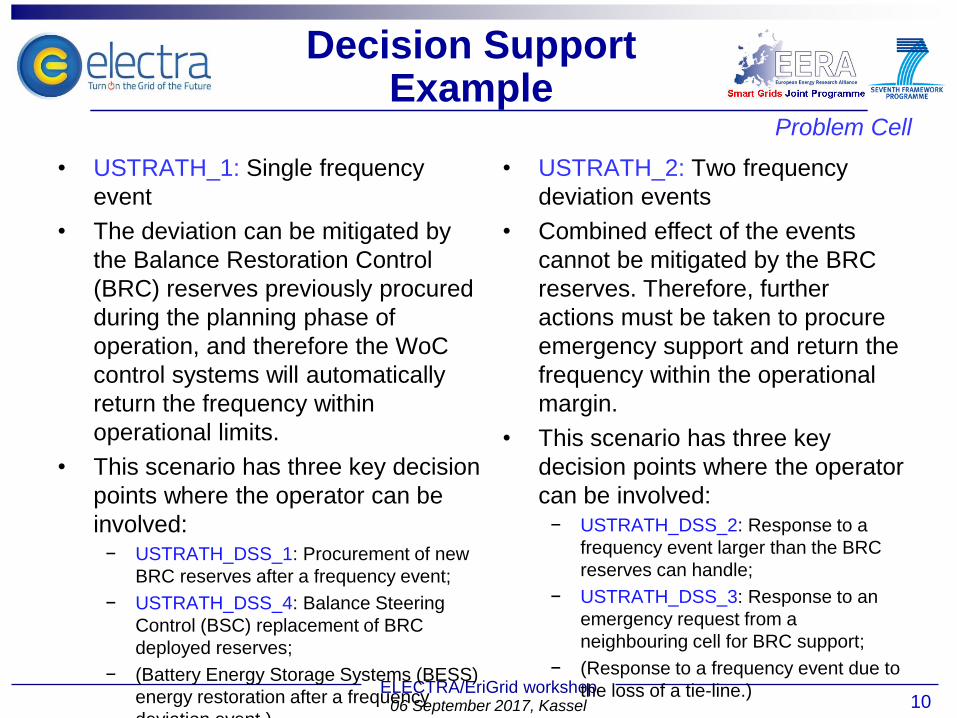
• USTRATH_1: Single frequency
event
• The deviation can be mitigated by
the Balance Restoration Control
(BRC) reserves previously procured
during the planning phase of
operation, and therefore the WoC
control systems will automatically
return the frequency within
operational limits.
• This scenario has three key decision
points where the operator can be
involved: − USTRATH_DSS_1: Procurement of new
BRC reserves after a frequency event;
− USTRATH_DSS_4: Balance Steering
Control (BSC) replacement of BRC
deployed reserves;
− (Battery Energy Storage Systems (BESS)
energy restoration after a frequency
deviation event.)
Problem Cell
Decision Support Example
• USTRATH_2: Two frequency
deviation events
• Combined effect of the events
cannot be mitigated by the BRC
reserves. Therefore, further
actions must be taken to procure
emergency support and return the
frequency within the operational
margin.
• This scenario has three key
decision points where the operator
can be involved: − USTRATH_DSS_2: Response to a
frequency event larger than the BRC
reserves can handle;
− USTRATH_DSS_3: Response to an
emergency request from a
neighbouring cell for BRC support;
− (Response to a frequency event due to
the loss of a tie-line.)
11 ELECTRA/EriGrid workshop
06 September 2017, Kassel
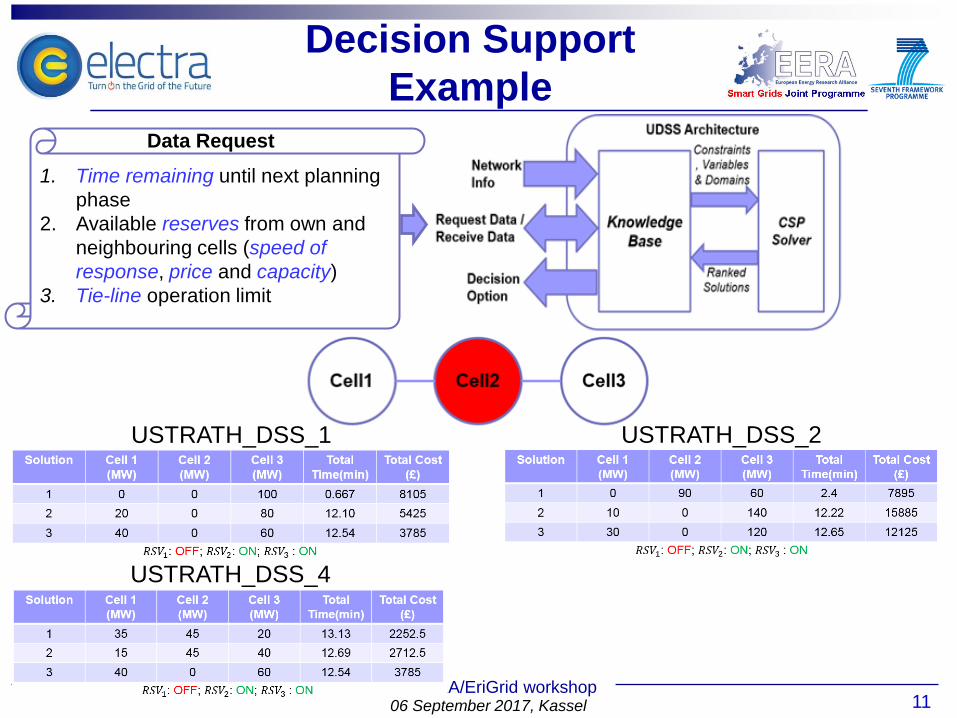
1. Time remaining until next planning
phase
2. Available reserves from own and
neighbouring cells (speed of
response, price and capacity)
3. Tie-line operation limit
Data Request
Decision Support
Example
USTRATH_DSS_1
USTRATH_DSS_4
USTRATH_DSS_2
12 ELECTRA/EriGrid workshop
06 September 2017, Kassel
Conclusion
• A number of control room scenarios based on WoC use cases he been defined
• The operator support functions provided in the control room have been divided
into three aspects: − System monitoring: operator situational awareness; evaluation of what is critical right now
− Supervisory control and interventions: offer input for operators to adjust system state
− Decision support: help operators identifying the right intervention
• The new functionality and operational needs of the WoC concept leads to new
visualisations and decision support systems
• The new visualisations communicates to the operator the state of the cells as
well as the inter-cell states and highlights deviations from schedules and critical
situations as defined by the balance requirements and control functions
• A number of cases for decision support has been specified from the control
room cases and decision points have been identified
• A decision support system with common base for handling different operational
situations have been developed and it has been illustrated how this system
provides different recommendations depending on the situation
13
CONTACT
INFORMATION
Henrik W. Bindner
ELECTRA IRP website link: www.ElectraIRP.eu
ELECTRA/EriGrid workshop 06 September 2017, Kassel