Ironmaking Alternatives Screening - Energy
154
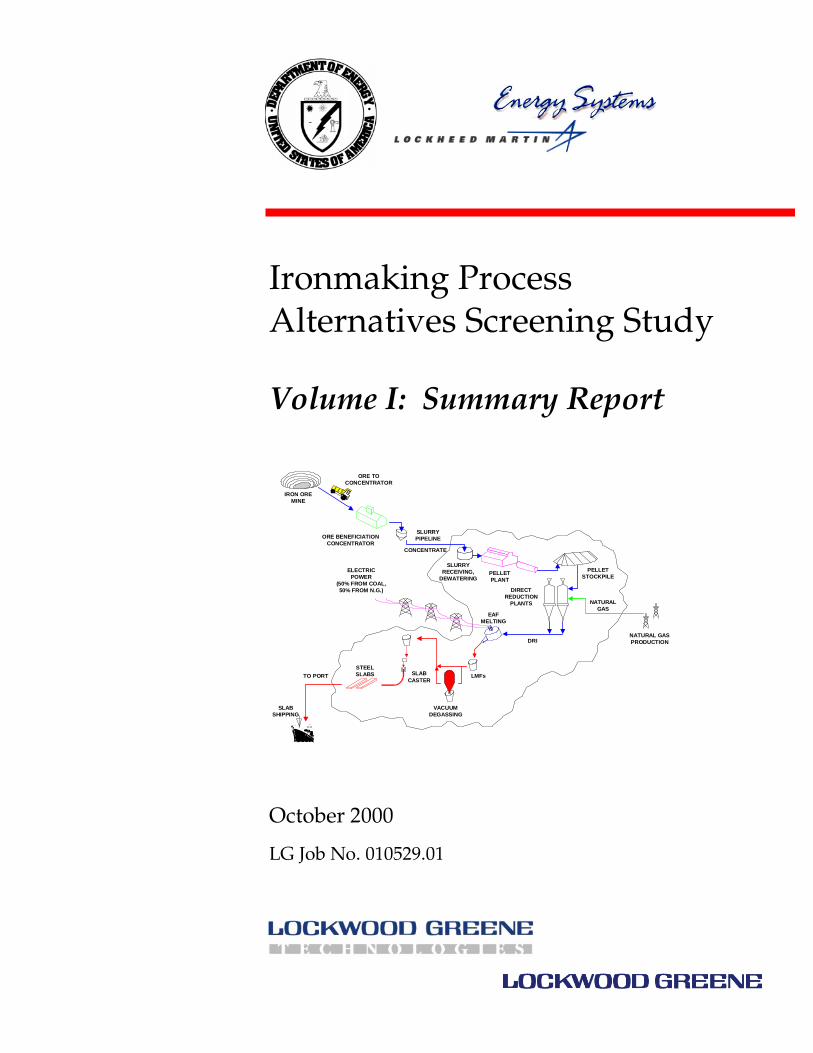
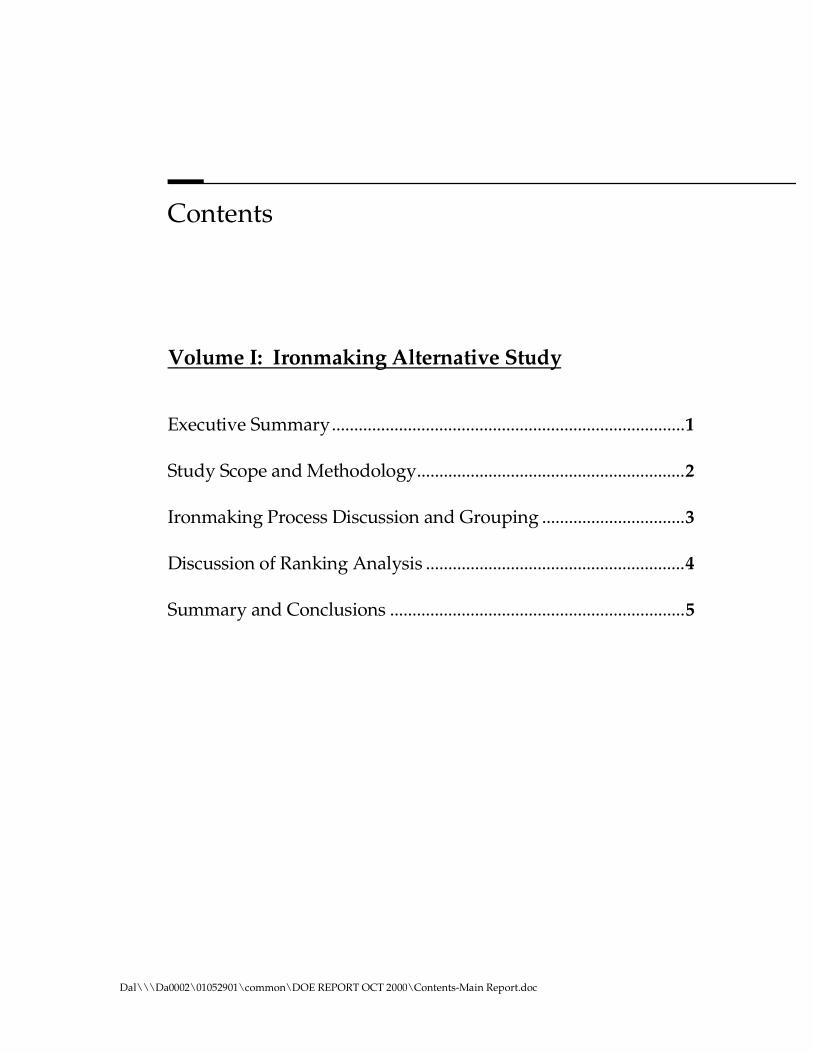
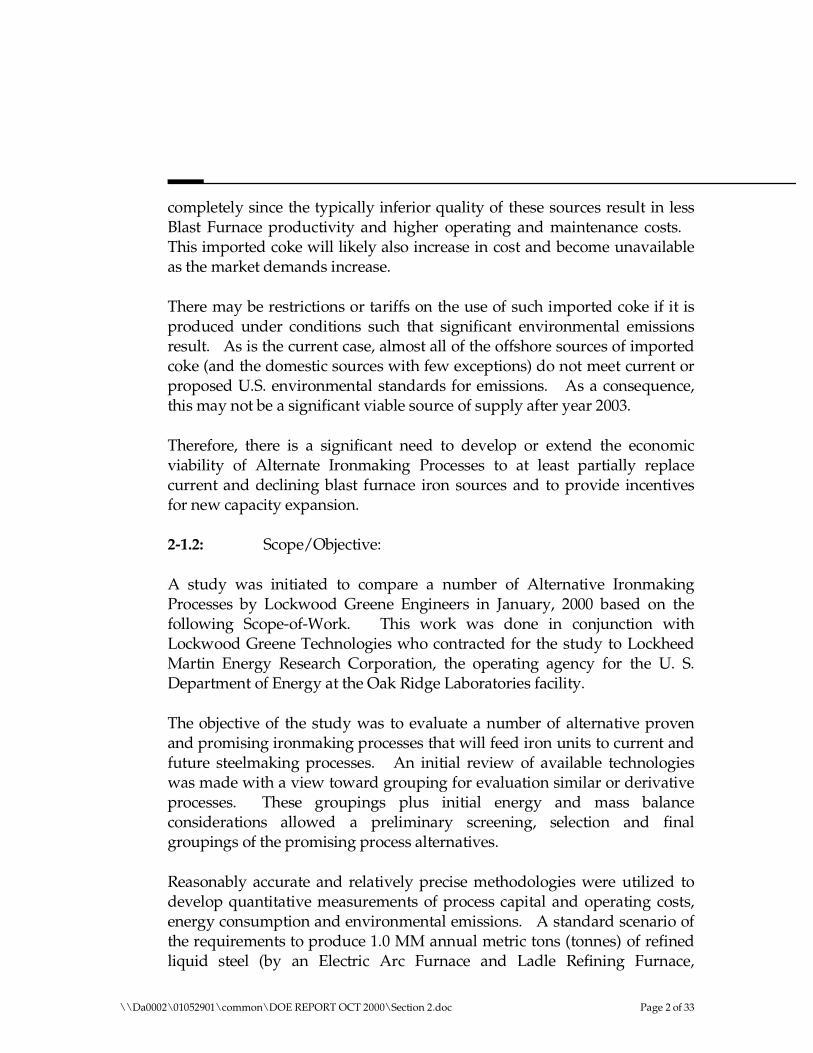
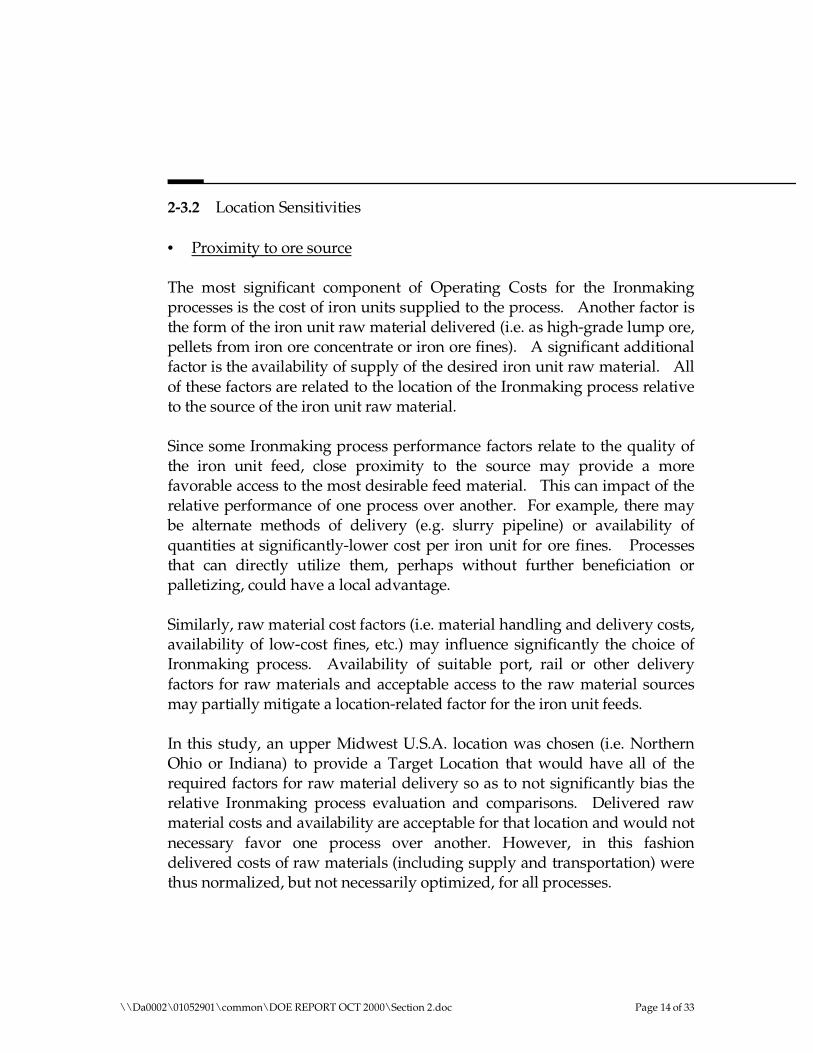
Ironmaking Process Alternatives Screening Study Volume I: Summary Report SLURRY PIPELINE CONCENTRATE SLAB SHIPPING IRON ORE MINE ORE BENEFICIATION CONCENTRATOR SLURRY RECEIVING, DEWATERING PELLET PLANT NATURAL GAS NATURAL GAS PRODUCTION DIRECT REDUCTION PLANTS PELLET STOCKPILE DRI EAF MELTING ELECTRIC POWER (50% FROM COAL, 50% FROM N.G.) SLAB CASTER LMFs STEEL SLABS ORE TO CONCENTRATOR TO PORT VACUUM DEGASSING October 2000 LG Job No. 010529.01
Transcript of Ironmaking Alternatives Screening - Energy
Ironmaking Process Alternatives Screening Study
Volume I: Summary Report
SLURRY PIPELINE
CONCENTRATE
SLAB SHIPPING
IRON ORE MINE
ORE BENEFICIATION CONCENTRATOR
SLURRY RECEIVING,
DEWATERING PELLET PLANT
NATURAL GAS
NATURAL GAS PRODUCTION
DIRECT REDUCTION
PLANTS
PELLET STOCKPILE
DRI
EAF MELTING
ELECTRIC POWER
(50% FROM COAL, 50% FROM N.G.)
SLAB CASTER
LMFs
STEEL SLABS
ORE TO CONCENTRATOR
TO PORT
VACUUM DEGASSING
October 2000
LG Job No. 010529.01

DISCLAIMER
This report was prepared as an account of work sponsored by an agency of the United States Government. Neither the United States Government nor any agency thereof, nor any of their employees, makes any warranty, expressed or implied, or assumes any legal liability or responsibility for the accuracy, completeness, or usefulness of any information, apparatus, product, or process disclosed, or represents that its use would not infringe privately owned rights. Reference herein to any specific commercial product, process, or service by trade name, trademark, manufacturer, or otherwise does not necessarily constitute or imply its endorsement, recommendation, or favoring by the United States Government or any agency thereof. The views and opinions of authors expressed herein do not necessarily state or reflect those of the United States Government or any agency thereof.
Contents
Volume I: Ironmaking Alternative Study
Executive Summary...............................................................................1
Study Scope and Methodology............................................................2
Ironmaking Process Discussion and Grouping ................................3
Discussion of Ranking Analysis ..........................................................4
Summary and Conclusions ..................................................................5
Dal\\\Da0002\01052901\common\DOE REPORT OCT 2000\Contents-Main Report.doc
Report Outline
Section 1: Executive Summary
1-1: General Discussion
1-2: Summary Conclusions
Section 2: Study Scope and Methodology
2-1: Study Scope
2-1.1 Introduction
2-1.2 Scope/Objective
2-2: Methodology and Approach
2-2.1: Introduction to the MetSim Process Simulator
2-2.2: Simulation Models of Ironmaking Processes
2-2.3: Spreadsheet Mass Balances of Process Components
2-2.4: Spreadsheet Mass Balances of Ironmaking Processes
2-3: Base Process Location
2-3.1: Base Location Assumptions
2-3.2: Location Sensitivities
2-4: Process Capital (CAPEX) and Operating Cost (OPEX) Estimates
2-4.1 Process Capital Costs (CAPEX)
2-4.2 Process Operating Costs (OPEX)
\\Da0002\01052901\common\DOE REPORT OCT 2000\Report Outline.doc Page 1 of 4
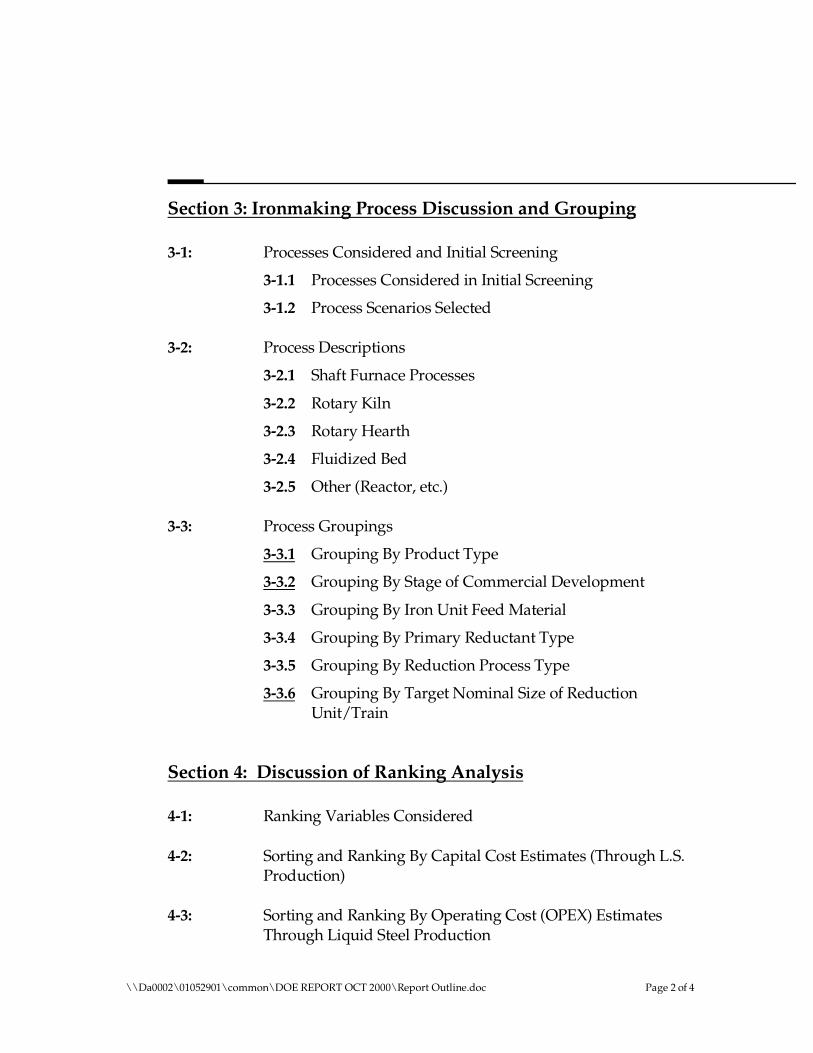
Section 3: Ironmaking Process Discussion and Grouping
3-1: Processes Considered and Initial Screening
3-1.1 Processes Considered in Initial Screening
3-1.2 Process Scenarios Selected
3-2: Process Descriptions
3-2.1 Shaft Furnace Processes
3-2.2 Rotary Kiln
3-2.3 Rotary Hearth
3-2.4 Fluidized Bed
3-2.5 Other (Reactor, etc.)
3-3: Process Groupings
3-3.1 Grouping By Product Type
3-3.2 Grouping By Stage of Commercial Development
3-3.3 Grouping By Iron Unit Feed Material
3-3.4 Grouping By Primary Reductant Type
3-3.5 Grouping By Reduction Process Type
3-3.6 Grouping By Target Nominal Size of Reduction Unit/Train
Section 4: Discussion of Ranking Analysis
4-1: Ranking Variables Considered
4-2: Sorting and Ranking By Capital Cost Estimates (Through L.S. Production)
4-3: Sorting and Ranking By Operating Cost (OPEX) Estimates Through Liquid Steel Production
\\Da0002\01052901\common\DOE REPORT OCT 2000\Report Outline.doc Page 2 of 4
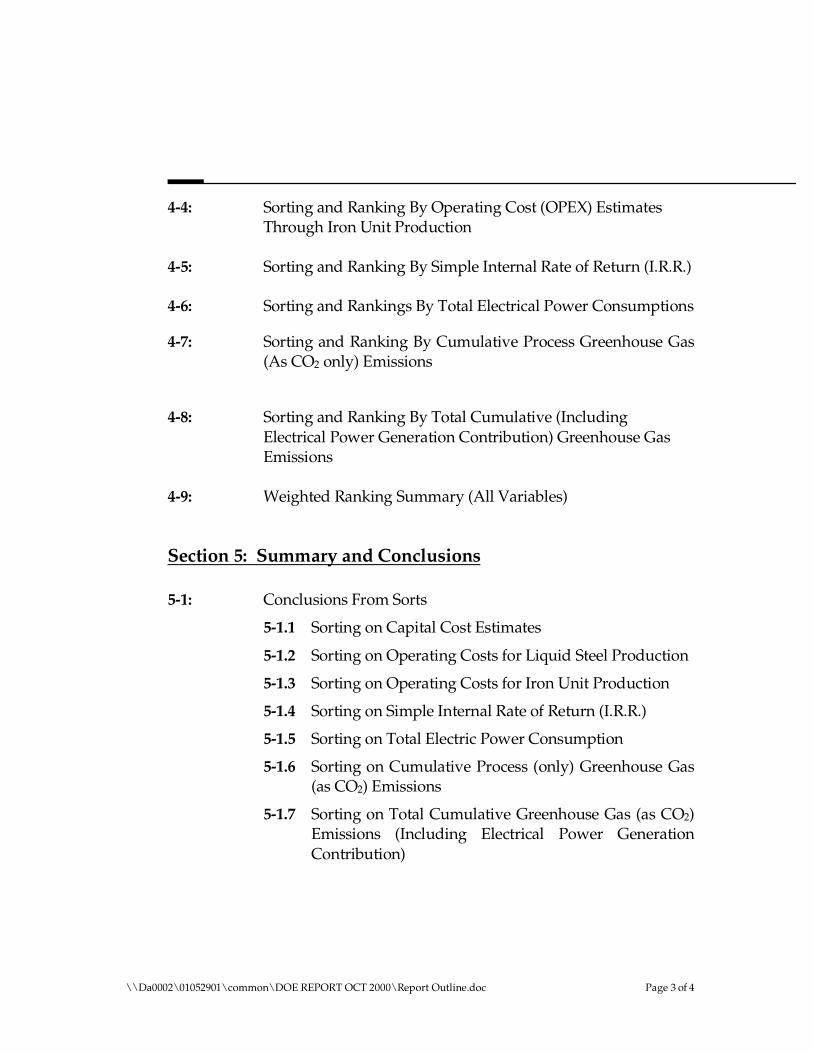
4-4: Sorting and Ranking By Operating Cost (OPEX) Estimates Through Iron Unit Production
4-5: Sorting and Ranking By Simple Internal Rate of Return (I.R.R.)
4-6: Sorting and Rankings By Total Electrical Power Consumptions
4-7: Sorting and Ranking By Cumulative Process Greenhouse Gas (As CO2 only) Emissions
4-8: Sorting and Ranking By Total Cumulative (Including Electrical Power Generation Contribution) Greenhouse Gas Emissions
4-9: Weighted Ranking Summary (All Variables)
Section 5: Summary and Conclusions
5-1: Conclusions From Sorts
5-1.1 Sorting on Capital Cost Estimates
5-1.2 Sorting on Operating Costs for Liquid Steel Production
5-1.3 Sorting on Operating Costs for Iron Unit Production
5-1.4 Sorting on Simple Internal Rate of Return (I.R.R.)
5-1.5 Sorting on Total Electric Power Consumption
5-1.6 Sorting on Cumulative Process (only) Greenhouse Gas (as CO2) Emissions
5-1.7 Sorting on Total Cumulative Greenhouse Gas (as CO2) Emissions (Including Electrical Power Generation Contribution)
\\Da0002\01052901\common\DOE REPORT OCT 2000\Report Outline.doc Page 3 of 4
5-2: Conclusions From Ranking Sorts
5-2.1 Ranking Sort on Economic Variables (1-4)
5-2.2 Ranking Sort on Energy and Environmental Variables (5-7)
5-2.3 Ranking Sort on All Variables (1-7)
5-3: General Conclusions From Sorting and Ranking Sums
\\Da0002\01052901\common\DOE REPORT OCT 2000\Report Outline.doc Page 4 of 4
Section 1: Executive Summary
1-1: General Discussion
Iron in the United States is largely produced from iron ore mined in the United States or imported from Canada or South America. The iron ore is typically smelted in Blast Furnaces that use primarily iron ore, iron concentrate pellets metallurgical coke, limestone and lime as the raw materials. Under current operating scenarios, the iron produced from these Blast Furnaces is relatively inexpensive as compared to current alternative iron sources, e.g. direct iron reduction, imported pig iron, etc.
The primary problem the Blast Furnace Ironmaking approach is that many of these Blast furnaces are relatively small, as compared to the newer, larger Blast Furnaces; thus are relatively costly and inefficient to operate. An additional problem is also that supplies of high-grade metallurgical grade coke are becoming increasingly in short supply and costs are also increasing. In part this is due to the short supply and costs of high-grade metallurgical coals, but also this is due to the increasing necessity for environmental controls for coke production.
After year 2003 new regulations for coke product environmental requirement will likely be promulgated. It is likely that this also will either increase the cost of high-quality coke production or will reduce the available domestic U.S. supply. Therefore, iron production in the United States utilizing the current, predominant Blast Furnace process will be more costly and would likely be curtailed due to a coke shortage.
Therefore, there is a significant need to develop or extend the economic viability of Alternate Ironmaking Processes to at least partially replace current and declining blast furnace iron sources and to provide incentives for new capacity expansion.
\\Da0002\01052901\common\DOE REPORT OCT 2000\Section 1.doc Page 1 of 7
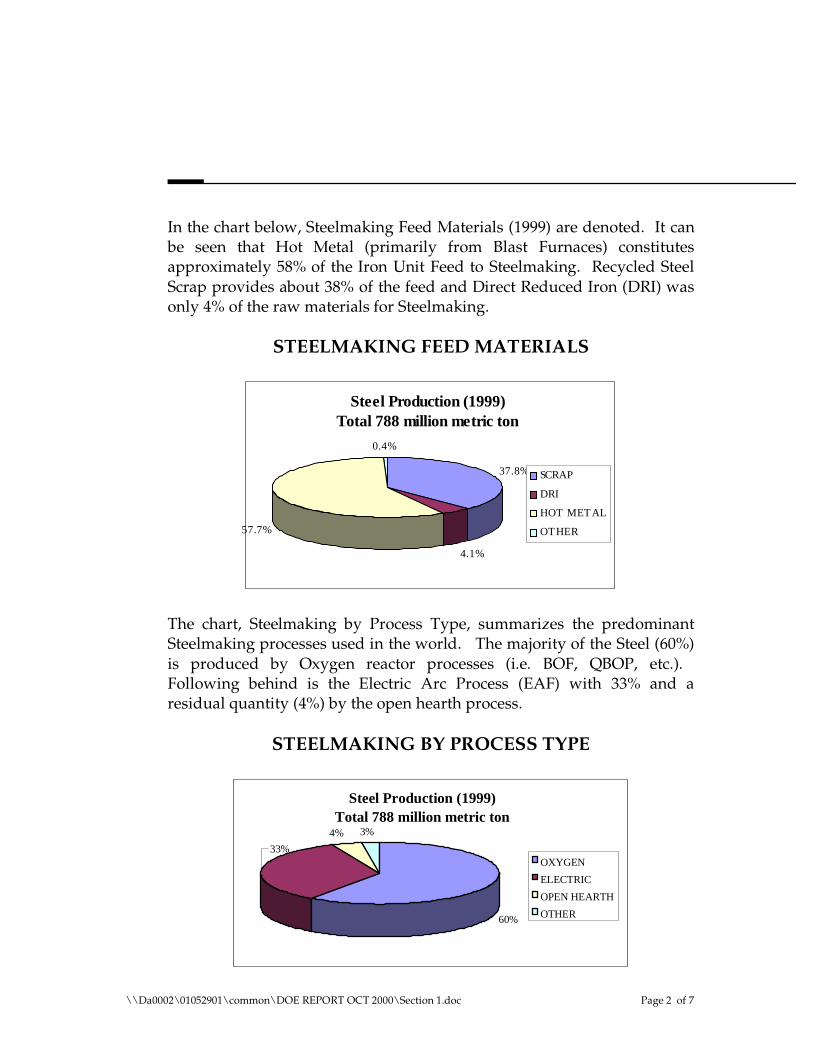
In the chart below, Steelmaking Feed Materials (1999) are denoted. It can be seen that Hot Metal (primarily from Blast Furnaces) constitutes approximately 58% of the Iron Unit Feed to Steelmaking. Recycled Steel Scrap provides about 38% of the feed and Direct Reduced Iron (DRI) was only 4% of the raw materials for Steelmaking.
STEELMAKING FEED MATERIALS
Steel Production (1999) Total 788 million metric ton
4.1%
37.8%
57.7%
0.4%
SCRAP
DRI
HOT MET AL
OT HER
The chart, Steelmaking by Process Type, summarizes the predominant Steelmaking processes used in the world. The majority of the Steel (60%) is produced by Oxygen reactor processes (i.e. BOF, QBOP, etc.). Following behind is the Electric Arc Process (EAF) with 33% and a residual quantity (4%) by the open hearth process.
STEELMAKING BY PROCESS TYPE
Steel Production (1999) Total 788 mill ion metr ic ton
60%
4% 3%
33% OXYGEN
ELECTRIC
OPEN HEARTH
OTHER
\\Da0002\01052901\common\DOE REPORT OCT 2000\Section 1.doc Page 2 of 7
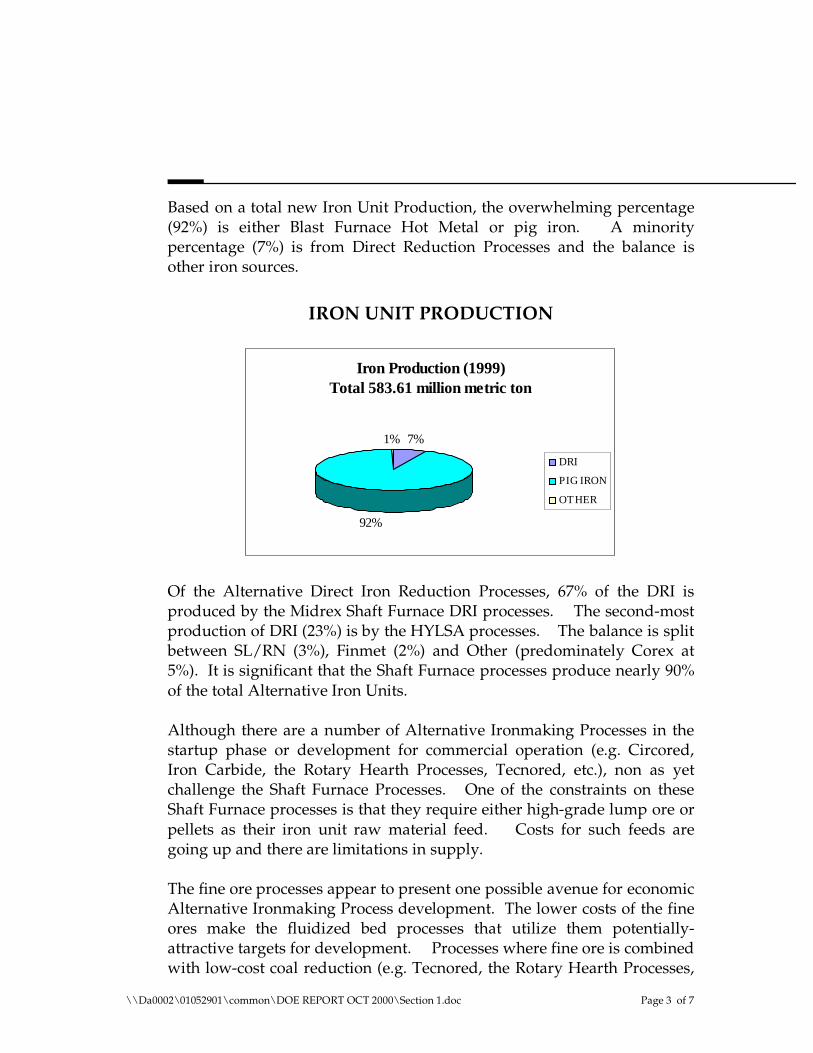
Based on a total new Iron Unit Production, the overwhelming percentage (92%) is either Blast Furnace Hot Metal or pig iron. A minority percentage (7%) is from Direct Reduction Processes and the balance is other iron sources.
IRON UNIT PRODUCTION
Iron Production (1999) Total 583.61 million metric ton
7%
92%
1%
DRI
PIG IRON
OT HER
Of the Alternative Direct Iron Reduction Processes, 67% of the DRI is produced by the Midrex Shaft Furnace DRI processes. The second-most production of DRI (23%) is by the HYLSA processes. The balance is split between SL/RN (3%), Finmet (2%) and Other (predominately Corex at 5%). It is significant that the Shaft Furnace processes produce nearly 90% of the total Alternative Iron Units.
Although there are a number of Alternative Ironmaking Processes in the startup phase or development for commercial operation (e.g. Circored, Iron Carbide, the Rotary Hearth Processes, Tecnored, etc.), non as yet challenge the Shaft Furnace Processes. One of the constraints on these Shaft Furnace processes is that they require either high-grade lump ore or pellets as their iron unit raw material feed. Costs for such feeds are going up and there are limitations in supply.
The fine ore processes appear to present one possible avenue for economic Alternative Ironmaking Process development. The lower costs of the fine ores make the fluidized bed processes that utilize them potentially-attractive targets for development. Processes where fine ore is combined with low-cost coal reduction (e.g. Tecnored, the Rotary Hearth Processes,
\\Da0002\01052901\common\DOE REPORT OCT 2000\Section 1.doc Page 3 of 7
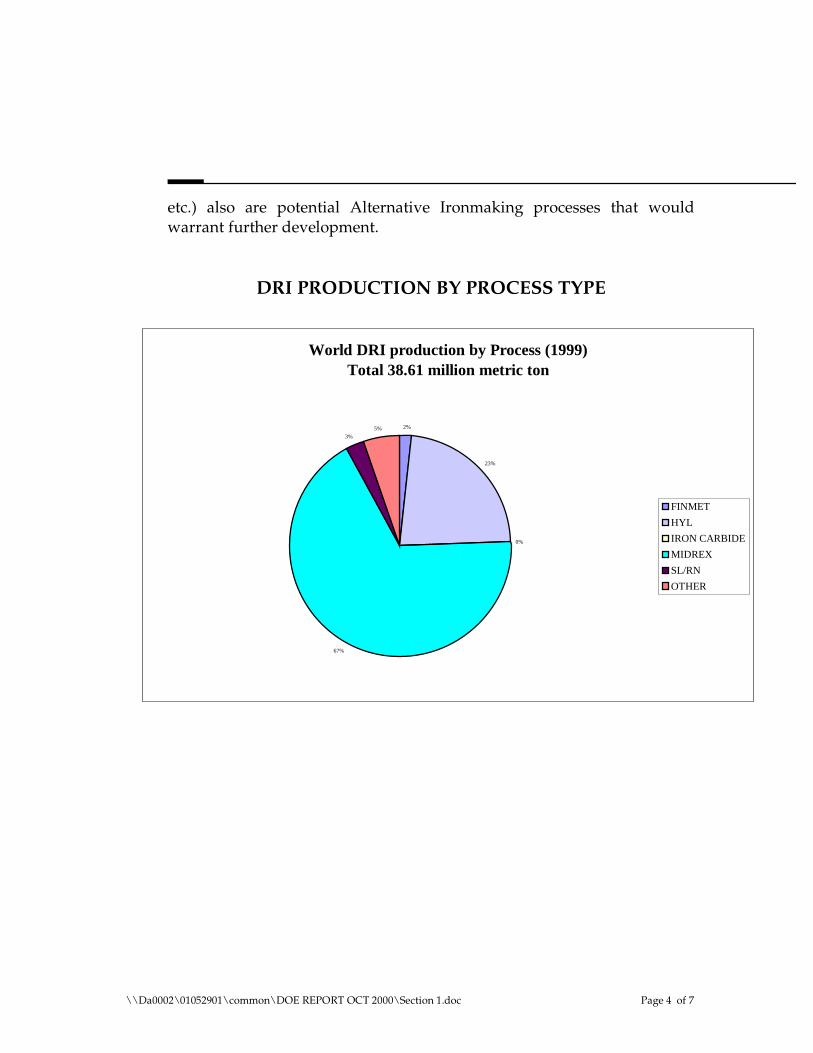
etc.) also are potential Alternative Ironmaking processes that would warrant further development.
DRI PRODUCTION BY PROCESS TYPE
World DRI pr oduction by Process (1999) Total 38.61 million metric ton
2%
23%
0%
67%
3% 5%
FINMET
HYL
IRON CARBIDE
MIDREX
SL/RN
OTHER
\\Da0002\01052901\common\DOE REPORT OCT 2000\Section 1.doc Page 4 of 7
1-2: Summary Conclusions
The primary conclusions of this comparative Study of Alternative Ironmaking Process scenarios are:
• The processes with the best combined economics (CAPEX and OPEX impacts in the I.R.R. calculation) can be grouped into those Fine Ore based processes with no scrap charge and those producing Hot Metal for charge to the EAF.
• A pronounced sensitivity to Steel Scrap Cost was felt less by the Hot Metal Processes and the Fine Ore Processes that typically do not utilize much purchased scrap.
• In terms of evolving processes, the Tecnored Process (and in particular, the lower-operating cost process with integral co-generation of electrical power) was in the most favorable groupings at all scrap cost sensitivities.
• It should be noted also that the Conventional Blast Furnace process utilizing Non-Recovery coke (from a continuous coking process with integral co-generation of electrical power) and the lower-capital cost Mini Blast Furnace also showed favorable Relative Economics for the low and median Scrap Cost sensitivities.
• The lower-cost, more efficient MauMee Rotary Hearth Process that uses a Briquetted Iron Unit Feed (instead of a dried or indurated iron ore pellet) also was in the most favorable process groupings.
Those processes with lower-cost raw materials (i.e. fine ore and/or non-metallurgical coal as the reductant) had favorable combined economics. In addition, the hot metal processes (in part due to the sensible heat impacts in the EAF and due to their inherently lower costs) also had favorable combined economics.
As a group, the Hot Metal processes had lower Total Cumulative Electrical Power Consumption, lower Process Emissions and lower Total Emissions (including Electrical Power generation). These were reflected also in the Ranking Sum Analysis. The exception was the Shaft Furnace DRI process (Midrex) that was in the lower group for the environmental-related variables.
\\Da0002\01052901\common\DOE REPORT OCT 2000\Section 1.doc Page 5 of 7
As an ancillary conclusion of this study, there is significant potential to extend the viable economic life of the existing Blast Furnace Process infrastructure (and perhaps future Mini Blast Furnace) by further developing and exploiting the evolving continuous Non-Recovery Coking processes. Lockwood Greene is aware of several such processes that are being developed. Some have had some pilot plant-scale production and application testing, others are in the planning stages for pilot demonstration.
What these processes have in common are:
• All do not have the environmental burden of producing and disposing of the noxious chemical by-products of the coking process.
• All are energy efficient (mostly autogenous) and produce waste heat that could be utilized directly or to co-generate electrical power.
• Some utilize low-cost alternate and residual carbon sources as well as low-rank coals to produce a formed-coke product. The increasing costs and shortage of high-grade coking coal is mitigated by the use of the plentiful, low-cost alternatives.
• Most of all, due to the complete combustion of the coking by-products and to integral pollution and emission controls, these non-recovery coking processes as a group are much more environmentally acceptable than conventional coking processes.
In this Alternative Ironmaking Process Study, the differences in total emissions between a conventional, co-product coke Blast Furnace and one utilizing the continuous non-recovery coking process (coke substitution only) for these two, otherwise identical, cases indicated that there was approximately a 7% lower total emissions from the Non–Recovery Coke/Blast Furnace process relative to the Conventional Co-Product Coke/Blasé Furnace.
With the inclusion of co-generation that is an integral part of the Continuous Non-Recovery Coke process, there was a 22% reduction in emissions due to total cumulative electrical power related emissions. This kind of environmental difference may provide incentives or constraints to utilize the lower-emitting technologies.
\\Da0002\01052901\common\DOE REPORT OCT 2000\Section 1.doc Page 6 of 7

The evolution of a lower-cost, energy-efficient and environmentally-friendly coke producing process that can utilize common carbon recycle and waste materials as well as abundant low-rank coal as the primary carbon sources will have a significant impact on production of Iron Units.
This alternative may extend the life of the existing Blast Furnace infrastructure and it may present significant options for the adoption of the more-flexible and lower capital cost (per iron unit capacity) Mini Blast Furnace or developing processes such as Tecnored.
\\Da0002\01052901\common\DOE REPORT OCT 2000\Section 1.doc Page 7 of 7
Section 2: Study Scope and Approach
2-1: Study Scope
2-1.1: Introduction:
Iron in the United States is largely produced from iron ore mined in the United States or imported from Canada or South America. The iron ore is typically smelted in Blast Furnaces that use primarily iron ore, metallurgical coke, limestone and lime as the raw materials. Some alternate fuel sources, small percentages supplied by direct coal or natural gas injection, are also utilized in place of the coke. Under current operating scenarios, the iron produced from these Blast Furnaces is relatively inexpensive as compared to current alternative iron sources, e.g. direct iron reduction, imported pig iron, etc.
The primary problem the Blast Furnace Ironmaking approach is that many of these Blast furnaces are relatively small, as compared to the newer, larger Blast Furnaces; thus are relatively costly and inefficient to operate. An additional problem is also that supplies of high-grade metallurgical grade coke are becoming increasingly in short supply and costs are also increasing. In part this is due to the short supply and costs of high-grade metallurgical coals, but also this is due to the increasing necessity for environmental controls for coke production.
Proposed and mandated environmental regulations for coke production will significantly increase the shortfall of domestic coke production during the interim extension period from 1998-2003 during which new coke production technologies and environmental control strategies are to be developed. After year 2003 new regulations for coke product environmental requirement will likely be promulgated. It is likely that this also will either increase the cost of high-quality coke production or will reduce the available domestic U.S. supply. Therefore, iron production in the United States utilizing the current, predominant Blast Furnace process will be more costly and would likely be curtailed due to a coke shortage.
Utilization of higher percentages of imported coke in the existing Blast Furnace infrastructure will not solve the problems of short supply
\\Da0002\01052901\common\DOE REPORT OCT 2000\Section 2.doc Page 1 of 33
completely since the typically inferior quality of these sources result in less Blast Furnace productivity and higher operating and maintenance costs. This imported coke will likely also increase in cost and become unavailable as the market demands increase.
There may be restrictions or tariffs on the use of such imported coke if it is produced under conditions such that significant environmental emissions result. As is the current case, almost all of the offshore sources of imported coke (and the domestic sources with few exceptions) do not meet current or proposed U.S. environmental standards for emissions. As a consequence, this may not be a significant viable source of supply after year 2003.
Therefore, there is a significant need to develop or extend the economic viability of Alternate Ironmaking Processes to at least partially replace current and declining blast furnace iron sources and to provide incentives for new capacity expansion.
2-1.2: Scope/Objective:
A study was initiated to compare a number of Alternative Ironmaking Processes by Lockwood Greene Engineers in January, 2000 based on the following Scope-of-Work. This work was done in conjunction with Lockwood Greene Technologies who contracted for the study to Lockheed Martin Energy Research Corporation, the operating agency for the U. S. Department of Energy at the Oak Ridge Laboratories facility.
The objective of the study was to evaluate a number of alternative proven and promising ironmaking processes that will feed iron units to current and future steelmaking processes. An initial review of available technologies was made with a view toward grouping for evaluation similar or derivative processes. These groupings plus initial energy and mass balance considerations allowed a preliminary screening, selection and final groupings of the promising process alternatives.
Reasonably accurate and relatively precise methodologies were utilized to develop quantitative measurements of process capital and operating costs, energy consumption and environmental emissions. A standard scenario of the requirements to produce 1.0 MM annual metric tons (tonnes) of refined liquid steel (by an Electric Arc Furnace and Ladle Refining Furnace,
\\Da0002\01052901\common\DOE REPORT OCT 2000\Section 2.doc Page 2 of 33
EAF/LRF scenario) was utilized to normalize the basis of comparison for all ironmaking technologies.
The true objective of the study was to define those alternative ironmaking processes that were lowest in costs while remaining environmentally friendly.
2-2: Methodology and Approach
Each process considered were defined and specified, where possible, to the same level of confidence. In-house Lockwood Greene Engineers detailed process flow diagrams; spreadsheet mass balance models and process simulation models were utilized as the basis for the comparisons. For each process, the beginning point of evaluation was the primary iron unit source and the final point of evaluation was the refined liquid steel product. In addition, specific Process Vendor inputs to define the specifics of the heat and mass balances and the capital and operating costs were also utilized.
The primary reason for this approach was to have a relative comparison of the cumulative energy consumptions (as electric power, fuel or other consumables) and to provide a basis for the cumulative emission of carbon waste gases. For purposes of comparison, all carbon gases leaving the process were taken to be as CO2.
The overall mass and component balances for each of the sequence and train of various preparation processes and unit operations preceding the ironmaking and steelmaking processes defines the specific sizing and cost factor requirements for the preceding processes. In addition, the quantities of raw materials, fuels and other commodities were defined for operating cost development. The relationships for the primary raw materials themselves are also built up from their various components also.
Each component is defined and represented by a rigorous working spreadsheet heat and material balance model. The combination of the various components results in a similar built-up spreadsheet model for the primary raw materials. Extending that further, these raw materials production models are combined and strung together to form the unit process models.
\\Da0002\01052901\common\DOE REPORT OCT 2000\Section 2.doc Page 3 of 33
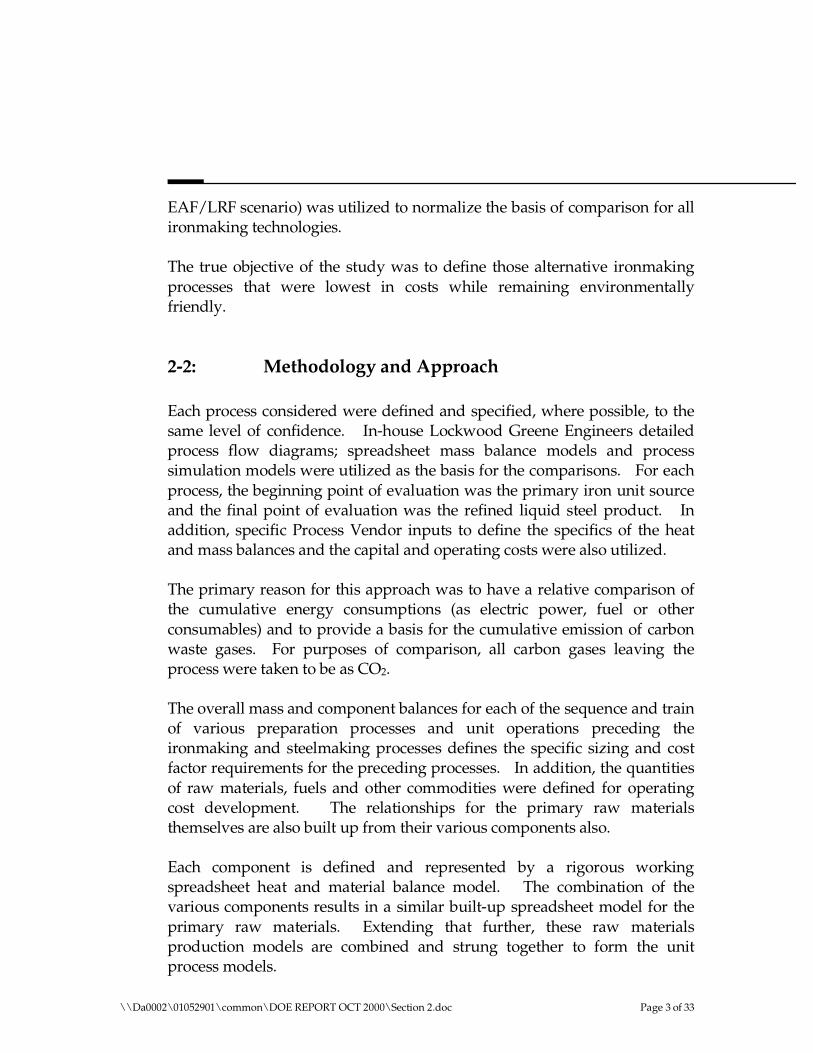
For example, the steps to produce an iron ore pellet are illustrated in Figure 2-2.1 below:
IRON ORE MINING
DIESEL FUEL
EXHAUST GASES
IRO N ORE CONCENTRATOR
WASTE ROCK
IRON ORE
ELECTRIC POWER
TAILINGS
ORE CONCENTRATE CONCENTRATE
TRANSPORT (PIPELINE)
ELECTRIC POWER
ORE CONCENTRATE ORE
PELLETIZING
ELECTRIC POWER
FUEL
FLUE GASES
OTHER
INDURATED IRON ORE PELLETS
DIRECT REDUCTION
PROCESS
FUEL
ELECTRIC POWER
FLUE GASES
DRI ELECTRIC ARC FURNACE
STEELMAKING
FUEL
ELECTRIC POWER
INDURATED IRON ORE PELLETS
LIME/MgO (FLUX)
ELECTRODES
CHARGE C
STEEL SCRAP
FLUE GASES
SLAG
SCRAP
DUST
LIQUID STEEL
FIGURE 2-2.1 BASE PROCESS - DRI/EAF
OXYGEN
Preceding the production of iron ore pellets are the unit processes of:
• Iron Ore Mining
• Iron Ore Concentrating
• Transport of Concentrate (e.g. slurry pipeline) • Then Pelletizing
Similarly, the iron ore pellets are the primary raw material for the Direct Reduction Process to product Direct Reduced Iron which, in turn, is the primary raw material for the Electric Arc Steelmaking Process to produce refined liquid steel. The detailed component Block Flow Diagrams (BFDs) for the major raw materials for the Ironmaking Processes (e.g. electrical power, tonnage oxygen, burnt lime, non-recovery and co-product coke, etc.) are presented in the Appendix A-3. Also presented in Appendix A-3 are BFDs for the major Ironmaking Processes showing the similar methodology
\\Da0002\01052901\common\DOE REPORT OCT 2000\Section 2.doc Page 4 of 33
for the built-up spreadsheet balance models utilized as the basis for definition and comparison in this study.
2-2.1: Introduction to the MetSim Process Simulator
The basis for analysis of all chemical and metallurgical processes is the mass and energy balance. Plant design, capital costs, operating costs, and technical evaluations are all dependent on such calculations. MetSim is a general-purpose process simulation system designed to assist the engineer in performing mass and energy balances of complex processes. MetSim uses an assortment of computational methods to effect an optimum combination of complexity, user time, and computer resource usage.
MetSim can perform mass and energy balance calculations for:
• Process feasibility studies
• Alternative flowsheet evaluations
• Pilot plant data evaluation
• Full scale plant design calculations
• Operating plant improvement studies
• Actual plant operations and control.
MetSim performs mass and energy balances for chemical/metallurgical processes using the sequential modular approach. A major advantage of this approach is that intermediate results may be obtained from any stage of the process in an intelligible form. In conformance with the sequential modular approach, MetSim comprises modules containing subsets of equations describing the design specifications and performance characteristics for each process step. The system solves the equation subset for each module, allowing for an individual analysis of each unit operation in the flowsheet.
Given data on design variables and input stream composition, each module calculates all of the output stream variables that can then be used as input stream values for the next process step. The modules access data on all independent stream variables from the data arrays contained within the APL (the computer language used for writing MetSim code) global workspace. Additional input data required to solve the equations in each module are requested by the program and are stored as global variables.
\\Da0002\01052901\common\DOE REPORT OCT 2000\Section 2.doc Page 5 of 33
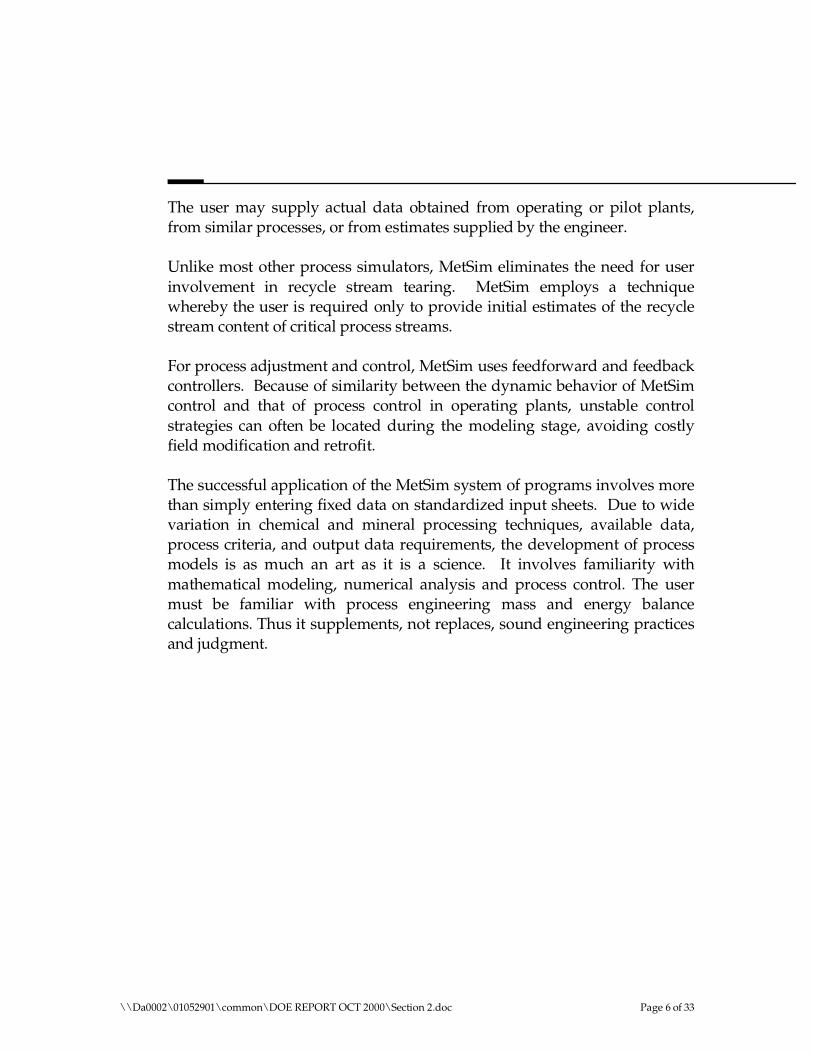
The user may supply actual data obtained from operating or pilot plants, from similar processes, or from estimates supplied by the engineer.
Unlike most other process simulators, MetSim eliminates the need for user involvement in recycle stream tearing. MetSim employs a technique whereby the user is required only to provide initial estimates of the recycle stream content of critical process streams.
For process adjustment and control, MetSim uses feedforward and feedback controllers. Because of similarity between the dynamic behavior of MetSim control and that of process control in operating plants, unstable control strategies can often be located during the modeling stage, avoiding costly field modification and retrofit.
The successful application of the MetSim system of programs involves more than simply entering fixed data on standardized input sheets. Due to wide variation in chemical and mineral processing techniques, available data, process criteria, and output data requirements, the development of process models is as much an art as it is a science. It involves familiarity with mathematical modeling, numerical analysis and process control. The user must be familiar with process engineering mass and energy balance calculations. Thus it supplements, not replaces, sound engineering practices and judgment.
\\Da0002\01052901\common\DOE REPORT OCT 2000\Section 2.doc Page 6 of 33
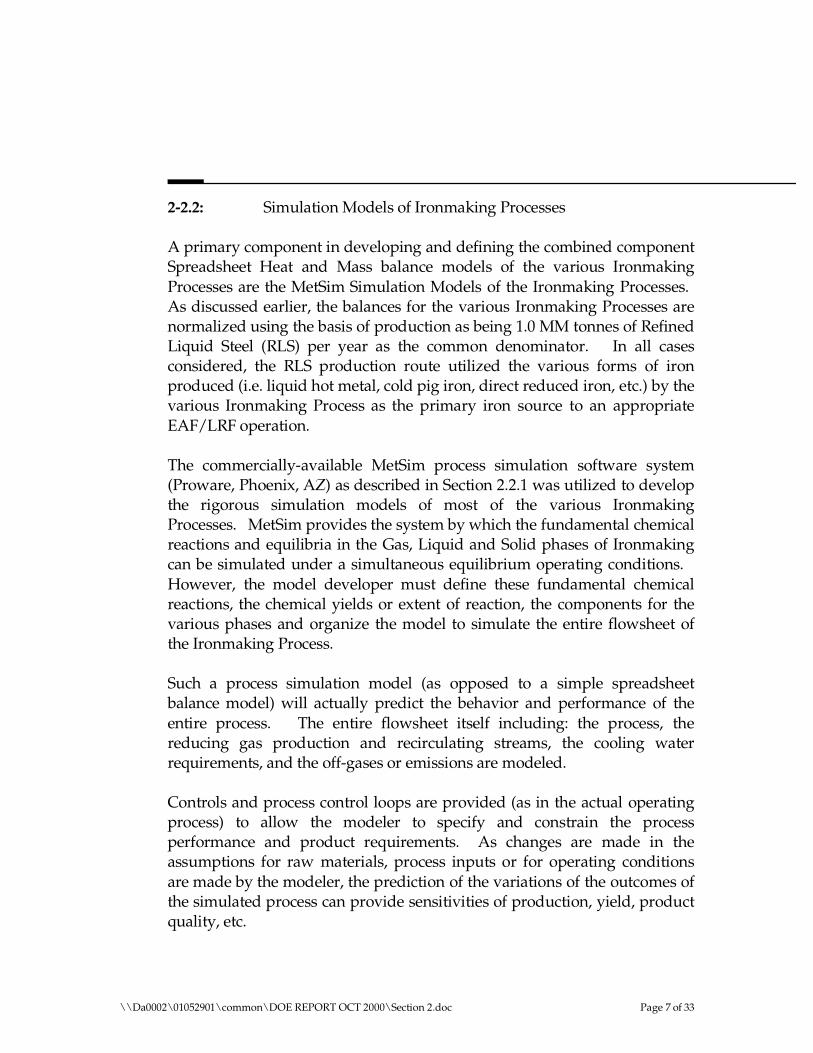
2-2.2: Simulation Models of Ironmaking Processes
A primary component in developing and defining the combined component Spreadsheet Heat and Mass balance models of the various Ironmaking Processes are the MetSim Simulation Models of the Ironmaking Processes. As discussed earlier, the balances for the various Ironmaking Processes are normalized using the basis of production as being 1.0 MM tonnes of Refined Liquid Steel (RLS) per year as the common denominator. In all cases considered, the RLS production route utilized the various forms of iron produced (i.e. liquid hot metal, cold pig iron, direct reduced iron, etc.) by the various Ironmaking Process as the primary iron source to an appropriate EAF/LRF operation.
The commercially-available MetSim process simulation software system (Proware, Phoenix, AZ) as described in Section 2.2.1 was utilized to develop the rigorous simulation models of most of the various Ironmaking Processes. MetSim provides the system by which the fundamental chemical reactions and equilibria in the Gas, Liquid and Solid phases of Ironmaking can be simulated under a simultaneous equilibrium operating conditions. However, the model developer must define these fundamental chemical reactions, the chemical yields or extent of reaction, the components for the various phases and organize the model to simulate the entire flowsheet of the Ironmaking Process.
Such a process simulation model (as opposed to a simple spreadsheet balance model) will actually predict the behavior and performance of the entire process. The entire flowsheet itself including: the process, the reducing gas production and recirculating streams, the cooling water requirements, and the off-gases or emissions are modeled.
Controls and process control loops are provided (as in the actual operating process) to allow the modeler to specify and constrain the process performance and product requirements. As changes are made in the assumptions for raw materials, process inputs or for operating conditions are made by the modeler, the prediction of the variations of the outcomes of the simulated process can provide sensitivities of production, yield, product quality, etc.
\\Da0002\01052901\common\DOE REPORT OCT 2000\Section 2.doc Page 7 of 33
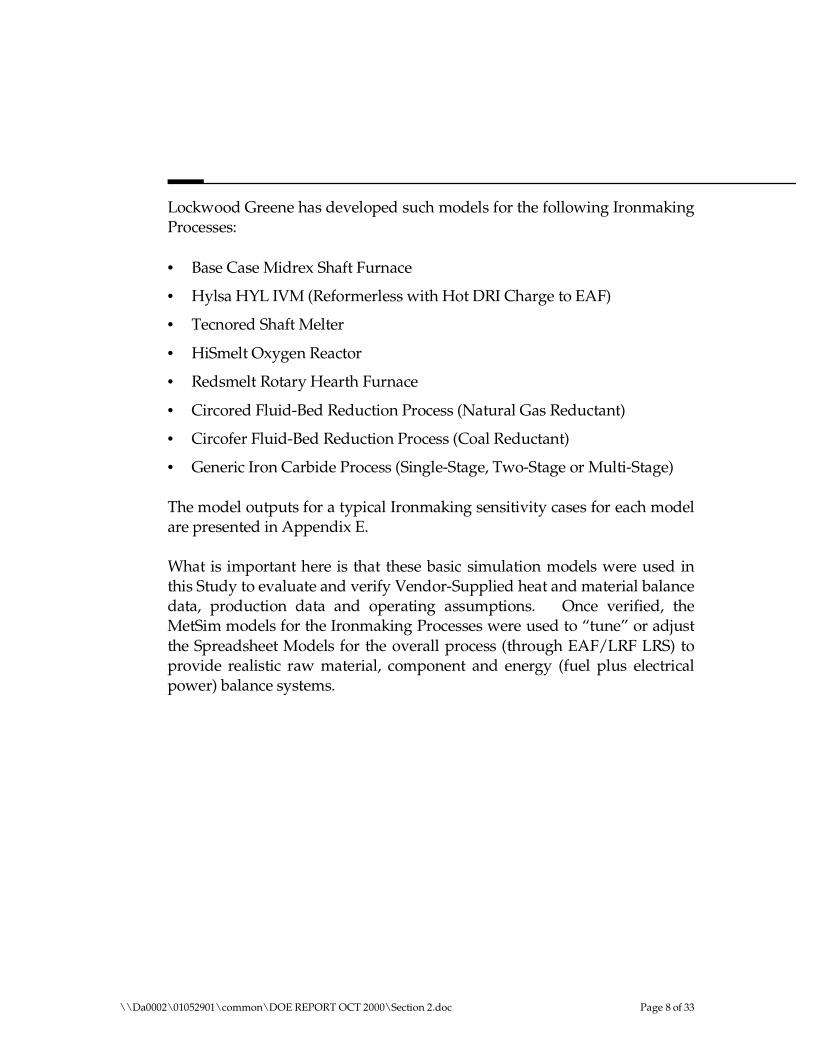
Lockwood Greene has developed such models for the following Ironmaking Processes:
• Base Case Midrex Shaft Furnace
• Hylsa HYL IVM (Reformerless with Hot DRI Charge to EAF)
• Tecnored Shaft Melter
• HiSmelt Oxygen Reactor
• Redsmelt Rotary Hearth Furnace
• Circored Fluid-Bed Reduction Process (Natural Gas Reductant)
• Circofer Fluid-Bed Reduction Process (Coal Reductant)
• Generic Iron Carbide Process (Single-Stage, Two-Stage or Multi-Stage)
The model outputs for a typical Ironmaking sensitivity cases for each model are presented in Appendix E.
What is important here is that these basic simulation models were used in this Study to evaluate and verify Vendor-Supplied heat and material balance data, production data and operating assumptions. Once verified, the MetSim models for the Ironmaking Processes were used to “tune” or adjust the Spreadsheet Models for the overall process (through EAF/LRF LRS) to provide realistic raw material, component and energy (fuel plus electrical power) balance systems.
\\Da0002\01052901\common\DOE REPORT OCT 2000\Section 2.doc Page 8 of 33
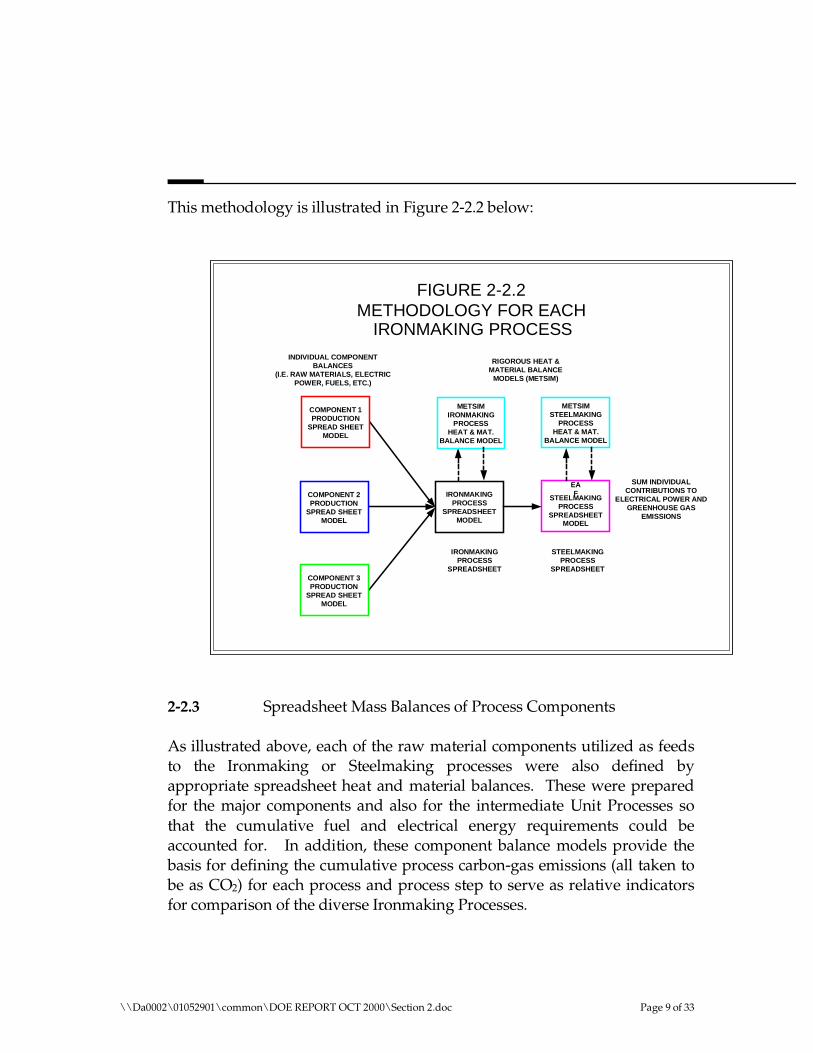
This methodology is illustrated in Figure 2-2.2 below:
IRONMAKING PROCESS
SPREADSHEET MODEL
COMPONENT 1 PRODUCTION
SPREAD SHEET MODEL
COMPONENT 3 PRODUCTION
SPREAD SHEET MODEL
COMPONENT 2 PRODUCTION
SPREAD SHEET MODEL
EA F
STEELMAKING PROCESS
SPREADSHEET MODEL
METSIM IRONMAKING
PROCESS HEAT & MAT.
BALANCE MODEL
METSIM STEELMAKING
PROCESS HEAT & MAT.
BALANCE MODEL
IRONMAKING PROCESS
SPREADSHEET
STEELMAKING PROCESS
SPREADSHEET
RIGOROUS HEAT &MATERIAL BALANCE
MODELS (METSIM)
SUM INDIVIDUAL CONTRIBUTIONS TO
ELECTRICAL POWER ANDGREENHOUSE GAS
EMISSIONS
FIGURE 2-2.2 METHODOLOGY FOR EACH
IRONMAKING PROCESS
INDIVIDUAL COMPONENT BALANCES
(I.E. RAW MATERIALS, ELECTRIC POWER, FUELS, ETC.)
2-2.3 Spreadsheet Mass Balances of Process Components
As illustrated above, each of the raw material components utilized as feeds to the Ironmaking or Steelmaking processes were also defined by appropriate spreadsheet heat and material balances. These were prepared for the major components and also for the intermediate Unit Processes so that the cumulative fuel and electrical energy requirements could be accounted for. In addition, these component balance models provide the basis for defining the cumulative process carbon-gas emissions (all taken to be as CO2) for each process and process step to serve as relative indicators for comparison of the diverse Ironmaking Processes.
\\Da0002\01052901\common\DOE REPORT OCT 2000\Section 2.doc Page 9 of 33
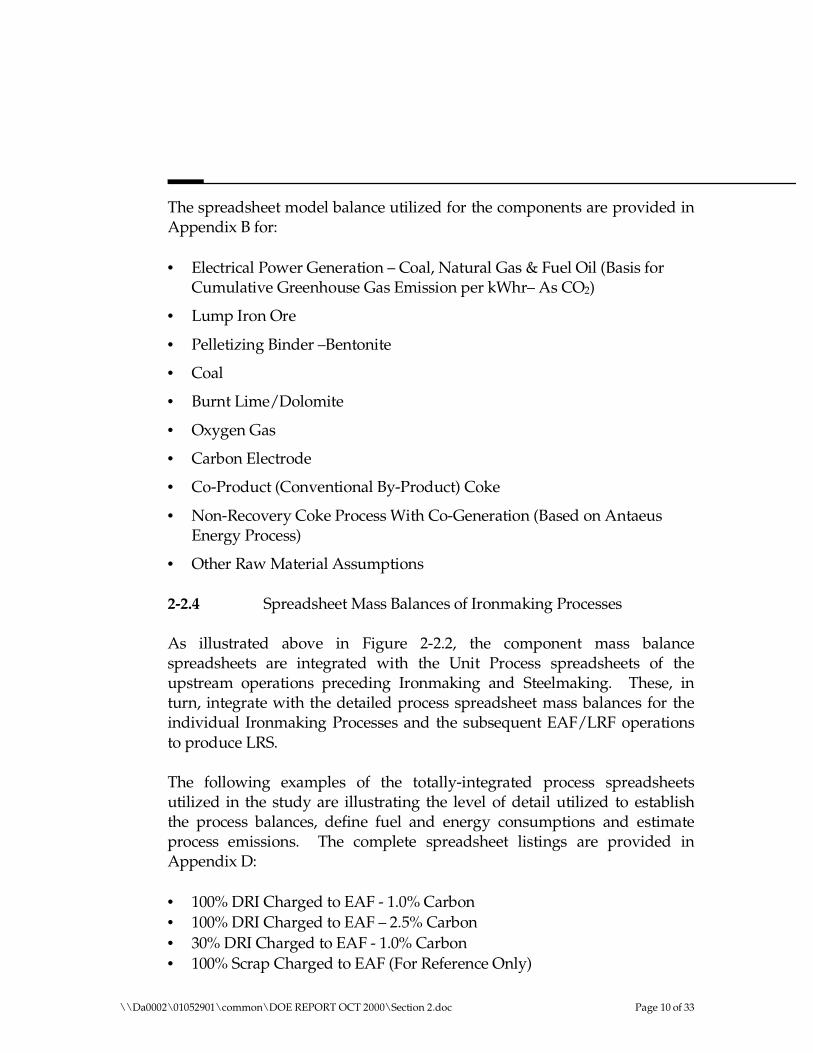
The spreadsheet model balance utilized for the components are provided in Appendix B for:
• Electrical Power Generation – Coal, Natural Gas & Fuel Oil (Basis for Cumulative Greenhouse Gas Emission per kWhr– As CO2)
• Lump Iron Ore
• Pelletizing Binder –Bentonite
• Coal
• Burnt Lime/Dolomite
• Oxygen Gas
• Carbon Electrode
• Co-Product (Conventional By-Product) Coke
• Non-Recovery Coke Process With Co-Generation (Based on Antaeus Energy Process)
• Other Raw Material Assumptions
2-2.4 Spreadsheet Mass Balances of Ironmaking Processes
As illustrated above in Figure 2-2.2, the component mass balance spreadsheets are integrated with the Unit Process spreadsheets of the upstream operations preceding Ironmaking and Steelmaking. These, in turn, integrate with the detailed process spreadsheet mass balances for the individual Ironmaking Processes and the subsequent EAF/LRF operations to produce LRS.
The following examples of the totally-integrated process spreadsheets utilized in the study are illustrating the level of detail utilized to establish the process balances, define fuel and energy consumptions and estimate process emissions. The complete spreadsheet listings are provided in Appendix D:
• 100% DRI Charged to EAF - 1.0% Carbon • 100% DRI Charged to EAF – 2.5% Carbon • 30% DRI Charged to EAF - 1.0% Carbon • 100% Scrap Charged to EAF (For Reference Only)
\\Da0002\01052901\common\DOE REPORT OCT 2000\Section 2.doc Page 10 of 33
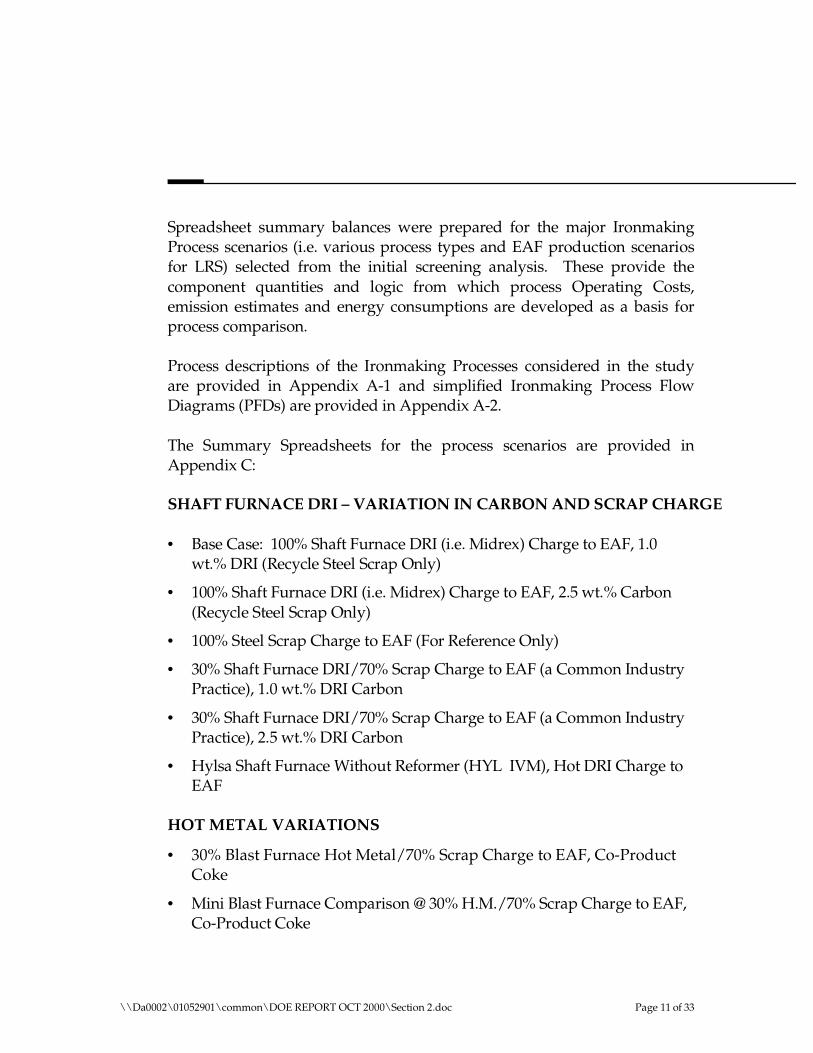
Spreadsheet summary balances were prepared for the major Ironmaking Process scenarios (i.e. various process types and EAF production scenarios for LRS) selected from the initial screening analysis. These provide the component quantities and logic from which process Operating Costs, emission estimates and energy consumptions are developed as a basis for process comparison.
Process descriptions of the Ironmaking Processes considered in the study are provided in Appendix A-1 and simplified Ironmaking Process Flow Diagrams (PFDs) are provided in Appendix A-2.
The Summary Spreadsheets for the process scenarios are provided in Appendix C:
SHAFT FURNACE DRI – VARIATION IN CARBON AND SCRAP CHARGE
• Base Case: 100% Shaft Furnace DRI (i.e. Midrex) Charge to EAF, 1.0 wt.% DRI (Recycle Steel Scrap Only)
• 100% Shaft Furnace DRI (i.e. Midrex) Charge to EAF, 2.5 wt.% Carbon (Recycle Steel Scrap Only)
• 100% Steel Scrap Charge to EAF (For Reference Only)
• 30% Shaft Furnace DRI/70% Scrap Charge to EAF (a Common Industry Practice), 1.0 wt.% DRI Carbon
• 30% Shaft Furnace DRI/70% Scrap Charge to EAF (a Common Industry Practice), 2.5 wt.% DRI Carbon
• Hylsa Shaft Furnace Without Reformer (HYL IVM), Hot DRI Charge to EAF
HOT METAL VARIATIONS
• 30% Blast Furnace Hot Metal/70% Scrap Charge to EAF, Co-Product Coke
• Mini Blast Furnace Comparison @ 30% H.M./70% Scrap Charge to EAF, Co-Product Coke
\\Da0002\01052901\common\DOE REPORT OCT 2000\Section 2.doc Page 11 of 33
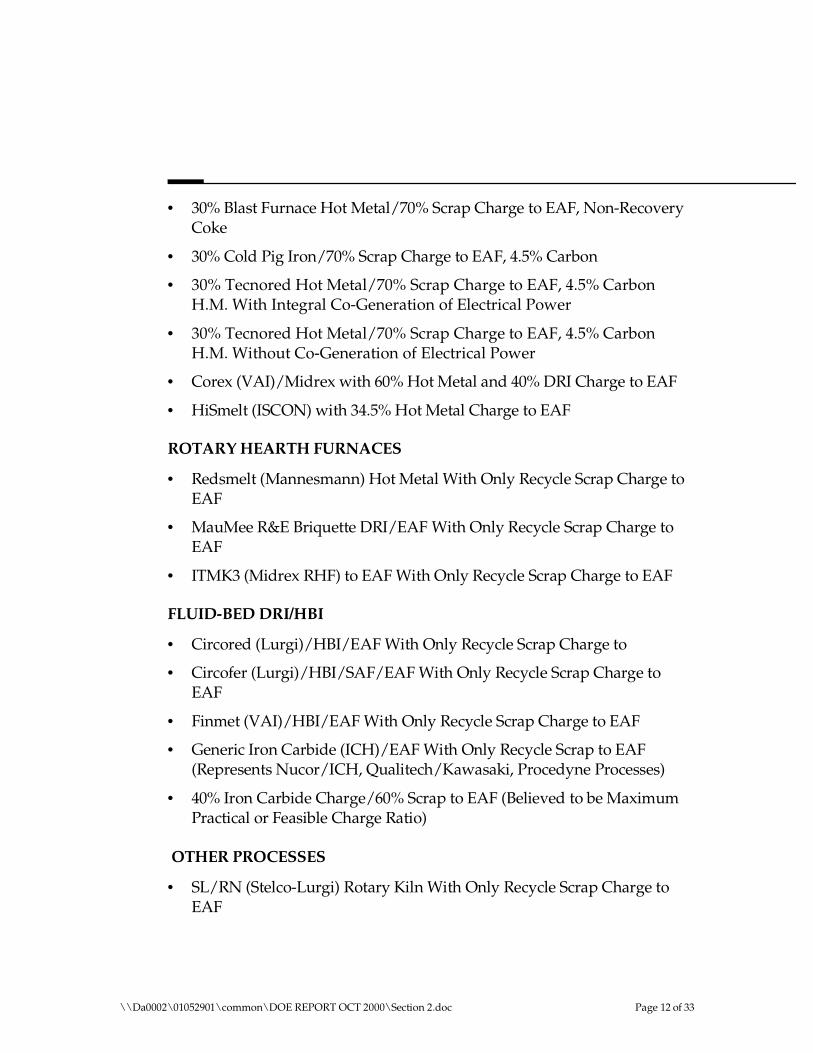
• 30% Blast Furnace Hot Metal/70% Scrap Charge to EAF, Non-Recovery Coke
• 30% Cold Pig Iron/70% Scrap Charge to EAF, 4.5% Carbon
• 30% Tecnored Hot Metal/70% Scrap Charge to EAF, 4.5% Carbon H.M. With Integral Co-Generation of Electrical Power
• 30% Tecnored Hot Metal/70% Scrap Charge to EAF, 4.5% Carbon H.M. Without Co-Generation of Electrical Power
• Corex (VAI)/Midrex with 60% Hot Metal and 40% DRI Charge to EAF
• HiSmelt (ISCON) with 34.5% Hot Metal Charge to EAF
ROTARY HEARTH FURNACES
• Redsmelt (Mannesmann) Hot Metal With Only Recycle Scrap Charge to EAF
• MauMee R&E Briquette DRI/EAF With Only Recycle Scrap Charge to EAF
• ITMK3 (Midrex RHF) to EAF With Only Recycle Scrap Charge to EAF
FLUID-BED DRI/HBI
• Circored (Lurgi)/HBI/EAF With Only Recycle Scrap Charge to
• Circofer (Lurgi)/HBI/SAF/EAF With Only Recycle Scrap Charge to EAF
• Finmet (VAI)/HBI/EAF With Only Recycle Scrap Charge to EAF
• Generic Iron Carbide (ICH)/EAF With Only Recycle Scrap to EAF (Represents Nucor/ICH, Qualitech/Kawasaki, Procedyne Processes)
• 40% Iron Carbide Charge/60% Scrap to EAF (Believed to be Maximum Practical or Feasible Charge Ratio)
OTHER PROCESSES
• SL/RN (Stelco-Lurgi) Rotary Kiln With Only Recycle Scrap Charge to EAF
\\Da0002\01052901\common\DOE REPORT OCT 2000\Section 2.doc Page 12 of 33
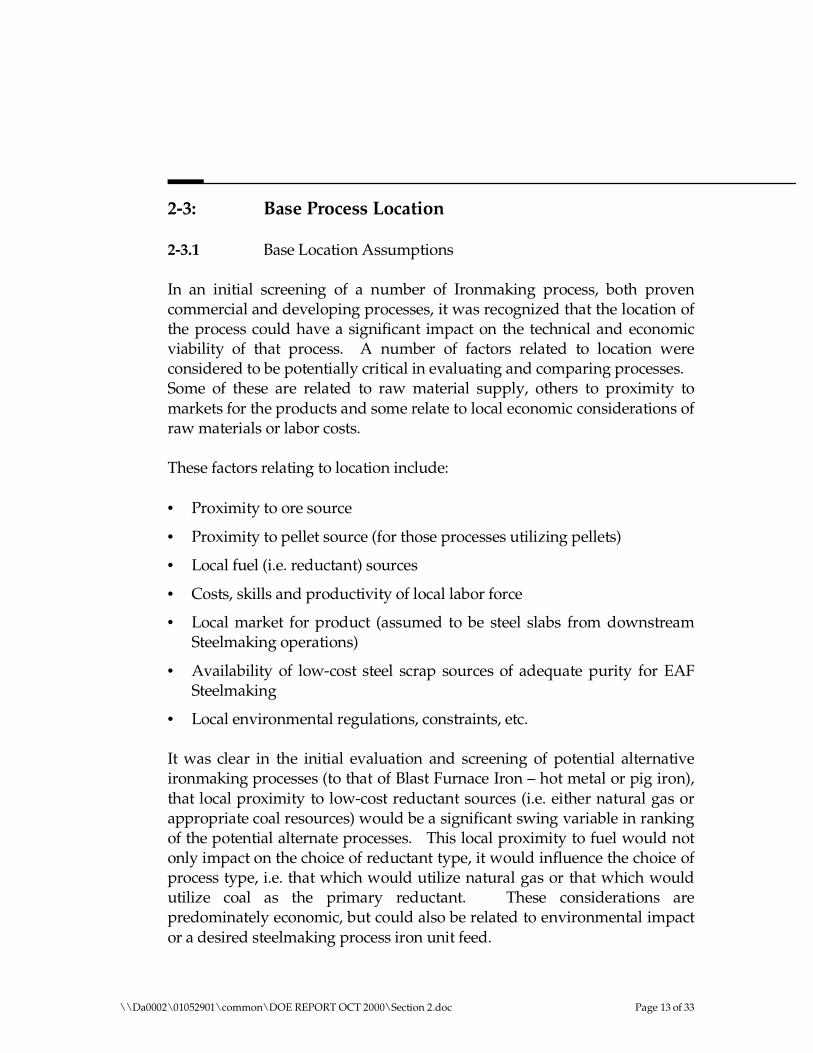
2-3: Base Process Location
2-3.1 Base Location Assumptions
In an initial screening of a number of Ironmaking process, both proven commercial and developing processes, it was recognized that the location of the process could have a significant impact on the technical and economic viability of that process. A number of factors related to location were considered to be potentially critical in evaluating and comparing processes. Some of these are related to raw material supply, others to proximity to markets for the products and some relate to local economic considerations of raw materials or labor costs.
These factors relating to location include:
• Proximity to ore source
• Proximity to pellet source (for those processes utilizing pellets)
• Local fuel (i.e. reductant) sources
• Costs, skills and productivity of local labor force
• Local market for product (assumed to be steel slabs from downstream Steelmaking operations)
• Availability of low-cost steel scrap sources of adequate purity for EAF Steelmaking
• Local environmental regulations, constraints, etc.
It was clear in the initial evaluation and screening of potential alternative ironmaking processes (to that of Blast Furnace Iron – hot metal or pig iron), that local proximity to low-cost reductant sources (i.e. either natural gas or appropriate coal resources) would be a significant swing variable in ranking of the potential alternate processes. This local proximity to fuel would not only impact on the choice of reductant type, it would influence the choice of process type, i.e. that which would utilize natural gas or that which would utilize coal as the primary reductant. These considerations are predominately economic, but could also be related to environmental impact or a desired steelmaking process iron unit feed.
\\Da0002\01052901\common\DOE REPORT OCT 2000\Section 2.doc Page 13 of 33
2-3.2 Location Sensitivities
• Proximity to ore source
The most significant component of Operating Costs for the Ironmaking processes is the cost of iron units supplied to the process. Another factor is the form of the iron unit raw material delivered (i.e. as high-grade lump ore, pellets from iron ore concentrate or iron ore fines). A significant additional factor is the availability of supply of the desired iron unit raw material. All of these factors are related to the location of the Ironmaking process relative to the source of the iron unit raw material.
Since some Ironmaking process performance factors relate to the quality of the iron unit feed, close proximity to the source may provide a more favorable access to the most desirable feed material. This can impact of the relative performance of one process over another. For example, there may be alternate methods of delivery (e.g. slurry pipeline) or availability of quantities at significantly-lower cost per iron unit for ore fines. Processes that can directly utilize them, perhaps without further beneficiation or palletizing, could have a local advantage.
Similarly, raw material cost factors (i.e. material handling and delivery costs, availability of low-cost fines, etc.) may influence significantly the choice of Ironmaking process. Availability of suitable port, rail or other delivery factors for raw materials and acceptable access to the raw material sources may partially mitigate a location-related factor for the iron unit feeds.
In this study, an upper Midwest U.S.A. location was chosen (i.e. Northern Ohio or Indiana) to provide a Target Location that would have all of the required factors for raw material delivery so as to not significantly bias the relative Ironmaking process evaluation and comparisons. Delivered raw material costs and availability are acceptable for that location and would not necessary favor one process over another. However, in this fashion delivered costs of raw materials (including supply and transportation) were thus normalized, but not necessarily optimized, for all processes.
\\Da0002\01052901\common\DOE REPORT OCT 2000\Section 2.doc Page 14 of 33
• Proximity to pellet source
For those processes utilizing indurated iron concentrate pellets, there could be significant impacts of location relative to the source of concentrates or direct reduction grade (DR) pellets. An ironmaking project that includes it’s own source of ore, concentrates and subsequent pellet production, may favor selection of an ironmaking process that benefits most directly by that constancy of feed quantity and quality. An example of this is the Shaft Furnace DRI processes, Midrex or Hylsa.
During high-iron production times, there could even be shortages of supply of the most desirable pellet feeds for some Ironmaking processes. Closeness to the source of pellets may present an advantage in availability or delivered cost. As described above, the choice of an upper Midwest U.S.A. location was designed to neither present an advantage or to be a disadvantage to the selection or comparison of Ironmaking processes.
• Local fuel sources
Second in importance related to Location, is that of the fuel (or reductant) source and/or type. There will definitely be advantages, similar to those for iron unit supply, to any of the Ironmaking processes is they can be located close to a readily-available, low-cost fuel supply. As noted above, the fuel supply (rate and quality) and delivered cost will be a primary consideration in the selection of the Ironmaking process type.
If low-cost coals of the proper type are available in a particular location versus a higher-cost supply of natural gas, this may influence the selection of a coal-based reductant ironmaking process. If metallurgical coal (for conventional coke production) is in short supply or is at a premium cost, selection of a process (e.g. rotary hearth, Tecnored or non-recovery coking) that can utilize lower-cost, readily-available, low-rank coals may be the only process option. A similar situation where synthesis gas in quantity (i.e. Sasol Gas at Saldanha, SA.) is available may dictate the ironmaking process selection due to favorable fuel gas properties for that process.
In some locations, low-cost natural gas or suitable coal may not even be available locally. Thus, the relative costs of importing the quantities of fuel necessary could influence significantly the choice of Ironmaking process or
\\Da0002\01052901\common\DOE REPORT OCT 2000\Section 2.doc Page 15 of 33
the overall project economics. The choice of an upper Midwest project location does not necessarily favor one fuel source over another.
• Costs, skills and productivity of local labor force
Labor costs as a fraction of the Operating Costs for iron or steel product are a relatively-low percentage (≈10% or less of the totals). Differences in labor rates from one site location to the other would not significantly impact on the overall production costs. An important factor may be local labor productivity. In some countries, or in some regions of North America, effective productivity of labor not compensated for in the labor rates, may have an impact on the costs of production for some of the Ironmaking processes. There are significant differences in the manpower requirements for some of the ironmaking scenarios (when normalized to North American standards) that could influence the choice of process or overall project economics.
More importantly, however, some Ironmaking processes, in particular those higher-technology processes in development or in their first-of-a-kind prototype phase, could require a more highly-skilled labor force to operate or maintain. This may not be readily available, would command an extra-ordinarily-high premium on labor rates or would require importation of skilled labor for some processes in some locations. This could influence significantly the choice of process related to a specific location.
The upper Midwest location should neither present an advantage nor a disadvantage to any specific Ironmaking process. It would have an overall favorable labor market due to the high skill and experience levels of the available work force and a general familiarity with heavy industrial processes such as ironmaking and steelmaking.
• Local market for product
In general, the upper Midwest U.S.A. location would be a favorable one for a steel slab product produced from any of the Ironmaking processes. The ability of some Ironmaking processes (particularly those producing DRI) to produce a favorably low impurity scrap substitute iron feed, could favor the production of low-impurity steel for specific industry (e.g. deep drawing quality auto body grades, etc.). However, the market for all types of steel
\\Da0002\01052901\common\DOE REPORT OCT 2000\Section 2.doc Page 16 of 33

from this general location would not favor one type of process over the other.
Shipment or transportation of the finished steel slab product would also be generally favorable with options including water shipment, rail or truck shipment of the steel product. There is also the possibility of close integration with an existing customer for a steel slab product that would eliminate the necessity of product shipping.
• Availability of low-cost steel scrap
A significant finding of this Alternative Ironmaking Study is that the selection of an Ironmaking process (for ultimate EAF/LRF steelmaking) is directly influenced by the availability, cost and purity of steel scrap. This is not only a significant factor in the selection of the appropriate Ironmaking process, but in the net final cost of the final LRS product. It may be that those ironmaking processes that most efficiently combine with the EAF steelmaking to minimize the quantity or quality (i.e. costs or availability) of steel scrap would be the only economically-viable Ironmaking processes of choice in a high cost steel scrap market.
Discussed in Section 2-4 and in Section 4, the steel scrap price sensitivity is a primary factor in Ironmaking process selection. With the fluctuation in steel scrap prices with the past two years over a range of approximately +/-50% from the average (see Figure 2-3.1 below), ironmaking processes (in combination with EAF/LRF) that are viable at median or lower scrap prices are not viable at the above average scrap price.
\\Da0002\01052901\common\DOE REPORT OCT 2000\Section 2.doc Page 17 of 33

Steelmaking that requires a higher scrap charge would have a net result of higher steelmaking costs.
FIGURE 2-3.1: STEEL SCRAP PRICE COMPOSITE ($/mt WEEKLY FROM JANUARY 1998)
$180.00 $160.00 $140.00 $120.00 $100.00
$80.00 $60.00 $40.00 $20.00
$0.00
0 20 40 60 80 100 120 140 160
WEEKLY FROM JAN. 1998
SCRAP COMP. MEDIAN PRICE
This also works against those Ironmaking processes that are designed to be scrap substitutes, i.e. DRI producers such as the shaft furnaces. It is a true perspective that Shaft Furnace DRI facilities that were installed just one or two years ago under a favorable economic climate (e.g. moderate scrap prices) became uneconomically viable and with no competitive market at low scrap prices.
• Local environmental regulations, constraints, etc.
A key part of the initial evaluation and process screening phases of this Alternative Ironmaking Study was the overall impact on greenhouse gas emissions for each process (as represented in the Study by total the cumulative carbon gas emissions as CO2). Not only is this factor an important one in comparing the various processes, it is one that could impact on the ability to install a particular process at a specific location.
There are several forces are working against each other. One is that the total local emissions for a given process may exceed the Local environment
\\Da0002\01052901\common\DOE REPORT OCT 2000\Section 2.doc Page 18 of 33

regulatory standards or limits; thus prohibiting selection of that process for that specific location or requiring extra-ordinary mitigation and control. A second factor is that of the cumulative total emissions for the entire train of the process (i.e. ore mining, concentration, pelletizing, etc.) may be high and thus would have a broad impact on the total environment. A last environmental factor is that the total electrical power requirements for a process are high. This also would have a broad impact on the total environment since there are significant emissions (on the average for a U.S.A. location, See Appendix A-3.1) associated with electrical power generation that cannot be ignored when comparing processes to produce LRS.
It will be noted in the comparative analysis below (Section 4-7) that coal-based reductant processes typically have significantly more emissions (as CO2) than natural gas reductant processes. A local environmental restriction or constraint may dictate the use of an Ironmaking process with lower local emission levels.
Two specific ironmaking scenarios were evaluated in this Study where there is a significant difference of the impact of emissions from the coking production processes. The production of coke for use in a blast furnace is a significant contributor to the overall emissions of the blast furnace process. The first scenario is one that the conventional Blast Furnace process produces hot metal utilizing conventional co-product coke production. The second is one where the blast furnace produces hot metal utilizing an evolving, continuous non-recovery coke production process. For these cases, no differences in the blast furnace productivity or charge requirements were assumed as a result of the use of one type of coke or the other.
(Note: Physical and chemical parameters for the briquetted form coke produced by the non-recovery process may indicate that, in fact, the blast furnace productivity could be higher.)
The comparison of the total emissions for these two, otherwise identical, cases indicated that there was approximately a 7% lower total emissions from the Non–Recovery Coke/Blast Furnace process relative to the Conventional Co-Product Coke/Blasé Furnace. With the inclusion of cogeneration that is an integral part of the Continuous Non-Recovery Coke
\\Da0002\01052901\common\DOE REPORT OCT 2000\Section 2.doc Page 19 of 33
process, there was a 22% reduction in emissions due to total cumulative electrical power related emissions. This kind of environmental difference may provide incentives or constraints to utilize the lower-emitting technologies.
2-4: Process Capital (CAPEX) and Operating Cost Estimates
2-4.1: Process Capital Costs (CAPEX)
The Relative Capital Cost (CAPEX) estimates for each of the Alternative Ironmaking Processes were developed from appropriate Iron and Steelmaking Unit Operation internal LGE Cost, Feasibility or Detailed Design Studies. In addition, some specific Process Vendor inputs were utilized to provide a most recent estimate basis or where the appropriate in-house data were not available. The installed cost estimates were factored using internal LGE factors for the costs for similar scopes for process areas or plant type for each of the Ironmaking Processes. Where common cost areas are present for different Ironmaking processes, e.g. pelletizing plant , the basis costs were factored for each Ironmaking process according to capacity requirements.
The costs used were updated to a year 2000 basis and normalized using the process Mass Balances (Appendix C) to a uniform 1.0 million metric tonnes per year Refined Liquid Steel (RLS) production basis. Specific differences in scope required for a particular Ironmaking process were accounted for in the individual components considered in the overall process CAPEX estimates (summarized in detail in Volume II, Appendix F-5). The CAPEX is reported as $/annual metric tonne of production.
The analysis of the relative CAPEX estimates for the various Ironmaking process scenarios will be presented in Section 4.2.
\\Da0002\01052901\common\DOE REPORT OCT 2000\Section 2.doc Page 20 of 33
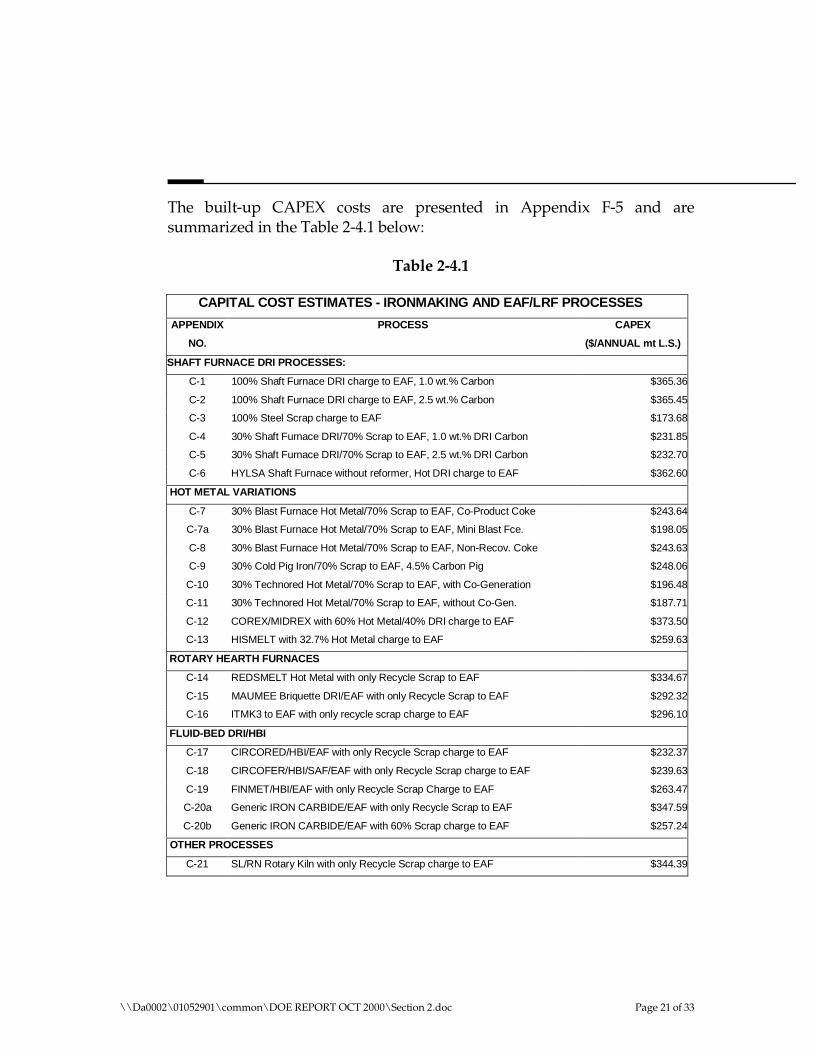
The built-up CAPEX costs are presented in Appendix F-5 and are summarized in the Table 2-4.1 below:
Table 2-4.1
CAPITAL COST ESTIMATES - IRONMAKING AND EAF/LRF PROCESSES
APPENDIX PROCESS CAPEX
NO. ($/ANNUAL mt L.S.)
SHAFT FURNACE DRI PROCESSES:
C-1 100% Shaft Furnace DRI charge to EAF, 1.0 wt.% Carbon $365.36
C-2 100% Shaft Furnace DRI charge to EAF, 2.5 wt.% Carbon $365.45
C-3 100% Steel Scrap charge to EAF $173.68
C-4 30% Shaft Furnace DRI/70% Scrap to EAF, 1.0 wt.% DRI Carbon $231.85
C-5 30% Shaft Furnace DRI/70% Scrap to EAF, 2.5 wt.% DRI Carbon $232.70
C-6 HYLSA Shaft Furnace without reformer, Hot DRI charge to EAF $362.60
HOT METAL VARIATIONS
C-7 30% Blast Furnace Hot Metal/70% Scrap to EAF, Co-Product Coke $243.64
C-7a 30% Blast Furnace Hot Metal/70% Scrap to EAF, Mini Blast Fce. $198.05
C-8 30% Blast Furnace Hot Metal/70% Scrap to EAF, Non-Recov. Coke $243.63
C-9 30% Cold Pig Iron/70% Scrap to EAF, 4.5% Carbon Pig $248.06
C-10 30% Technored Hot Metal/70% Scrap to EAF, with Co-Generation $196.48
C-11 30% Technored Hot Metal/70% Scrap to EAF, without Co-Gen. $187.71
C-12 COREX/MIDREX with 60% Hot Metal/40% DRI charge to EAF $373.50
C-13 HISMELT with 32.7% Hot Metal charge to EAF $259.63
ROTARY HEARTH FURNACES
C-14 REDSMELT Hot Metal with only Recycle Scrap to EAF $334.67
C-15 MAUMEE Briquette DRI/EAF with only Recycle Scrap to EAF $292.32
C-16 ITMK3 to EAF with only recycle scrap charge to EAF $296.10
FLUID-BED DRI/HBI
C-17 CIRCORED/HBI/EAF with only Recycle Scrap charge to EAF $232.37
C-18 CIRCOFER/HBI/SAF/EAF with only Recycle Scrap charge to EAF $239.63
C-19 FINMET/HBI/EAF with only Recycle Scrap Charge to EAF $263.47
C-20a Generic IRON CARBIDE/EAF with only Recycle Scrap to EAF $347.59
C-20b Generic IRON CARBIDE/EAF with 60% Scrap charge to EAF $257.24
OTHER PROCESSES
C-21 SL/RN Rotary Kiln with only Recycle Scrap charge to EAF $344.39
\\Da0002\01052901\common\DOE REPORT OCT 2000\Section 2.doc Page 21 of 33
2-4.2 Process Operating Costs (OPEX)
The approach followed in developing the operating costs for the various Ironmaking Processes was to build up the operating costs (OPEX) from the individual components of each process scenario.
The bases for these costs include:
• Consumable components as defined by the mass and fuel balances (Appendix B).
• Electrical power consumptions from experience or Process Vendor data.
• Labor estimates were factored from man-hour/mt data supplied by Process Vendors and from LGE experience with similar processes.
• Costs and/or fuel costs for transport of materials.
• Allowances for maintenance materials and supplies based on Vendor factors.
• As appropriate, allowances for G&A were added.
Each process component cost was built up using the above factors for each unit operation involved in producing and delivering the consumable to the ironmaking process.
In tables in Appendix F-1, the Consumable Component costs are defined and summarized for:
• Bentonite Binder
• Coal (lump delivered to use)
• Burnt Lime/Dolomite
• Lump Iron Ore
• Fine Iron Ore
• Iron Ore Concentrate
• Iron Ore Pellets
• Co-Product Coke Production
\\Da0002\01052901\common\DOE REPORT OCT 2000\Section 2.doc Page 22 of 33
• Non-Recovery Coke/with Co-Generation
• Steel Scrap Composite Price Basis
2-4.3 Ironmaking Process Consumptions & Relative Operating Costs
The Ironmaking Process Consumptions and their Relative Operating Costs are built up from the costs of the various consumable materials in a similar manner.
• Consumable components as defined by the mass and fuel balances for the Ironmaking Processes (Appendices C & D).
• Electrical power consumptions from experience or Process Vendor data.
• Labor estimates were factored from man-hour/mt data supplied by Process Vendors and from LGE‘s in-house experience for similar processes.
• Costs for transport of materials included in material costs.
• Allowances for maintenance materials and supplies based on Vendor factors.
• Other consumable cost assumptions, e.g. composite steel scrap; overall labor cost per man-hour, natural gas, electrical power, and other delivered materials are based on an upper Mid-West U.S.A. location. These were derived from negotiated commodity costs achieved for a recent large-scale project in that region. (Note: Costs for electrical power, fuel, etc. were first-quarter 2000. They were not changed due to recent escalations. It is believed that most relative comparisons will still be valid.)
• As appropriate, allowances for G&A and/or Vendor fees were added.
Each Ironmaking Process Cost was derived from the summation of the individual costs of each unit operation involved in producing the Iron Units and subsequent production of EAF/LRF Refined Steel Product.
The Process Operating Costs, (OPEX), developed in the above fashion are believed to be relatively precise as a basis for comparing the various processes on an equalized footing. By normalizing all processes through the production of the Refined Liquid Steel product, all types of iron units
\\Da0002\01052901\common\DOE REPORT OCT 2000\Section 2.doc Page 23 of 33
produced by the Ironmaking Processes can be compared. Thus hot metal producing processes are comparable on an equalized basis to direct reduced iron producing processes. The relative accuracy of each of the components of the OPEX based on closure of the mass balances should produce a fair overall cost for each process that can be compared accurately to each other.
It is also believed that the absolute accuracy of these OPEX costs is also relatively precise. Spot checks of the estimated costs and comparisons with recent detailed feasibility studies using Vendor data of these and similar processes have verified the accuracy of the built up operating cost calculation procedure.
\\Da0002\01052901\common\DOE REPORT OCT 2000\Section 2.doc Page 24 of 33
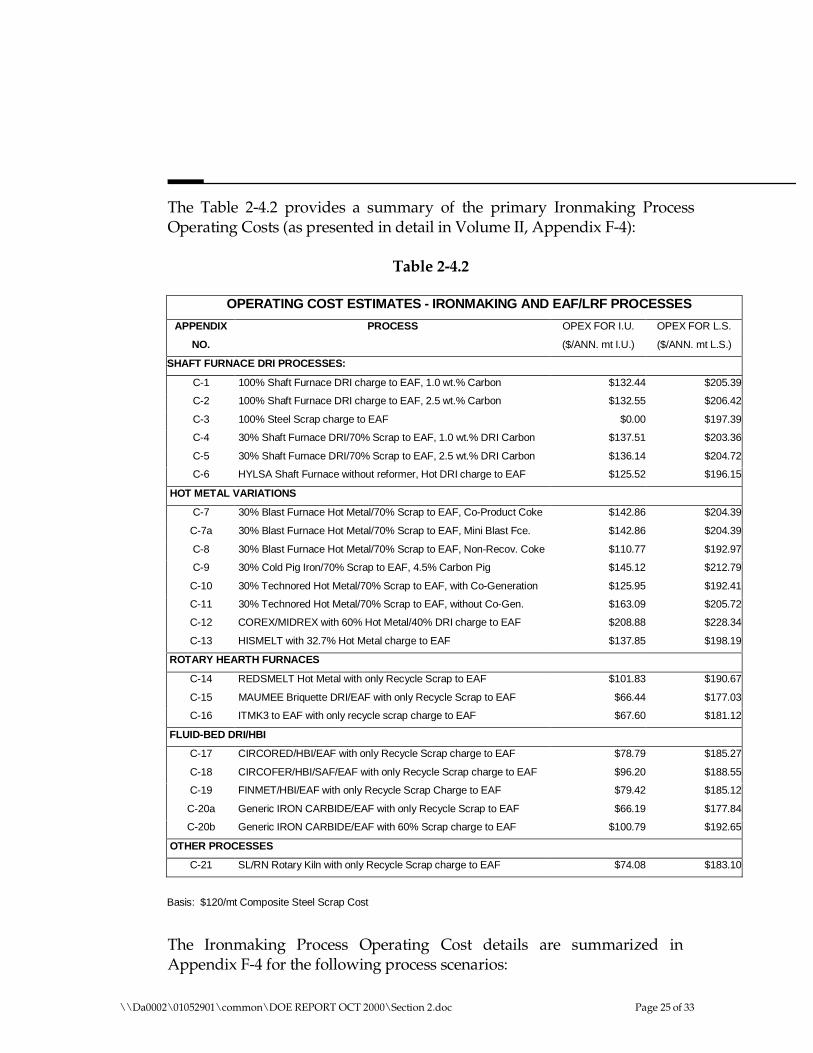
The Table 2-4.2 provides a summary of the primary Ironmaking Process Operating Costs (as presented in detail in Volume II, Appendix F-4):
Table 2-4.2
OPERATING COST ESTIMATES - IRONMAKING AND EAF/LRF PROCESSES
APPENDIX PROCESS OPEX FOR I.U. OPEX FOR L.S.
NO. ($/ANN. mt I.U.) ($/ANN. mt L.S.)
SHAFT FURNACE DRI PROCESSES:
C-1 100% Shaft Furnace DRI charge to EAF, 1.0 wt.% Carbon $132.44 $205.39
C-2 100% Shaft Furnace DRI charge to EAF, 2.5 wt.% Carbon $132.55 $206.42
C-3 100% Steel Scrap charge to EAF $0.00 $197.39
C-4 30% Shaft Furnace DRI/70% Scrap to EAF, 1.0 wt.% DRI Carbon $137.51 $203.36
C-5 30% Shaft Furnace DRI/70% Scrap to EAF, 2.5 wt.% DRI Carbon $136.14 $204.72
C-6 HYLSA Shaft Furnace without reformer, Hot DRI charge to EAF $125.52 $196.15
HOT METAL VARIATIONS
C-7 30% Blast Furnace Hot Metal/70% Scrap to EAF, Co-Product Coke $142.86 $204.39
C-7a 30% Blast Furnace Hot Metal/70% Scrap to EAF, Mini Blast Fce. $142.86 $204.39
C-8 30% Blast Furnace Hot Metal/70% Scrap to EAF, Non-Recov. Coke $110.77 $192.97
C-9 30% Cold Pig Iron/70% Scrap to EAF, 4.5% Carbon Pig $145.12 $212.79
C-10 30% Technored Hot Metal/70% Scrap to EAF, with Co-Generation $125.95 $192.41
C-11 30% Technored Hot Metal/70% Scrap to EAF, without Co-Gen. $163.09 $205.72
C-12 COREX/MIDREX with 60% Hot Metal/40% DRI charge to EAF $208.88 $228.34
C-13 HISMELT with 32.7% Hot Metal charge to EAF $137.85 $198.19
ROTARY HEARTH FURNACES
C-14 REDSMELT Hot Metal with only Recycle Scrap to EAF $101.83 $190.67
C-15 MAUMEE Briquette DRI/EAF with only Recycle Scrap to EAF $66.44 $177.03
C-16 ITMK3 to EAF with only recycle scrap charge to EAF $67.60 $181.12
FLUID-BED DRI/HBI
C-17 CIRCORED/HBI/EAF with only Recycle Scrap charge to EAF $78.79 $185.27
C-18 CIRCOFER/HBI/SAF/EAF with only Recycle Scrap charge to EAF $96.20 $188.55
C-19 FINMET/HBI/EAF with only Recycle Scrap Charge to EAF $79.42 $185.12
C-20a Generic IRON CARBIDE/EAF with only Recycle Scrap to EAF $66.19 $177.84
C-20b Generic IRON CARBIDE/EAF with 60% Scrap charge to EAF $100.79 $192.65
OTHER PROCESSES
C-21 SL/RN Rotary Kiln with only Recycle Scrap charge to EAF $74.08 $183.10
Basis: $120/mt Composite Steel Scrap Cost
The Ironmaking Process Operating Cost details are summarized in Appendix F-4 for the following process scenarios:
\\Da0002\01052901\common\DOE REPORT OCT 2000\Section 2.doc Page 25 of 33
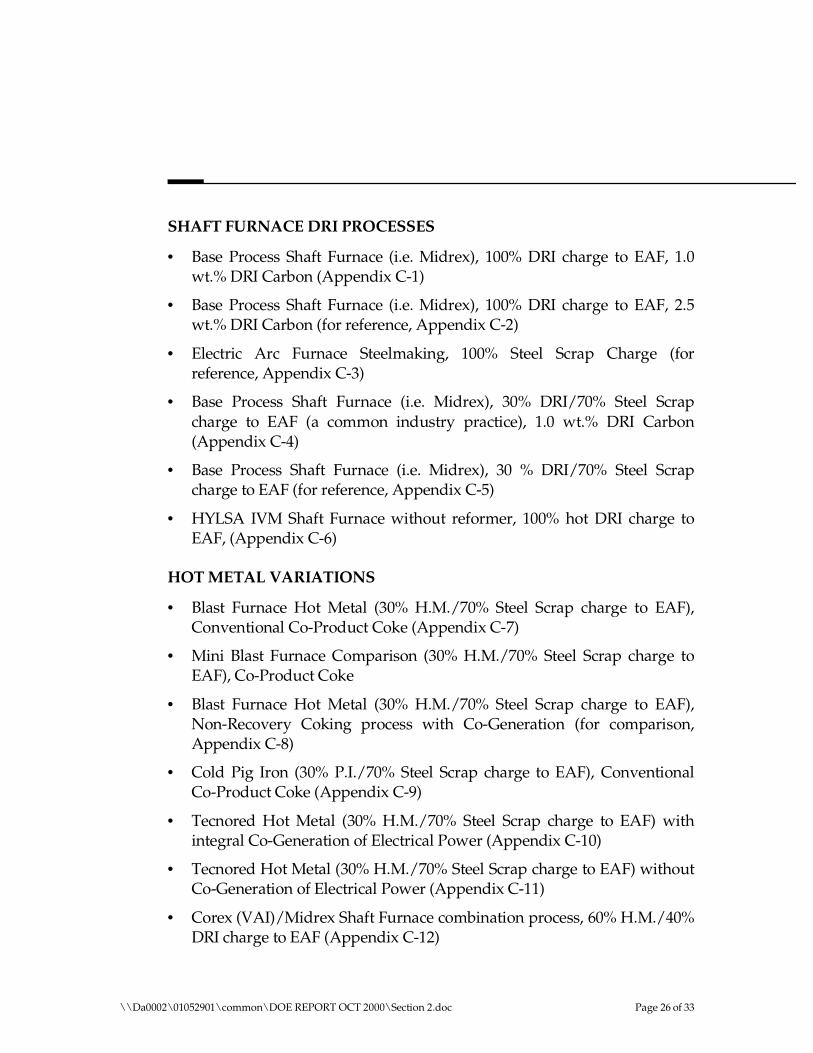
SHAFT FURNACE DRI PROCESSES
• Base Process Shaft Furnace (i.e. Midrex), 100% DRI charge to EAF, 1.0 wt.% DRI Carbon (Appendix C-1)
• Base Process Shaft Furnace (i.e. Midrex), 100% DRI charge to EAF, 2.5 wt.% DRI Carbon (for reference, Appendix C-2)
• Electric Arc Furnace Steelmaking, 100% Steel Scrap Charge (for reference, Appendix C-3)
• Base Process Shaft Furnace (i.e. Midrex), 30% DRI/70% Steel Scrap charge to EAF (a common industry practice), 1.0 wt.% DRI Carbon (Appendix C-4)
• Base Process Shaft Furnace (i.e. Midrex), 30 % DRI/70% Steel Scrap charge to EAF (for reference, Appendix C-5)
• HYLSA IVM Shaft Furnace without reformer, 100% hot DRI charge to EAF, (Appendix C-6)
HOT METAL VARIATIONS
• Blast Furnace Hot Metal (30% H.M./70% Steel Scrap charge to EAF), Conventional Co-Product Coke (Appendix C-7)
• Mini Blast Furnace Comparison (30% H.M./70% Steel Scrap charge to EAF), Co-Product Coke
• Blast Furnace Hot Metal (30% H.M./70% Steel Scrap charge to EAF), Non-Recovery Coking process with Co-Generation (for comparison, Appendix C-8)
• Cold Pig Iron (30% P.I./70% Steel Scrap charge to EAF), Conventional Co-Product Coke (Appendix C-9)
• Tecnored Hot Metal (30% H.M./70% Steel Scrap charge to EAF) with integral Co-Generation of Electrical Power (Appendix C-10)
• Tecnored Hot Metal (30% H.M./70% Steel Scrap charge to EAF) without Co-Generation of Electrical Power (Appendix C-11)
• Corex (VAI)/Midrex Shaft Furnace combination process, 60% H.M./40% DRI charge to EAF (Appendix C-12)
\\Da0002\01052901\common\DOE REPORT OCT 2000\Section 2.doc Page 26 of 33
• HiSmelt Enriched Oxygen Reactor Process, 32.7% H.M. feed to EAF (Appendix C-13)
ROTARY HEARTH DRI FURNACES
• REDSMELT (Mannessmann) process to produce RHF DRI, Hot Metal utilizing a SAF, recycle scrap only charge to EAF (Appendix C-14)
• MauMee Research & Engineering Briquette DRI charge (100% with only recycle scrap charge to EAF) (Appendix C-15)
• ITMK3 (Midrex RHF) process producing reduced shot iron pellets charge to Melter/EAF (100% with only recycle scrap charge to EAF) (Appendix C-16) (Note: Other Rotary Hearth Processes, e.g. Inmetco, Iron Dynamics, FastMet/FastMelt, etc. are so generically similar to those above, that they were not individually considered.)
FLUID-BED DRI/HBI
• Circored (Lurgi) natural gas based circulating fluid bed/bubbling bed fine ore process with 100% HBI charge to EAF (Appendix C-17)
• Circofer (Lurgi) fine coal and fine ore circulating fluid bed/bubbling bed with HBI charge to SAF and low-carbon, low-Si H.M. charge to EAF (Appendix C-18)
• Finmet (VAI) multi-stage fluidized bed fine ore process, natural gas based, 100% HBI charge to EAF (Appendix C-19)
• Generic Iron Carbide Process (to represent all process variations and/or configurations) with 100% IC charge to EAF (Appendix C-20)
• Generic Iron Carbide Process with 40% IC/60% Scrap charge to EAF (considered to be a practical limit for charging iron carbide to the EAF)
OTHER PROCESSES
• SL/RN (Stelco-Lurgi) Rotary Kiln reduction process to produce 100% sponge iron charge to EAF with only recycled Scrap (Appendix C-21)
\\Da0002\01052901\common\DOE REPORT OCT 2000\Section 2.doc Page 27 of 33
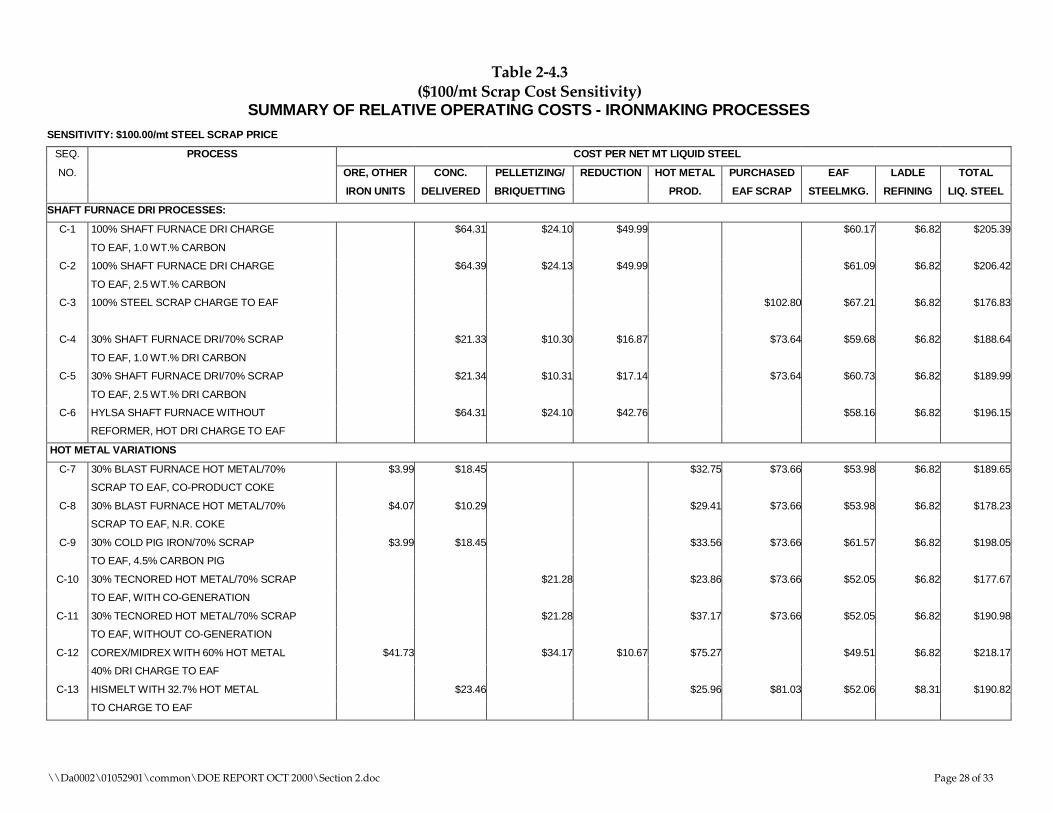
Table 2-4.3 ($100/mt Scrap Cost Sensitivity)
SUMMARY OF RELATIVE OPERATING COSTS - IRONMAKING PROCESSES
SENSITIVITY: $100.00/mt STEEL SCRAP PRICE
SEQ.
NO.
PROCESS COST PER NET MT LIQUID STEEL
ORE, OTHER
IRON UNITS
CONC.
DELIVERED
PELLETIZING/
BRIQUETTING
REDUCTION HOT METAL
PROD.
PURCHASED
EAF SCRAP
EAF
STEELMKG.
LADLE
REFINING
TOTAL
LIQ. STEEL
SHAFT FURNACE DRI PROCESSES:
C-1
C-2
C-3
C-4
C-5
C-6
100% SHAFT FURNACE DRI CHARGE
TO EAF, 1.0 WT.% CARBON
100% SHAFT FURNACE DRI CHARGE
TO EAF, 2.5 WT.% CARBON
100% STEEL SCRAP CHARGE TO EAF
30% SHAFT FURNACE DRI/70% SCRAP
TO EAF, 1.0 WT.% DRI CARBON
30% SHAFT FURNACE DRI/70% SCRAP
TO EAF, 2.5 WT.% DRI CARBON
HYLSA SHAFT FURNACE WITHOUT
REFORMER, HOT DRI CHARGE TO EAF
$64.31
$64.39
$21.33
$21.34
$64.31
$24.10
$24.13
$10.30
$10.31
$24.10
$49.99
$49.99
$16.87
$17.14
$42.76
$102.80
$73.64
$73.64
$60.17
$61.09
$67.21
$59.68
$60.73
$58.16
$6.82
$6.82
$6.82
$6.82
$6.82
$6.82
$205.39
$206.42
$176.83
$188.64
$189.99
$196.15
HOT METAL VARIATIONS
C-7
C-8
C-9
C-10
C-11
C-12
C-13
30% BLAST FURNACE HOT METAL/70%
SCRAP TO EAF, CO-PRODUCT COKE
30% BLAST FURNACE HOT METAL/70%
SCRAP TO EAF, N.R. COKE
30% COLD PIG IRON/70% SCRAP
TO EAF, 4.5% CARBON PIG
30% TECNORED HOT METAL/70% SCRAP
TO EAF, WITH CO-GENERATION
30% TECNORED HOT METAL/70% SCRAP
TO EAF, WITHOUT CO-GENERATION
COREX/MIDREX WITH 60% HOT METAL
40% DRI CHARGE TO EAF
HISMELT WITH 32.7% HOT METAL
TO CHARGE TO EAF
$3.99
$4.07
$3.99
$41.73
$18.45
$10.29
$18.45
$23.46
$21.28
$21.28
$34.17 $10.67
$32.75
$29.41
$33.56
$23.86
$37.17
$75.27
$25.96
$73.66
$73.66
$73.66
$73.66
$73.66
$81.03
$53.98
$53.98
$61.57
$52.05
$52.05
$49.51
$52.06
$6.82
$6.82
$6.82
$6.82
$6.82
$6.82
$8.31
$189.65
$178.23
$198.05
$177.67
$190.98
$218.17
$190.82
\\Da0002\01052901\common\DOE REPORT OCT 2000\Section 2.doc Page 28 of 33

SUMMARY OF RELATIVE OPERATING COSTS - IRONMAKING PROCESSES
SENSITIVITY: $100.00/mt STEEL SCRAP PRICE
SEQ.
NO.
PROCESS COST PER NET MT LIQUID STEEL
ORE, OTHER
IRON UNITS
CONC.
DELIVERED
PELLETIZING/
BRIQUETTING
REDUCTION HOT METAL
PROD.
PURCHASED
EAF SCRAP
EAF
STEELMKG.
LADLE
REFINING
TOTAL
LIQ. STEEL
ROTARY HEARTH FURNACES
C-14
C-15
C-16
REDSMELT HOT METAL WITH ONLY
RECYCLE SCRAP CHARGE TO EAF
MAUMEE BRIQUETTE DRI/EAF WITH
ONLY RECYCLE SCRAP CHARGE TO EAF
ITMK3 TO EAF WITH ONLY
RECYCLE SCRAP CHARGE TO EAF
$30.80
$32.41
$30.80
$31.78
$41.93
$38.46
$22.33
$32.60
$30.90
$38.68 $11.81
$11.81
$46.24
$60.97
$58.47
$6.67
$9.12
$8.32
$188.31
$177.03
$178.76
FLUID-BED DRI/HBI
C-17
C-18
C-19
C-20a
C-20b
CIRCORED/HBI/EAF WITH ONLY
RECYCLE SCRAP CHARGE TO EAF
CIRCOFER/HBI/SAF/EAF WITH ONLY
RECYCLE SCRAP CHARGE TO EAF
FINMET/HBI/EAF WITH ONLY
RECYCLE SCRAP CHARGE TO EAF
GENERIC IRON CARBIDE/EAF
RECYCLE SCRAP CHARGE TO EAF
GENERIC IRON CARBIDE/SAF/EAF
60% SCRAP CHARGE TO EAF
$37.95
$36.80
$37.11
$36.05
$14.42
$7.58
$15.08
$6.77
$78.22
$51.00
$79.72
$81.34
$32.54
$38.68
$17.01 $63.75
$55.60
$40.33
$55.60
$54.53
$45.52
$5.92
$6.66
$5.92
$5.92
$6.66
$185.27
$188.55
$185.12
$177.84
$179.90
OTHER PROCESSES
C-21 SL/RN ROTARY KILN WITH ONLY
RECYCLE SCRAP CHARGE TO EAF
$28.73 $49.07 $20.31 $11.81 $61.73 $9.09 $180.74
\\Da0002\01052901\common\DOE REPORT OCT 2000\Section 2.doc Page 29 of 33

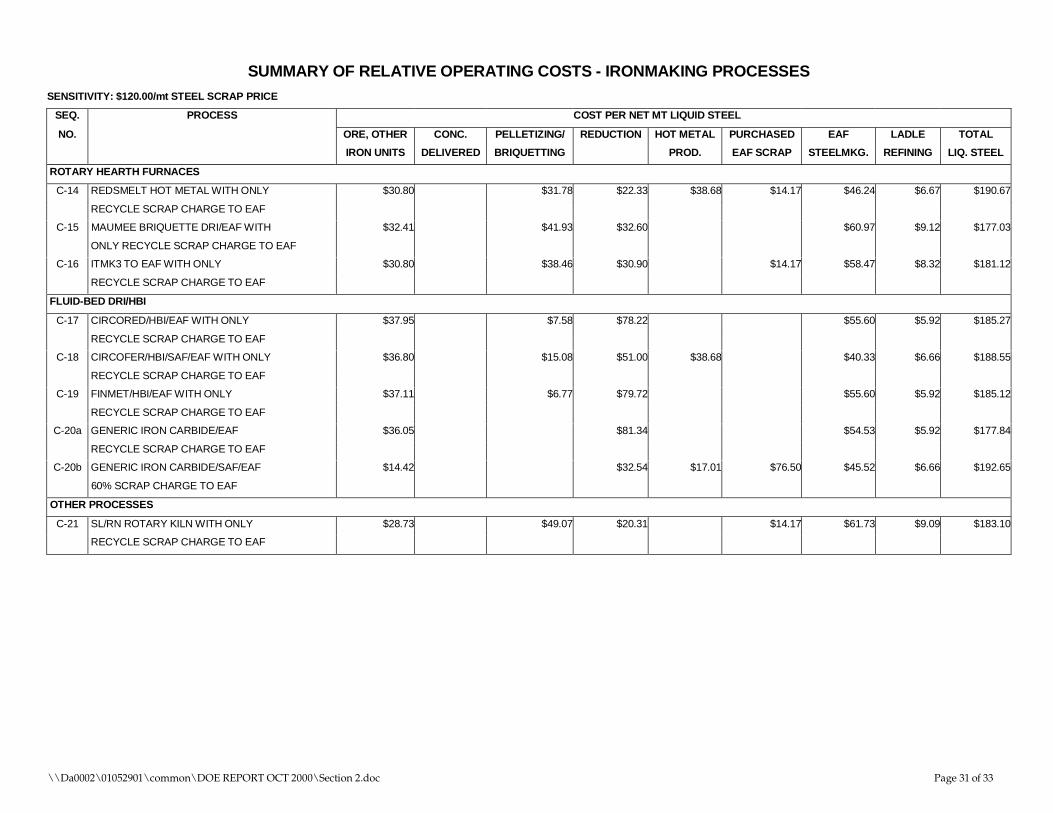
Table 2-4.4 ($120/mt Scrap Cost Sensitivity)
SUMMARY OF RELATIVE OPERATING COSTS - IRONMAKING PROCESSES
SENSITIVITY: $120.00/mt STEEL SCRAP PRICE
SEQ.
NO.
PROCESS COST PER NET MT LIQUID STEEL
ORE, OTHER
IRON UNITS
CONC.
DELIVERED
PELLETIZING/
BRIQUETTING
REDUCTION HOT METAL
PROD.
PURCHASED
EAF SCRAP
EAF
STEELMKG.
LADLE
REFINING
TOTAL
LIQ. STEEL
SHAFT FURNACE DRI PROCESSES:
C-1
C-2
C-3
C-4
C-5
C-6
100% SHAFT FURNACE DRI CHARGE
TO EAF, 1.0 WT.% CARBON
100% SHAFT FURNACE DRI CHARGE
TO EAF, 2.5 WT.% CARBON
100% STEEL SCRAP CHARGE TO EAF
30% SHAFT FURNACE DRI/70% SCRAP
TO EAF, 1.0 WT.% DRI CARBON
30% SHAFT FURNACE DRI/70% SCRAP
TO EAF, 2.5 WT.% DRI CARBON
HYLSA SHAFT FURNACE WITHOUT
REFORMER, HOT DRI CHARGE TO EAF
$64.31
$64.39
$21.33
$21.34
$64.31
$24.10
$24.13
$10.30
$10.31
$24.10
$49.99
$49.99
$16.87
$17.14
$42.76
$123.36
$88.36
$88.37
$60.17
$61.09
$67.21
$59.68
$60.73
$58.16
$6.82
$6.82
$6.82
$6.82
$6.82
$6.82
$205.39
$206.42
$197.39
$203.36
$204.72
$196.15
HOT METAL VARIATIONS
C-7
C-8
C-9
C-10
C-11
C-12
C-13
30% BLAST FURNACE HOT METAL/70%
SCRAP TO EAF, CO-PRODUCT COKE
30% BLAST FURNACE HOT METAL/70%
SCRAP TO EAF, N.R. COKE
30% COLD PIG IRON/70% SCRAP
TO EAF, 4.5% CARBON PIG
30% TECNORED HOT METAL/70% SCRAP
TO EAF, WITH CO-GENERATION
30% TECNORED HOT METAL/70% SCRAP
TO EAF, WITHOUT CO-GENERATION
COREX/MIDREX WITH 60% HOT METAL
40% DRI CHARGE TO EAF
HISMELT WITH 32.7% HOT METAL
TO CHARGE TO EAF
$3.99
$4.07
$3.99
$41.73
$18.45
$10.29
$18.45
$23.46
$21.28
$21.28
$34.17 $10.67
$32.75
$29.41
$33.56
$23.86
$37.17
$75.27
$25.96
$88.40
$88.40
$88.40
$88.40
$88.40
$88.40
$53.98
$53.98
$61.57
$52.05
$52.05
$49.51
$52.06
$6.82
$6.82
$6.82
$6.82
$6.82
$6.82
$8.31
$204.39
$192.97
$212.79
$192.41
$205.72
$218.17
$198.19
\\Da0002\01052901\common\DOE REPORT OCT 2000\Section 2.doc Page 30 of 33
SUMMARY OF RELATIVE OPERATING COSTS - IRONMAKING PROCESSES
SENSITIVITY: $120.00/mt STEEL SCRAP PRICE
SEQ.
NO.
PROCESS COST PER NET MT LIQUID STEEL
ORE, OTHER
IRON UNITS
CONC.
DELIVERED
PELLETIZING/
BRIQUETTING
REDUCTION HOT METAL
PROD.
PURCHASED
EAF SCRAP
EAF
STEELMKG.
LADLE
REFINING
TOTAL
LIQ. STEEL
ROTARY HEARTH FURNACES
C-14
C-15
C-16
REDSMELT HOT METAL WITH ONLY
RECYCLE SCRAP CHARGE TO EAF
MAUMEE BRIQUETTE DRI/EAF WITH
ONLY RECYCLE SCRAP CHARGE TO EAF
ITMK3 TO EAF WITH ONLY
RECYCLE SCRAP CHARGE TO EAF
$30.80
$32.41
$30.80
$31.78
$41.93
$38.46
$22.33
$32.60
$30.90
$38.68 $14.17
$14.17
$46.24
$60.97
$58.47
$6.67
$9.12
$8.32
$190.67
$177.03
$181.12
FLUID-BED DRI/HBI
C-17
C-18
C-19
C-20a
C-20b
CIRCORED/HBI/EAF WITH ONLY
RECYCLE SCRAP CHARGE TO EAF
CIRCOFER/HBI/SAF/EAF WITH ONLY
RECYCLE SCRAP CHARGE TO EAF
FINMET/HBI/EAF WITH ONLY
RECYCLE SCRAP CHARGE TO EAF
GENERIC IRON CARBIDE/EAF
RECYCLE SCRAP CHARGE TO EAF
GENERIC IRON CARBIDE/SAF/EAF
60% SCRAP CHARGE TO EAF
$37.95
$36.80
$37.11
$36.05
$14.42
$7.58
$15.08
$6.77
$78.22
$51.00
$79.72
$81.34
$32.54
$38.68
$17.01 $76.50
$55.60
$40.33
$55.60
$54.53
$45.52
$5.92
$6.66
$5.92
$5.92
$6.66
$185.27
$188.55
$185.12
$177.84
$192.65
OTHER PROCESSES
C-21 SL/RN ROTARY KILN WITH ONLY
RECYCLE SCRAP CHARGE TO EAF
$28.73 $49.07 $20.31 $14.17 $61.73 $9.09 $183.10
\\Da0002\01052901\common\DOE REPORT OCT 2000\Section 2.doc Page 31 of 33
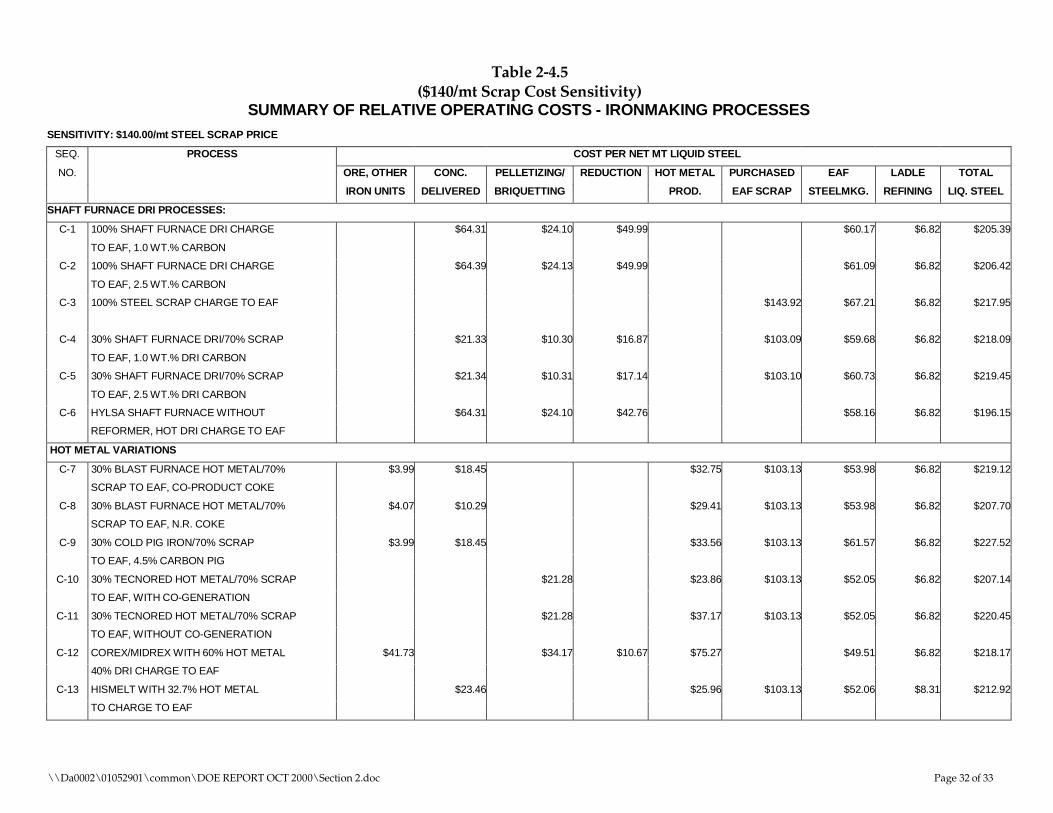
Table 2-4.5 ($140/mt Scrap Cost Sensitivity)
SUMMARY OF RELATIVE OPERATING COSTS - IRONMAKING PROCESSES
SENSITIVITY: $140.00/mt STEEL SCRAP PRICE
SEQ.
NO.
PROCESS COST PER NET MT LIQUID STEEL
ORE, OTHER
IRON UNITS
CONC.
DELIVERED
PELLETIZING/
BRIQUETTING
REDUCTION HOT METAL
PROD.
PURCHASED
EAF SCRAP
EAF
STEELMKG.
LADLE
REFINING
TOTAL
LIQ. STEEL
SHAFT FURNACE DRI PROCESSES:
C-1
C-2
C-3
C-4
C-5
C-6
100% SHAFT FURNACE DRI CHARGE
TO EAF, 1.0 WT.% CARBON
100% SHAFT FURNACE DRI CHARGE
TO EAF, 2.5 WT.% CARBON
100% STEEL SCRAP CHARGE TO EAF
30% SHAFT FURNACE DRI/70% SCRAP
TO EAF, 1.0 WT.% DRI CARBON
30% SHAFT FURNACE DRI/70% SCRAP
TO EAF, 2.5 WT.% DRI CARBON
HYLSA SHAFT FURNACE WITHOUT
REFORMER, HOT DRI CHARGE TO EAF
$64.31
$64.39
$21.33
$21.34
$64.31
$24.10
$24.13
$10.30
$10.31
$24.10
$49.99
$49.99
$16.87
$17.14
$42.76
$143.92
$103.09
$103.10
$60.17
$61.09
$67.21
$59.68
$60.73
$58.16
$6.82
$6.82
$6.82
$6.82
$6.82
$6.82
$205.39
$206.42
$217.95
$218.09
$219.45
$196.15
HOT METAL VARIATIONS
C-7
C-8
C-9
C-10
C-11
C-12
C-13
30% BLAST FURNACE HOT METAL/70%
SCRAP TO EAF, CO-PRODUCT COKE
30% BLAST FURNACE HOT METAL/70%
SCRAP TO EAF, N.R. COKE
30% COLD PIG IRON/70% SCRAP
TO EAF, 4.5% CARBON PIG
30% TECNORED HOT METAL/70% SCRAP
TO EAF, WITH CO-GENERATION
30% TECNORED HOT METAL/70% SCRAP
TO EAF, WITHOUT CO-GENERATION
COREX/MIDREX WITH 60% HOT METAL
40% DRI CHARGE TO EAF
HISMELT WITH 32.7% HOT METAL
TO CHARGE TO EAF
$3.99
$4.07
$3.99
$41.73
$18.45
$10.29
$18.45
$23.46
$21.28
$21.28
$34.17 $10.67
$32.75
$29.41
$33.56
$23.86
$37.17
$75.27
$25.96
$103.13
$103.13
$103.13
$103.13
$103.13
$103.13
$53.98
$53.98
$61.57
$52.05
$52.05
$49.51
$52.06
$6.82
$6.82
$6.82
$6.82
$6.82
$6.82
$8.31
$219.12
$207.70
$227.52
$207.14
$220.45
$218.17
$212.92
\\Da0002\01052901\common\DOE REPORT OCT 2000\Section 2.doc Page 32 of 33
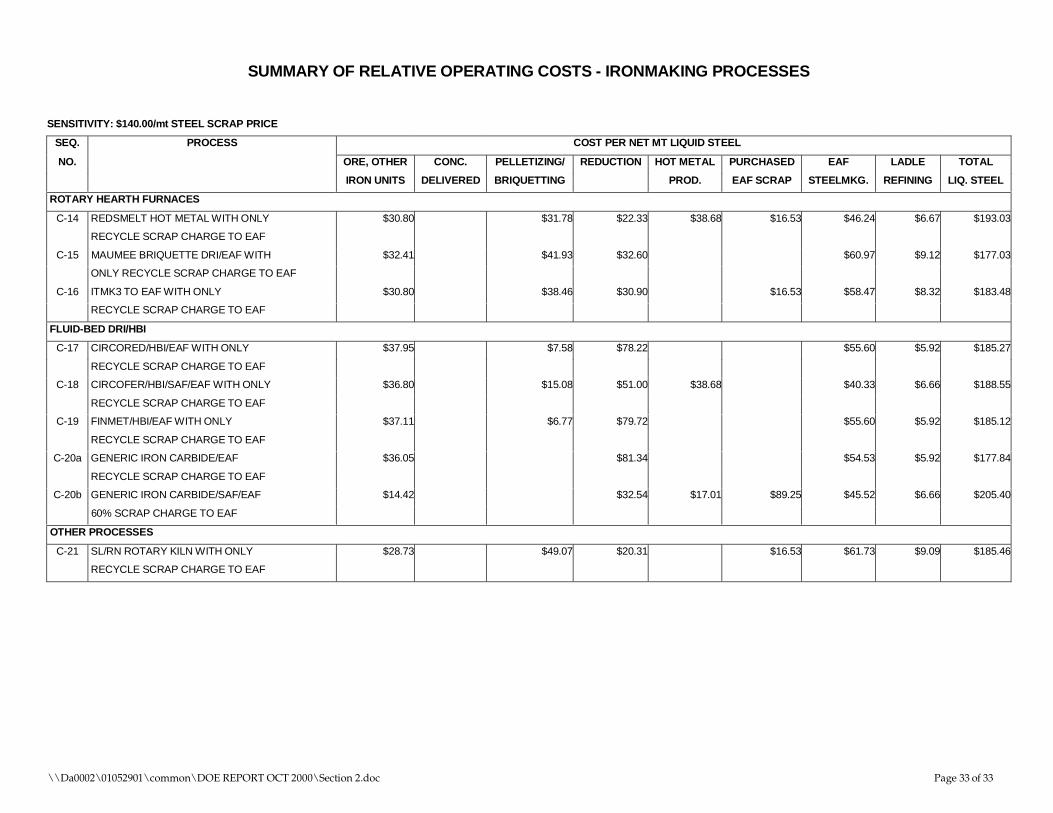
SUMMARY OF RELATIVE OPERATING COSTS - IRONMAKING PROCESSES
SENSITIVITY: $140.00/mt STEEL SCRAP PRICE
SEQ.
NO.
PROCESS COST PER NET MT LIQUID STEEL
ORE, OTHER
IRON UNITS
CONC.
DELIVERED
PELLETIZING/
BRIQUETTING
REDUCTION HOT METAL
PROD.
PURCHASED
EAF SCRAP
EAF
STEELMKG.
LADLE
REFINING
TOTAL
LIQ. STEEL
ROTARY HEARTH FURNACES
C-14
C-15
C-16
REDSMELT HOT METAL WITH ONLY
RECYCLE SCRAP CHARGE TO EAF
MAUMEE BRIQUETTE DRI/EAF WITH
ONLY RECYCLE SCRAP CHARGE TO EAF
ITMK3 TO EAF WITH ONLY
RECYCLE SCRAP CHARGE TO EAF
$30.80
$32.41
$30.80
$31.78
$41.93
$38.46
$22.33
$32.60
$30.90
$38.68 $16.53
$16.53
$46.24
$60.97
$58.47
$6.67
$9.12
$8.32
$193.03
$177.03
$183.48
FLUID-BED DRI/HBI
C-17
C-18
C-19
C-20a
C-20b
CIRCORED/HBI/EAF WITH ONLY
RECYCLE SCRAP CHARGE TO EAF
CIRCOFER/HBI/SAF/EAF WITH ONLY
RECYCLE SCRAP CHARGE TO EAF
FINMET/HBI/EAF WITH ONLY
RECYCLE SCRAP CHARGE TO EAF
GENERIC IRON CARBIDE/EAF
RECYCLE SCRAP CHARGE TO EAF
GENERIC IRON CARBIDE/SAF/EAF
60% SCRAP CHARGE TO EAF
$37.95
$36.80
$37.11
$36.05
$14.42
$7.58
$15.08
$6.77
$78.22
$51.00
$79.72
$81.34
$32.54
$38.68
$17.01 $89.25
$55.60
$40.33
$55.60
$54.53
$45.52
$5.92
$6.66
$5.92
$5.92
$6.66
$185.27
$188.55
$185.12
$177.84
$205.40
OTHER PROCESSES
C-21 SL/RN ROTARY KILN WITH ONLY
RECYCLE SCRAP CHARGE TO EAF
$28.73 $49.07 $20.31 $16.53 $61.73 $9.09 $185.46
\\Da0002\01052901\common\DOE REPORT OCT 2000\Section 2.doc Page 33 of 33
Section 3: Ironmaking Process Discussion and Grouping
3.1 Processes Considered and Initial Screening
The goal of the Alternative Ironmaking Process Study was to analyze a number of different ironmaking processes in a manner to evaluate their individual potential and to provide a consistent method for relative comparison. To compare the processes given the diverse nature of the types of iron unit products that were produced and differing percentages of those iron units being utilized to produce steel, it was decided to normalize each ironmaking process by integrating it with an Electric Arc Furnace (EAF) steelmaking scenario. A net production of 1.0 MM tonnes of Refined Liquid Steel (as produced by the EAF/LRF process) was the normalized final product on which the processes were compared. In this fashion various proportions of the iron production and various states of the iron (e.g. as hot metal, cold pig iron, direct reduced iron, etc.) could be compared utilizing a typical commercial scenario.
It was the intent from the outset of the Study to compare proven commercial process with evolving or “first-of-a-kind” technologies not yet commercially proven. In addition, conceptual processes or those being researched and developed into potentially viable technologies were also given consideration in the Study. An initial screening and judgmental evaluation of the processes and potential production scenarios resulted in approximately 20 Ironmaking production scenarios that were selected to be evaluated and compared in more detail.
The heat and mass balance modeling techniques discussed in Section 2-2 were utilized to develop bases for Capital and Operating Cost estimates, definition of cumulative emissions as represented by carbon gas (as CO2) and cumulative electrical power consumption. To combine the impacts of Capital and Operating Costs, a simple Internal Rate of Return (IRR) calculation was made for each of the processes. These and other variables relating to the Iron and Steelmaking production scenarios for each process were used as a basis for comparison and ranking.
\\Da0002\01052901\common\DOE REPORT OCT 2000\Section 3.doc Page 1 of 50
3-1.1 Processes Considered in Initial Screening
TYPE STATE OF DEVELOPMENT
SHAFT FURNACE • Blast Furnace • Corex • Midrex • Hylsa (HYLIII, HYLIVM, etc.) • Tecnored ROTARY KILN • SL/RN ROTARY HEARTH • Redsmelt • Fastmet/Fastmelt • Itmk3 • Inmetco • Iron Dynamics • MauMee FLUIDIZED BED • Finmet • Circored • Circofer • Nucor/ICH (Single-Stage IC) • Qualitech/Kawasaki (Two-Stage IC) • Procedyne (Multi-stage IC) OTHER (REACTOR ETC.) • Hismelt • Dios • Romelt • Gridsmelter • Comet • PlasmaRed • AISI/Cyclone
Proven CommercialProven CommercialProven CommercialProven CommercialPilot Scale
Proven Commercial
Semi-CommercialPilot ScalePilot ScaleSemi-CommercialSemi-CommercialSemi-Commercial
Semi-CommercialSemi-CommercialSemi-Pilot ComponentDemonstrationDemonstrationSemi-Pilot Component
Pilot ScalePilot ScalePilot ScaleSemi-Pilot ComponentSemi-Pilot ComponentSemi-Pilot ComponentPilot Scale
\\Da0002\01052901\common\DOE REPORT OCT 2000\Section 3.doc Page 2 of 50
The distinction above is:
• Proven Commercial The process is operating commercially in more than one economically-viable installation.
• Semi-Commercial The process is undergoing startup in a first-of-a-kind commercial scale installation or is still in process demonstration phase.
• Demonstration The process has operated at a first-of-a-kind commercial scale, but is no longer being operated.
• Pilot Scale The process has been operated at an integrated pilot scale.
• Semi-Pilot Component Parts of the process have been operated at a pilot scale.
In an initial evaluation and screening of the above processes, it was determined that some of the processes could not be definitively compared since not enough open information was available to close an energy and mass balance. Sparse data that were available for such processes, in some cases, did not indicate that there was a sufficient incentive to attempt to evaluate in detail.
In other cases, the Ironmaking processes were not at a sufficient stage of development or had a potential economic advantage to warrant further consideration. An example of this was the production of Direct Reduced Iron at a high carbon content (i.e. at 2.5 wt.% C versus 1.0 wt.% C) in the shaft furnace (Midrex or Hylsa) processes. Changes in kinetics and reduction gas composition requirements to achieve the higher-carbon DRI product (some as iron carbide) did not indicate that there was a significant advantage over the lower Carbon DRI product when used for EAF/LRF steelmaking.
In some cases, in particular the rotary hearth, oxygen reactor types and iron carbide processes, the Ironmaking processes of several Vendors were sufficiently similar as to not warrant separate treatment. Therefore, a typical Ironmaking process or a generic process was selected for the comparative evaluation.
\\Da0002\01052901\common\DOE REPORT OCT 2000\Section 3.doc Page 3 of 50
It should be noted that a number of Oxygen Reactor-based processes have been tested and are under investigation. There were typically not enough detailed operating and/or complete process descriptions available to define these processes with enough detail to be at the same level of precision as the other, more-conventional, Ironmaking processes. The Hismelt process was selected for further evaluation and is deemed to be typical of this group. Others may have better, or less favorable, attributes, but could not be further explored or compared with the other Ironmaking processes.
A number of Plasma-based processes were also initially considered. The Author has personal process development experience in Direct Plasma ore reduction and/or melting processes. Lockwood Greene has also had confidential discussions with Plasma-Met Technology; thus there is an internal base of information on such processes. However, the extraordinary electrical power requirements for these processes and low efficiency (not rigorously defined, but estimated from available data) did not indicate any competitive potential. As a group, these were not selected for further definition or evaluation.
An abridged list of Ironmaking process scenarios for further evaluation and comparison was selected. These are the ones for which the detailed comparisons and ranking analyses were done (See Section 4).
3-1.2 Process Scenarios Selected:
SHAFT FURNACE DRI – VARIATION IN CARBON AND SCRAP CHARGE
• Base Case: 100% Shaft Furnace DRI (i.e. Midrex) Charge to EAF, 1.0 wt.% DRI (Recycle Steel Scrap Only)
• 100% Steel Scrap Charge to EAF (For Reference Only)
• 30% Shaft Furnace DRI/70% Scrap Charge to EAF (a Common Industry Practice), 1.0 wt.% DRI Carbon
• Hylsa Shaft Furnace Without Reformer (HYL IVM), Hot DRI Charge to EAF
\\Da0002\01052901\common\DOE REPORT OCT 2000\Section 3.doc Page 4 of 50

HOT METAL VARIATIONS
• 30% Blast Furnace Hot Metal/70% Scrap Charge to EAF, Co-Product Coke
• Mini Blast Furnace Comparison @ 30% H.M./70% Scrap Charge to EAF, Co-Product Coke
• 30% Blast Furnace Hot Metal/70% Scrap Charge to EAF, Continuous Non-Recovery Coke with Co-Generation of Electric Power
• 30% Cold Pig Iron/70% Scrap Charge to EAF, 4.5% Carbon
• 30% Tecnored Hot Metal/70% Scrap Charge to EAF, 4.5% Carbon H.M. With Integral Co-Generation of Electrical Power
• 30% Tecnored Hot Metal/70% Scrap Charge to EAF, 4.5% Carbon H.M. Without Co-Generation of Electrical Power
• Corex (VAI)/Midrex with 60% Hot Metal and 40% DRI Charge to EAF
• HiSmelt (ISCON) with 34.5% Hot Metal Charge to EAF
ROTARY HEARTH FURNACES
• Redsmelt (Mannesmann) Hot Metal With Only Recycle Scrap Charge to EAF
• MauMee R&E Briquette DRI/EAF With Only Recycle Scrap Charge to EAF
• ITMK3 (Midrex RHF) to EAF With Only Recycle Scrap Charge to EAF
FLUID-BED DRI/HBI
• Circored (Lurgi)/HBI/EAF With Only Recycle Scrap Charge to
• Circofer (Lurgi)/HBI/SAF/EAF With Only Recycle Scrap Charge to EAF
• Finmet (VAI)/HBI/EAF With Only Recycle Scrap Charge to EAF
• Generic Iron Carbide (ICH)/EAF With Only Recycle Scrap to EAF (Represents Nucor/ICH, Qualitech/Kawasaki, Procedyne Processes)
• 40% Iron Carbide Charge/60% Scrap to EAF (Believed to be Maximum Practical or Feasible Charge Ratio)
\\Da0002\01052901\common\DOE REPORT OCT 2000\Section 3.doc Page 5 of 50
OTHER PROCESSES • SL/RN (Stelco-Lurgi) Rotary Kiln With Only Recycle Scrap Charge to
EAF
3-2: Process Descriptions and Flow Diagrams
The following are brief descriptions and pictorial Process Flow Diagrams of Selected Ironmaking Processes:
3-2.1 SHAFT FURNACE PROCESSES:
Blast Furnace
PROCESS BACKGROUND:The blast furnace process is based upon a moving bed reduction furnacewhich reduces iron ore with coke and limestone. Reduction is carried out attypical reduction temperatures. The process produces liquid pig iron.
PROCESS DESCRIPTION:The blast furnace process consists of weighing of the burden, charging ofthe blast furnace, hot product dispersal from the blast furnace and offgascleanup system. The blast furnace is a tall shaft-type furnace with a verticalstack superimposed over a crucible-like hearth. Iron bearing materials (ironore, sinter, pellets, mill scale, steelmaking slag, scrap, etc.), coke and flux(limestone and dolomite) are charged into the top of the shaft. A blast ofheated air and also, in most cases, a gaseous, liquid or powdered fuel areintroduced through openings at the bottom of the shaft just above the hearthcrucible. The heated air burns the injected fuel and most of the coke chargedin from the top to produce the heat required by the process and to providereducing gas that removes oxygen from the ore. The reduced iron melts andruns down to the bottom of the hearth. The flux combines with theimpurities in the ore to produce a slag which also melts and accumulates ontop of the liquid iron in the hearth. The total furnace residence time is about6 to 8 hours. The hot metal produced is sent to a steelmaking shop or a pig-casting machine. The slag goes to a water-spray granulator, a cry slag pit ora slag dump. The gas from the top of the furnace goes through the gascleaning system, and then a portion goes to fire the hot blast stoves with thebalance being used in other parts of the plant. The dust is removed from the
\\Da0002\01052901\common\DOE REPORT OCT 2000\Section 3.doc Page 6 of 50
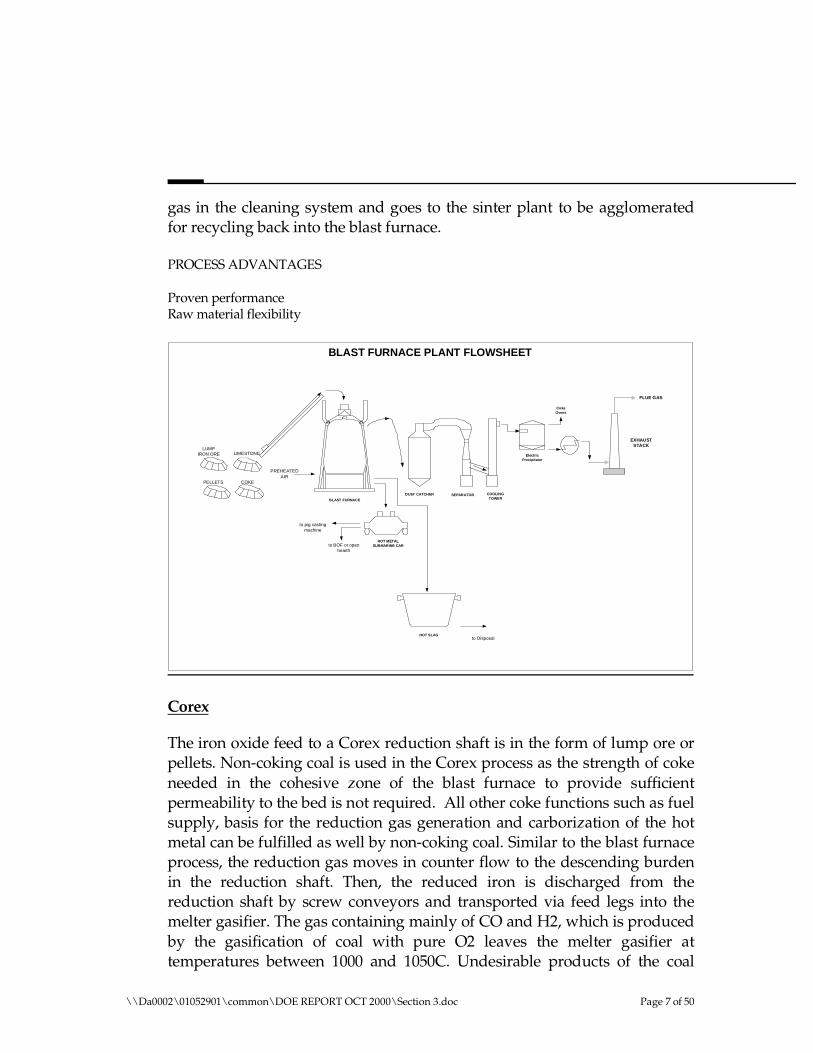
gas in the cleaning system and goes to the sinter plant to be agglomerated for recycling back into the blast furnace.
PROCESS ADVANTAGES
Proven performance Raw material flexibility
BLAST FURNACE PLANT FLOWSHEET
EXHAUST STACK
FLUE GAS
LUMP IRON ORE LIMESTONE
BLAST FURNACE
DUST CATCHER
HOT METAL SUBMARINE CAR
HOT SLAG to Disposal
to BOF or open hearth
to pig casting machine
Electric Precipitator
Co ke Ovens
SEPAR ATOR COOLING TOWER
COKEPELLETS
PREHEATED AIR
Corex
The iron oxide feed to a Corex reduction shaft is in the form of lump ore or pellets. Non-coking coal is used in the Corex process as the strength of coke needed in the cohesive zone of the blast furnace to provide sufficient permeability to the bed is not required. All other coke functions such as fuel supply, basis for the reduction gas generation and carborization of the hot metal can be fulfilled as well by non-coking coal. Similar to the blast furnace process, the reduction gas moves in counter flow to the descending burden in the reduction shaft. Then, the reduced iron is discharged from the reduction shaft by screw conveyors and transported via feed legs into the melter gasifier. The gas containing mainly of CO and H2, which is produced by the gasification of coal with pure O2 leaves the melter gasifier at temperatures between 1000 and 1050C. Undesirable products of the coal
\\Da0002\01052901\common\DOE REPORT OCT 2000\Section 3.doc Page 7 of 50
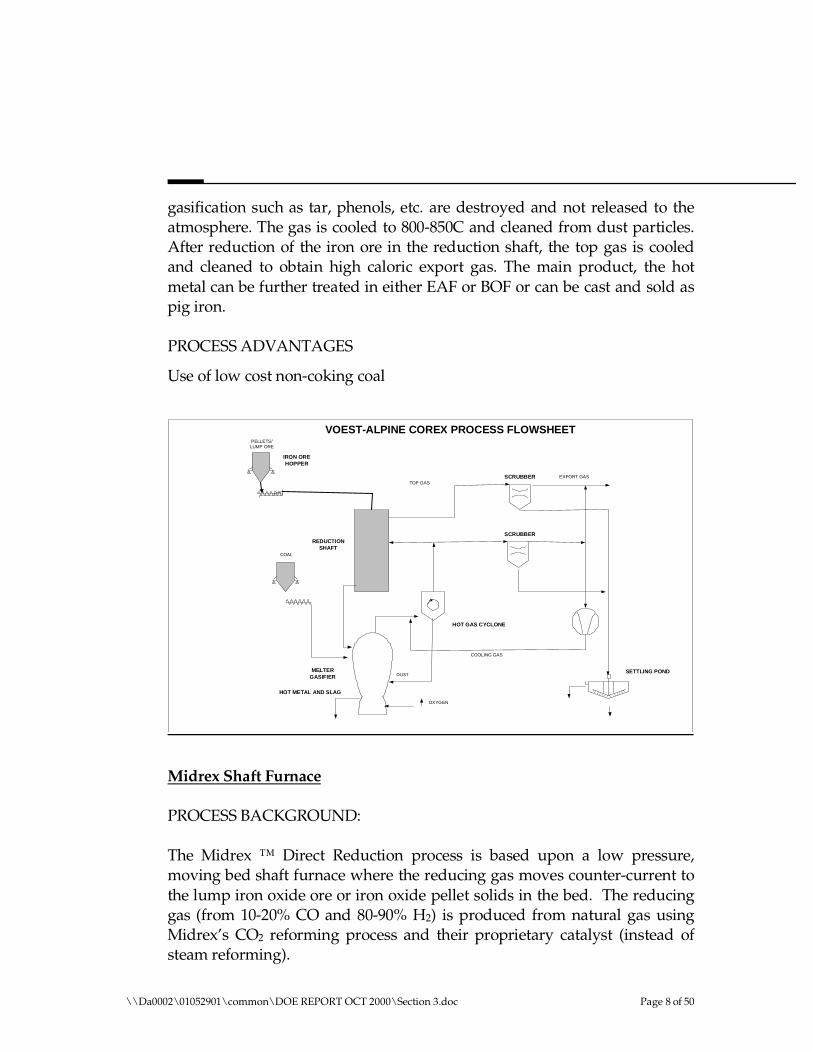
gasification such as tar, phenols, etc. are destroyed and not released to the atmosphere. The gas is cooled to 800-850C and cleaned from dust particles. After reduction of the iron ore in the reduction shaft, the top gas is cooled and cleaned to obtain high caloric export gas. The main product, the hot metal can be further treated in either EAF or BOF or can be cast and sold as pig iron.
PROCESS ADVANTAGES
Use of low cost non-coking coal
IRON ORE HOPPER
VOEST-ALPINE COREX PROCESS FLOWSHEET PELLETS/
LUMP ORE
COAL
OXYG EN
REDUCTION SHAFT
MELTER GASIFIER
HOT METAL AND SLAG
EXPORT GAS TOP GA S
SCRUBBER
HOT GAS CYCLONE
SETTLING POND
SCRUBBER
COOLING GAS
DUST
Midrex Shaft Furnace
PROCESS BACKGROUND:
The Midrex ™ Direct Reduction process is based upon a low pressure, moving bed shaft furnace where the reducing gas moves counter-current to the lump iron oxide ore or iron oxide pellet solids in the bed. The reducing gas (from 10-20% CO and 80-90% H2) is produced from natural gas using Midrex’s CO2 reforming process and their proprietary catalyst (instead of steam reforming).
\\Da0002\01052901\common\DOE REPORT OCT 2000\Section 3.doc Page 8 of 50
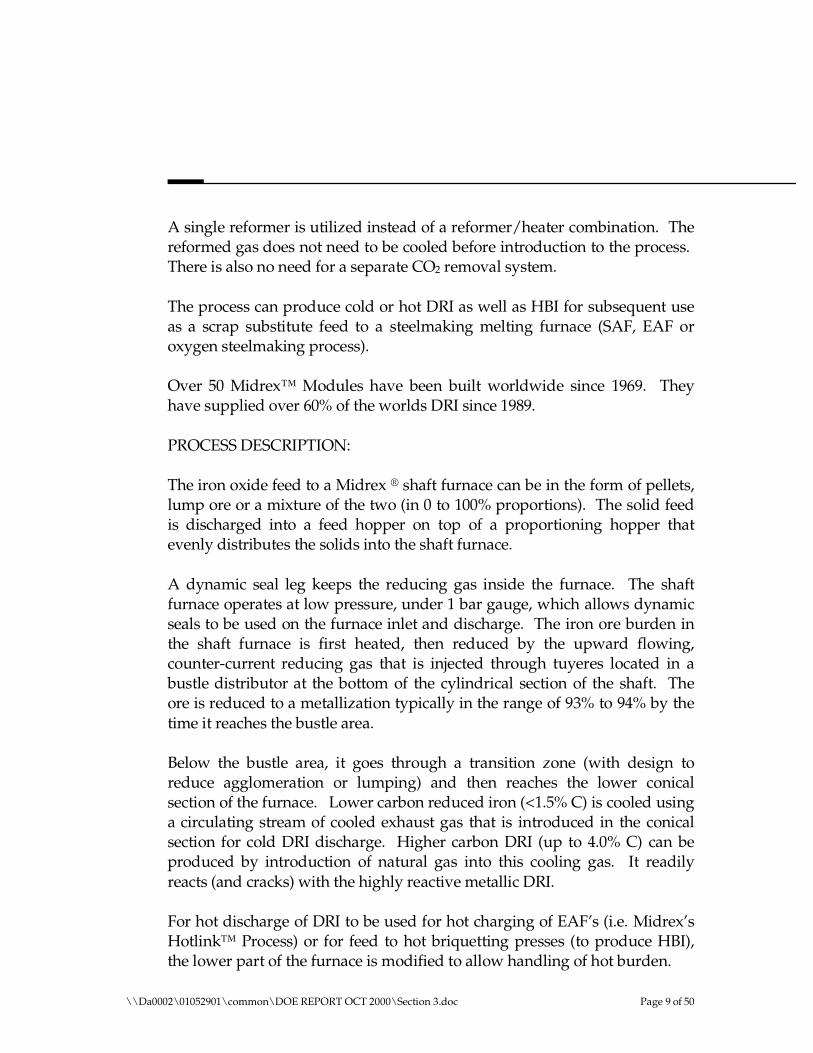
A single reformer is utilized instead of a reformer/heater combination. The reformed gas does not need to be cooled before introduction to the process. There is also no need for a separate CO2 removal system.
The process can produce cold or hot DRI as well as HBI for subsequent use as a scrap substitute feed to a steelmaking melting furnace (SAF, EAF or oxygen steelmaking process).
Over 50 Midrex™ Modules have been built worldwide since 1969. They have supplied over 60% of the worlds DRI since 1989.
PROCESS DESCRIPTION:
The iron oxide feed to a Midrex ® shaft furnace can be in the form of pellets, lump ore or a mixture of the two (in 0 to 100% proportions). The solid feed is discharged into a feed hopper on top of a proportioning hopper that evenly distributes the solids into the shaft furnace.
A dynamic seal leg keeps the reducing gas inside the furnace. The shaft furnace operates at low pressure, under 1 bar gauge, which allows dynamic seals to be used on the furnace inlet and discharge. The iron ore burden in the shaft furnace is first heated, then reduced by the upward flowing, counter-current reducing gas that is injected through tuyeres located in a bustle distributor at the bottom of the cylindrical section of the shaft. The ore is reduced to a metallization typically in the range of 93% to 94% by the time it reaches the bustle area.
Below the bustle area, it goes through a transition zone (with design to reduce agglomeration or lumping) and then reaches the lower conical section of the furnace. Lower carbon reduced iron (<1.5% C) is cooled using a circulating stream of cooled exhaust gas that is introduced in the conical section for cold DRI discharge. Higher carbon DRI (up to 4.0% C) can be produced by introduction of natural gas into this cooling gas. It readily reacts (and cracks) with the highly reactive metallic DRI.
For hot discharge of DRI to be used for hot charging of EAF’s (i.e. Midrex’s Hotlink™ Process) or for feed to hot briquetting presses (to produce HBI), the lower part of the furnace is modified to allow handling of hot burden.
\\Da0002\01052901\common\DOE REPORT OCT 2000\Section 3.doc Page 9 of 50
The Midrex gas generation system consists of a CO2 reformer using their own catalyst. The feed to the reformer is a mixture of process gas recycled from the furnace and makeup natural gas. The top gas leaving the shaft furnace at a temperature of 400 to 450C is cooled and dust is removed in a top gas scrubber. About two-thirds of the gas is recycled back to the process (process gas) and the rest is used as a fuel. The process gas is compressed, mixed with natural gas and is preheated in the reformer recuperator before entering the tubes of the reformer.
The reformed gas comprising of mostly CO and H2 exits the reformer at about 850 °C and passes through collection headers to the reformed gas line. The ratio of H2 to CO is controlled at about 1.5 to 1.8, and reducing quality at 11 to 12 for best operation.
PROCESS ADVANTAGES:
World-wide commercial useProven performance“Relatively-forgiving” operationRaw material flexibilityCO2 reformer eliminates need for steam system, reformed gas quench,reducing gas heating and CO2 removal system.
Shaft Furnace
Process Gas Co m pre ss ors
Top G as Sc ru bb er
Ma in Air Blo we r
Re forme r
Na tu ra l Ga s
Flu e Ga s
E jecto r S tack
Heat Recovery
Fe ed G as
Direct-Redu ced Iro n
Fue l G as
Com bus tio n Air
Flue Ga s
M ID REX PR O CESS FLOW SH EET
Iron Ox id e
Coo lin g Ga s Scr ub be r
Co oling G as Co m pre ss or
Na tu ra l Ga s
Na tural G as
\\Da0002\01052901\common\DOE REPORT OCT 2000\Section 3.doc Page 10 of 50
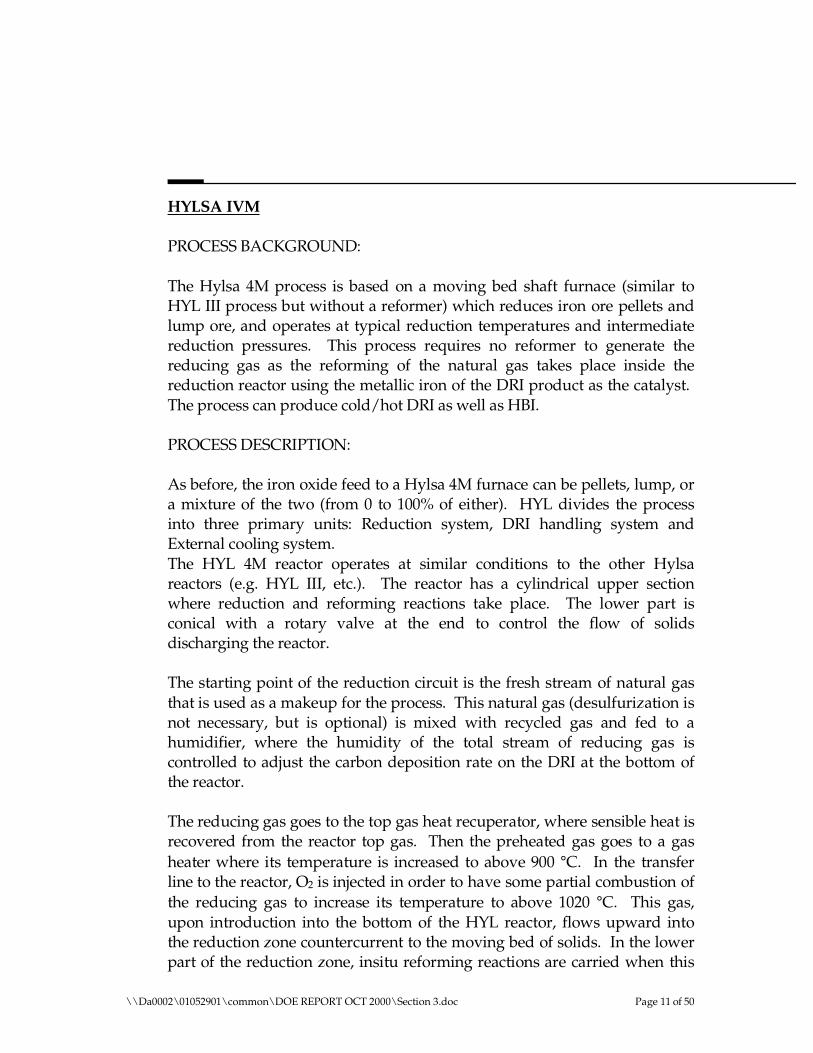
HYLSA IVM
PROCESS BACKGROUND:
The Hylsa 4M process is based on a moving bed shaft furnace (similar toHYL III process but without a reformer) which reduces iron ore pellets andlump ore, and operates at typical reduction temperatures and intermediatereduction pressures. This process requires no reformer to generate thereducing gas as the reforming of the natural gas takes place inside thereduction reactor using the metallic iron of the DRI product as the catalyst.The process can produce cold/hot DRI as well as HBI.
PROCESS DESCRIPTION:
As before, the iron oxide feed to a Hylsa 4M furnace can be pellets, lump, ora mixture of the two (from 0 to 100% of either). HYL divides the processinto three primary units: Reduction system, DRI handling system andExternal cooling system.The HYL 4M reactor operates at similar conditions to the other Hylsareactors (e.g. HYL III, etc.). The reactor has a cylindrical upper sectionwhere reduction and reforming reactions take place. The lower part isconical with a rotary valve at the end to control the flow of solidsdischarging the reactor.
The starting point of the reduction circuit is the fresh stream of natural gasthat is used as a makeup for the process. This natural gas (desulfurization isnot necessary, but is optional) is mixed with recycled gas and fed to ahumidifier, where the humidity of the total stream of reducing gas iscontrolled to adjust the carbon deposition rate on the DRI at the bottom ofthe reactor.
The reducing gas goes to the top gas heat recuperator, where sensible heat isrecovered from the reactor top gas. Then the preheated gas goes to a gasheater where its temperature is increased to above 900 °C. In the transferline to the reactor, O2 is injected in order to have some partial combustion ofthe reducing gas to increase its temperature to above 1020 °C. This gas,upon introduction into the bottom of the HYL reactor, flows upward intothe reduction zone countercurrent to the moving bed of solids. In the lowerpart of the reduction zone, insitu reforming reactions are carried when this
\\Da0002\01052901\common\DOE REPORT OCT 2000\Section 3.doc Page 11 of 50
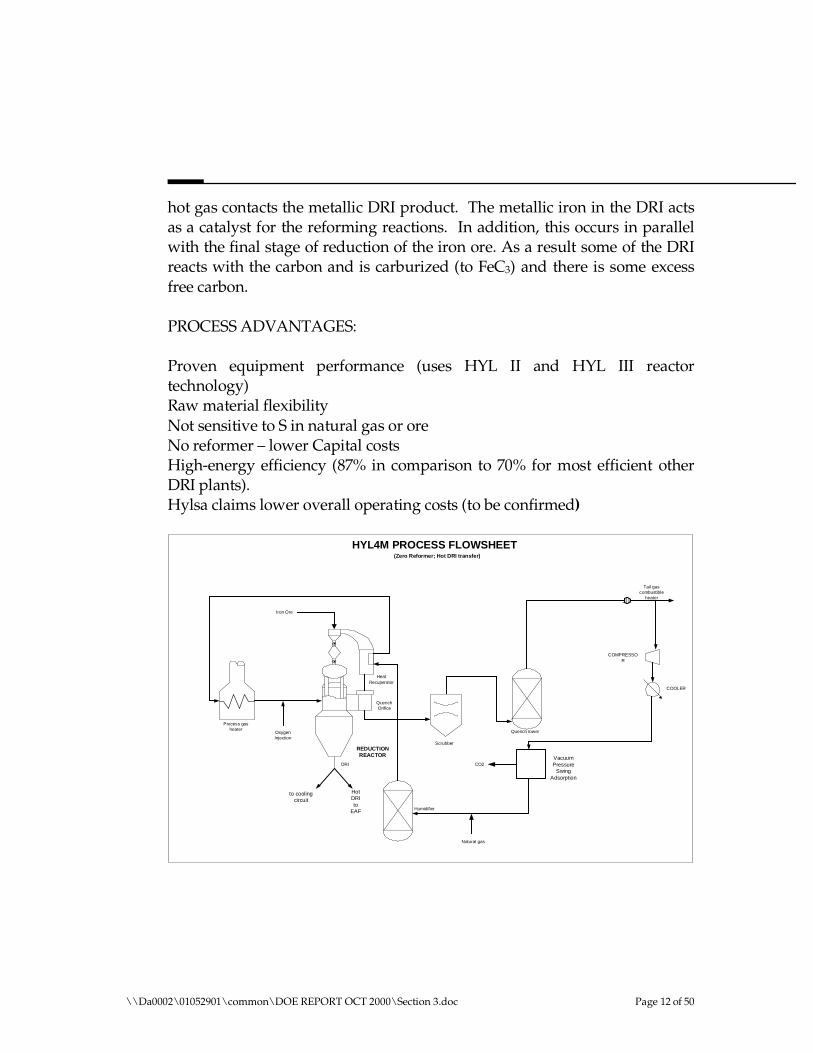
hot gas contacts the metallic DRI product. The metallic iron in the DRI actsas a catalyst for the reforming reactions. In addition, this occurs in parallelwith the final stage of reduction of the iron ore. As a result some of the DRIreacts with the carbon and is carburized (to FeC3) and there is some excessfree carbon.
PROCESS ADVANTAGES:
Proven equipment performance (uses HYL II and HYL III reactortechnology)Raw material flexibilityNot sensitive to S in natural gas or oreNo reformer – lower Capital costsHigh-energy efficiency (87% in comparison to 70% for most efficient otherDRI plants).Hylsa claims lower overall operating costs (to be confirmed)
HYL4M PROCESS FLOWSHEET
COMPRESSO R
COOLER
REDUCTION REACTOR
DRI
Oxygen Injection
Humidifier
CO2
Natural gas
Quench Orifice
Heat Recuperator
Iron Ore
Scrubber
Quench tower
Tail gas combustible
heater
Process gas heater
to cooling circuit
Hot DRI to
EAF
(Zero Reformer; Hot DRI transfer)
Vacuum Pressure
Swing Adsorption
\\Da0002\01052901\common\DOE REPORT OCT 2000\Section 3.doc Page 12 of 50
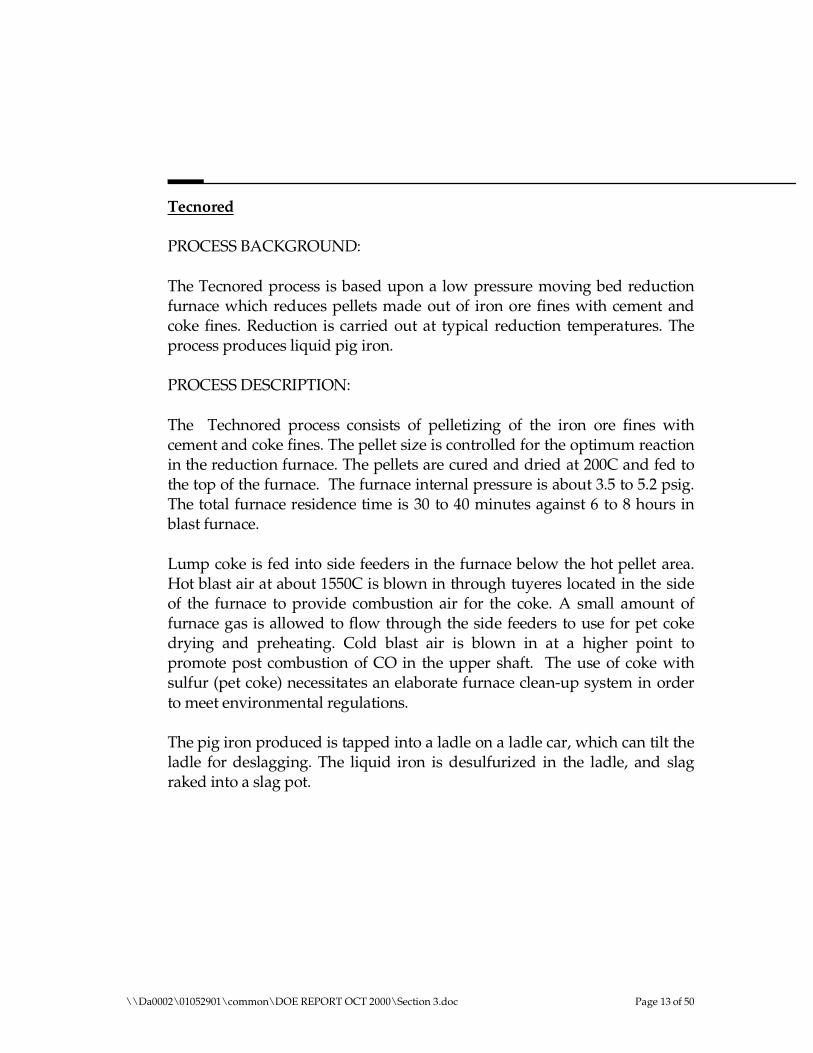
Tecnored
PROCESS BACKGROUND:
The Tecnored process is based upon a low pressure moving bed reduction furnace which reduces pellets made out of iron ore fines with cement and coke fines. Reduction is carried out at typical reduction temperatures. The process produces liquid pig iron.
PROCESS DESCRIPTION:
The Technored process consists of pelletizing of the iron ore fines with cement and coke fines. The pellet size is controlled for the optimum reaction in the reduction furnace. The pellets are cured and dried at 200C and fed to the top of the furnace. The furnace internal pressure is about 3.5 to 5.2 psig. The total furnace residence time is 30 to 40 minutes against 6 to 8 hours in blast furnace.
Lump coke is fed into side feeders in the furnace below the hot pellet area. Hot blast air at about 1550C is blown in through tuyeres located in the side of the furnace to provide combustion air for the coke. A small amount of furnace gas is allowed to flow through the side feeders to use for pet coke drying and preheating. Cold blast air is blown in at a higher point to promote post combustion of CO in the upper shaft. The use of coke with sulfur (pet coke) necessitates an elaborate furnace clean-up system in order to meet environmental regulations.
The pig iron produced is tapped into a ladle on a ladle car, which can tilt the ladle for deslagging. The liquid iron is desulfurized in the ladle, and slag raked into a slag pot.
\\Da0002\01052901\common\DOE REPORT OCT 2000\Section 3.doc Page 13 of 50
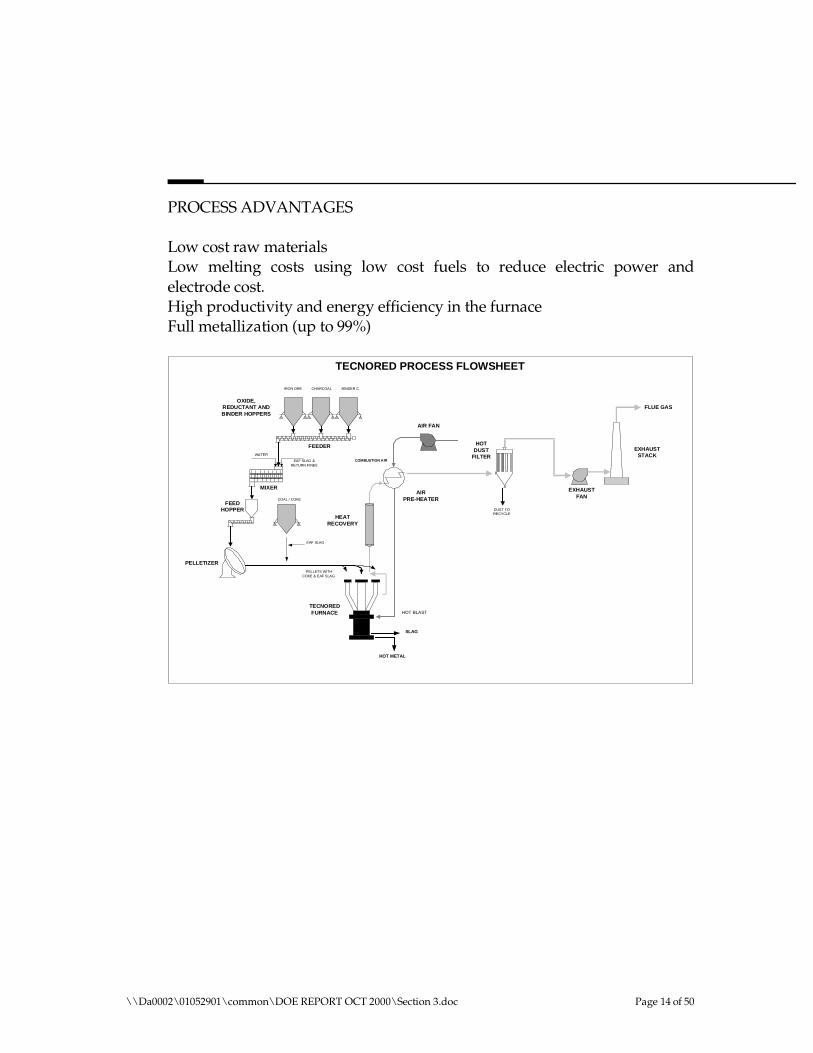
PROCESS ADVANTAGES
Low cost raw materialsLow melting costs using low cost fuels to reduce electric power andelectrode cost.High productivity and energy efficiency in the furnaceFull metallization (up to 99%)
PELLETIZER
MIXER
TECNORED FURNACE
AIR PRE-HEATER
COMBUSTION AIR
EXHAUST STACK
EXHAUST FAN
AIR FAN
OXIDE, REDUCTANT AND BINDER HOPPERS
FEEDER
TECNORED PROCESS FLOWSHEET
FLUE GAS
WATER
DUST TO RECYCLE
HOT DUST
FILTER
PELLETS WITH COKE & EAF SLAG
IRON ORE CHARCOAL BINDER C
EAF SL AG & RETURN FINES
FEED HOPPER
COAL / COKE
HOT BLAST
HOT METAL
SLAG
EAF SLAG
HEAT RECOVERY
\\Da0002\01052901\common\DOE REPORT OCT 2000\Section 3.doc Page 14 of 50
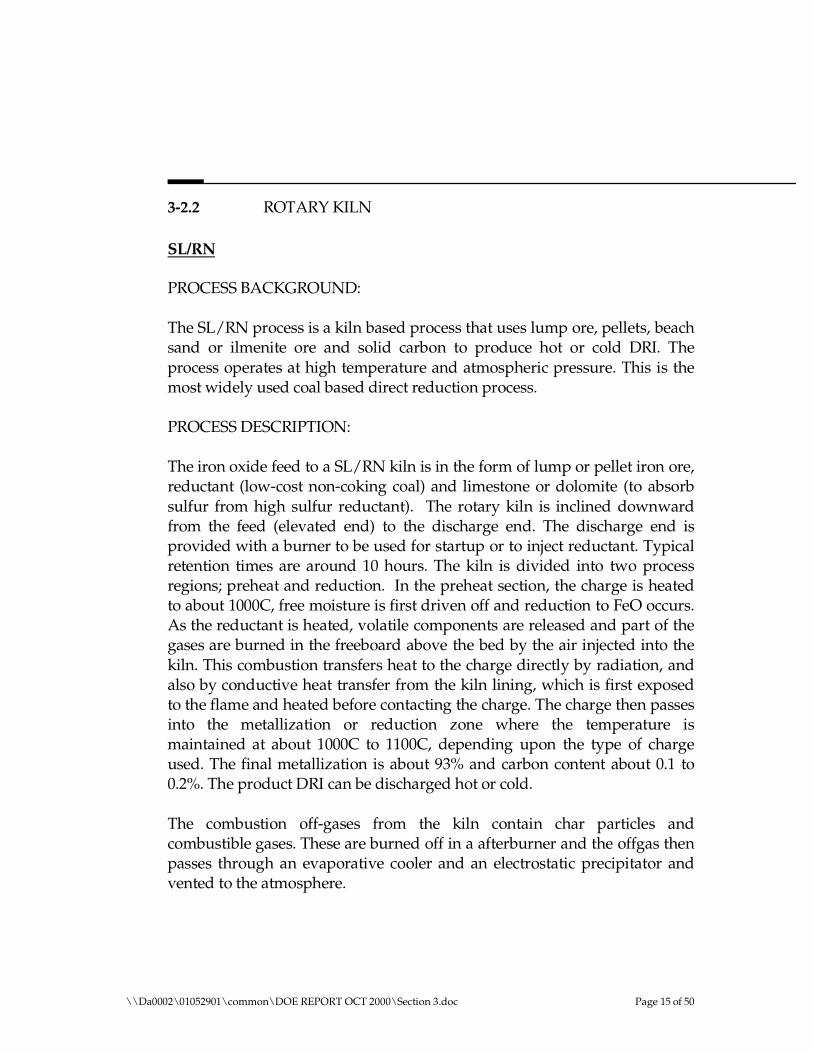
3-2.2 ROTARY KILN
SL/RN
PROCESS BACKGROUND:
The SL/RN process is a kiln based process that uses lump ore, pellets, beach sand or ilmenite ore and solid carbon to produce hot or cold DRI. The process operates at high temperature and atmospheric pressure. This is the most widely used coal based direct reduction process.
PROCESS DESCRIPTION:
The iron oxide feed to a SL/RN kiln is in the form of lump or pellet iron ore, reductant (low-cost non-coking coal) and limestone or dolomite (to absorb sulfur from high sulfur reductant). The rotary kiln is inclined downward from the feed (elevated end) to the discharge end. The discharge end is provided with a burner to be used for startup or to inject reductant. Typical retention times are around 10 hours. The kiln is divided into two process regions; preheat and reduction. In the preheat section, the charge is heated to about 1000C, free moisture is first driven off and reduction to FeO occurs. As the reductant is heated, volatile components are released and part of the gases are burned in the freeboard above the bed by the air injected into the kiln. This combustion transfers heat to the charge directly by radiation, and also by conductive heat transfer from the kiln lining, which is first exposed to the flame and heated before contacting the charge. The charge then passes into the metallization or reduction zone where the temperature is maintained at about 1000C to 1100C, depending upon the type of charge used. The final metallization is about 93% and carbon content about 0.1 to 0.2%. The product DRI can be discharged hot or cold.
The combustion off-gases from the kiln contain char particles and combustible gases. These are burned off in a afterburner and the offgas then passes through an evaporative cooler and an electrostatic precipitator and vented to the atmosphere.
\\Da0002\01052901\common\DOE REPORT OCT 2000\Section 3.doc Page 15 of 50
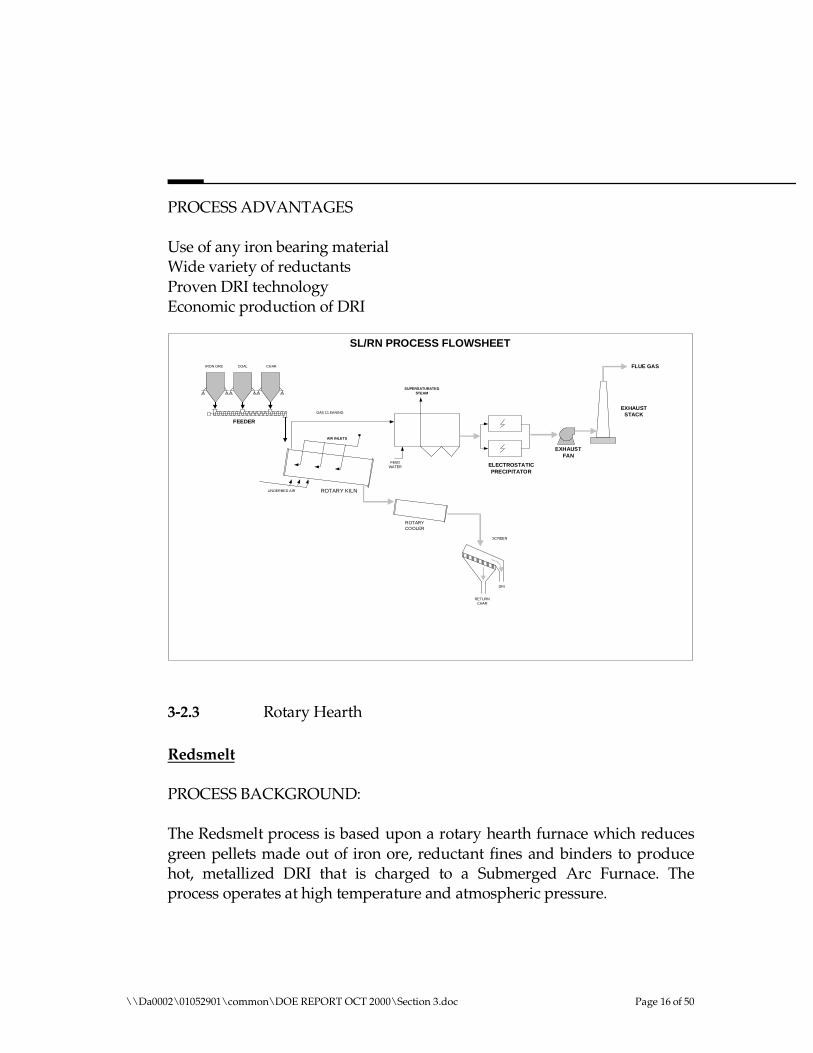
PROCESS ADVANTAGES
Use of any iron bearing material Wide variety of reductants Proven DRI technology Economic production of DRI
SL/RN PROCESS FLOWSHEET
IRON ORE COAL CHAR
FEEDER
AIR INLETS
GAS CLEANING
UNDERBED AIR ROTARY KILN
ROTARY COOLER
SC REEN
DRI
RETURN CHAR
FEED WATER
SUPERSATURATED STEAM
EXHAUST STACK
EXHAUST FAN
FLUE GAS
ELECTROSTATIC PRECIPITATOR
3-2.3 Rotary Hearth
Redsmelt
PROCESS BACKGROUND:
The Redsmelt process is based upon a rotary hearth furnace which reduces green pellets made out of iron ore, reductant fines and binders to produce hot, metallized DRI that is charged to a Submerged Arc Furnace. The process operates at high temperature and atmospheric pressure.
\\Da0002\01052901\common\DOE REPORT OCT 2000\Section 3.doc Page 16 of 50

PROCESS DESCRIPTION:
The iron oxide feed to a Redsmelt furnace is in the form of green pelletsmade of fine iron ore, reductant and binders. Binders are to give to thegreen pellets sufficient mechanical strength to support the handling shocksdownstream. Pellets are screened on a roller-type screen to a size between 8to 16 mm. Under and oversize materials are recirculated to feed thepelletizing disks. Pellets are then distributed onto the RHF in a layer up to30 kg/m2. While traveling throughout the furnace in 12 to 18 minutes,pellets are heated up to 1370C. Drying of the pellets, coal devotalitizationand iron oxide reduction takes place during the heating process. Theintimate contact between iron oxide and carbon at a very high temperatureresults in a very fast reaction rate. To prevent reoxidation of metallized ironthe final zones of the furnace are operated in sub-stoichiometric atmosphere.The hot DRI product is then fed to the submerged arc furnace (SAF) forsmelting into Hot metal and slag.
PROCESS ADVANTAGES
Iron ore fines as raw materialWide variety of solid reductantsLess reduction time (12 to 18 minutes)Proven equipment usage
PE LL ETIZ ER
MIX ER
RO TAR Y-HEA RT H FUR NAC E
FLU E GA S CO NDITION ER
AIR P RE-HE AT ER
C OM BU ST IO N AIR
HO T DRI TRA NSF ER
C ONT AINE RS
EXH AUS T ST AC K
E XH AUS T FAN
AIR FA N
O XIDE , R EDU CTA NT A ND B IN DER HOP PE RS
FEE DER
MA NN ESMA NN DEM AG RED SM ELT PRO C ESS FLO W SH EET
FLU E GA S
WA T E R
DUS T TO RE CY CLE
HOT D US T
FIL TER
G REEN PELLE TS W IT H C AR BO N
I RON ORE CO AL BE NTO NITE
RE CYC LE DUS T
FEE D HO PP ER
PE LLE T C O A T IN G AD DITIV E
CO AT IN G H O PP ER
DR Y D ES ULP HUR IZ ER
S CRUB BE R W AT E R
SC RUB BE R EF FLUE NT
TO TREA TM ENT
WET DE SUL PH URIZE R
SU BM E RG E D AR C FUR NAC E
LI ME
CO A L
TO BA G HO USE
M O LTEN PIG IRO N
S LA G & CAR BO N WA ST E
T RAN SFE R CA R
LA DL E T RANS FE R
DE SU LF URIZA TION
TO EA F S TE EL M AKING
CR ANE TR ANS FE R
\\Da0002\01052901\common\DOE REPORT OCT 2000\Section 3.doc Page 17 of 50
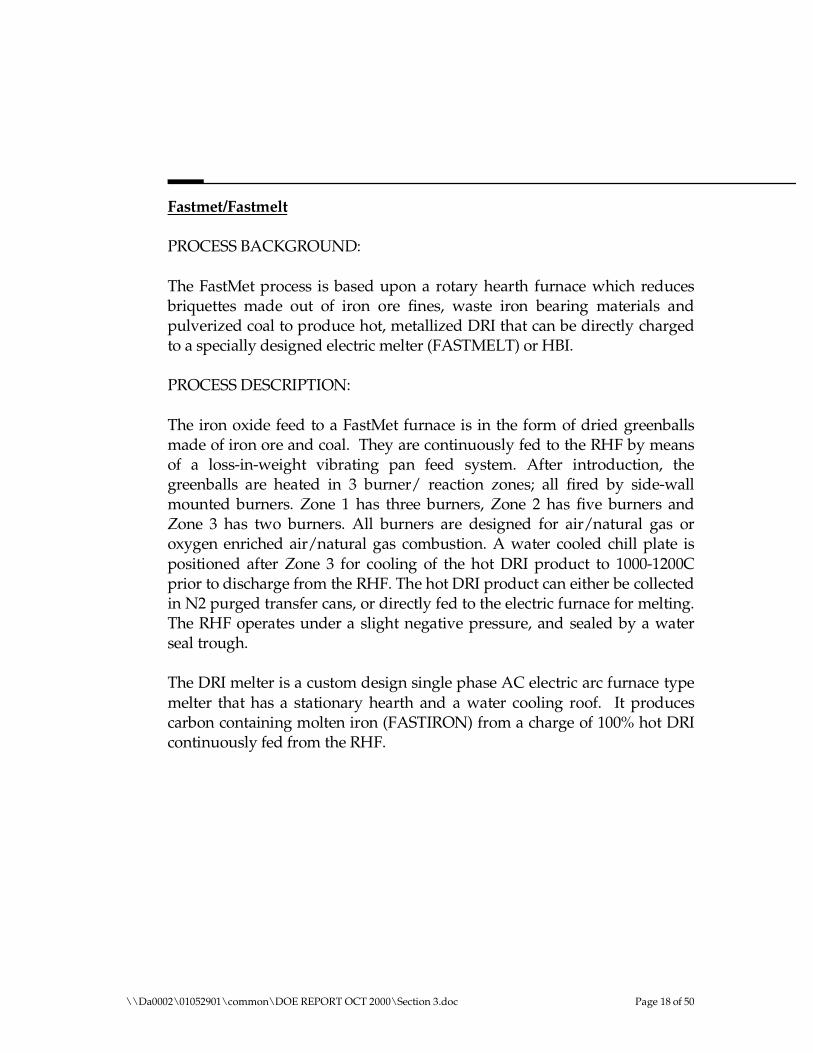
Fastmet/Fastmelt
PROCESS BACKGROUND:
The FastMet process is based upon a rotary hearth furnace which reduces briquettes made out of iron ore fines, waste iron bearing materials and pulverized coal to produce hot, metallized DRI that can be directly charged to a specially designed electric melter (FASTMELT) or HBI.
PROCESS DESCRIPTION:
The iron oxide feed to a FastMet furnace is in the form of dried greenballs made of iron ore and coal. They are continuously fed to the RHF by means of a loss-in-weight vibrating pan feed system. After introduction, the greenballs are heated in 3 burner/ reaction zones; all fired by side-wall mounted burners. Zone 1 has three burners, Zone 2 has five burners and Zone 3 has two burners. All burners are designed for air/natural gas or oxygen enriched air/natural gas combustion. A water cooled chill plate is positioned after Zone 3 for cooling of the hot DRI product to 1000-1200C prior to discharge from the RHF. The hot DRI product can either be collected in N2 purged transfer cans, or directly fed to the electric furnace for melting. The RHF operates under a slight negative pressure, and sealed by a water seal trough.
The DRI melter is a custom design single phase AC electric arc furnace type melter that has a stationary hearth and a water cooling roof. It produces carbon containing molten iron (FASTIRON) from a charge of 100% hot DRI continuously fed from the RHF.
\\Da0002\01052901\common\DOE REPORT OCT 2000\Section 3.doc Page 18 of 50
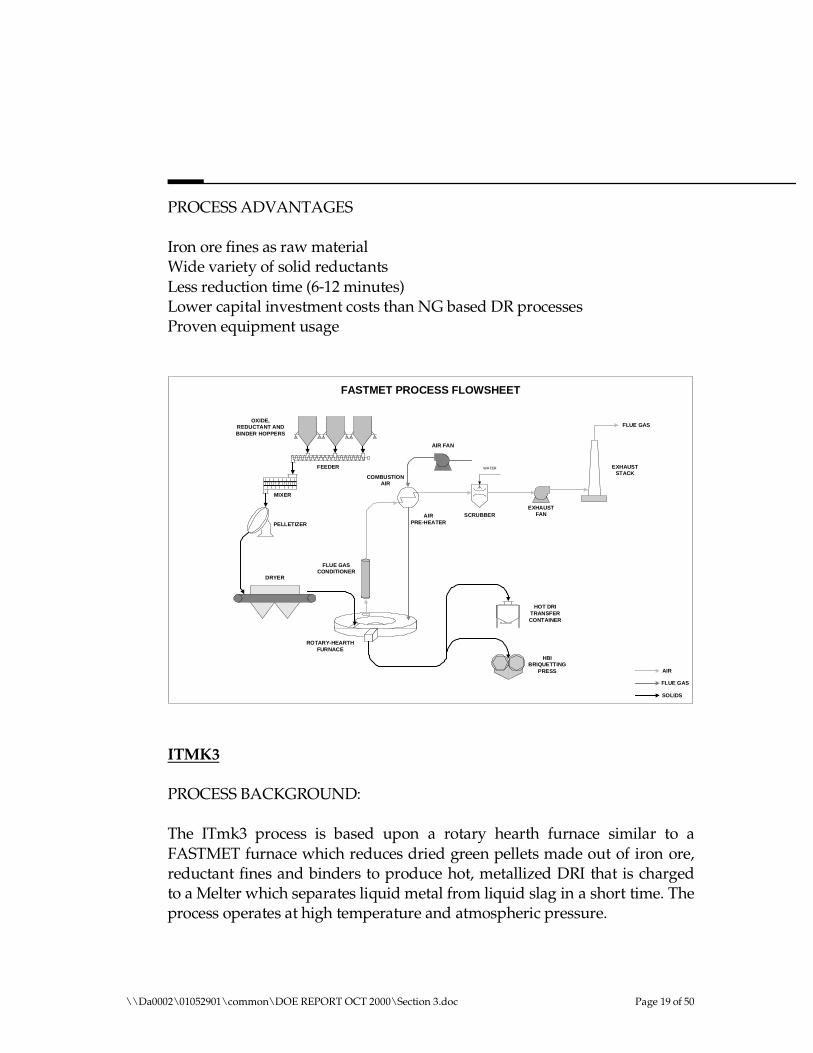
PROCESS ADVANTAGES
Iron ore fines as raw materialWide variety of solid reductantsLess reduction time (6-12 minutes)Lower capital investment costs than NG based DR processesProven equipment usage
DRYER
PELLETIZER
MIXER
ROTARY-HEARTH FURNACE
FLUE GAS CONDITIONER
AIR PRE-HEATER
COMBUSTION AIR
HOT DRI TRANSFER CONTAINER
HBI BRIQUETTING
PRESS
WATER EXHAUST STACK
EXHAUST FAN SCRUBBER
AIR FAN
OXIDE, REDUCTANT AND BINDER HOPPERS
FEEDER
FASTMET PROCESS FLOWSHEET
FLUE GAS
AIR
FLUE GAS
SOLIDS
ITMK3
PROCESS BACKGROUND:
The ITmk3 process is based upon a rotary hearth furnace similar to a FASTMET furnace which reduces dried green pellets made out of iron ore, reductant fines and binders to produce hot, metallized DRI that is charged to a Melter which separates liquid metal from liquid slag in a short time. The process operates at high temperature and atmospheric pressure.
\\Da0002\01052901\common\DOE REPORT OCT 2000\Section 3.doc Page 19 of 50
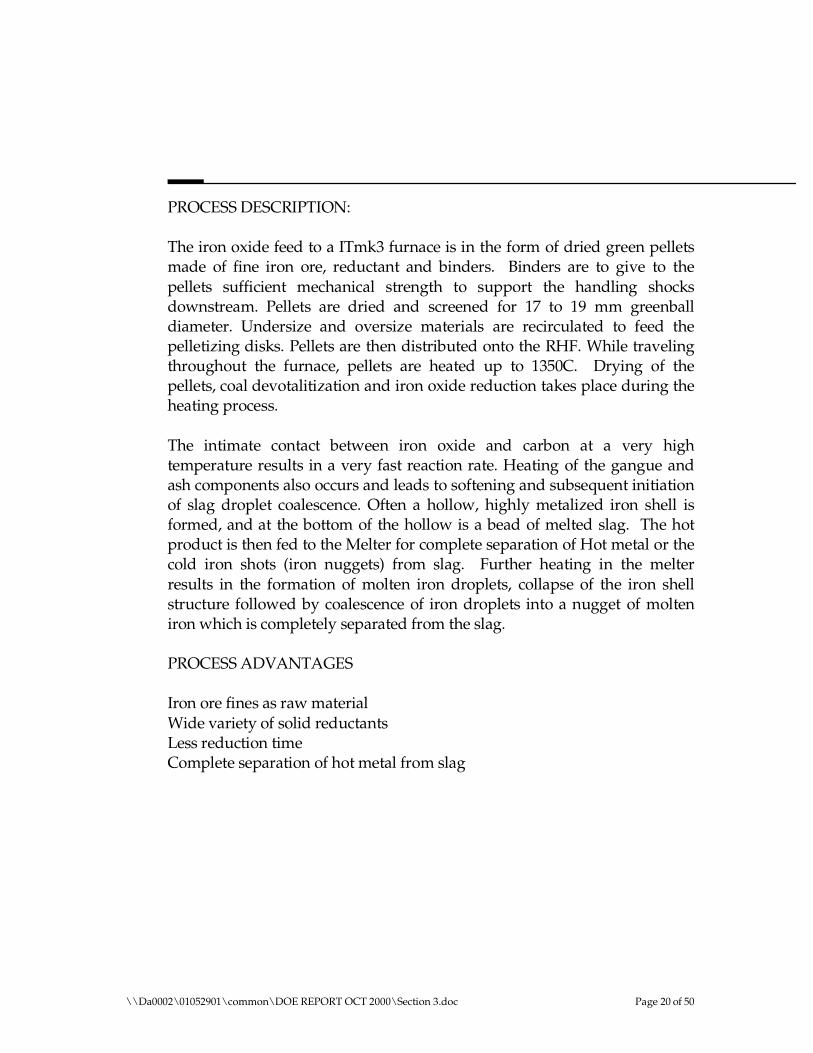
PROCESS DESCRIPTION:
The iron oxide feed to a ITmk3 furnace is in the form of dried green pellets made of fine iron ore, reductant and binders. Binders are to give to the pellets sufficient mechanical strength to support the handling shocks downstream. Pellets are dried and screened for 17 to 19 mm greenball diameter. Undersize and oversize materials are recirculated to feed the pelletizing disks. Pellets are then distributed onto the RHF. While traveling throughout the furnace, pellets are heated up to 1350C. Drying of the pellets, coal devotalitization and iron oxide reduction takes place during the heating process.
The intimate contact between iron oxide and carbon at a very high temperature results in a very fast reaction rate. Heating of the gangue and ash components also occurs and leads to softening and subsequent initiation of slag droplet coalescence. Often a hollow, highly metalized iron shell is formed, and at the bottom of the hollow is a bead of melted slag. The hot product is then fed to the Melter for complete separation of Hot metal or the cold iron shots (iron nuggets) from slag. Further heating in the melter results in the formation of molten iron droplets, collapse of the iron shell structure followed by coalescence of iron droplets into a nugget of molten iron which is completely separated from the slag.
PROCESS ADVANTAGES
Iron ore fines as raw materialWide variety of solid reductantsLess reduction timeComplete separation of hot metal from slag
\\Da0002\01052901\common\DOE REPORT OCT 2000\Section 3.doc Page 20 of 50
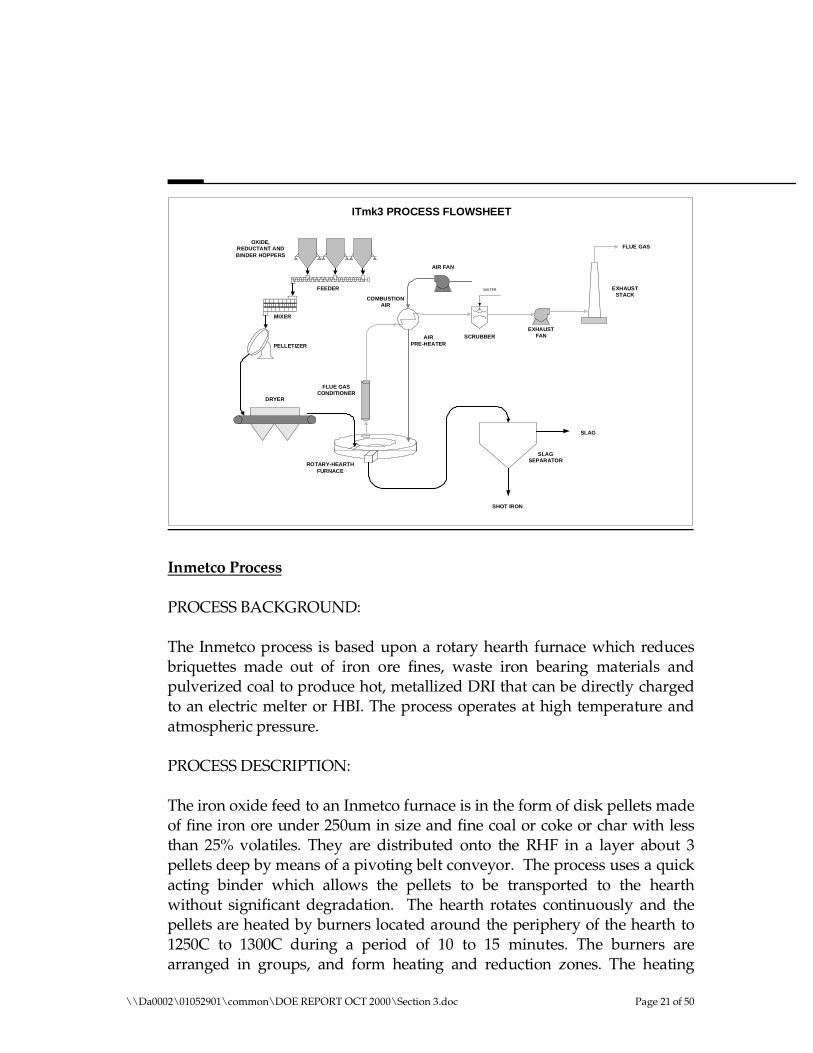
DRYER
PELLETIZER
MIXER
ROTARY-HEARTH FURNACE
FLUE GAS CONDITIONER
AIR PRE-HEATER
COMBUSTION AIR
WATER EXHAUST STACK
EXHAUST FANSCRUBBER
AIR FAN
OXIDE, REDUCTANT AND BINDER HOPPERS
FEEDER
ITmk3 PROCESS FLOWSHEET
FLUE GAS
SLAG SEPARATOR
SLAG
SHOT IRON
Inmetco Process
PROCESS BACKGROUND:
The Inmetco process is based upon a rotary hearth furnace which reduces briquettes made out of iron ore fines, waste iron bearing materials and pulverized coal to produce hot, metallized DRI that can be directly charged to an electric melter or HBI. The process operates at high temperature and atmospheric pressure.
PROCESS DESCRIPTION:
The iron oxide feed to an Inmetco furnace is in the form of disk pellets made of fine iron ore under 250um in size and fine coal or coke or char with less than 25% volatiles. They are distributed onto the RHF in a layer about 3 pellets deep by means of a pivoting belt conveyor. The process uses a quick acting binder which allows the pellets to be transported to the hearth without significant degradation. The hearth rotates continuously and the pellets are heated by burners located around the periphery of the hearth to 1250C to 1300C during a period of 10 to 15 minutes. The burners are arranged in groups, and form heating and reduction zones. The heating
\\Da0002\01052901\common\DOE REPORT OCT 2000\Section 3.doc Page 21 of 50
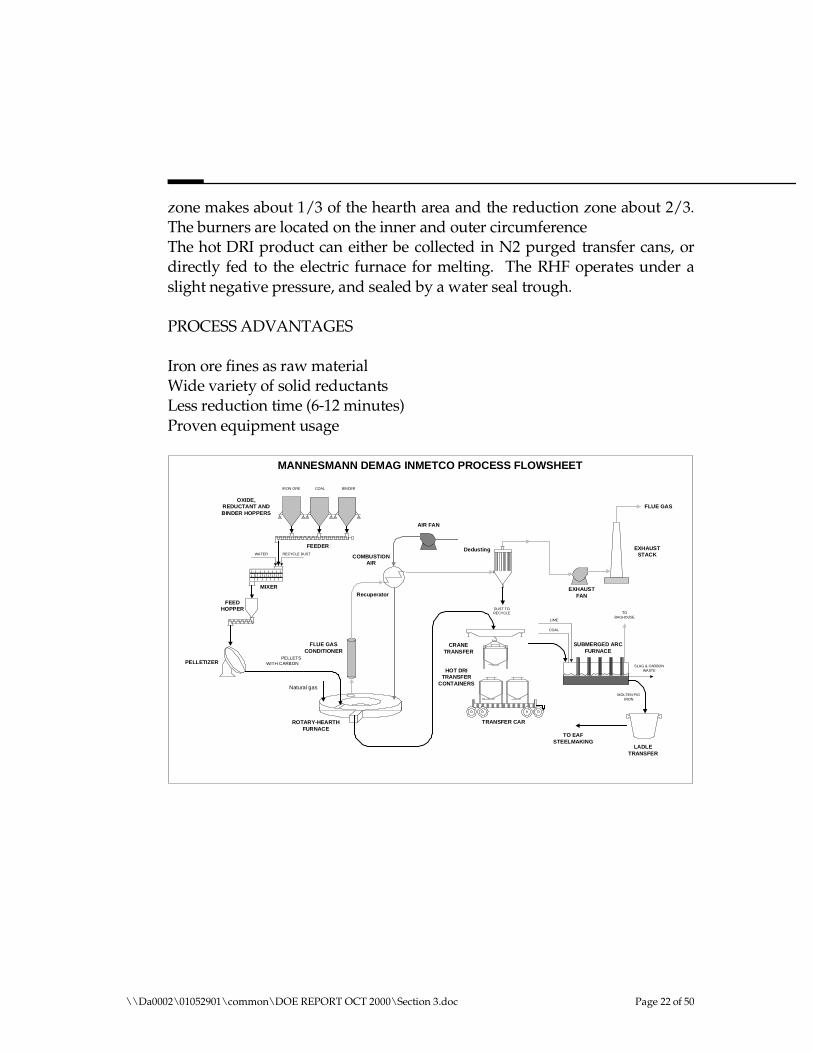
zone makes about 1/3 of the hearth area and the reduction zone about 2/3.The burners are located on the inner and outer circumferenceThe hot DRI product can either be collected in N2 purged transfer cans, ordirectly fed to the electric furnace for melting. The RHF operates under aslight negative pressure, and sealed by a water seal trough.
PROCESS ADVANTAGES
Iron ore fines as raw materialWide variety of solid reductantsLess reduction time (6-12 minutes)Proven equipment usage
PELLETIZER
MIXER
ROTARY-HEARTH FURNACE
FLUE GAS CONDITIONER
Recuperator
COMBUSTION AIR
HOT DRI TRANSFER
CONTAINERS
EXHAUST STACK
EXHAUST FAN
AIR FAN
OXIDE, REDUCTANT AND BINDER HOPPERS
R
MANNESMANN DEMAG INMETCO PROCESS FLOWSHEET
FLUE GAS
WATER
DUST TO RECYCLE
Dedusting
GREEN PELLETS WITH CARBON
RECYCLE DUST
FEED HOPPER
SUBMERGED ARC FURNACE
LIME
COAL
TO BAGHOUSE
MOLTEN PIG IRON
SLAG & CARBON WASTE
TRANSFER CAR
LADLE TRANSFER
TO EAF STEELMAKING
CRANE TRANSFER
Natural gas
FEEDER
IRON ORE COAL BIN DER
\\Da0002\01052901\common\DOE REPORT OCT 2000\Section 3.doc Page 22 of 50
Iron Dynamics
PROCESS BACKGROUND:
The Iron Dynamics process is based upon a rotary hearth furnace which reduces a carbonaceous iron oxide charge to metallic iron solids that are charged to a SAF to complete the reduction and to melt and desulfurize the reduced iron. Melting the DRI also allows for a phase separation of the resulting liquid slag and iron.
PROCESS DESCRIPTION:
The IDI process is composed of five process areas: raw material receiving, ore and reductant (coal) grinding and preparation, pelletizing, rotary hearth reduction and submerged arc furnace smelting. After the ore is received, it is dried to the moisture content less than 0.5% using offgas from the rotary hearth furnace. Ore is also beneficiated using magnetic separators and screens to reduce the amount of silica. It is then ground to 50% minus 200 mesh. Coal is conveyed to a coal/fluxstone pulverizer for sizing to 80% minus 200 mesh. Ground ore and coal are intensively mixed with binders and water in a mixer and fed onto disc pelletizers. Wet pellets are dried to less than 1% moisture and preheated to 150C in a circular grate dryer. The pellet charger receives the dried green balls and layers them onto the furnace hearth in 11/2 – 1 in. thick layers.
The natural gas fired rotary hearth furnace has eight reaction zones. Temperature, gas flow and gas composition are controlled to provide the required conditions in each zone to properly heat, reduce and protect the pellets. The DRI at the discharge of the furnace has about 85% metallization.
An additive facility introduces flux, coke, silica or other materials to the DRI transport bottles to control slag chemistry in the submerged arc furnace. The offgas system removes heat, dust, sulfur dioxide and nitrous dioxides from the flue gas. An afterburner combusts any remaining CO in the offgas water-cooled duct. The gas is cooled and the Nox removed in the primary cooler. Offgas is used to preheat combustion air and supply heat to the ore, coal and pellet dryers. After the pellet dryer, the gas is filtered and Sox removed prior to discharge from the stack. The DRI and the additives fall into the slag layer of the Submerged Arc Furnace by gravity where smelting
\\Da0002\01052901\common\DOE REPORT OCT 2000\Section 3.doc Page 23 of 50
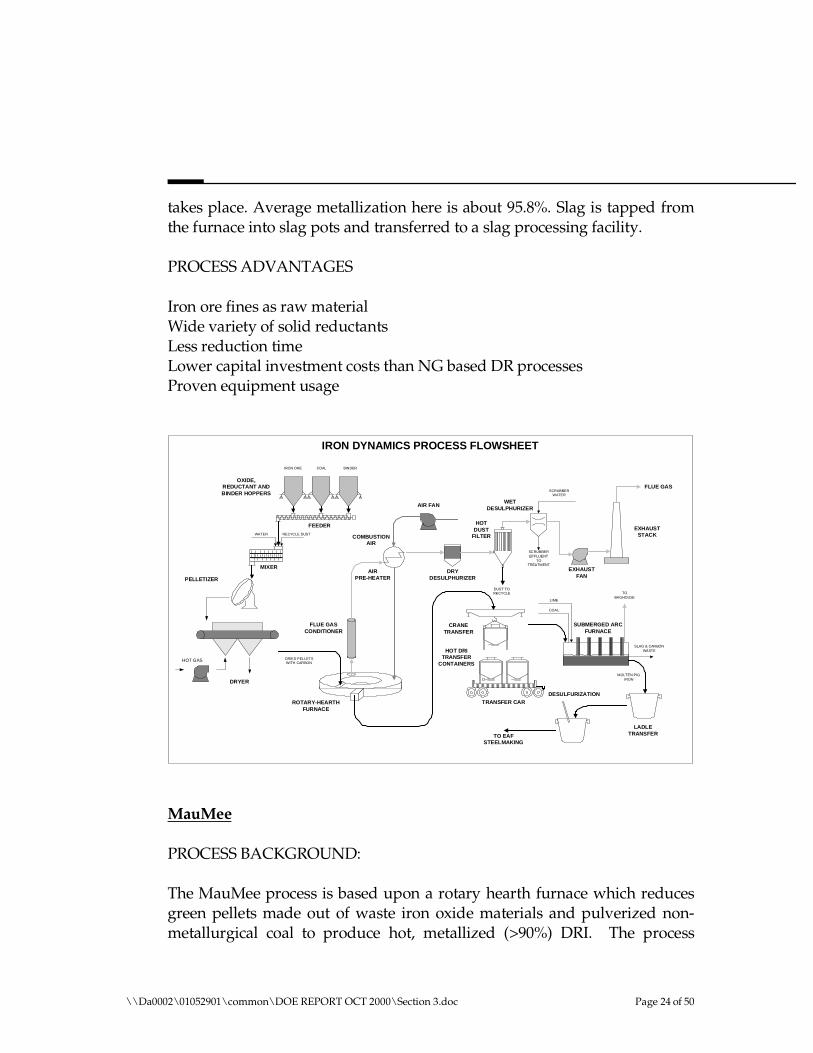
takes place. Average metallization here is about 95.8%. Slag is tapped fromthe furnace into slag pots and transferred to a slag processing facility.
PROCESS ADVANTAGES
Iron ore fines as raw materialWide variety of solid reductantsLess reduction timeLower capital investment costs than NG based DR processesProven equipment usage
PELLETIZER
MIXER
ROTARY-HEARTH FURNACE
FLUE GAS CONDITIONER
AIR PRE-HEATER
COMBUSTION AIR
HOT DRI TRANSFER
CONTAINERS
EXHAUST STACK
EXHAUST FAN
AIR FAN
OXIDE, REDUCTANT AND BINDER HOPPERS
FEEDER
IRON DYNAMICS PROCESS FLOWSHEET
FLUE GAS
WATER
DUST TO RECYCLE
HOT DUST
FILTER
DRIED PELLETS WITH CARBON
IRON ORE COAL BIN DER
RECYCLE DUST
DRY DESULPHURIZER
SCRUBBER WATER
SC RUBBER EF FLUENT
TO TREATMENT
WET DESULPHURIZER
SUBMERGED ARC FURNACE
LIME
COAL
TO BAGHOUSE
MOLTEN PIG IRON
SLAG & CARBON WASTE
TRANSFER CAR
LADLE TRANSFER
DESULFURIZATION
TO EAF STEELMAKING
CRANE TRANSFER
DRYER
HOT GAS
MauMee
PROCESS BACKGROUND:
The MauMee process is based upon a rotary hearth furnace which reduces green pellets made out of waste iron oxide materials and pulverized non-metallurgical coal to produce hot, metallized (>90%) DRI. The process
\\Da0002\01052901\common\DOE REPORT OCT 2000\Section 3.doc Page 24 of 50
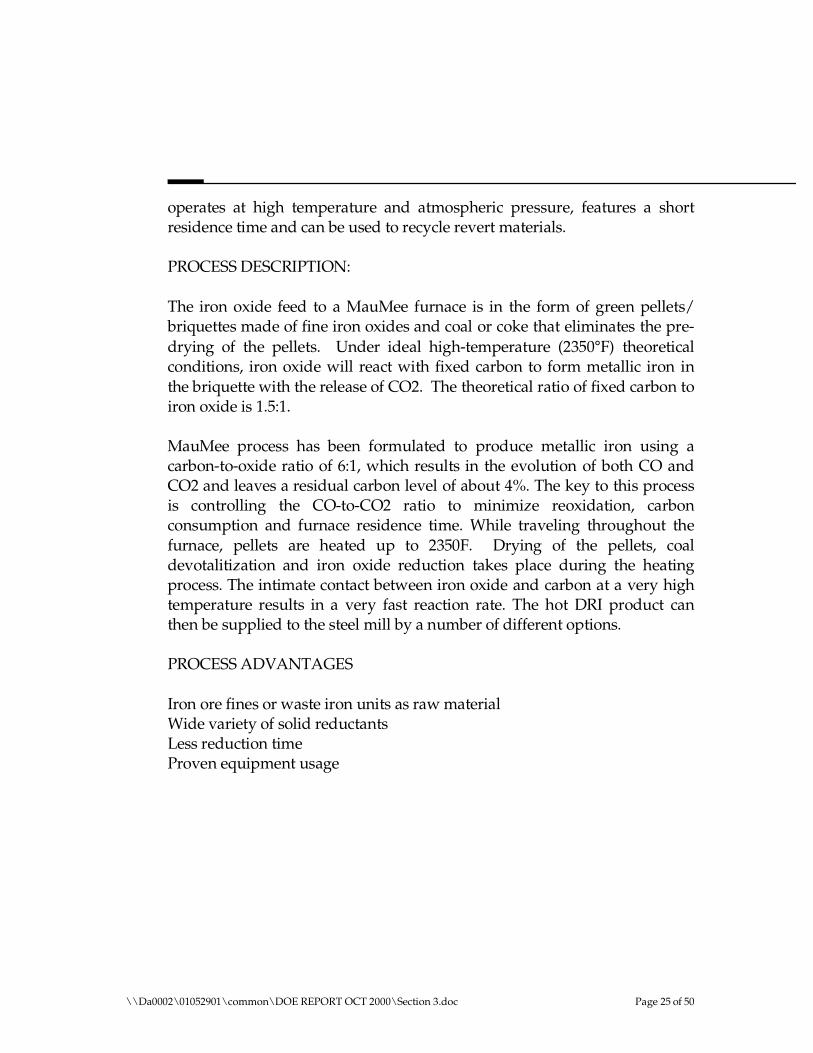
operates at high temperature and atmospheric pressure, features a short residence time and can be used to recycle revert materials.
PROCESS DESCRIPTION:
The iron oxide feed to a MauMee furnace is in the form of green pellets/ briquettes made of fine iron oxides and coal or coke that eliminates the pre-drying of the pellets. Under ideal high-temperature (2350°F) theoretical conditions, iron oxide will react with fixed carbon to form metallic iron in the briquette with the release of CO2. The theoretical ratio of fixed carbon to iron oxide is 1.5:1.
MauMee process has been formulated to produce metallic iron using a carbon-to-oxide ratio of 6:1, which results in the evolution of both CO and CO2 and leaves a residual carbon level of about 4%. The key to this process is controlling the CO-to-CO2 ratio to minimize reoxidation, carbon consumption and furnace residence time. While traveling throughout the furnace, pellets are heated up to 2350F. Drying of the pellets, coal devotalitization and iron oxide reduction takes place during the heating process. The intimate contact between iron oxide and carbon at a very high temperature results in a very fast reaction rate. The hot DRI product can then be supplied to the steel mill by a number of different options.
PROCESS ADVANTAGES
Iron ore fines or waste iron units as raw materialWide variety of solid reductantsLess reduction timeProven equipment usage
\\Da0002\01052901\common\DOE REPORT OCT 2000\Section 3.doc Page 25 of 50
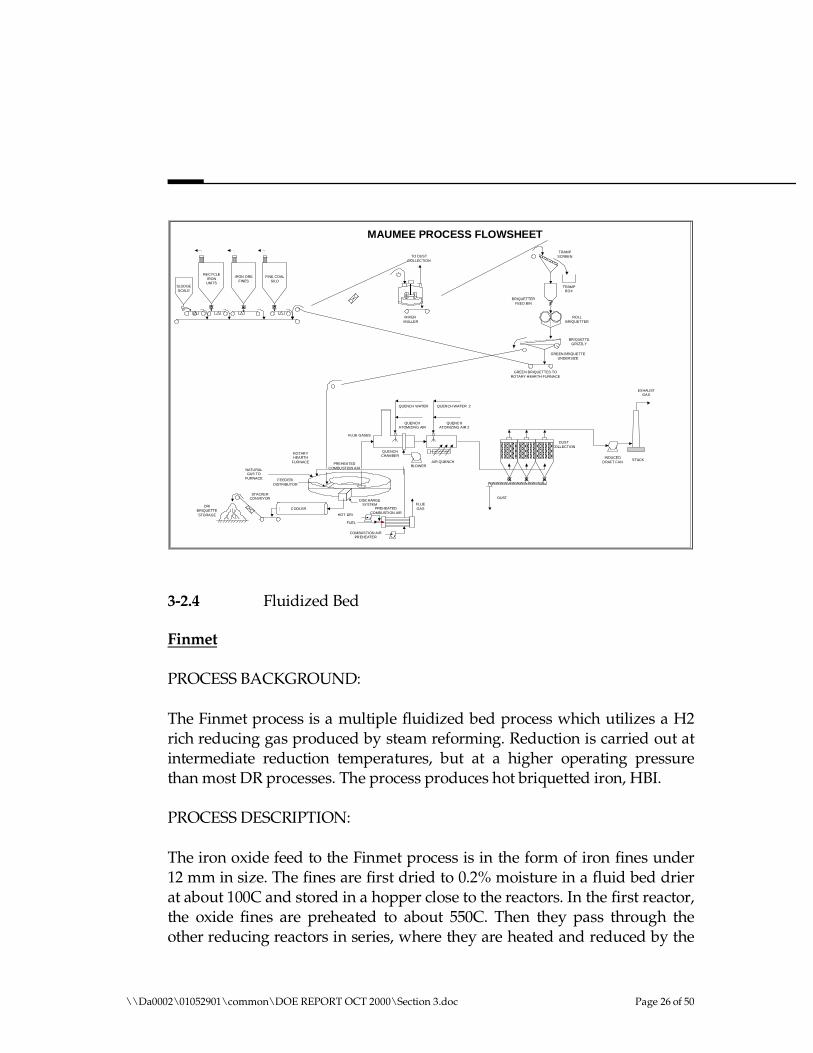
HOT DRI
COOLERDRI
BRIQUETTE STORAGE
STACKER CONVEYOR
ROTARY HEARTH
FURNACE
FEED ER/ DISTRIBUTOR
DISCHARGE SYSTEM
QUENCH ATOMIZING AIR
QUENCH WATER
QUENCH CHAMBER
QUENCH ATOMIZING AIR 2
QUENCH WATER 2
AI R QUENCH
DUST COLLECTION
COMBUSTION AIR PR EHEATER
FUEL
PREHEATED COMBUSTION AIR
FLUE GASES
PREHEATED COMBUSTION AIRNATURAL
GAS TO FURNACE
BLOWER
FLUE GAS
MAUMEE PROCESS FLOWSHEET
IRON ORE FINES
DUST
INDUCED DRAFT FAN
STACK
EXHAU ST GAS
FINE COAL SI LO
RECYCLE IRON
UNITS SLUD GE SCALE
GREEN BRIQUETTES TO ROTARY HEARTH FURNACE
BRIQUETTER FEED BIN
TRAMP SCREEN
TRAMP BOX
GREEN BRIQUETTE UNDERSIZE
ROLL BRIQUETTER
BRIQUETTE GRIZZLY
TO DUST COLLECTION
MIXER�MULLER
3-2.4 Fluidized Bed
Finmet
PROCESS BACKGROUND:
The Finmet process is a multiple fluidized bed process which utilizes a H2 rich reducing gas produced by steam reforming. Reduction is carried out at intermediate reduction temperatures, but at a higher operating pressure than most DR processes. The process produces hot briquetted iron, HBI.
PROCESS DESCRIPTION:
The iron oxide feed to the Finmet process is in the form of iron fines under 12 mm in size. The fines are first dried to 0.2% moisture in a fluid bed drier at about 100C and stored in a hopper close to the reactors. In the first reactor, the oxide fines are preheated to about 550C. Then they pass through the other reducing reactors in series, where they are heated and reduced by the
\\Da0002\01052901\common\DOE REPORT OCT 2000\Section 3.doc Page 26 of 50
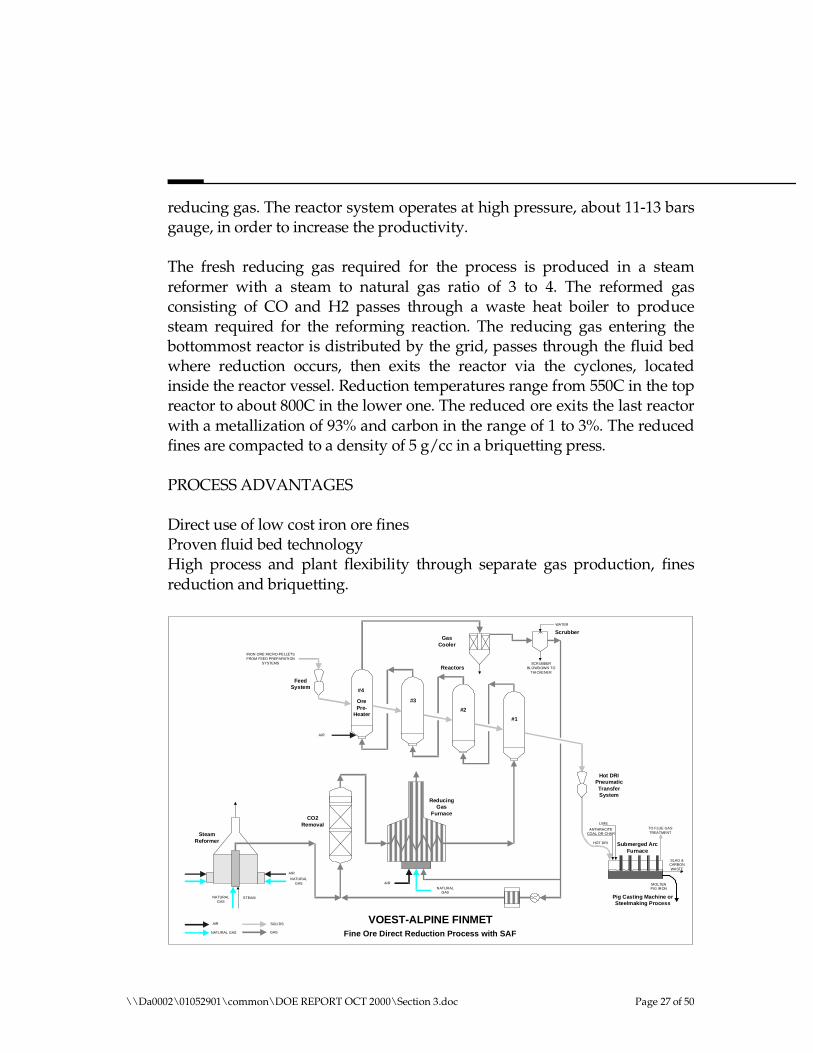
reducing gas. The reactor system operates at high pressure, about 11-13 barsgauge, in order to increase the productivity.
The fresh reducing gas required for the process is produced in a steamreformer with a steam to natural gas ratio of 3 to 4. The reformed gasconsisting of CO and H2 passes through a waste heat boiler to producesteam required for the reforming reaction. The reducing gas entering thebottommost reactor is distributed by the grid, passes through the fluid bedwhere reduction occurs, then exits the reactor via the cyclones, locatedinside the reactor vessel. Reduction temperatures range from 550C in the topreactor to about 800C in the lower one. The reduced ore exits the last reactorwith a metallization of 93% and carbon in the range of 1 to 3%. The reducedfines are compacted to a density of 5 g/cc in a briquetting press.
PROCESS ADVANTAGES
Direct use of low cost iron ore finesProven fluid bed technologyHigh process and plant flexibility through separate gas production, finesreduction and briquetting.
ANTHRACITE COAL OR CHAR
AIR
NATURAL GAS
SOLI DS
GAS Fine Ore Direct Reduction Process with SAF
VOEST-ALPINE FINMET
STEAM
AI R
NATURAL GAS
Steam Reformer
CO2 Removal
AI R
NATURAL GAS
Feed System
IRON ORE MICRO-PELLETS FROM FEED PREPARATION
SYSTEMS
WATER
Scrubber
Reactors
Ore Pre-
Heater
Reducing Gas
Furnace
#3
#2
#1
#4
SCR UBBER BL OWD OWN TO
THICKENER
NATURAL GAS
Pig Casting Machine or Steelmaking Process
Submerged Arc Furnace
LIME TO FLUE GAS TREATMENT
MOLTEN PIG IRON
SLAG & CARBON WASTE
HOT DRI
Hot DRI Pneumatic
Transfer System
Gas Cooler
AI R
\\Da0002\01052901\common\DOE REPORT OCT 2000\Section 3.doc Page 27 of 50
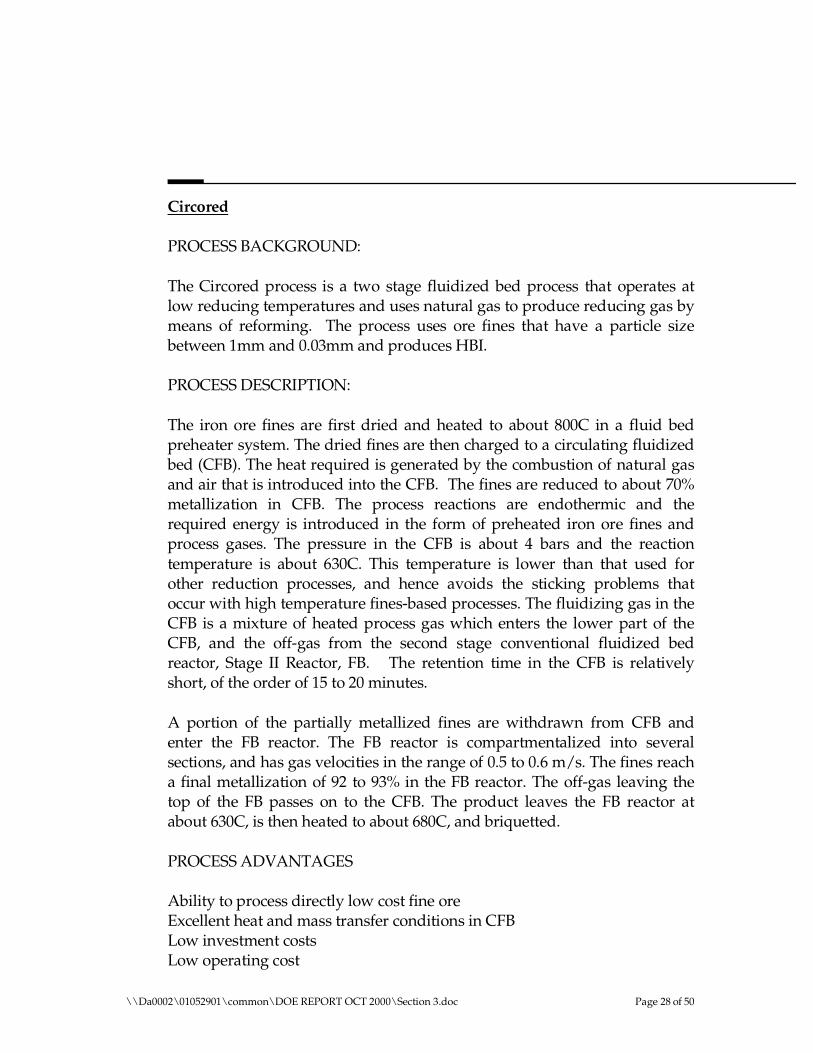
Circored
PROCESS BACKGROUND:
The Circored process is a two stage fluidized bed process that operates at low reducing temperatures and uses natural gas to produce reducing gas by means of reforming. The process uses ore fines that have a particle size between 1mm and 0.03mm and produces HBI.
PROCESS DESCRIPTION:
The iron ore fines are first dried and heated to about 800C in a fluid bed preheater system. The dried fines are then charged to a circulating fluidized bed (CFB). The heat required is generated by the combustion of natural gas and air that is introduced into the CFB. The fines are reduced to about 70% metallization in CFB. The process reactions are endothermic and the required energy is introduced in the form of preheated iron ore fines and process gases. The pressure in the CFB is about 4 bars and the reaction temperature is about 630C. This temperature is lower than that used for other reduction processes, and hence avoids the sticking problems that occur with high temperature fines-based processes. The fluidizing gas in the CFB is a mixture of heated process gas which enters the lower part of the CFB, and the off-gas from the second stage conventional fluidized bed reactor, Stage II Reactor, FB. The retention time in the CFB is relatively short, of the order of 15 to 20 minutes.
A portion of the partially metallized fines are withdrawn from CFB and enter the FB reactor. The FB reactor is compartmentalized into several sections, and has gas velocities in the range of 0.5 to 0.6 m/s. The fines reach a final metallization of 92 to 93% in the FB reactor. The off-gas leaving the top of the FB passes on to the CFB. The product leaves the FB reactor at about 630C, is then heated to about 680C, and briquetted.
PROCESS ADVANTAGES
Ability to process directly low cost fine oreExcellent heat and mass transfer conditions in CFBLow investment costsLow operating cost
\\Da0002\01052901\common\DOE REPORT OCT 2000\Section 3.doc Page 28 of 50
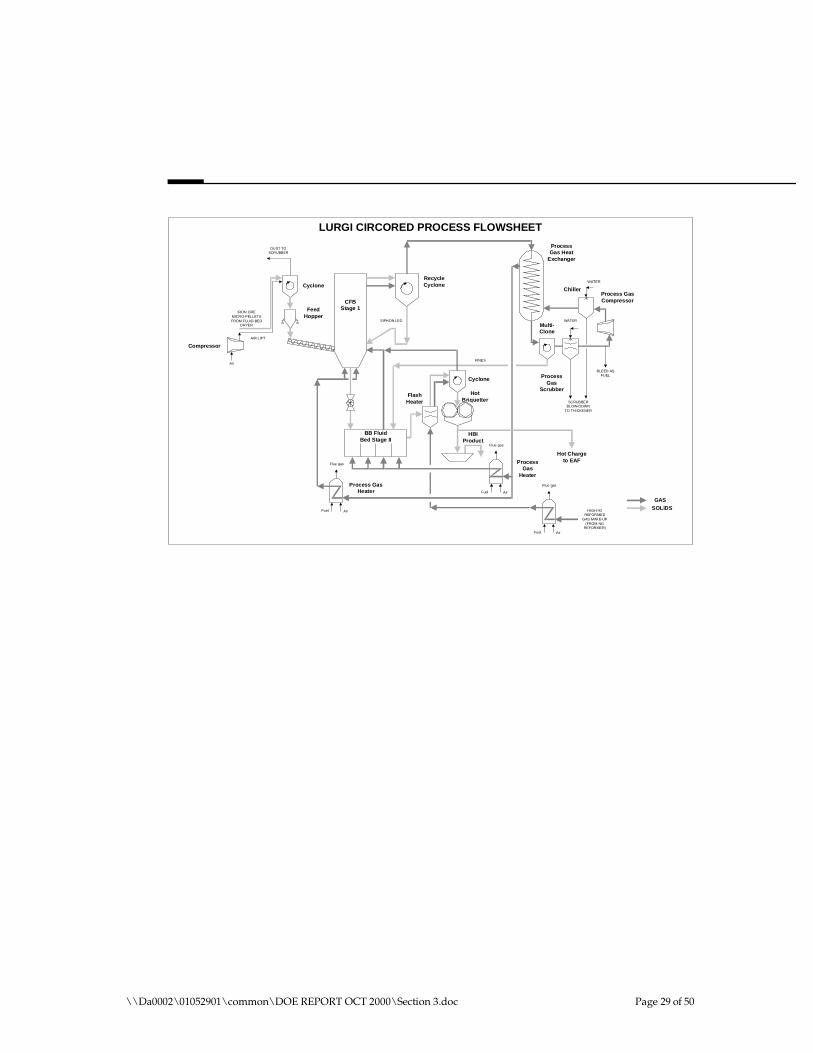
Cyclone
Air
AIR LIFT
IRON ORE MICRO-PELLETS FROM FLUID-BED
DRYER
Feed Hopper
CFB Stage 1
BB Fluid Bed Stage II
Hot Briquetter
Cyclone
Flash Heater
HBI Product
AirFuel
Multi-Clone
Process Gas
Scrubber
Chiller Process Gas Compressor
SC RUBBER BLOW-DOWN
TO THICKENER
BLEED AS FUEL
Process Gas Heat
Exchanger
Recycle Cyclone
LURGI CIRCORED PROCESS FLOWSHEET
Flue gas
Process Gas
Heater
AirFuel
Flue gas
AirFuel
Flue gas
Process Gas Heater
HIGH H2 REFORMED
GAS MAKE-UP (FROM NG
REFORMER)
Compressor
SIPHON LEG
FINES
WATER
WATER
DUST TO SCR UBBER
GAS
SOLIDS
Hot Charge to EAF
\\Da0002\01052901\common\DOE REPORT OCT 2000\Section 3.doc Page 29 of 50
Circofer
PROCESS BACKGROUND:
The Circofer process is a two stage fluidized bed process that uses iron ore fines and a solid carbon source such as coal to produce reducing gas. Reduction is carried out at high reduction temperatures. The process produces hot briquetted iron, HBI.
PROCESS DESCRIPTION:
The iron oxide feed to the Circofer process is in the form of iron fines between 1mm and 0.03mm in size. The coal to be used as the energy source and reductant must have an ash softening temperature above 1500C due to operating temperature of the gasifying process. The fines, lime and char are first preheated by the hot exhaust gases. These then enter the gasifier, where O2 is injected and coal is fed in from the charge hopper. The gasifier operates at about 1000C and at these conditions, the O2 partially combusts the carbon contained in the coal, producing heat and a CO/CO2 gas mixture. The heat produced in the gasifier heats the ore and char to process temperatures.
In the CFB, the ore fines are reduced to about 70% metallization. The fluidizing gas in the CFB is a mixture of heated recycle gas which enters the lower part of the CFB, and the offgas from the second reducer (FB) which enters further up in the CFB. The fines and char are carried out of the CFB due to the high gas velocity in the reactor, are captured by the cyclone, and returned to the CFB via the gasifier. Thus a circulation pattern is set up which allows the heat to be transferred to the CFB reactor.
Reduced solids from the CFB enter the FB reactor, which is a conventional bubbling bed. In this second reduction stage, the fines reach a final metallization of 92 to 93%. The gas leaving the top of the FB passes on to the CFB. The product from the second reducer is partially cooled, the char and ash are removed by magnetic separation, and the product is briquetted and cooled.
\\Da0002\01052901\common\DOE REPORT OCT 2000\Section 3.doc Page 30 of 50

PROCESS ADVANTAGES
Direct use of low cost iron ore finesProven fluid bed technologyHigh quality product
GAS
SOLIDS
Cyclone
Air
AI R LI FT
Feed Hopper
CFB Stage 1
Hot Briquetter
HBI Product
Air
Recycle Cyclone
LURGI CIRCOFER PROCESS FLOWSHEET
Flue gas
Process Gas
Heater
Compressor
DUST TO SCR UBBER
COAL CHAR
IRON ORE
FINES ADDITIVE
Gasifier
O2
Fluid Bed Stage II
Recycle Char
Steam Boiler
Ste am to CO2
Absorb er
Venturi Scrubber
Dust
Bag Filter
to Settling
Pond
CO2
Steam
Iron Carbide Processes
PROCESS BACKGROUND:
Iron carbide (Fe3C) is a chemical compound of 93% iron and 7% carbon in pure form. It can be used as the only feed for BOFs and EAFs. In that role it eliminates the need for coke ovens and the blast furnace, and all the ancillary equipment for coal and lime. The Iron Carbide process is a two stage fluidized bed process that operates at a lower temperature than other DR processes. It operates at low pressures and uses steam reforming to produce the H2 which is mixed with CH4 to make the carburizing gas. It produces Fe3C powder which contains about 6% carbon. PROCESS DESCRIPTION:
\\Da0002\01052901\common\DOE REPORT OCT 2000\Section 3.doc Page 31 of 50
The iron oxide feed to the iron carbide process is in the form of iron ore fines in the range of 1mm to 0.1 mm. Iron ore fines are preheated in a series of cyclones and then pressurized to reactor pressure in lockhoppers, and fed to the reactor by a screw feeder.
The fluidized bed reactors have the upward moving stream of 600C gas composed of CO, CO2, H2, CH4 and H2O. The hydrogen reacts with the iron ore, combing with its oxygen to form water (the only process by-product). Carbon from the carbonaceous gases combines with the elemental iron to form iron carbide. The methane provides the gas system equilibrium. After the reactions in the fluid bed reactors, the off gases are condensed to get rid of water vapor, reconstituted with H2 and carbonaceous gases, raised to reactor working pressure to 1.8 atm, heated to 600C, and reintroduced in the windbox of the reactor.
An indication of the inherent thermal efficiency of the process is gained from the fact that the temperature of formation of iron carbide in the fluid bed reactor is only 600C as against around 1000C for reduction of iron in DRI processes and 1500C to produce hot metal in the blast furnace.
PROCESS ADVANTAGES
Lower operating temperatureLower production costsNo storage costs as the product does not oxidizeSteelmaking cheaper with Fe3C
\\Da0002\01052901\common\DOE REPORT OCT 2000\Section 3.doc Page 32 of 50
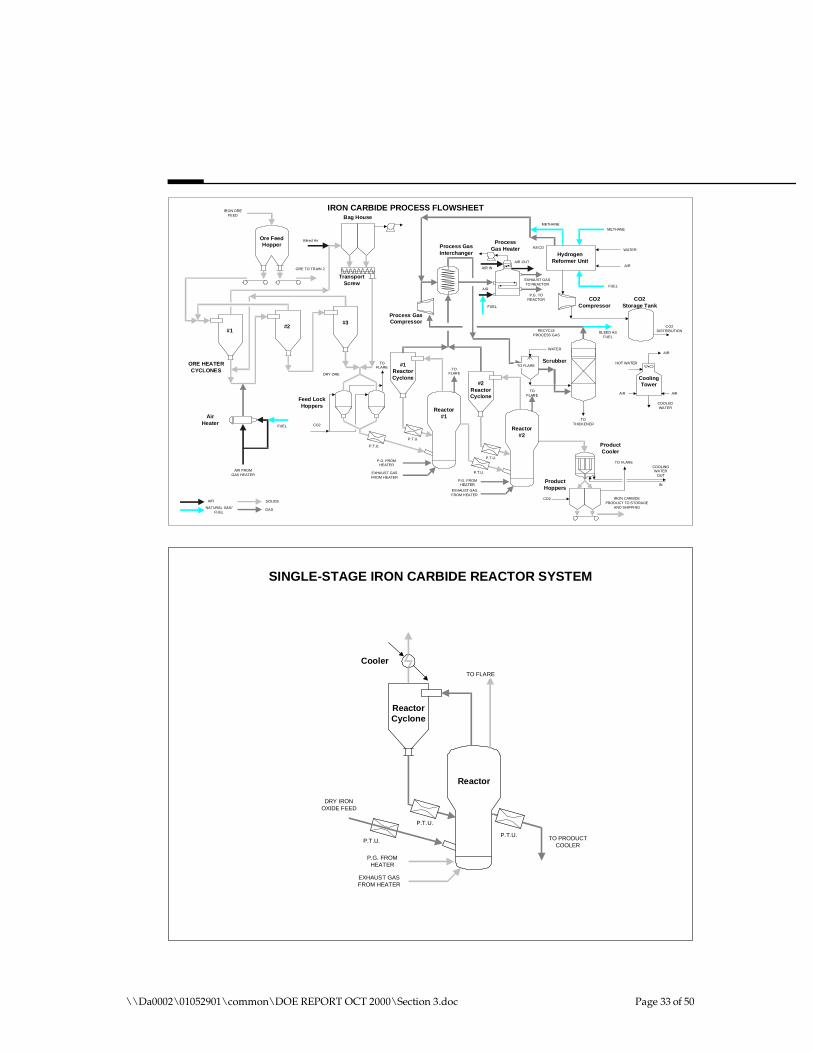
IRON CARBIDE PROCESS FLOWSHEET
ORE TO TRAIN 2
Ore Feed Hopper
IRON ORE FEED
#1 #2
#3
ORE HEATER CYCLONES
Air Heater
FUEL
Bleed Air
TO FLARE
Feed Lock Hoppers
CO2
TO FLARE
#1 Reactor Cyclone
Reactor #1
IRON CARBIDE PRODUCT TO STORAGE
AND SHIPPING
Product Hoppers
TO FLARE
CO2
Product Cooler
OUT
IN
COOLING WATER
P.T.U.
P.T.U.
Bag House
Transport Screw
Hydrogen Reformer Unit
FUEL
CO2 DISTRIBUTION
CO2 Storage Tank
CO2 Compressor
WATER
AI R
METHANE
METHANE
H2/CO
P.G. TO REACTOR
P.G. FROM HEATER
Process Gas HeaterProcess Gas
Interchanger
Process Gas Compressor
AI R
NATURAL GAS/ FUEL
SOLIDS
GAS
WATER
Scrubber
RECYCLE PROCESS GAS
TO THICKENER
HOT WATER
COOLED WATER
AIRAI R
AIR
Cooling Tower
AIR FROM GAS HEATER
AI R IN
AIR OUT
DRY ORE
BL EED AS FUEL
AIR
FUEL
EXHAU ST GAS TO REACTOR
EXHAUST GAS FROM HEATER
TO FLARE
#2 Reactor Cyclone
Reactor #2
P.T.U.
TO FLARE
P.G. FROM HEATER
EXHAU ST GAS FROM HEATER
P. T.U.
SINGLE-STAGE IRON CARBIDE REACTOR SYSTEM
Cooler
TO FLARE
Reactor Cyclone
Reactor
DRY IRON OXIDE FEED
P.T.U.
P.T.U.
P.T.U. TO PRODUCT COOLER
P.G. FROM HEATER
EXHAUST GAS FROM HEATER
\\Da0002\01052901\common\DOE REPORT OCT 2000\Section 3.doc Page 33 of 50
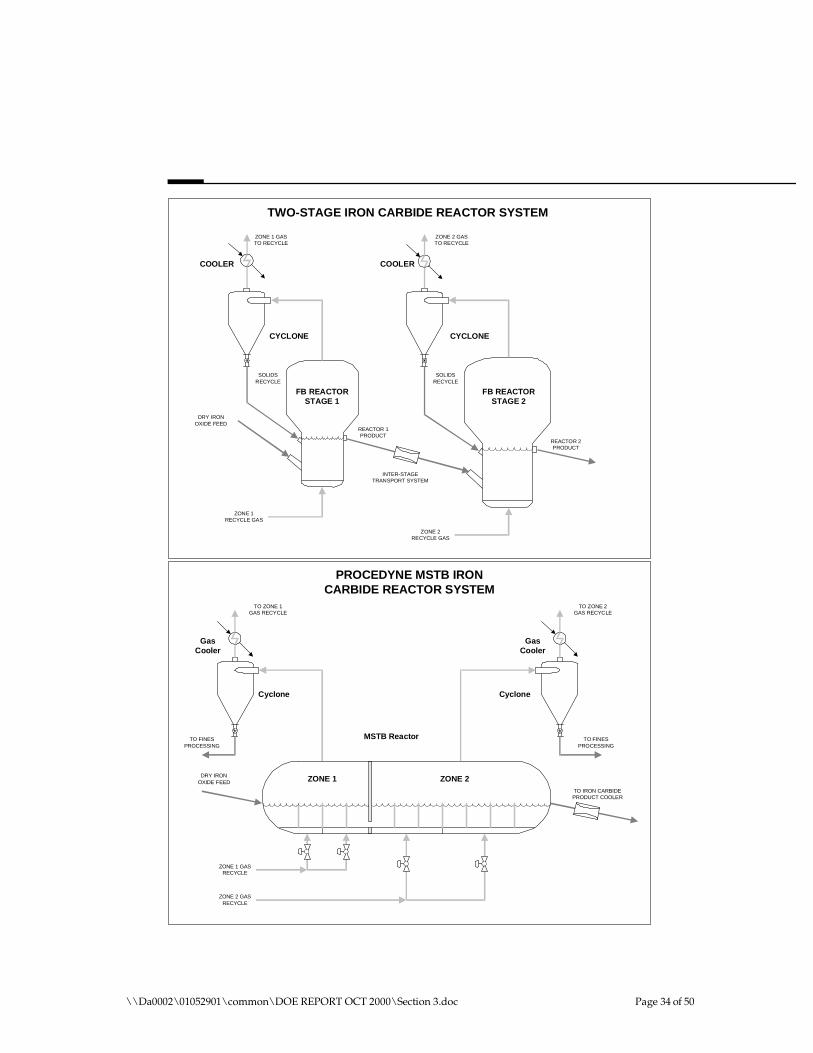
FB REACTOR STAGE 2
FB REACTOR STAGE 1
TWO-STAGE IRON CARBIDE REACTOR SYSTEM
CYCLONE CYCLONE
COOLER COOLER
DRY IRON OXIDE FEED
INTER-STAGE TRANSPORT SYSTEM
SOLIDS RECYCLE
SOLIDS RECYCLE
ZONE 1 RECYCLE GAS
ZONE 2 RECYCLE GAS
ZONE 1 GAS TO RECYCLE
ZONE 2 GAS TO RECYCLE
REACTOR 1 PRODUCT
REACTOR 2 PRODUCT
Gas Cooler
Gas Cooler
Cyclone Cyclone
ZONE 1 ZONE 2
MSTB Reactor
ZONE 1 GAS RECYCLE
ZONE 2 GAS RECYCLE
TO ZONE 1 GAS RECYCLE
TO ZONE 2 GAS RECYCLE
DRY IRON OXIDE FEED
TO IRON CARBIDE PRODUCT COOLER
PROCEDYNE MSTB IRON CARBIDE REACTOR SYSTEM
TO FINES PROCESSING
TO FINES PROCESSING
\\Da0002\01052901\common\DOE REPORT OCT 2000\Section 3.doc Page 34 of 50
3-2.5 OTHER (REACTOR, ETC.)
Hismelt
PROCESS BACKGROUND:
The HIsmelt process was initially developed as an air-blown, bottom-injected, refractory-lined process. But due to excessive refractory wear, the initial horizontal design was abandoned and a new Vertical smelt reduction vessel (SRV) was proposed.
PROCESS DESCRIPTION:
In this process, the iron ore is preheated (and optionally prereduced as far as magnetite) in a lean-phase cyclone preheat system similar to that on many cement kilns. It is then injected into the SRV, along with coal and flux materials through two water-cooled solids injection lances such that the mixture is carried predominantly into the metal phase. Rapid dissolution and smelting occur in the metal and the resulting product gases (mainly hydrogen and carbon monoxide) rise under buoyancy to generate the large liquid fountain, a characteristic of HIsmelt. The result is strong mixing within the metal and slag phases with effective elimination of any significant thermal gradients.
Hot offgas from the SRV is enriched with a small quantity of natural gas, the resulting mixture being roughly equivalent to blast furnace gas. This gas is cooled to around 1000C and split into roughly equal proportions. One portion is used (hot) in the preheater, whilst the other is scrubbed and subsequently burned as fuel in the hot blast stoves.
PROCESS ADVANTAGES
Direct smeltingLow direct electrical power consumption
\\Da0002\01052901\common\DOE REPORT OCT 2000\Section 3.doc Page 35 of 50
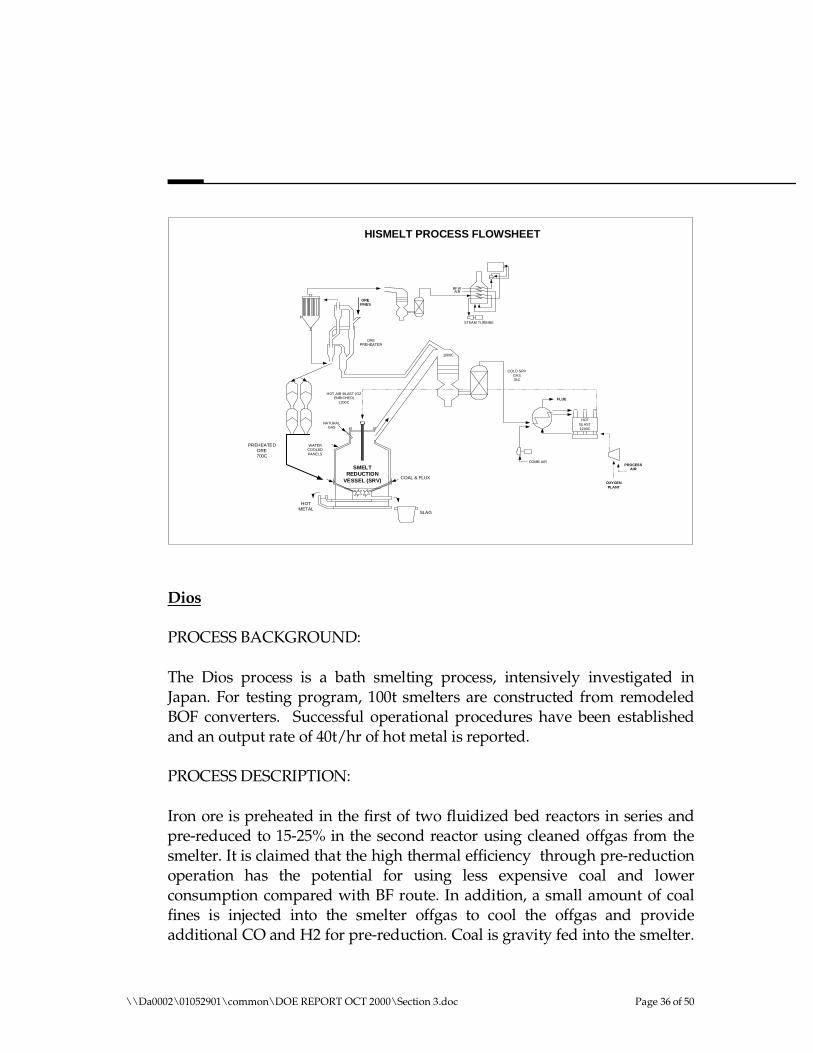
HISMELT PROCESS FLOWSHEET
SLAG
HOT METAL
COAL & FLUX
PR EH EATED ORE 700C
H OT AIR BL AST (O2 ENRICHED)
1200C
WATER COOLED PANELS
ORE FINES
SMELT REDUCTION
VESSEL (SRV)
HOT BL AST 1200C
PROCESS AIR
OXYGEN PLA NT
FLUE
AI R BF W
STEAM TURBINE
COMB AIR
ORE PREHEATER
COLD SRV GAS 35C
NATURAL GAS
1000C
Dios
PROCESS BACKGROUND:
The Dios process is a bath smelting process, intensively investigated in Japan. For testing program, 100t smelters are constructed from remodeled BOF converters. Successful operational procedures have been established and an output rate of 40t/hr of hot metal is reported.
PROCESS DESCRIPTION:
Iron ore is preheated in the first of two fluidized bed reactors in series and pre-reduced to 15-25% in the second reactor using cleaned offgas from the smelter. It is claimed that the high thermal efficiency through pre-reduction operation has the potential for using less expensive coal and lower consumption compared with BF route. In addition, a small amount of coal fines is injected into the smelter offgas to cool the offgas and provide additional CO and H2 for pre-reduction. Coal is gravity fed into the smelter.
\\Da0002\01052901\common\DOE REPORT OCT 2000\Section 3.doc Page 36 of 50
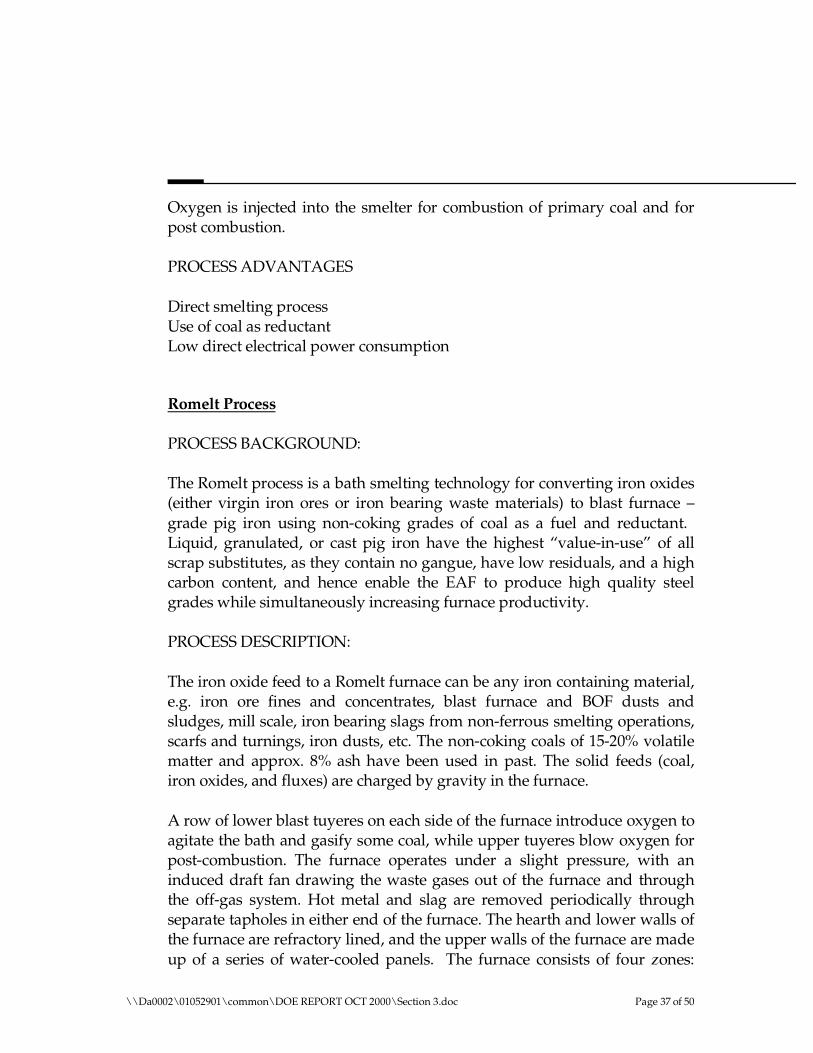
Oxygen is injected into the smelter for combustion of primary coal and forpost combustion.
PROCESS ADVANTAGES
Direct smelting processUse of coal as reductantLow direct electrical power consumption
Romelt Process
PROCESS BACKGROUND:
The Romelt process is a bath smelting technology for converting iron oxides (either virgin iron ores or iron bearing waste materials) to blast furnace – grade pig iron using non-coking grades of coal as a fuel and reductant. Liquid, granulated, or cast pig iron have the highest “value-in-use” of all scrap substitutes, as they contain no gangue, have low residuals, and a high carbon content, and hence enable the EAF to produce high quality steel grades while simultaneously increasing furnace productivity.
PROCESS DESCRIPTION:
The iron oxide feed to a Romelt furnace can be any iron containing material, e.g. iron ore fines and concentrates, blast furnace and BOF dusts and sludges, mill scale, iron bearing slags from non-ferrous smelting operations, scarfs and turnings, iron dusts, etc. The non-coking coals of 15-20% volatile matter and approx. 8% ash have been used in past. The solid feeds (coal, iron oxides, and fluxes) are charged by gravity in the furnace.
A row of lower blast tuyeres on each side of the furnace introduce oxygen to agitate the bath and gasify some coal, while upper tuyeres blow oxygen for post-combustion. The furnace operates under a slight pressure, with an induced draft fan drawing the waste gases out of the furnace and through the off-gas system. Hot metal and slag are removed periodically through separate tapholes in either end of the furnace. The hearth and lower walls of the furnace are refractory lined, and the upper walls of the furnace are made up of a series of water-cooled panels. The furnace consists of four zones:
\\Da0002\01052901\common\DOE REPORT OCT 2000\Section 3.doc Page 37 of 50
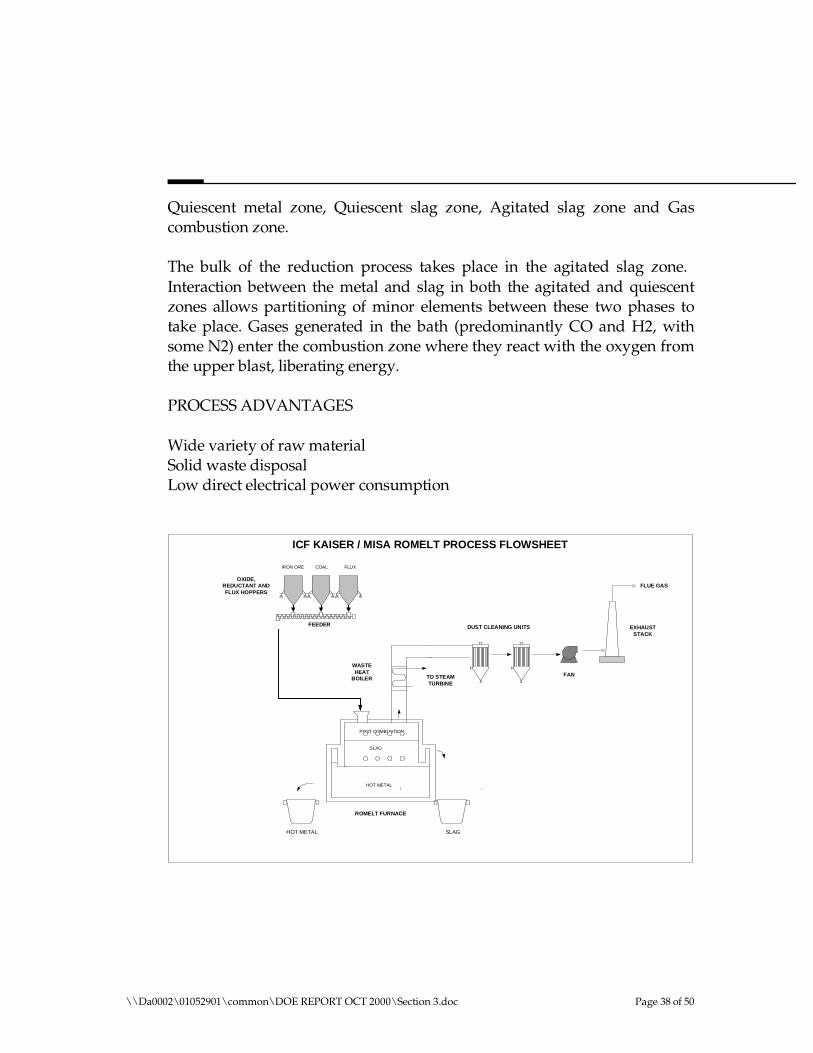
Quiescent metal zone, Quiescent slag zone, Agitated slag zone and Gascombustion zone.
The bulk of the reduction process takes place in the agitated slag zone.Interaction between the metal and slag in both the agitated and quiescentzones allows partitioning of minor elements between these two phases totake place. Gases generated in the bath (predominantly CO and H2, withsome N2) enter the combustion zone where they react with the oxygen fromthe upper blast, liberating energy.
PROCESS ADVANTAGES
Wide variety of raw materialSolid waste disposalLow direct electrical power consumption
OXIDE, REDUCTANT AND FLUX HOPPERS
FEEDER
ICF KAISER / MISA ROMELT PROCESS FLOWSHEET
IRON ORE COAL FLUX
FAN
EXHAUST STACK
FLUE GAS
HOT METAL SLAG
TO STEAM TURBINE
DUST CLEANING UNITS
ROMELT FURNACE
POST COMBUSTION
HOT METAL
SLAG
WASTE HEAT
BOILER
\\Da0002\01052901\common\DOE REPORT OCT 2000\Section 3.doc Page 38 of 50
Gridsmelter
PROCESS BACKGROUND:
The Gridsmelter process is based upon a melter-gasifier that melts efficiently pre-reduced fine ore (60% to 80%) with some coke and coal in a grid smelter reactor vessel. Reduction is carried out at typical reduction temperatures. The process produces liquid pig iron as a product.
PROCESS DESCRIPTION:
The Gridsmelter process consists of a melter-gasifier for using iron-containing fines as the primary feedstock. It is a pressure vessel with internal refractory lining of walls. The high temperature wall area and roof, where fine coal, natural gas or oil burns with preheated air or oxygen are water-cooled. The grid that supports a coke/refractory filter bed is also water-cooled.
The region above the grid (high temperature zone) is very similar to the raceway of a Blast furnace. In this high temperature zone, the final reduction and liquification take place. The liquified materials pass through the filter bed in co-current with the gases. FeO droplets formed are reduced, carburized and separated from the leaving gases, falling down into the furnace hearth. The furnace hearth contains liquid pig iron, slag and a bubbling fluidized coal/coke bed. The offgas leaves the vessel in the middle of the vessel height. The gas is hot cleaned by cyclone and used for pre-reduction and preheating of the feedstock and blast preheating.
PROCESS ADVANTAGES
Wide variety of raw materials like sponge iron, iron ore fines, mill scale, etc.Takes advantage of ‘sticking effect’Low direct electrical power consumptionLiquid hot metal product
\\Da0002\01052901\common\DOE REPORT OCT 2000\Section 3.doc Page 39 of 50
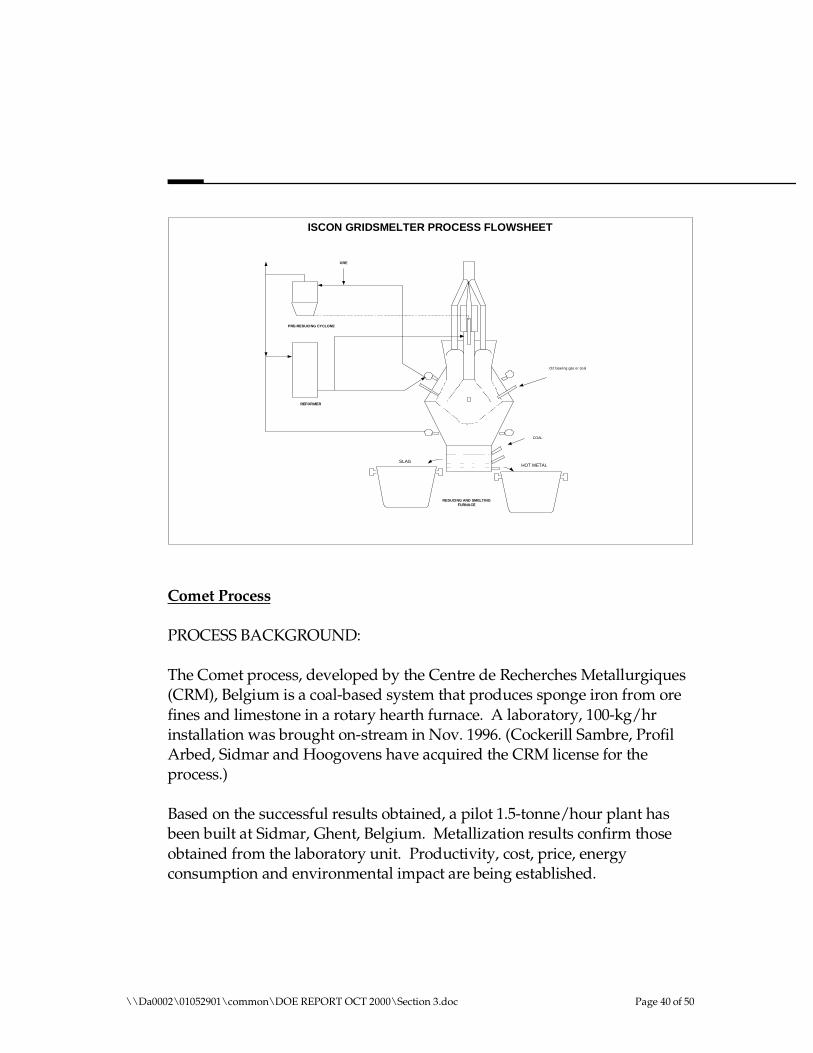
ISCON GRIDSMELTER PROCESS FLOWSHEET
COAL
O2 bearing gas or coal
ORE
PRE-REDUCING CYCLONE
REFORMER
REDUCING AND SMELTING FURNACE
SLAG HOT METAL
Comet Process
PROCESS BACKGROUND:
The Comet process, developed by the Centre de Recherches Metallurgiques (CRM), Belgium is a coal-based system that produces sponge iron from ore fines and limestone in a rotary hearth furnace. A laboratory, 100-kg/hr installation was brought on-stream in Nov. 1996. (Cockerill Sambre, Profil Arbed, Sidmar and Hoogovens have acquired the CRM license for the process.)
Based on the successful results obtained, a pilot 1.5-tonne/hour plant has been built at Sidmar, Ghent, Belgium. Metallization results confirm those obtained from the laboratory unit. Productivity, cost, price, energy consumption and environmental impact are being established.
\\Da0002\01052901\common\DOE REPORT OCT 2000\Section 3.doc Page 40 of 50

PROCESS DESCRIPTION:
Similar to Fastmet or Inmetco.
PROCESS ADVANTAGES
Direct use of low cost iron ore finesLow cost reductantLess reduction timeProven equipment usage
FINEX Process
PROCESS BACKGROUND:
The FINEX process produces liquid iron (hot metal) using fine iron ore and non-coking coal directly without any pre-treatment process for raw materials and fuel such as sintering process for raw materials and coking process for coal in the blast furnace ironmaking process.
PROCESS DESCRIPTION:
FINEX Development Project in POSCO in Sanghoon Joo RIST, Republic of Korea
The detailed objectives are as follows:
Finex, a coal-based smelting reduction process, continues to be jointly developed by Posco, RIST and Voest-Alpine. This process is reported to be a more advanced smelting reduction technology than Corex. A 150-tonne/day pilot plant is under construction at the Posco Pohang Works based on the success achieved with a smaller 15-tonne/day unit: completion is scheduled for March 1999. It is reported that advantages include the use of fine ore and non-coking coal together with lower construction costs, reduced emissions and lower manpower and production costs than the Corex process.
\\Da0002\01052901\common\DOE REPORT OCT 2000\Section 3.doc Page 41 of 50
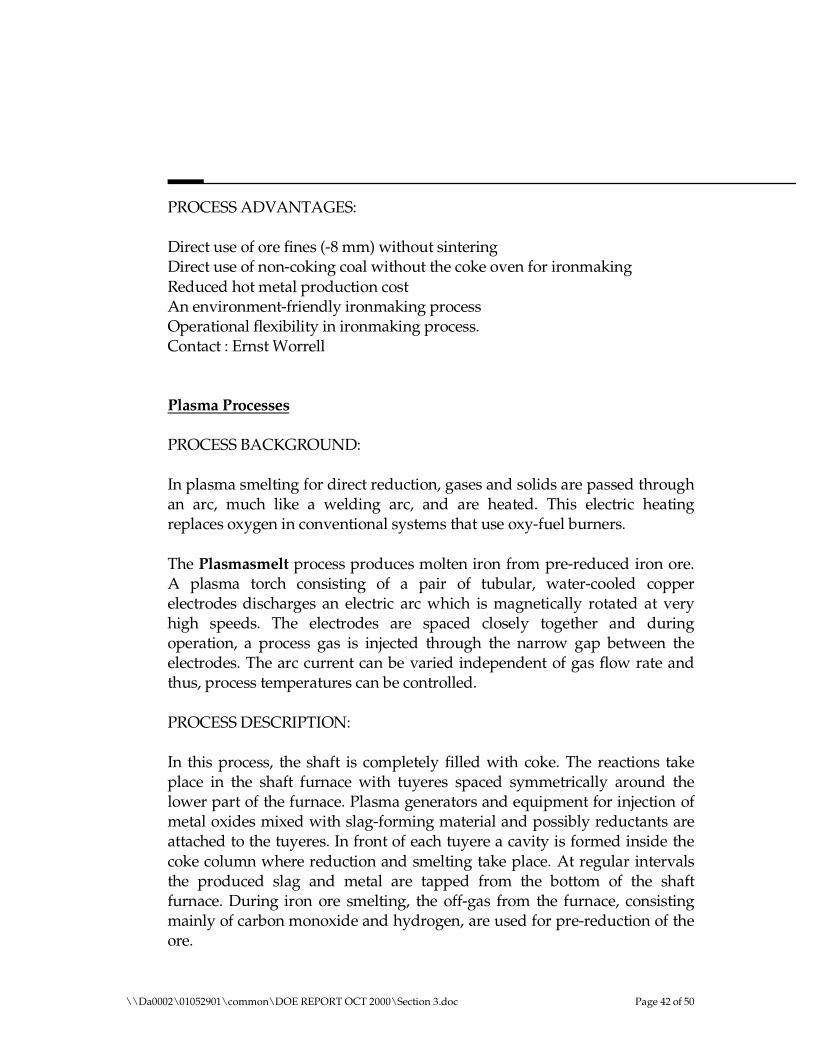
PROCESS ADVANTAGES:
Direct use of ore fines (-8 mm) without sinteringDirect use of non-coking coal without the coke oven for ironmakingReduced hot metal production costAn environment-friendly ironmaking processOperational flexibility in ironmaking process.Contact : Ernst Worrell
Plasma Processes
PROCESS BACKGROUND:
In plasma smelting for direct reduction, gases and solids are passed through an arc, much like a welding arc, and are heated. This electric heating replaces oxygen in conventional systems that use oxy-fuel burners.
The Plasmasmelt process produces molten iron from pre-reduced iron ore. A plasma torch consisting of a pair of tubular, water-cooled copper electrodes discharges an electric arc which is magnetically rotated at very high speeds. The electrodes are spaced closely together and during operation, a process gas is injected through the narrow gap between the electrodes. The arc current can be varied independent of gas flow rate and thus, process temperatures can be controlled.
PROCESS DESCRIPTION:
In this process, the shaft is completely filled with coke. The reactions take place in the shaft furnace with tuyeres spaced symmetrically around the lower part of the furnace. Plasma generators and equipment for injection of metal oxides mixed with slag-forming material and possibly reductants are attached to the tuyeres. In front of each tuyere a cavity is formed inside the coke column where reduction and smelting take place. At regular intervals the produced slag and metal are tapped from the bottom of the shaft furnace. During iron ore smelting, the off-gas from the furnace, consisting mainly of carbon monoxide and hydrogen, are used for pre-reduction of the ore.
\\Da0002\01052901\common\DOE REPORT OCT 2000\Section 3.doc Page 42 of 50
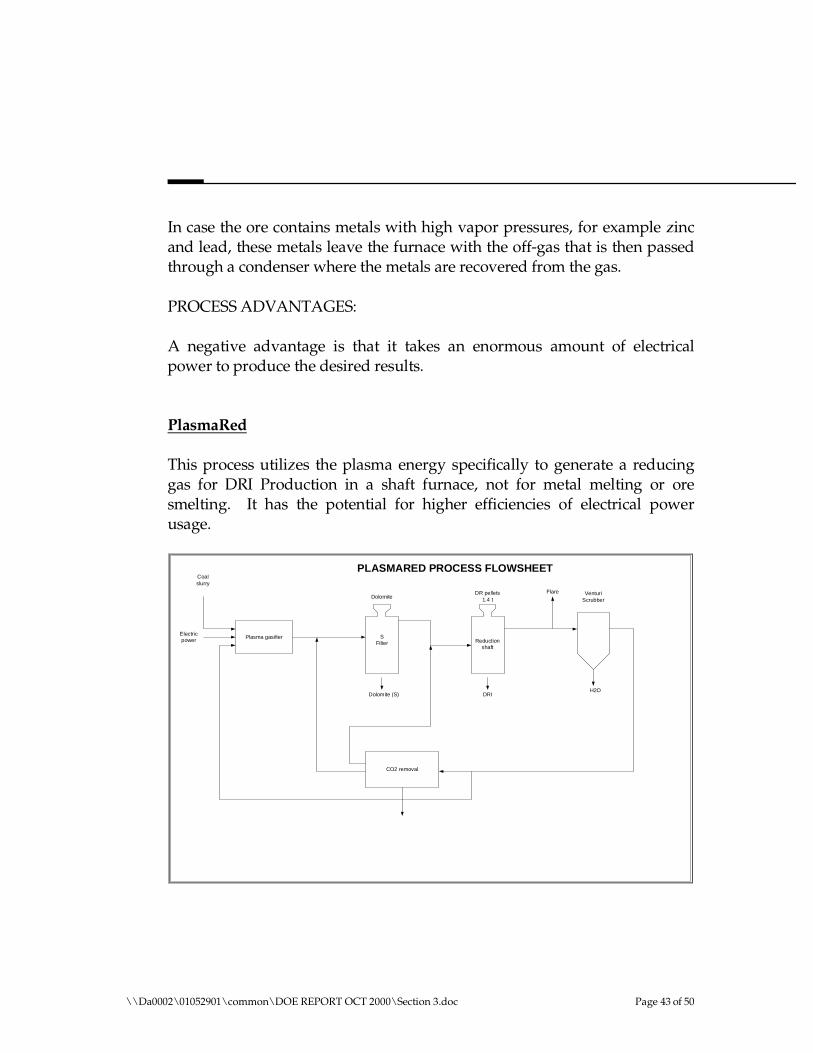
In case the ore contains metals with high vapor pressures, for example zinc and lead, these metals leave the furnace with the off-gas that is then passed through a condenser where the metals are recovered from the gas.
PROCESS ADVANTAGES:
A negative advantage is that it takes an enormous amount of electrical power to produce the desired results.
PlasmaRed
This process utilizes the plasma energy specifically to generate a reducing gas for DRI Production in a shaft furnace, not for metal melting or ore smelting. It has the potential for higher efficiencies of electrical power usage.
PLASMARED PROCESS FLOWSHEET
Plasma gasifier S Filter Reduction
shaft
Venturi Scrubber
CO2 removal
Coal slurry
Electric power
Dolomite
Dolomite (S)
DR pellets 1.4 t
DRI
Flare
H2O
\\Da0002\01052901\common\DOE REPORT OCT 2000\Section 3.doc Page 43 of 50
AISI Process
PROCESS BACKGROUND:
The AISI direct steelmaking project was a collaborative research programmeheavily supported by the US DOE, by the Steel industry and by academicinstitutions. But now it has been discontinued largely. Hoogovens hascontinued some work in this area as a source of semi-reduced feedstock fortheir other project, the cyclone converter furnace.
PROCESS DESCRIPTION:
The AISI process directly uses fine ores and coals to produce molten iron ina two-stage process. In the first stage, ore is pre-reduced and melted in amelting cyclone. Directly connected to the melting cyclone is a convertertype vessel where pre-reduced and melted ore undergoes final reduction.Post-combustion of gases takes place that improves energy efficiency, andthe waste gases are used for pre-reduction of the pellets. A vertical smelterwas used initially, but a design change to a horizontal reactor has been madewhich is expected to improve productivity and flexibility.
PROCESS ADVANTAGES
Direct smelting processProduces liquid hot metalReduced direct electrical power consumption
3-3: Process Groupings
In the initial screening analysis of the various Ironmaking processes, there was an attempt to categorize or group the processes into similar groups. The purpose was to be in a position to select one or two outstanding Ironmaking processes from a given group to compare with selected processes from other groups. These efforts were not completely successful due to the diverse nature of the various Ironmaking processes, the variety of forms of iron produced and the different sources of energy utilized for the processes.
\\Da0002\01052901\common\DOE REPORT OCT 2000\Section 3.doc Page 44 of 50
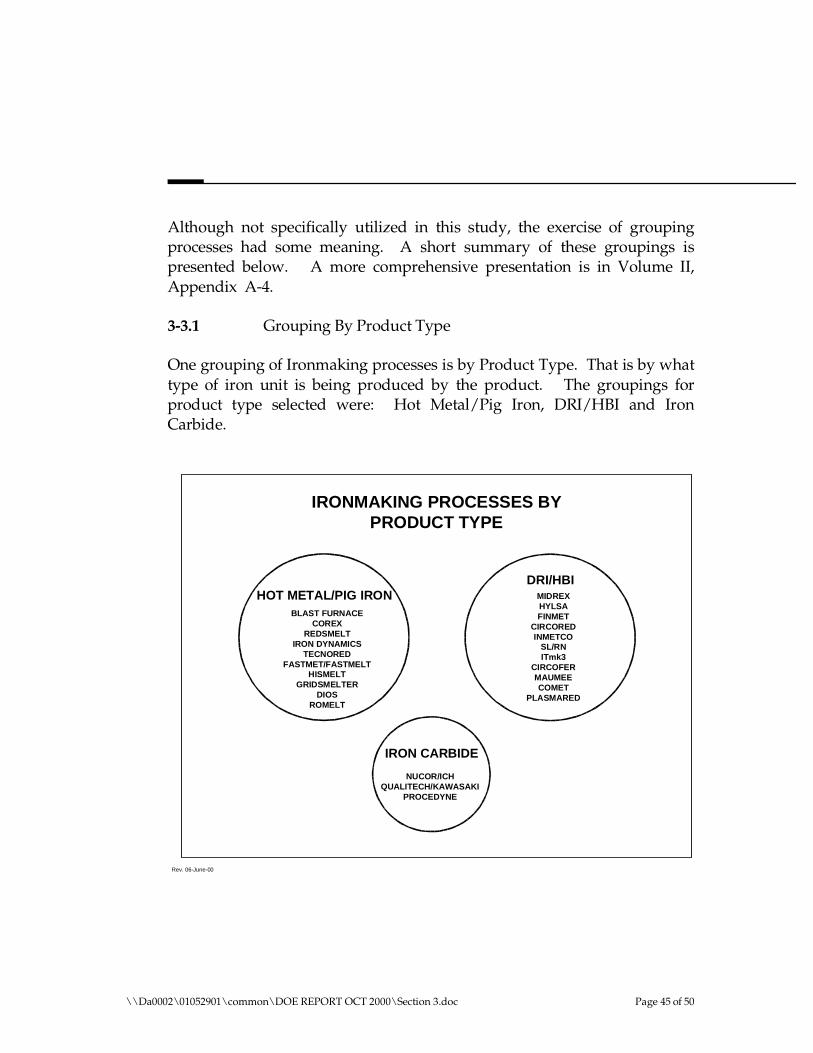
Although not specifically utilized in this study, the exercise of grouping processes had some meaning. A short summary of these groupings is presented below. A more comprehensive presentation is in Volume II, Appendix A-4.
3-3.1 Grouping By Product Type
One grouping of Ironmaking processes is by Product Type. That is by what type of iron unit is being produced by the product. The groupings for product type selected were: Hot Metal/Pig Iron, DRI/HBI and Iron Carbide.
IRONMAKING PROCESSES BY PRODUCT TYPE
HOT METAL/PIG IRON BLAST FURNACE
COREX REDSMELT
IRON DYNAMICS TECNORED
FASTMET/FASTMELT HISMELT
GRIDSMELTER DIOS
ROMELT
DRI/HBI MIDREX HYLSA FINMET
CIRCORED INMETCO
SL/RN ITmk3
CIRCOFER MAUMEE COMET
PLASMARED
IRON CARBIDE
NUCOR/ICH QUALITECH/KAWASAKI
PROCEDYNE
Rev. 06-June-00
\\Da0002\01052901\common\DOE REPORT OCT 2000\Section 3.doc Page 45 of 50
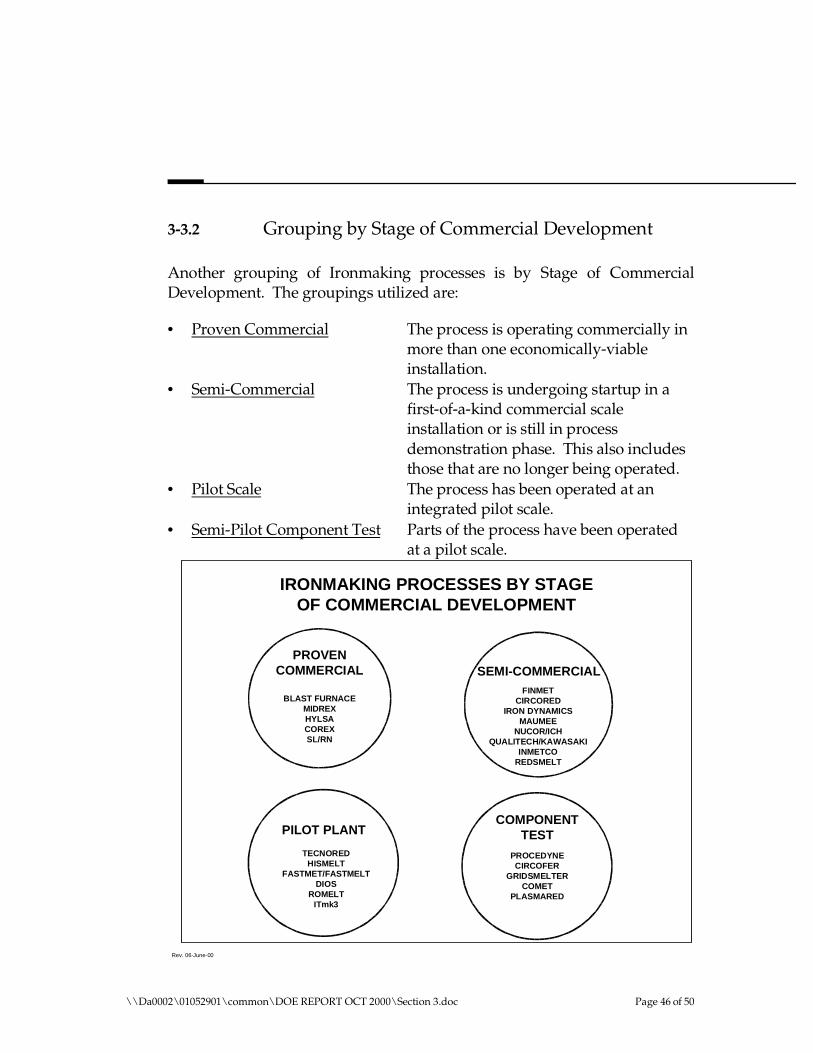
3-3.2 Grouping by Stage of Commercial Development
Another grouping of Ironmaking processes is by Stage of Commercial Development. The groupings utilized are:
• Proven Commercial The process is operating commercially in more than one economically-viable installation.
• Semi-Commercial The process is undergoing startup in a first-of-a-kind commercial scale installation or is still in process demonstration phase. This also includes those that are no longer being operated.
• Pilot Scale The process has been operated at an integrated pilot scale.
• Semi-Pilot Component Test Parts of the process have been operated at a pilot scale.
IRONMAKING PROCESSES BY STAGE OF COMMERCIAL DEVELOPMENT
PROVEN COMMERCIAL
BLAST FURNACE MIDREX HYLSA COREX SL/RN
SEMI-COMMERCIAL
FINMET CIRCORED
IRON DYNAMICS MAUMEE
NUCOR/ICH QUALITECH/KAWASAKI
INMETCO REDSMELT
PILOT PLANT
TECNORED HISMELT
FASTMET/FASTMELT DIOS
ROMELT ITmk3
COMPONENT TEST
PROCEDYNE CIRCOFER
GRIDSMELTER COMET
PLASMARED
Rev. 06-June-00
\\Da0002\01052901\common\DOE REPORT OCT 2000\Section 3.doc Page 46 of 50
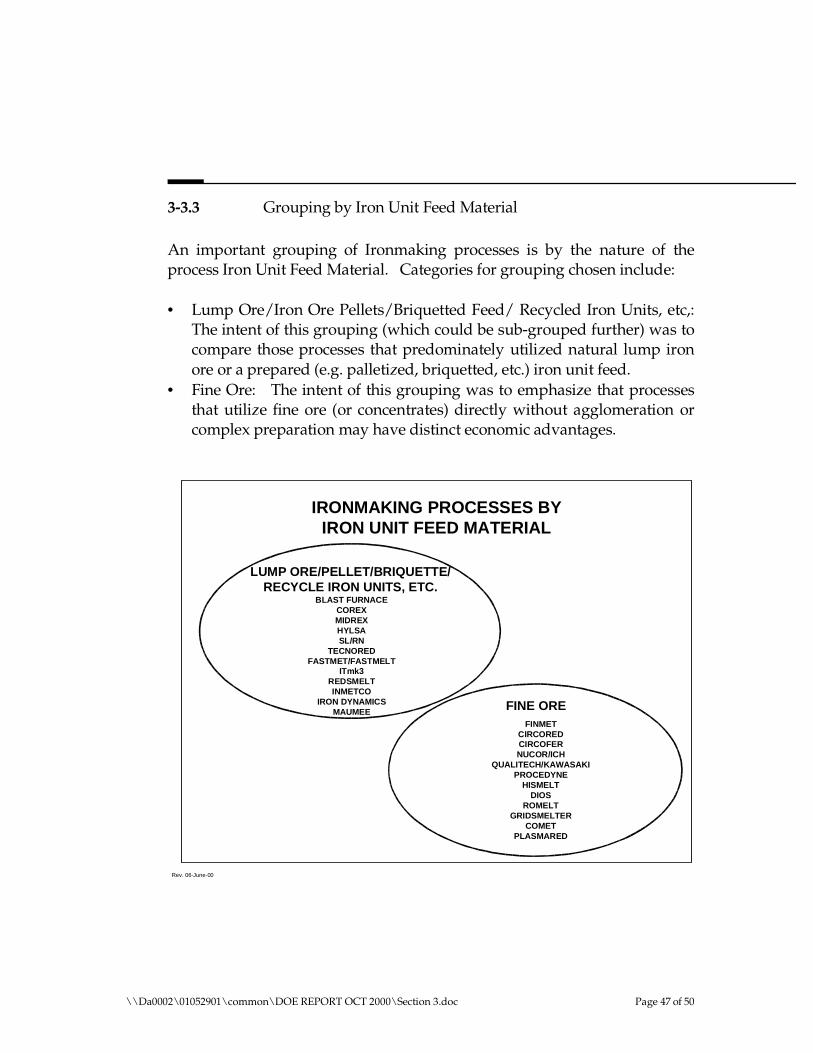
3-3.3 Grouping by Iron Unit Feed Material
An important grouping of Ironmaking processes is by the nature of the process Iron Unit Feed Material. Categories for grouping chosen include:
• Lump Ore/Iron Ore Pellets/Briquetted Feed/ Recycled Iron Units, etc,: The intent of this grouping (which could be sub-grouped further) was to compare those processes that predominately utilized natural lump iron ore or a prepared (e.g. palletized, briquetted, etc.) iron unit feed.
• Fine Ore: The intent of this grouping was to emphasize that processes that utilize fine ore (or concentrates) directly without agglomeration or complex preparation may have distinct economic advantages.
IRONMAKING PROCESSES BY IRON UNIT FEED MATERIAL
LUMP ORE/PELLET/BRIQUETTE/ RECYCLE IRON UNITS, ETC.
BLAST FURNACE COREX MIDREX HYLSA SL/RN
TECNORED FASTMET/FASTMELT
ITmk3 REDSMELT INMETCO
IRON DYNAMICS MAUMEE
FINE OREFINMET
CIRCORED CIRCOFER NUCOR/ICH
QUALITECH/KAWASAKI PROCEDYNE
HISMELT DIOS
ROMELT GRIDSMELTER
COMET PLASMARED
Rev. 06-June-00
\\Da0002\01052901\common\DOE REPORT OCT 2000\Section 3.doc Page 47 of 50

3-3.4 Grouping by Primary Reductant Type
An important categorization criteria for Ironmaking processes is to group by Primary Reductant Type. The groupings are as follows:
• Coke: Metallurgical grade coke or coke of lesser quality (e.g. for Tecnored) is the primary reductant source.
• Predominately Coal: Non-Metallurgical coal is the primary reductant and fuel.
• Natural Gas/Reformed Gas: Either natural gas (subsequently reformed or used directly) and Reformed Gas (e.g. Sasol gas, Corex off-gas, etc.) is the primary reductant and fuel.
• Mixed Coal/Natural Gas systems utilize a balanced mixture of coal and natural gas as the fuel and/or reductant source.
IRONMAKING PROCESSES BY PRIMARY REDUCTANT TYPE
COKE
BLAST FURNACE TECNORED
PREDOMINATELY COAL COREX
TECNORED (OPTION) SL/RN
FASTMET/FASTMELT REDSMELT INMETCO
IRON DYNAMICS MAUMEE
CIRCOFER
NATURAL GAS/ H2/REFORMED GAS
MIDREX HYLSA
CIRCORED FINMET
NUCOR/ICH QUALITECH/KAWASAKI
PROCEDYNE PLASMARED
COAL/NATURAL GAS MIXTURE
ITmk3 HISMELT
DIOS ROMELT
GRIDSMELTER COMET
Rev. 06-June-00
\\Da0002\01052901\common\DOE REPORT OCT 2000\Section 3.doc Page 48 of 50
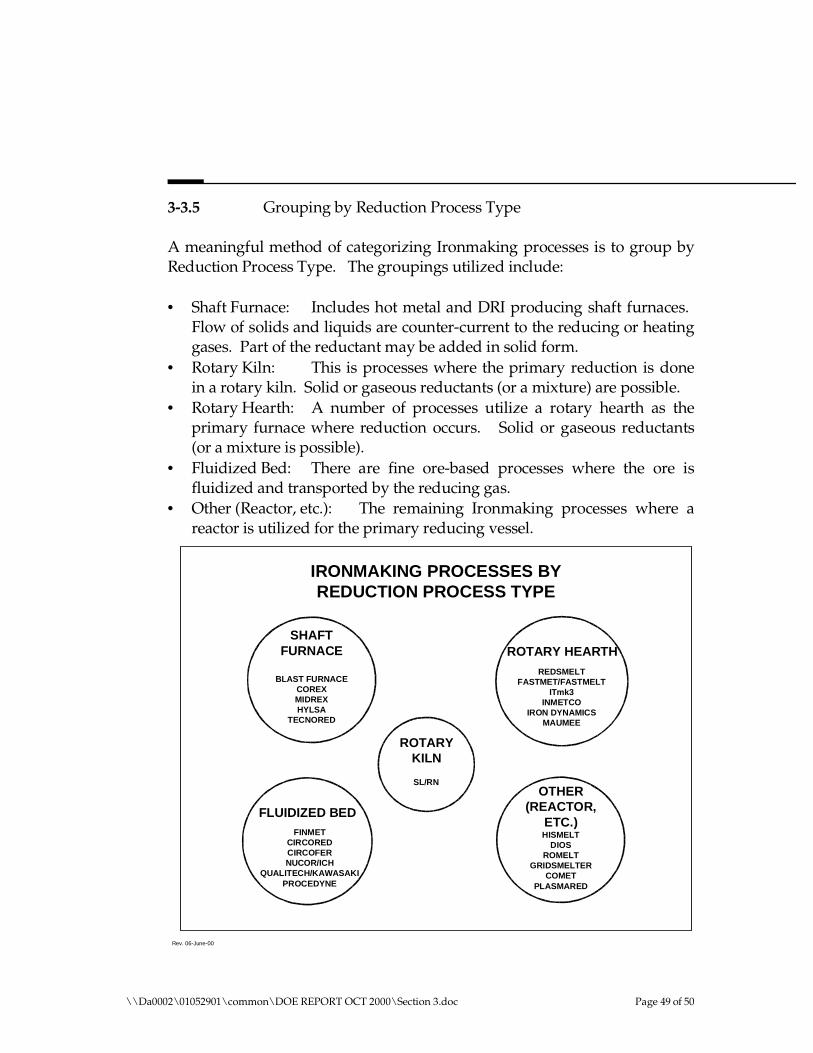
3-3.5 Grouping by Reduction Process Type
A meaningful method of categorizing Ironmaking processes is to group by Reduction Process Type. The groupings utilized include:
• Shaft Furnace: Includes hot metal and DRI producing shaft furnaces. Flow of solids and liquids are counter-current to the reducing or heating gases. Part of the reductant may be added in solid form.
• Rotary Kiln: This is processes where the primary reduction is done in a rotary kiln. Solid or gaseous reductants (or a mixture) are possible.
• Rotary Hearth: A number of processes utilize a rotary hearth as the primary furnace where reduction occurs. Solid or gaseous reductants (or a mixture is possible).
• Fluidized Bed: There are fine ore-based processes where the ore is fluidized and transported by the reducing gas.
• Other (Reactor, etc.): The remaining Ironmaking processes where a reactor is utilized for the primary reducing vessel.
IRONMAKING PROCESSES BY REDUCTION PROCESS TYPE
SHAFT FURNACE
BLAST FURNACE COREX MIDREX HYLSA
TECNORED
ROTARY HEARTH
REDSMELT FASTMET/FASTMELT
ITmk3 INMETCO
IRON DYNAMICS MAUMEE
FLUIDIZED BED
FINMET CIRCORED CIRCOFER NUCOR/ICH
QUALITECH/KAWASAKI PROCEDYNE
OTHER (REACTOR,
ETC.) HISMELT
DIOS ROMELT
GRIDSMELTER COMET
PLASMARED
ROTARY KILN
SL/RN
Rev. 06-June-00
\\Da0002\01052901\common\DOE REPORT OCT 2000\Section 3.doc Page 49 of 50

3-3.5 Grouping by Target Nominal Size of Reduction Unit/Train
This attempt at categorizing is based on the Nominal Size of the Primary Reduction Unit or Single-Train.
IRONMAKING PROCESSES BY TARGET NOMINAL SIZE OF REDUCTION UNIT/TRAIN
LESS THAN 200,000 MTPY
MAUMEE INMETCO ROMELT
GRIDSMELTER COMET
PLASMARED
200,000 TO 500,000 MTPY
TECNORED HISMELT
IRON DYNAMICS SL/RN
CIRCOFER NUCOR/ICH
QUALITECH/KAWASAKI PROCEDYNE
500,000 TO 1,000,000 MTPY
REDSMELT FINMET
CIRCORED FASTMET/FASTMELT
ITMK3 DIOS
GREATER THAN 1,000,000 MTPY
BLAST FURNACE COREX MIDREX HYLSA
Rev. 06-June-00
It should be noted that the categorization as done in Section 3-3.5, i.e. Grouping by Reduction Process Type is the method selected for the comparative process evaluation.
\\Da0002\01052901\common\DOE REPORT OCT 2000\Section 3.doc Page 50 of 50
Section 4: Discussion of Ranking Analysis
4-1: Ranking Variables Considered
The methodology followed in comparing the various Ironmaking Processeswas to sort and rank the processes by the order of the specific processvariables considered. That is, the process with the lowest (or highest) valueas appropriate for a specific variable is ranked first, the next lowest (orhighest), is ranked second, and so on until the poorest process is rankedlast.The selected processes are listed in Section 3-1.2.
The ranking variables include:
• Capital Cost (CAPEX): The Relative Capital Costs as $/Annual metric ton of Liquid Refined Steel Production of the Ironmaking/EAF/LRF Steelmaking processes as summarized in Section 2-4.1 and in detail in Volume II, Appendix F-5.
• Operating Costs Per Iron Unit (OPEX I.U.): The Relative Operating Costs of the Iron Unit Production as summarized in Section 2-4.3 and in detail in Volume II, Appendix F-4.
• Operating Costs Per LRS Production: The Relative Operating Costs per mt of LRS as summarized in Section 2-4.3 and in detail in Volume II, Appendix F-4.
• Simple Internal Rate Of Return (I.R.R.): Utilizing the Relative Capital and Operating Costs for LRS, a simple rate of return calculation was done to combine the impacts of Capital and Operating Costs. These are summarized in Volume II, Appendix G-1.
• Total Cumulative Electric Power Consumption: The cumulative electric power consumption (Volume II, Appendix F-3) through production of LRS.
• Total Cumulative Process Emissions: The Cumulative emissions of carbon gases (as CO2) from the Processes only (Volume II, Appendix F-3).
\\Da0002\01052901\common\DOE REPORT OCT 2000\Section 4.doc Page 1 of 39
• Total Cumulative Emissions: The cumulative emissions of carbon gases (as CO2) from the Process and the equivalent emissions from the total cumulative electrical power through production of LRS (Volume II, Appendix F-3).
The following tables summarize the specific variable quantities compared in the sorting and ranking exercises. These are sensitized by the cost of purchased steel scrap used in the EAF/LRF steelmaking processes. The derivation and explanation of these tables for the selected processes are presented in Volume II, Appendix G-1.
\\Da0002\01052901\common\DOE REPORT OCT 2000\Section 4.doc Page 2 of 39
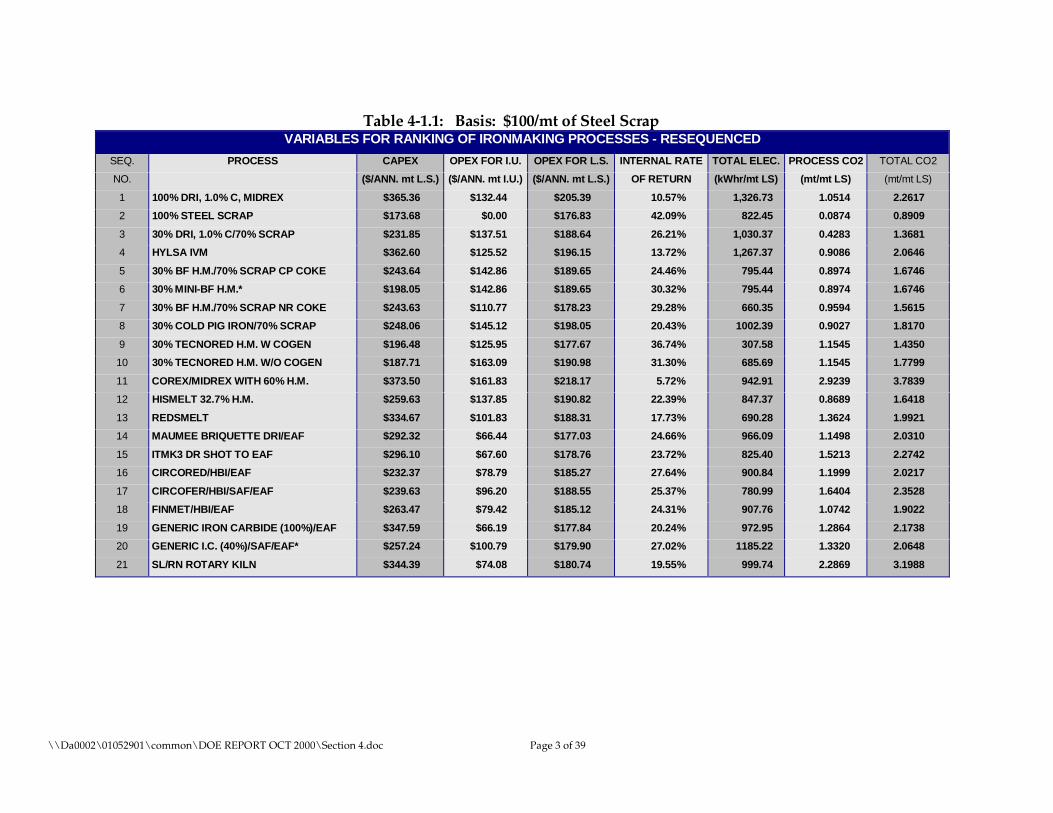
Table 4-1.1: Basis: $100/mt of Steel Scrap VARIABLES FOR RANKING OF IRONMAKING PROCESSES - RESEQUENCED
SEQ. PROCESS CAPEX OPEX FOR I.U. OPEX FOR L.S. INTERNAL RATE TOTAL ELEC. PROCESS CO2 TOTAL CO2
NO. ($/ANN. mt L.S.) ($/ANN. mt I.U.) ($/ANN. mt L.S.) OF RETURN (kWhr/mt LS) (mt/mt LS) (mt/mt LS)
1 100% DRI, 1.0% C, MIDREX $365.36 $132.44 $205.39 10.57% 1,326.73 1.0514 2.2617
2 100% STEEL SCRAP $173.68 $0.00 $176.83 42.09% 822.45 0.0874 0.8909
3 30% DRI, 1.0% C/70% SCRAP $231.85 $137.51 $188.64 26.21% 1,030.37 0.4283 1.3681
4 HYLSA IVM $362.60 $125.52 $196.15 13.72% 1,267.37 0.9086 2.0646
5 30% BF H.M./70% SCRAP CP COKE $243.64 $142.86 $189.65 24.46% 795.44 0.8974 1.6746
6 30% MINI-BF H.M.* $198.05 $142.86 $189.65 30.32% 795.44 0.8974 1.6746
7 30% BF H.M./70% SCRAP NR COKE $243.63 $110.77 $178.23 29.28% 660.35 0.9594 1.5615
8 30% COLD PIG IRON/70% SCRAP $248.06 $145.12 $198.05 20.43% 1002.39 0.9027 1.8170
9 30% TECNORED H.M. W COGEN $196.48 $125.95 $177.67 36.74% 307.58 1.1545 1.4350
10 30% TECNORED H.M. W/O COGEN $187.71 $163.09 $190.98 31.30% 685.69 1.1545 1.7799
11 COREX/MIDREX WITH 60% H.M. $373.50 $161.83 $218.17 5.72% 942.91 2.9239 3.7839
12 HISMELT 32.7% H.M. $259.63 $137.85 $190.82 22.39% 847.37 0.8689 1.6418
13 REDSMELT $334.67 $101.83 $188.31 17.73% 690.28 1.3624 1.9921
14 MAUMEE BRIQUETTE DRI/EAF $292.32 $66.44 $177.03 24.66% 966.09 1.1498 2.0310
15 ITMK3 DR SHOT TO EAF $296.10 $67.60 $178.76 23.72% 825.40 1.5213 2.2742
16 CIRCORED/HBI/EAF $232.37 $78.79 $185.27 27.64% 900.84 1.1999 2.0217
17 CIRCOFER/HBI/SAF/EAF $239.63 $96.20 $188.55 25.37% 780.99 1.6404 2.3528
18 FINMET/HBI/EAF $263.47 $79.42 $185.12 24.31% 907.76 1.0742 1.9022
19 GENERIC IRON CARBIDE (100%)/EAF $347.59 $66.19 $177.84 20.24% 972.95 1.2864 2.1738
20 GENERIC I.C. (40%)/SAF/EAF* $257.24 $100.79 $179.90 27.02% 1185.22 1.3320 2.0648
21 SL/RN ROTARY KILN $344.39 $74.08 $180.74 19.55% 999.74 2.2869 3.1988
\\Da0002\01052901\common\DOE REPORT OCT 2000\Section 4.doc Page 3 of 39
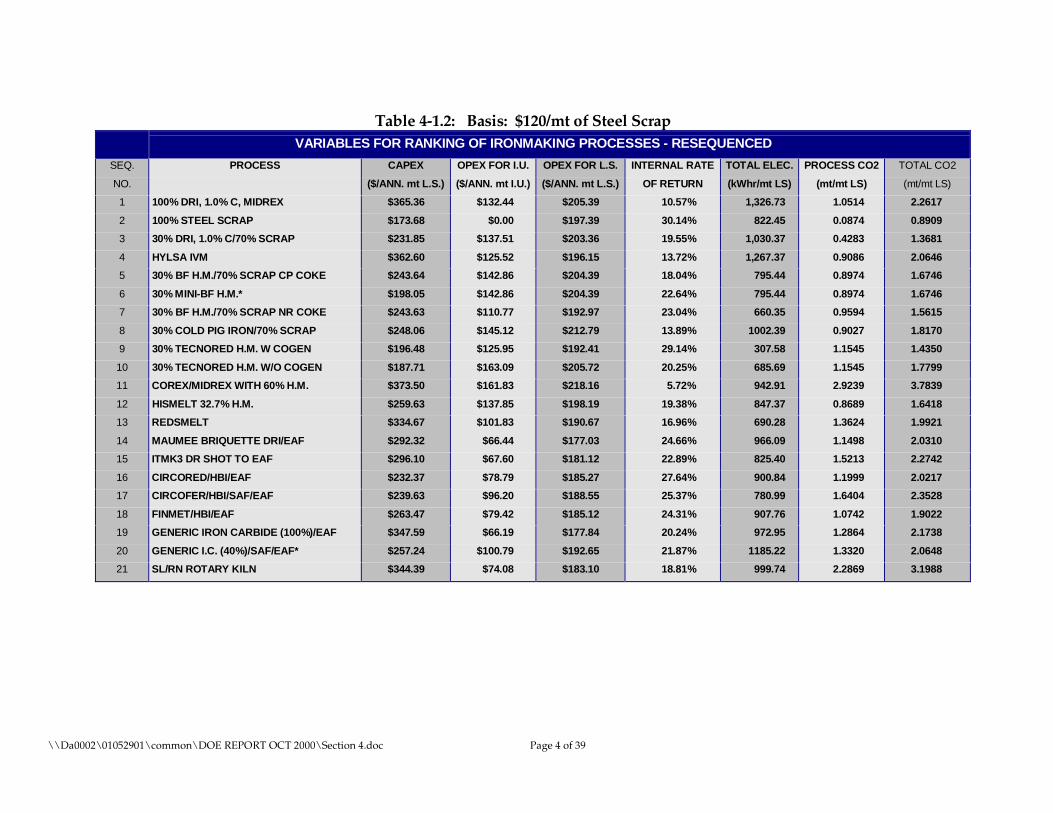
Table 4-1.2: Basis: $120/mt of Steel Scrap
SEQ.
NO.
1
2
3
4
5
6
7
8
9
10
11
12
13
14
15
16
17
18
19
20
21
VARIABLES FOR RANKING OF IRONMAKING PROCESSES - RESEQUENCED
PROCESS CAPEX OPEX FOR I.U. OPEX FOR L.S. INTERNAL RATE TOTAL ELEC. PROCESS CO2 TOTAL CO2
($/ANN. mt L.S.) ($/ANN. mt I.U.) ($/ANN. mt L.S.) OF RETURN (kWhr/mt LS) (mt/mt LS) (mt/mt LS)
100% DRI, 1.0% C, MIDREX $365.36 $132.44 $205.39 10.57% 1,326.73 1.0514 2.2617
100% STEEL SCRAP $173.68 $0.00 $197.39 30.14% 822.45 0.0874 0.8909
30% DRI, 1.0% C/70% SCRAP $231.85 $137.51 $203.36 19.55% 1,030.37 0.4283 1.3681
HYLSA IVM $362.60 $125.52 $196.15 13.72% 1,267.37 0.9086 2.0646
30% BF H.M./70% SCRAP CP COKE $243.64 $142.86 $204.39 18.04% 795.44 0.8974 1.6746
30% MINI-BF H.M.* $198.05 $142.86 $204.39 22.64% 795.44 0.8974 1.6746
30% BF H.M./70% SCRAP NR COKE $243.63 $110.77 $192.97 23.04% 660.35 0.9594 1.5615
30% COLD PIG IRON/70% SCRAP $248.06 $145.12 $212.79 13.89% 1002.39 0.9027 1.8170
30% TECNORED H.M. W COGEN $196.48 $125.95 $192.41 29.14% 307.58 1.1545 1.4350
30% TECNORED H.M. W/O COGEN $187.71 $163.09 $205.72 20.25% 685.69 1.1545 1.7799
COREX/MIDREX WITH 60% H.M. $373.50 $161.83 $218.16 5.72% 942.91 2.9239 3.7839
HISMELT 32.7% H.M. $259.63 $137.85 $198.19 19.38% 847.37 0.8689 1.6418
REDSMELT $334.67 $101.83 $190.67 16.96% 690.28 1.3624 1.9921
MAUMEE BRIQUETTE DRI/EAF $292.32 $66.44 $177.03 24.66% 966.09 1.1498 2.0310
ITMK3 DR SHOT TO EAF $296.10 $67.60 $181.12 22.89% 825.40 1.5213 2.2742
CIRCORED/HBI/EAF $232.37 $78.79 $185.27 27.64% 900.84 1.1999 2.0217
CIRCOFER/HBI/SAF/EAF $239.63 $96.20 $188.55 25.37% 780.99 1.6404 2.3528
FINMET/HBI/EAF $263.47 $79.42 $185.12 24.31% 907.76 1.0742 1.9022
GENERIC IRON CARBIDE (100%)/EAF $347.59 $66.19 $177.84 20.24% 972.95 1.2864 2.1738
GENERIC I.C. (40%)/SAF/EAF* $257.24 $100.79 $192.65 21.87% 1185.22 1.3320 2.0648
SL/RN ROTARY KILN $344.39 $74.08 $183.10 18.81% 999.74 2.2869 3.1988
\\Da0002\01052901\common\DOE REPORT OCT 2000\Section 4.doc Page 4 of 39
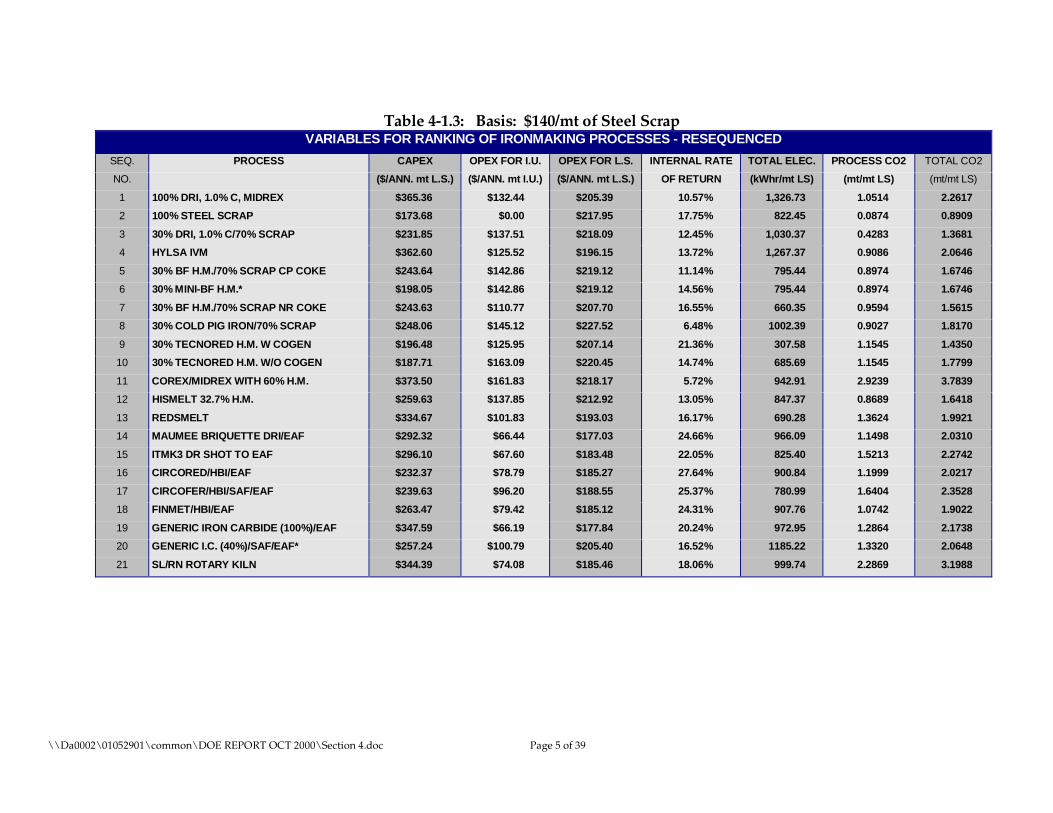
Table 4-1.3: Basis: $140/mt of Steel Scrap VARIABLES FOR RANKING OF IRONMAKING PROCESSES - RESEQUENCED
SEQ. PROCESS CAPEX OPEX FOR I.U. OPEX FOR L.S. INTERNAL RATE TOTAL ELEC. PROCESS CO2 TOTAL CO2
NO. ($/ANN. mt L.S.) ($/ANN. mt I.U.) ($/ANN. mt L.S.) OF RETURN (kWhr/mt LS) (mt/mt LS) (mt/mt LS)
1 100% DRI, 1.0% C, MIDREX $365.36 $132.44 $205.39 10.57% 1,326.73 1.0514 2.2617
2 100% STEEL SCRAP $173.68 $0.00 $217.95 17.75% 822.45 0.0874 0.8909
3 30% DRI, 1.0% C/70% SCRAP $231.85 $137.51 $218.09 12.45% 1,030.37 0.4283 1.3681
4 HYLSA IVM $362.60 $125.52 $196.15 13.72% 1,267.37 0.9086 2.0646
5 30% BF H.M./70% SCRAP CP COKE $243.64 $142.86 $219.12 11.14% 795.44 0.8974 1.6746
6 30% MINI-BF H.M.* $198.05 $142.86 $219.12 14.56% 795.44 0.8974 1.6746
7 30% BF H.M./70% SCRAP NR COKE $243.63 $110.77 $207.70 16.55% 660.35 0.9594 1.5615
8 30% COLD PIG IRON/70% SCRAP $248.06 $145.12 $227.52 6.48% 1002.39 0.9027 1.8170
9 30% TECNORED H.M. W COGEN $196.48 $125.95 $207.14 21.36% 307.58 1.1545 1.4350
10 30% TECNORED H.M. W/O COGEN $187.71 $163.09 $220.45 14.74% 685.69 1.1545 1.7799
11 COREX/MIDREX WITH 60% H.M. $373.50 $161.83 $218.17 5.72% 942.91 2.9239 3.7839
12 HISMELT 32.7% H.M. $259.63 $137.85 $212.92 13.05% 847.37 0.8689 1.6418
13 REDSMELT $334.67 $101.83 $193.03 16.17% 690.28 1.3624 1.9921
14 MAUMEE BRIQUETTE DRI/EAF $292.32 $66.44 $177.03 24.66% 966.09 1.1498 2.0310
15 ITMK3 DR SHOT TO EAF $296.10 $67.60 $183.48 22.05% 825.40 1.5213 2.2742
16 CIRCORED/HBI/EAF $232.37 $78.79 $185.27 27.64% 900.84 1.1999 2.0217
17 CIRCOFER/HBI/SAF/EAF $239.63 $96.20 $188.55 25.37% 780.99 1.6404 2.3528
18 FINMET/HBI/EAF $263.47 $79.42 $185.12 24.31% 907.76 1.0742 1.9022
19 GENERIC IRON CARBIDE (100%)/EAF $347.59 $66.19 $177.84 20.24% 972.95 1.2864 2.1738
20 GENERIC I.C. (40%)/SAF/EAF* $257.24 $100.79 $205.40 16.52% 1185.22 1.3320 2.0648
21 SL/RN ROTARY KILN $344.39 $74.08 $185.46 18.06% 999.74 2.2869 3.1988
\\Da0002\01052901\common\DOE REPORT OCT 2000\Section 4.doc Page 5 of 39

4-2: Sorting and Ranking By Capital Cost Estimates (Through L.S. Production)
The first variable sorted on was the Relative Capital Costs (as $/Annual mt of RLS production based on 1.0 MM mt of RLS per year production). The processes were arranged by ascending Relative Capital Costs. These processes were also assigned a Rank based on their new sequence as a result of the Relative Capital Cost sorting. This rank variable is used later (in Section 4.9) as a basis for obtaining weighted Rankings of the processes bases on total variable combinations.
Figure 4-2.1:(Not sensitized by Purchased Scrap Cost)
IRONMAKING PROCESSES SORTED BY ESTIMATED RELATIVE CAPITAL COSTS*
HIGHEST THIRD
ITMK3 REDSMELT RHF
SL/RN ROTARY KILN GENERIC IRON CARBIDE (100%)
HYLSA IVM SHAFT FCE. DRI (100%) MIDREX SHAFT FURNACE DRI (100%)
COREX/MIDREX
LOWEST THIRD
100% STEEL SCRAP TECHNORED W/O COGEN
TECHNORED WITH COGEN MINI BLAST FURNACE
30% DRI/70% STEEL SCRAP CIRCORED CIRCOFER
MIDDLE THIRD
BLAST FURNACE - N.R. COKE BLAST FURNACE - C.P. COKE
30% COLD PIG IRON/70% SCRAP 40% GEN. IRON CARBIDE/60% SCRAP
HISMELT FINMET
MAUMEE BRIQUETTE RHF
*NOTE: THROUGH LIQUID STEEL PRODUCTION
Rev. 04-Aug-00
\\Da0002\01052901\common\DOE REPORT OCT 2000\Section 4.doc Page 6 of 39
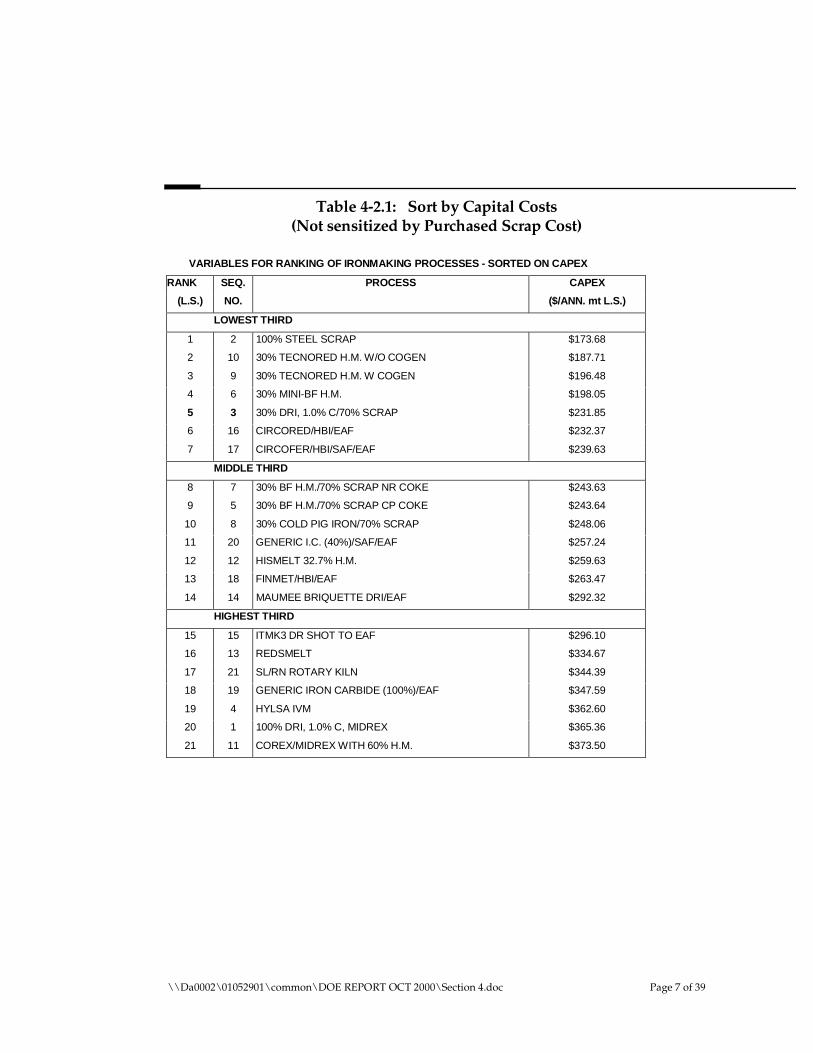
Table 4-2.1: Sort by Capital Costs(Not sensitized by Purchased Scrap Cost)
VARIABLES FOR RANKING OF IRONMAKING PROCESSES - SORTED ON CAPEX
RANK
(L.S.)
SEQ.
NO.
PROCESS CAPEX
($/ANN. mt L.S.)
LOWEST THIRD
1
2
3
4
5
6
7
2
10
9
6
3
16
17
100% STEEL SCRAP
30% TECNORED H.M. W/O COGEN
30% TECNORED H.M. W COGEN
30% MINI-BF H.M.
30% DRI, 1.0% C/70% SCRAP
CIRCORED/HBI/EAF
CIRCOFER/HBI/SAF/EAF
$173.68
$187.71
$196.48
$198.05
$231.85
$232.37
$239.63
MIDDLE THIRD
8
9
10
11
12
13
14
7
5
8
20
12
18
14
30% BF H.M./70% SCRAP NR COKE
30% BF H.M./70% SCRAP CP COKE
30% COLD PIG IRON/70% SCRAP
GENERIC I.C. (40%)/SAF/EAF
HISMELT 32.7% H.M.
FINMET/HBI/EAF
MAUMEE BRIQUETTE DRI/EAF
$243.63
$243.64
$248.06
$257.24
$259.63
$263.47
$292.32
HIGHEST THIRD
15
16
17
18
19
20
21
15
13
21
19
4
1
11
ITMK3 DR SHOT TO EAF
REDSMELT
SL/RN ROTARY KILN
GENERIC IRON CARBIDE (100%)/EAF
HYLSA IVM
100% DRI, 1.0% C, MIDREX
COREX/MIDREX WITH 60% H.M.
$296.10
$334.67
$344.39
$347.59
$362.60
$365.36
$373.50
\\Da0002\01052901\common\DOE REPORT OCT 2000\Section 4.doc Page 7 of 39
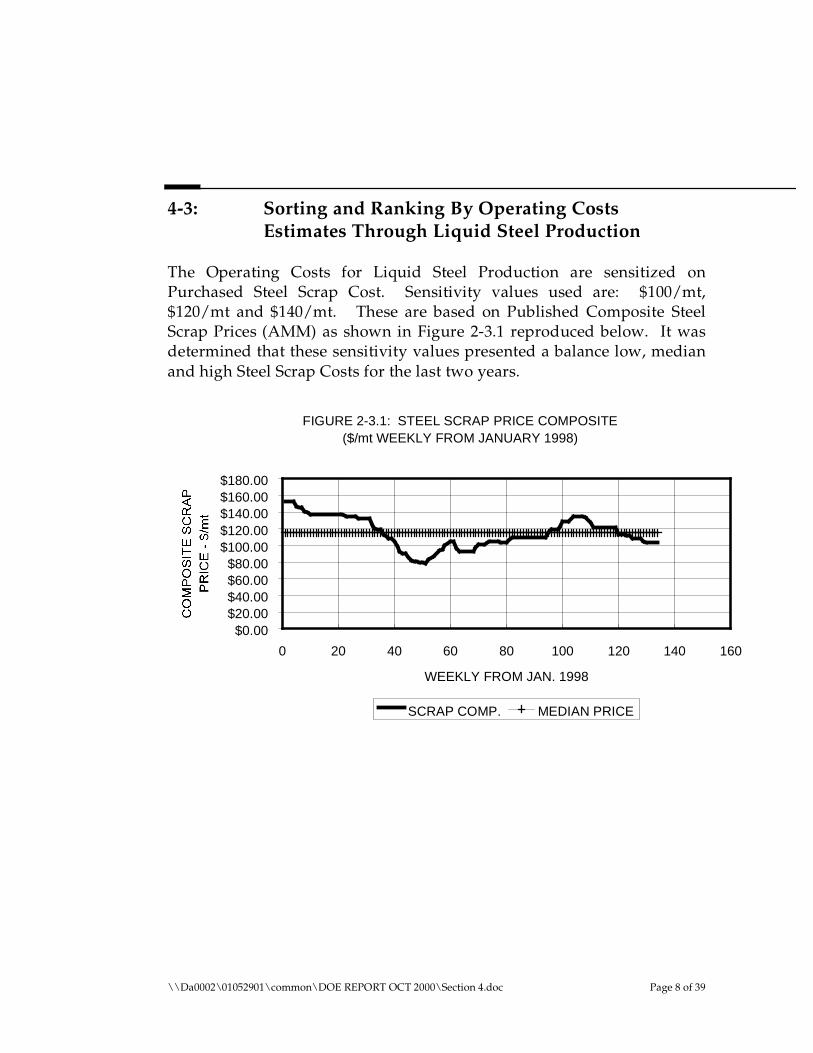
4-3: Sorting and Ranking By Operating Costs Estimates Through Liquid Steel Production
The Operating Costs for Liquid Steel Production are sensitized on Purchased Steel Scrap Cost. Sensitivity values used are: $100/mt, $120/mt and $140/mt. These are based on Published Composite Steel Scrap Prices (AMM) as shown in Figure 2-3.1 reproduced below. It was determined that these sensitivity values presented a balance low, median and high Steel Scrap Costs for the last two years.
FIGURE 2-3.1: STEEL SCRAP PRICE COMPOSITE ($/mt WEEKLY FROM JANUARY 1998)
$180.00 $160.00 $140.00 $120.00 $100.00
$80.00 $60.00 $40.00 $20.00
$0.00
0 20 40 60 80 100 120 140 160
WEEKLY FROM JAN. 1998
SCRAP COMP. MEDIAN PRICE
\\Da0002\01052901\common\DOE REPORT OCT 2000\Section 4.doc Page 8 of 39
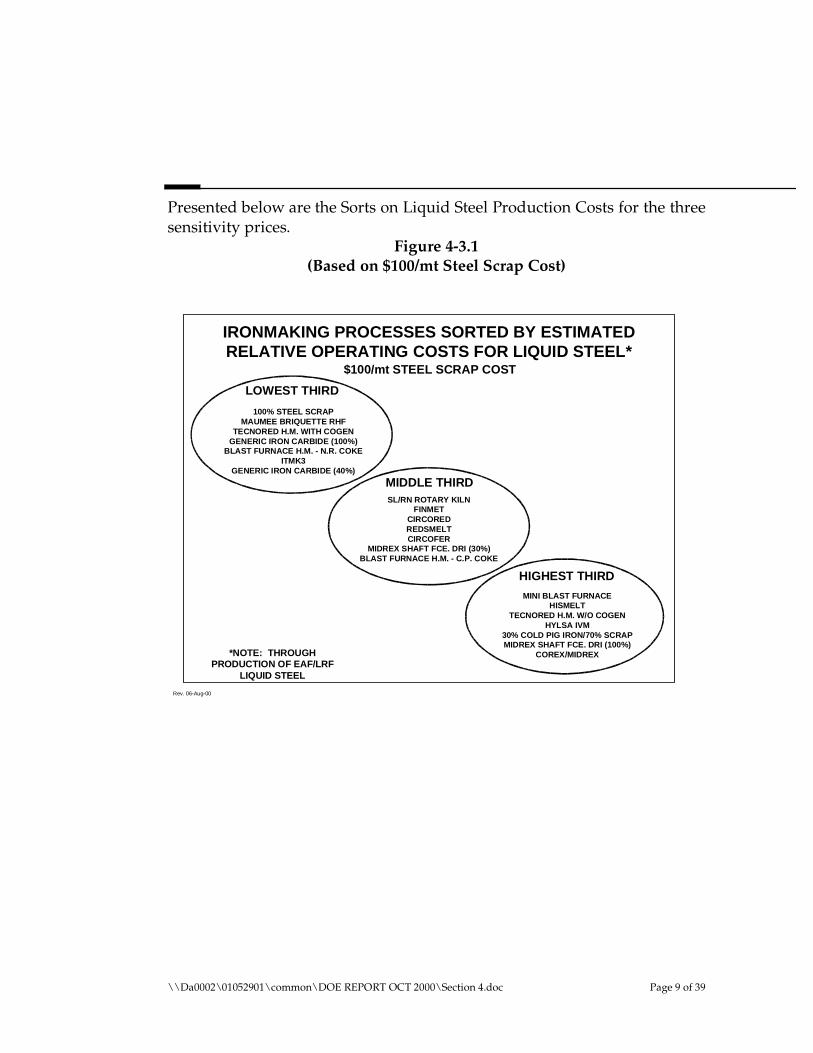
Presented below are the Sorts on Liquid Steel Production Costs for the three sensitivity prices.
Figure 4-3.1 (Based on $100/mt Steel Scrap Cost)
IRONMAKING PROCESSES SORTED BY ESTIMATED RELATIVE OPERATING COSTS FOR LIQUID STEEL*
HIGHEST THIRD
MINI BLAST FURNACE HISMELT
TECNORED H.M. W/O COGEN HYLSA IVM
30% COLD PIG IRON/70% SCRAP MIDREX SHAFT FCE. DRI (100%)
COREX/MIDREX
LOWEST THIRD
100% STEEL SCRAP MAUMEE BRIQUETTE RHF
TECNORED H.M. WITH COGEN GENERIC IRON CARBIDE (100%)
BLAST FURNACE H.M. - N.R. COKE ITMK3
GENERIC IRON CARBIDE (40%)
MIDDLE THIRD SL/RN ROTARY KILN
FINMET CIRCORED REDSMELT CIRCOFER
MIDREX SHAFT FCE. DRI (30%) BLAST FURNACE H.M. - C.P. COKE
*NOTE: THROUGH PRODUCTION OF EAF/LRF
LIQUID STEEL
$100/mt STEEL SCRAP COST
Rev. 06-Aug-00
\\Da0002\01052901\common\DOE REPORT OCT 2000\Section 4.doc Page 9 of 39
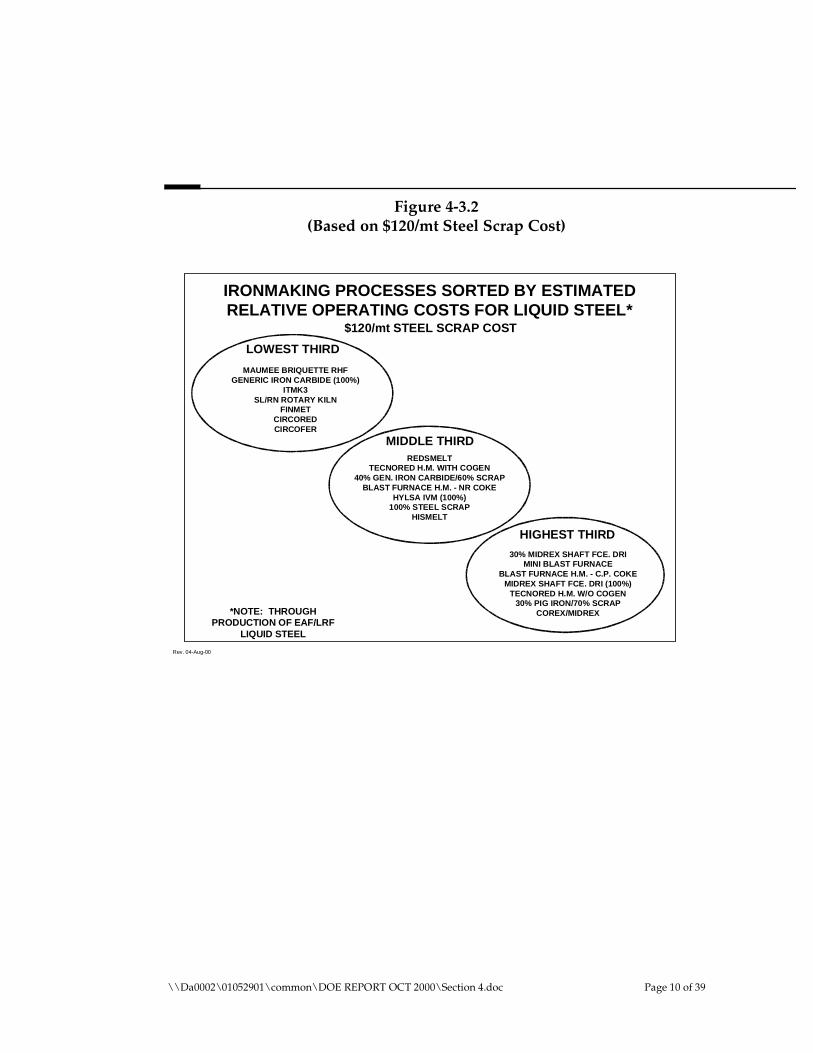
Figure 4-3.2(Based on $120/mt Steel Scrap Cost)
IRONMAKING PROCESSES SORTED BY ESTIMATED RELATIVE OPERATING COSTS FOR LIQUID STEEL*
HIGHEST THIRD
30% MIDREX SHAFT FCE. DRI MINI BLAST FURNACE
BLAST FURNACE H.M. - C.P. COKE MIDREX SHAFT FCE. DRI (100%)
TECNORED H.M. W/O COGEN 30% PIG IRON/70% SCRAP
COREX/MIDREX
LOWEST THIRD
MAUMEE BRIQUETTE RHF GENERIC IRON CARBIDE (100%)
ITMK3 SL/RN ROTARY KILN
FINMET CIRCORED CIRCOFER
MIDDLE THIRD REDSMELT
TECNORED H.M. WITH COGEN 40% GEN. IRON CARBIDE/60% SCRAP
BLAST FURNACE H.M. - NR COKE HYLSA IVM (100%)
100% STEEL SCRAP HISMELT
*NOTE: THROUGH PRODUCTION OF EAF/LRF
LIQUID STEEL
$120/mt STEEL SCRAP COST
Rev. 04-Aug-00
\\Da0002\01052901\common\DOE REPORT OCT 2000\Section 4.doc Page 10 of 39
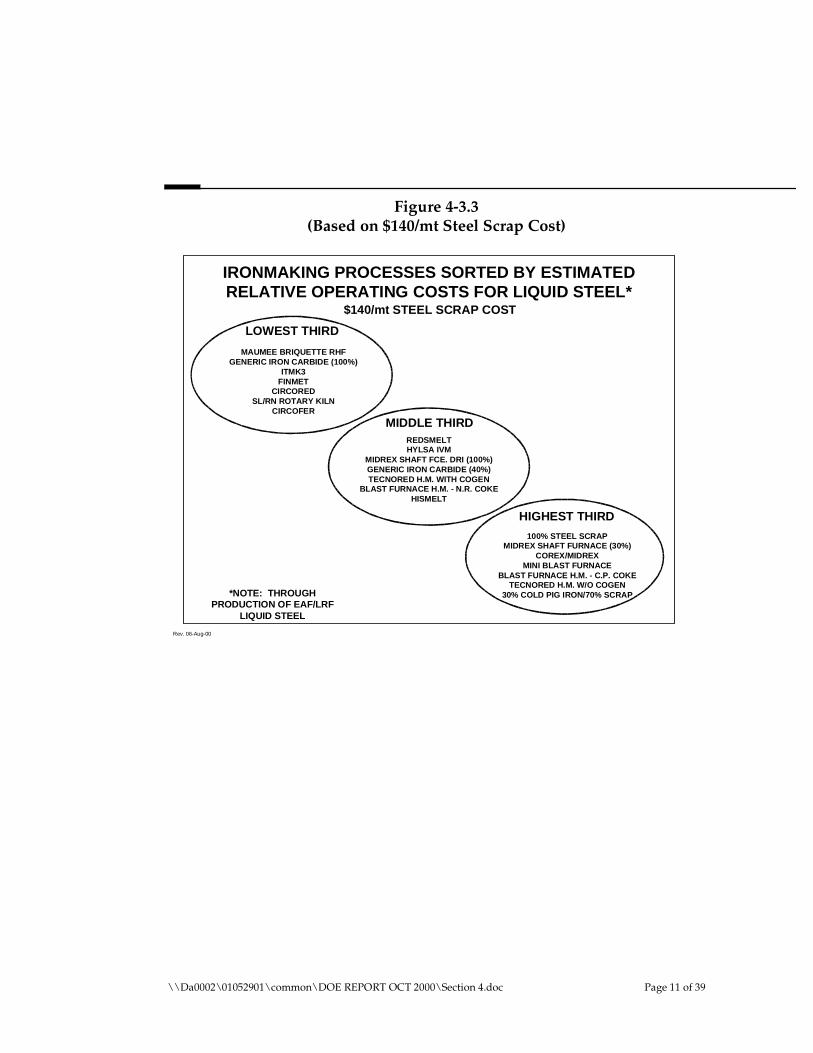
Figure 4-3.3(Based on $140/mt Steel Scrap Cost)
IRONMAKING PROCESSES SORTED BY ESTIMATED RELATIVE OPERATING COSTS FOR LIQUID STEEL*
HIGHEST THIRD
100% STEEL SCRAP MIDREX SHAFT FURNACE (30%)
COREX/MIDREX MINI BLAST FURNACE
BLAST FURNACE H.M. - C.P. COKE TECNORED H.M. W/O COGEN
30% COLD PIG IRON/70% SCRAP
LOWEST THIRD
MAUMEE BRIQUETTE RHF GENERIC IRON CARBIDE (100%)
ITMK3 FINMET
CIRCORED SL/RN ROTARY KILN
CIRCOFER
MIDDLE THIRD REDSMELT HYLSA IVM
MIDREX SHAFT FCE. DRI (100%) GENERIC IRON CARBIDE (40%) TECNORED H.M. WITH COGEN
BLAST FURNACE H.M. - N.R. COKE HISMELT
*NOTE: THROUGH PRODUCTION OF EAF/LRF
LIQUID STEEL
$140/mt STEEL SCRAP COST
Rev. 06-Aug-00
\\Da0002\01052901\common\DOE REPORT OCT 2000\Section 4.doc Page 11 of 39
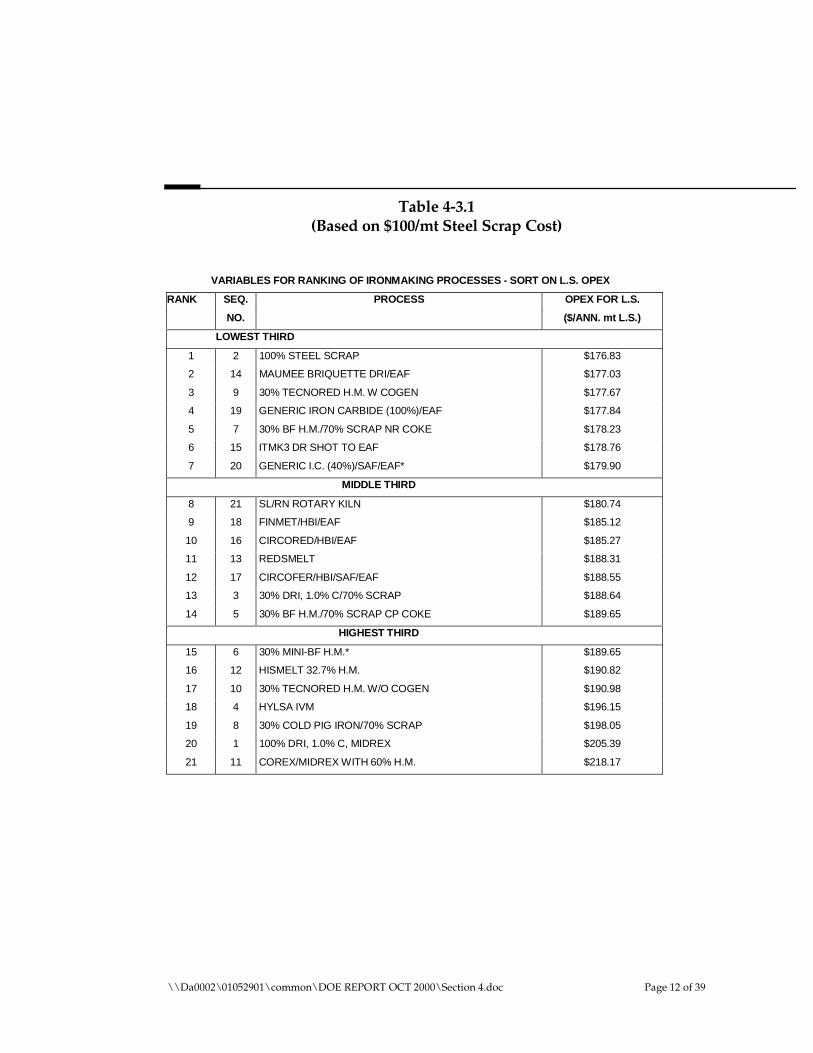
Table 4-3.1(Based on $100/mt Steel Scrap Cost)
VARIABLES FOR RANKING OF IRONMAKING PROCESSES - SORT ON L.S. OPEX
RANK SEQ.
NO.
PROCESS OPEX FOR L.S.
($/ANN. mt L.S.)
LOWEST THIRD
1
2
3
4
5
6
7
2
14
9
19
7
15
20
100% STEEL SCRAP
MAUMEE BRIQUETTE DRI/EAF
30% TECNORED H.M. W COGEN
GENERIC IRON CARBIDE (100%)/EAF
30% BF H.M./70% SCRAP NR COKE
ITMK3 DR SHOT TO EAF
GENERIC I.C. (40%)/SAF/EAF*
$176.83
$177.03
$177.67
$177.84
$178.23
$178.76
$179.90
MIDDLE THIRD
8
9
10
11
12
13
14
21
18
16
13
17
3
5
SL/RN ROTARY KILN
FINMET/HBI/EAF
CIRCORED/HBI/EAF
REDSMELT
CIRCOFER/HBI/SAF/EAF
30% DRI, 1.0% C/70% SCRAP
30% BF H.M./70% SCRAP CP COKE
$180.74
$185.12
$185.27
$188.31
$188.55
$188.64
$189.65
HIGHEST THIRD
15
16
17
18
19
20
21
6
12
10
4
8
1
11
30% MINI-BF H.M.*
HISMELT 32.7% H.M.
30% TECNORED H.M. W/O COGEN
HYLSA IVM
30% COLD PIG IRON/70% SCRAP
100% DRI, 1.0% C, MIDREX
COREX/MIDREX WITH 60% H.M.
$189.65
$190.82
$190.98
$196.15
$198.05
$205.39
$218.17
\\Da0002\01052901\common\DOE REPORT OCT 2000\Section 4.doc Page 12 of 39
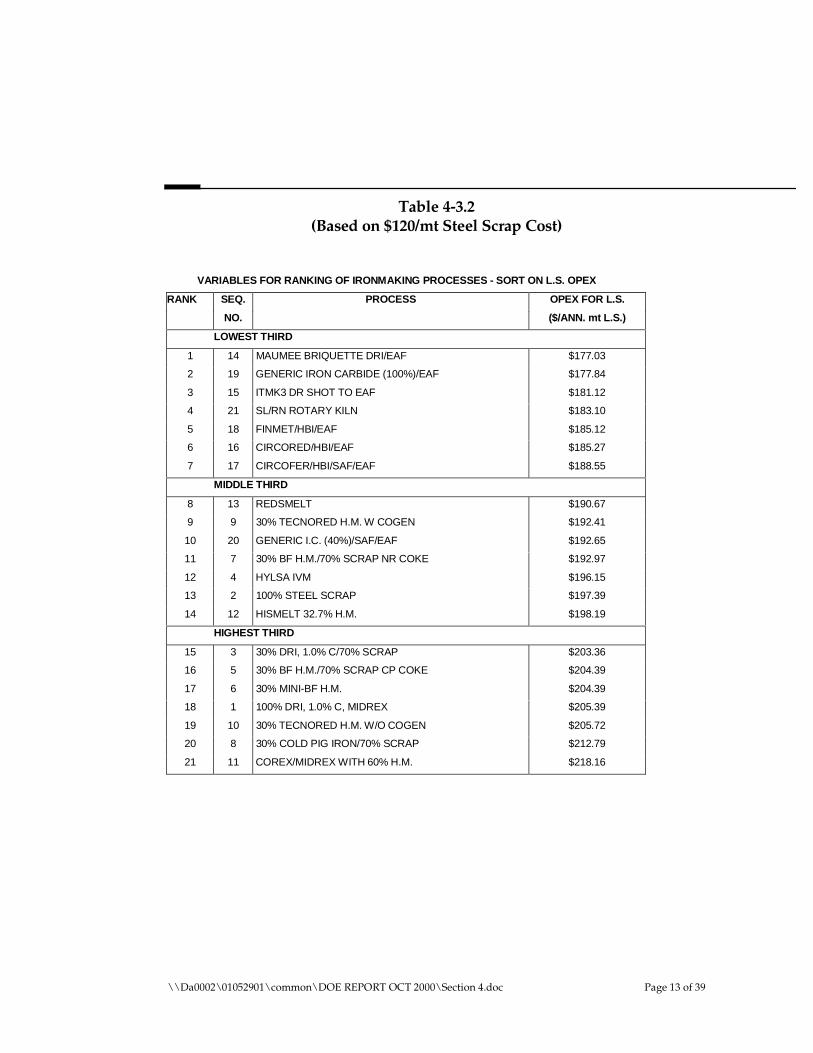
Table 4-3.2(Based on $120/mt Steel Scrap Cost)
VARIABLES FOR RANKING OF IRONMAKING PROCESSES - SORT ON L.S. OPEX
RANK SEQ.
NO.
PROCESS OPEX FOR L.S.
($/ANN. mt L.S.)
LOWEST THIRD
1
2
3
4
5
6
7
14
19
15
21
18
16
17
MAUMEE BRIQUETTE DRI/EAF
GENERIC IRON CARBIDE (100%)/EAF
ITMK3 DR SHOT TO EAF
SL/RN ROTARY KILN
FINMET/HBI/EAF
CIRCORED/HBI/EAF
CIRCOFER/HBI/SAF/EAF
$177.03
$177.84
$181.12
$183.10
$185.12
$185.27
$188.55
MIDDLE THIRD
8
9
10
11
12
13
14
13
9
20
7
4
2
12
REDSMELT
30% TECNORED H.M. W COGEN
GENERIC I.C. (40%)/SAF/EAF
30% BF H.M./70% SCRAP NR COKE
HYLSA IVM
100% STEEL SCRAP
HISMELT 32.7% H.M.
$190.67
$192.41
$192.65
$192.97
$196.15
$197.39
$198.19
HIGHEST THIRD
15
16
17
18
19
20
21
3
5
6
1
10
8
11
30% DRI, 1.0% C/70% SCRAP
30% BF H.M./70% SCRAP CP COKE
30% MINI-BF H.M.
100% DRI, 1.0% C, MIDREX
30% TECNORED H.M. W/O COGEN
30% COLD PIG IRON/70% SCRAP
COREX/MIDREX WITH 60% H.M.
$203.36
$204.39
$204.39
$205.39
$205.72
$212.79
$218.16
\\Da0002\01052901\common\DOE REPORT OCT 2000\Section 4.doc Page 13 of 39

Table 4-3.3(Based on $140/mt Steel Scrap Cost)
VARIABLES FOR RANKING OF IRONMAKING PROCESSES - SORT ON L.S. OPEX
RANK SEQ. PROCESS OPEX FOR L.S.
NO. ($/ANN. mt L.S.)
LOWEST THIRD
1 14 MAUMEE BRIQUETTE DRI/EAF $177.03
2 19 GENERIC IRON CARBIDE (100%)/EAF $177.84
3 15 ITMK3 DR SHOT TO EAF $183.48
4 18 FINMET/HBI/EAF $185.12
5 16 CIRCORED/HBI/EAF $185.27
6 21 SL/RN ROTARY KILN $185.46
7 17 CIRCOFER/HBI/SAF/EAF $188.55
MIDDLE THIRD
8 13 REDSMELT $193.03
9 4 HYLSA IVM $196.15
10 1 100% DRI, 1.0% C, MIDREX $205.39
11 20 GENERIC I.C. (40%)/SAF/EAF* $205.40
12 9 30% TECNORED H.M. W COGEN $207.14
13 7 30% BF H.M./70% SCRAP NR COKE $207.70
14 12 HISMELT 32.7% H.M. $212.92
HIGHEST THIRD
15 2 100% STEEL SCRAP $217.95
16 3 30% DRI, 1.0% C/70% SCRAP $218.09
17 11 COREX/MIDREX WITH 60% H.M. $218.17
18 6 30% MINI-BF H.M.* $219.12
19 5 30% BF H.M./70% SCRAP CP COKE $219.12
20 10 30% TECNORED H.M. W/O COGEN $220.45
21 8 30% COLD PIG IRON/70% SCRAP $227.52
\\Da0002\01052901\common\DOE REPORT OCT 2000\Section 4.doc Page 14 of 39
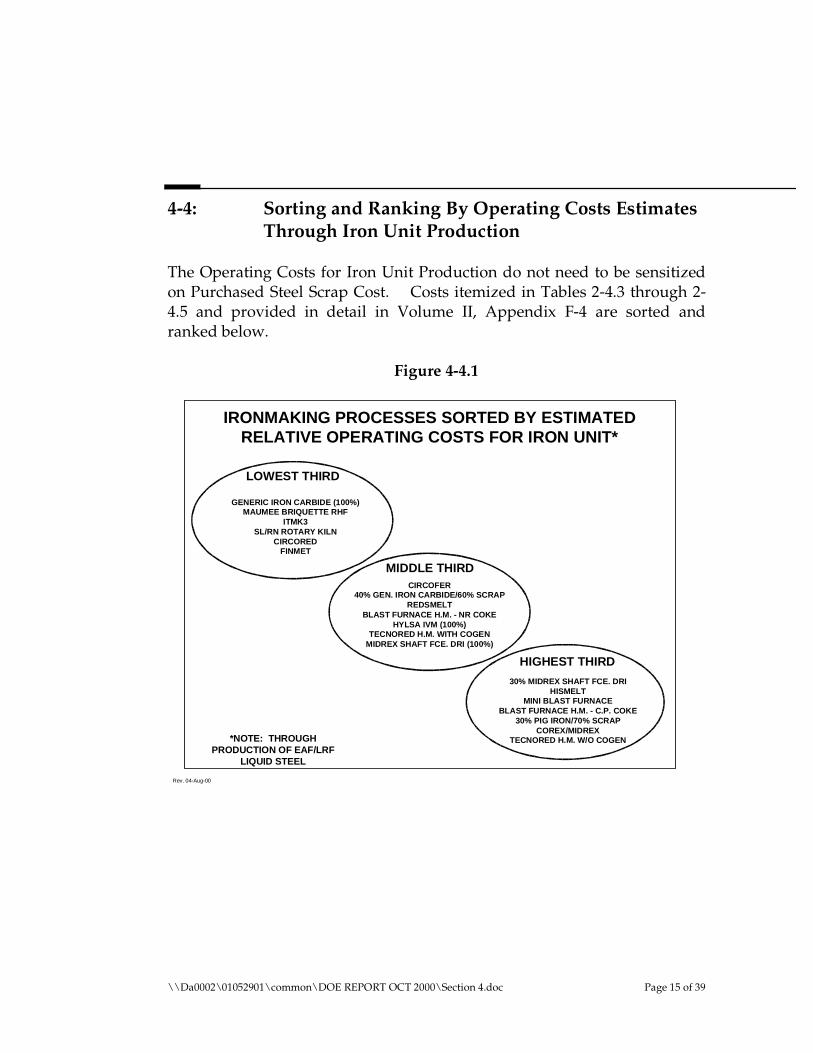
4-4: Sorting and Ranking By Operating Costs Estimates Through Iron Unit Production
The Operating Costs for Iron Unit Production do not need to be sensitized on Purchased Steel Scrap Cost. Costs itemized in Tables 2-4.3 through 2-4.5 and provided in detail in Volume II, Appendix F-4 are sorted and ranked below.
Figure 4-4.1
IRONMAKING PROCESSES SORTED BY ESTIMATED RELATIVE OPERATING COSTS FOR IRON UNIT*
HIGHEST THIRD
30% MIDREX SHAFT FCE. DRI HISMELT
MINI BLAST FURNACE BLAST FURNACE H.M. - C.P. COKE
30% PIG IRON/70% SCRAP COREX/MIDREX
TECNORED H.M. W/O COGEN
LOWEST THIRD
GENERIC IRON CARBIDE (100%) MAUMEE BRIQUETTE RHF
ITMK3 SL/RN ROTARY KILN
CIRCORED FINMET
MIDDLE THIRD CIRCOFER
40% GEN. IRON CARBIDE/60% SCRAP REDSMELT
BLAST FURNACE H.M. - NR COKE HYLSA IVM (100%)
TECNORED H.M. WITH COGEN MIDREX SHAFT FCE. DRI (100%)
*NOTE: THROUGH PRODUCTION OF EAF/LRF
LIQUID STEEL
Rev. 04-Aug-00
\\Da0002\01052901\common\DOE REPORT OCT 2000\Section 4.doc Page 15 of 39
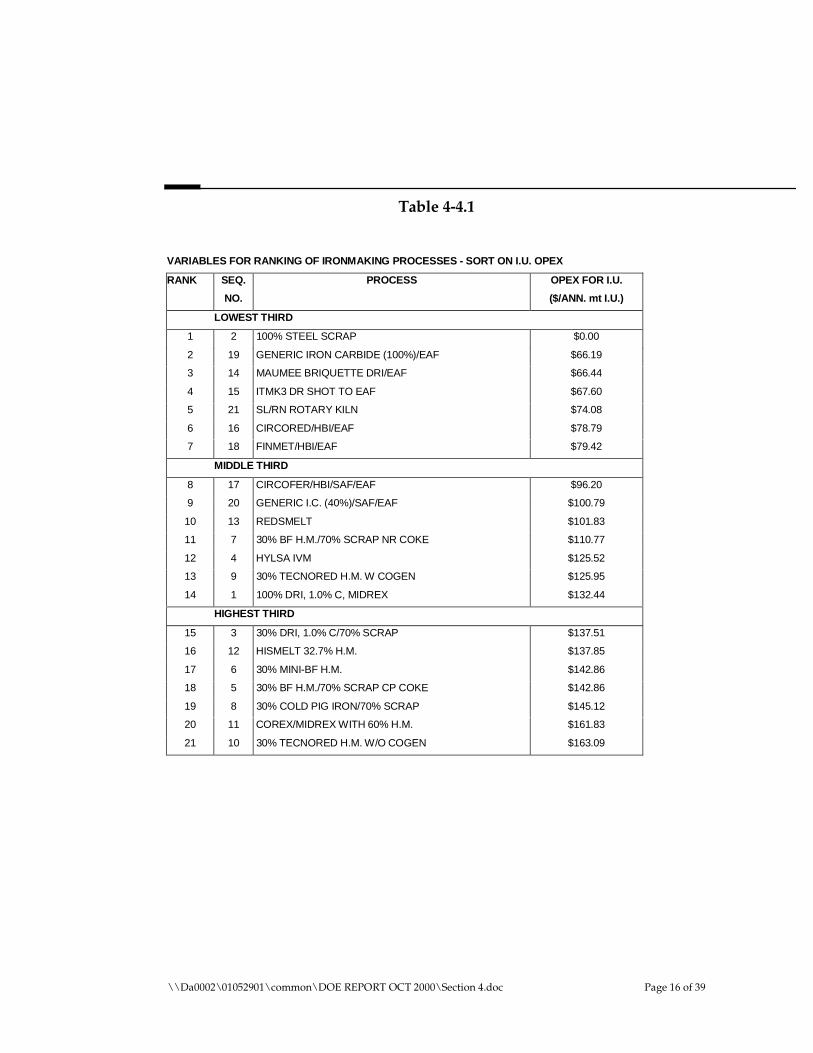
Table 4-4.1
VARIABLES FOR RANKING OF IRONMAKING PROCESSES - SORT ON I.U. OPEX
RANK SEQ.
NO.
PROCESS OPEX FOR I.U.
($/ANN. mt I.U.)
LOWEST THIRD
1
2
3
4
5
6
7
2
19
14
15
21
16
18
100% STEEL SCRAP
GENERIC IRON CARBIDE (100%)/EAF
MAUMEE BRIQUETTE DRI/EAF
ITMK3 DR SHOT TO EAF
SL/RN ROTARY KILN
CIRCORED/HBI/EAF
FINMET/HBI/EAF
$0.00
$66.19
$66.44
$67.60
$74.08
$78.79
$79.42
MIDDLE THIRD
8
9
10
11
12
13
14
17
20
13
7
4
9
1
CIRCOFER/HBI/SAF/EAF
GENERIC I.C. (40%)/SAF/EAF
REDSMELT
30% BF H.M./70% SCRAP NR COKE
HYLSA IVM
30% TECNORED H.M. W COGEN
100% DRI, 1.0% C, MIDREX
$96.20
$100.79
$101.83
$110.77
$125.52
$125.95
$132.44
HIGHEST THIRD
15
16
17
18
19
20
21
3
12
6
5
8
11
10
30% DRI, 1.0% C/70% SCRAP
HISMELT 32.7% H.M.
30% MINI-BF H.M.
30% BF H.M./70% SCRAP CP COKE
30% COLD PIG IRON/70% SCRAP
COREX/MIDREX WITH 60% H.M.
30% TECNORED H.M. W/O COGEN
$137.51
$137.85
$142.86
$142.86
$145.12
$161.83
$163.09
\\Da0002\01052901\common\DOE REPORT OCT 2000\Section 4.doc Page 16 of 39
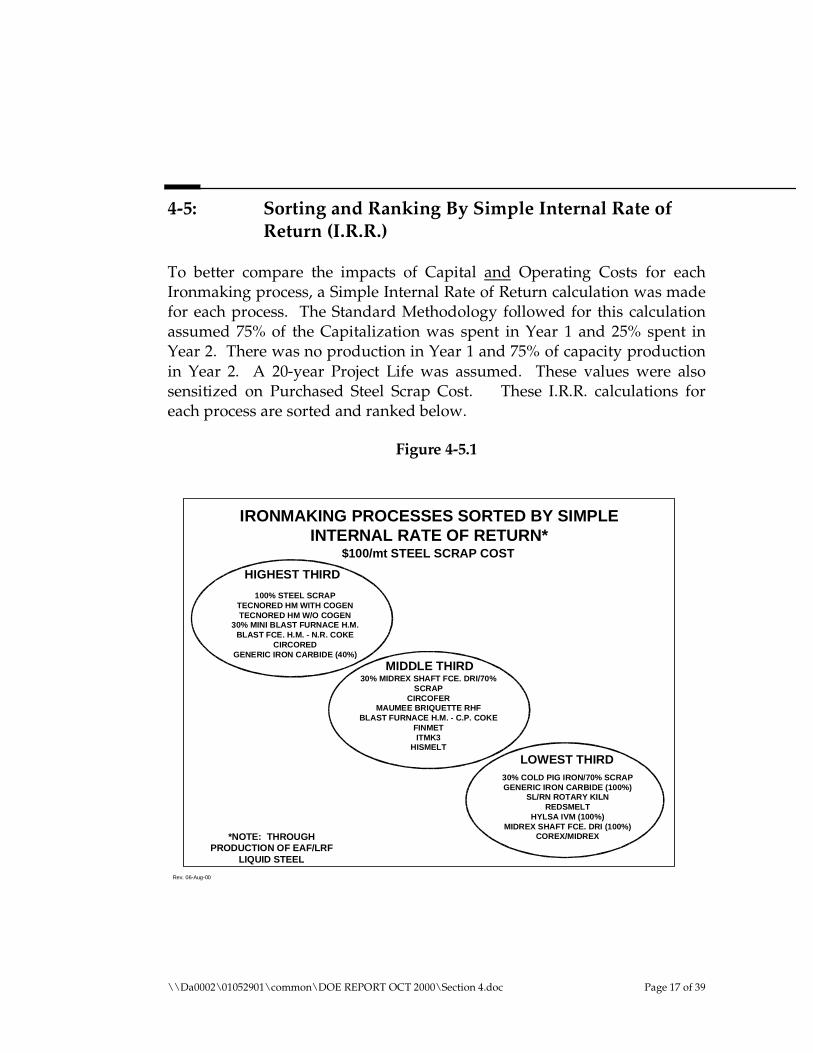
4-5: Sorting and Ranking By Simple Internal Rate of Return (I.R.R.)
To better compare the impacts of Capital and Operating Costs for each Ironmaking process, a Simple Internal Rate of Return calculation was made for each process. The Standard Methodology followed for this calculation assumed 75% of the Capitalization was spent in Year 1 and 25% spent in Year 2. There was no production in Year 1 and 75% of capacity production in Year 2. A 20-year Project Life was assumed. These values were also sensitized on Purchased Steel Scrap Cost. These I.R.R. calculations for each process are sorted and ranked below.
Figure 4-5.1
IRONMAKING PROCESSES SORTED BY SIMPLE INTERNAL RATE OF RETURN*
LOWEST THIRD 30% COLD PIG IRON/70% SCRAP GENERIC IRON CARBIDE (100%)
SL/RN ROTARY KILN REDSMELT
HYLSA IVM (100%) MIDREX SHAFT FCE. DRI (100%)
COREX/MIDREX
HIGHEST THIRD
100% STEEL SCRAP TECNORED HM WITH COGEN TECNORED HM W/O COGEN
30% MINI BLAST FURNACE H.M. BLAST FCE. H.M. - N.R. COKE
CIRCORED GENERIC IRON CARBIDE (40%)
MIDDLE THIRD 30% MIDREX SHAFT FCE. DRI/70%
SCRAP CIRCOFER
MAUMEE BRIQUETTE RHF BLAST FURNACE H.M. - C.P. COKE
FINMET ITMK3
HISMELT
*NOTE: THROUGH PRODUCTION OF EAF/LRF
LIQUID STEEL
$100/mt STEEL SCRAP COST
Rev. 06-Aug-00
\\Da0002\01052901\common\DOE REPORT OCT 2000\Section 4.doc Page 17 of 39
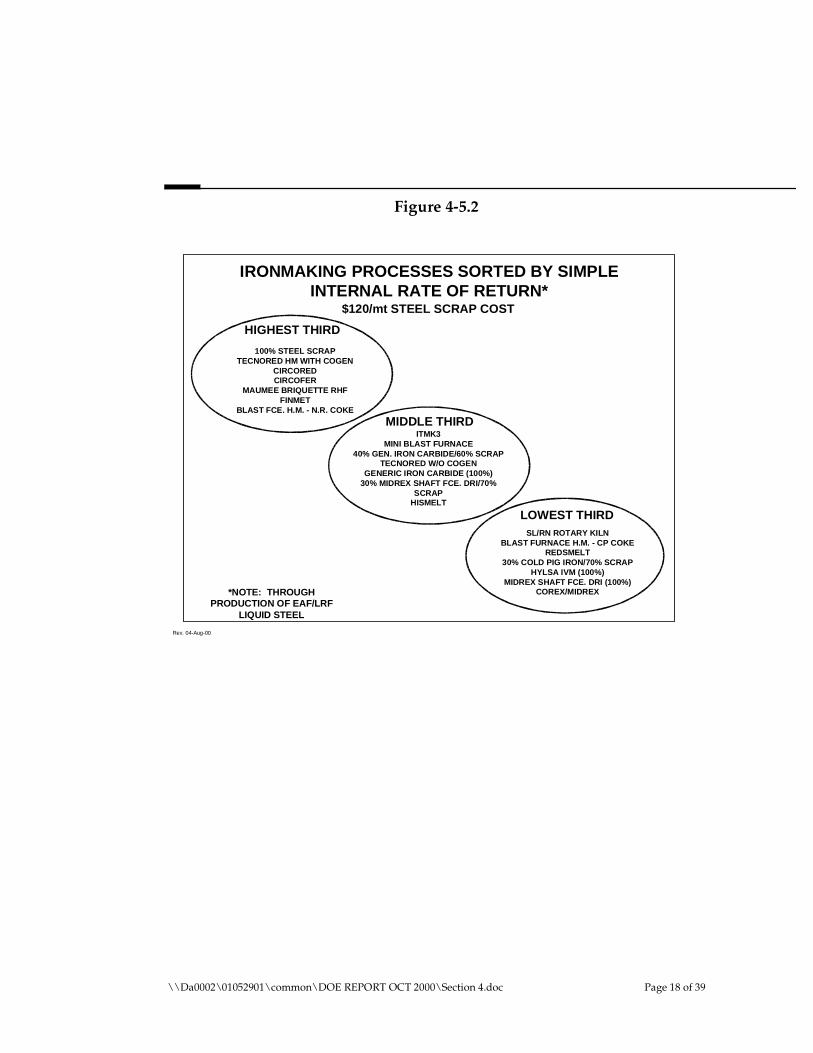
Figure 4-5.2
IRONMAKING PROCESSES SORTED BY SIMPLE INTERNAL RATE OF RETURN*
LOWEST THIRD SL/RN ROTARY KILN
BLAST FURNACE H.M. - CP COKE REDSMELT
30% COLD PIG IRON/70% SCRAP HYLSA IVM (100%)
MIDREX SHAFT FCE. DRI (100%) COREX/MIDREX
HIGHEST THIRD
100% STEEL SCRAP TECNORED HM WITH COGEN
CIRCORED CIRCOFER
MAUMEE BRIQUETTE RHF FINMET
BLAST FCE. H.M. - N.R. COKE
MIDDLE THIRD ITMK3
MINI BLAST FURNACE 40% GEN. IRON CARBIDE/60% SCRAP
TECNORED W/O COGEN GENERIC IRON CARBIDE (100%)
30% MIDREX SHAFT FCE. DRI/70% SCRAP
HISMELT
*NOTE: THROUGH PRODUCTION OF EAF/LRF
LIQUID STEEL
$120/mt STEEL SCRAP COST
Rev. 04-Aug-00
\\Da0002\01052901\common\DOE REPORT OCT 2000\Section 4.doc Page 18 of 39
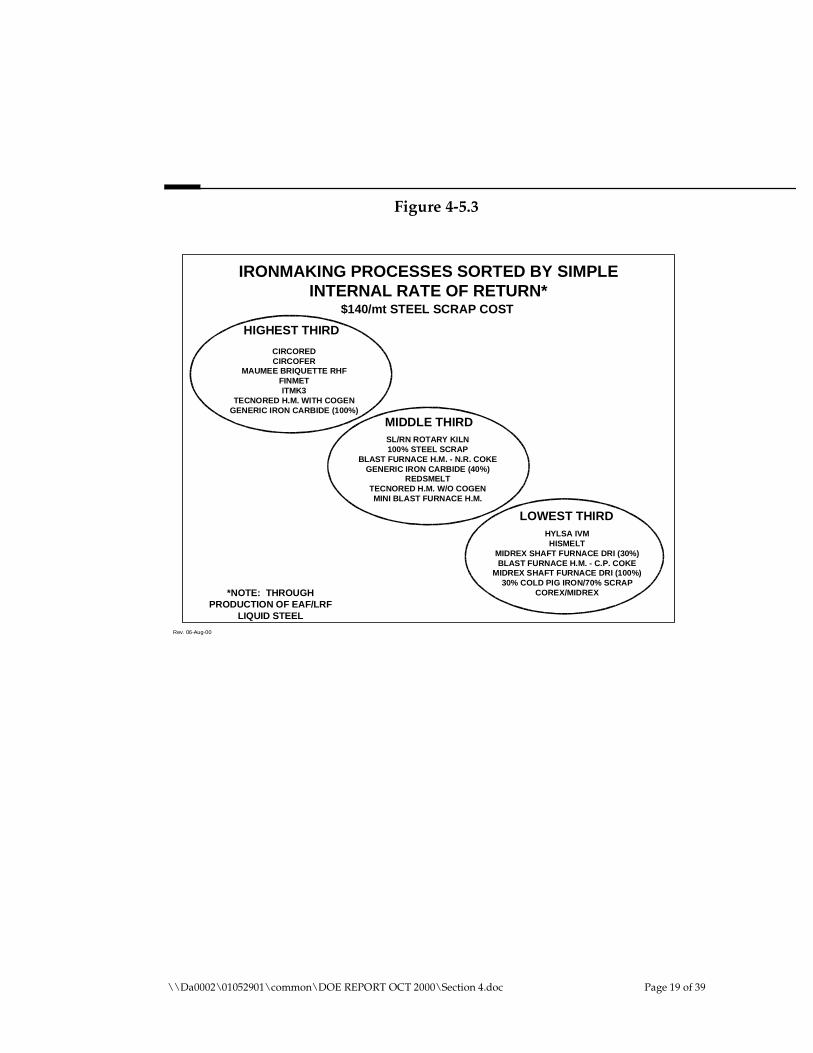
Figure 4-5.3
IRONMAKING PROCESSES SORTED BY SIMPLE INTERNAL RATE OF RETURN*
LOWEST THIRD HYLSA IVM
HISMELT MIDREX SHAFT FURNACE DRI (30%) BLAST FURNACE H.M. - C.P. COKE
MIDREX SHAFT FURNACE DRI (100%) 30% COLD PIG IRON/70% SCRAP
COREX/MIDREX
HIGHEST THIRD
CIRCORED CIRCOFER
MAUMEE BRIQUETTE RHF FINMET ITMK3
TECNORED H.M. WITH COGEN GENERIC IRON CARBIDE (100%)
MIDDLE THIRD SL/RN ROTARY KILN 100% STEEL SCRAP
BLAST FURNACE H.M. - N.R. COKE GENERIC IRON CARBIDE (40%)
REDSMELT TECNORED H.M. W/O COGEN
MINI BLAST FURNACE H.M.
*NOTE: THROUGH PRODUCTION OF EAF/LRF
LIQUID STEEL
$140/mt STEEL SCRAP COST
Rev. 06-Aug-00
\\Da0002\01052901\common\DOE REPORT OCT 2000\Section 4.doc Page 19 of 39
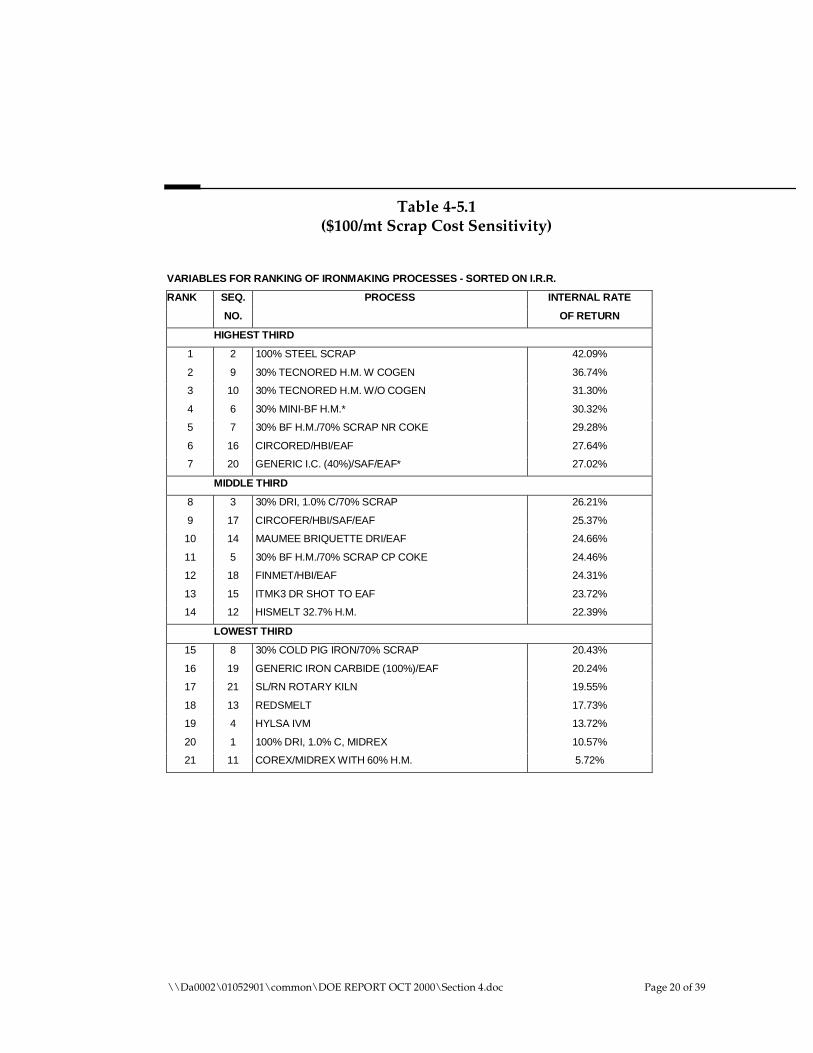
Table 4-5.1($100/mt Scrap Cost Sensitivity)
VARIABLES FOR RANKING OF IRONMAKING PROCESSES - SORTED ON I.R.R.
RANK SEQ.
NO.
PROCESS INTERNAL RATE
OF RETURN
HIGHEST THIRD
1
2
3
4
5
6
7
2
9
10
6
7
16
20
100% STEEL SCRAP
30% TECNORED H.M. W COGEN
30% TECNORED H.M. W/O COGEN
30% MINI-BF H.M.*
30% BF H.M./70% SCRAP NR COKE
CIRCORED/HBI/EAF
GENERIC I.C. (40%)/SAF/EAF*
42.09%
36.74%
31.30%
30.32%
29.28%
27.64%
27.02%
MIDDLE THIRD
8
9
10
11
12
13
14
3
17
14
5
18
15
12
30% DRI, 1.0% C/70% SCRAP
CIRCOFER/HBI/SAF/EAF
MAUMEE BRIQUETTE DRI/EAF
30% BF H.M./70% SCRAP CP COKE
FINMET/HBI/EAF
ITMK3 DR SHOT TO EAF
HISMELT 32.7% H.M.
26.21%
25.37%
24.66%
24.46%
24.31%
23.72%
22.39%
LOWEST THIRD
15
16
17
18
19
20
21
8
19
21
13
4
1
11
30% COLD PIG IRON/70% SCRAP
GENERIC IRON CARBIDE (100%)/EAF
SL/RN ROTARY KILN
REDSMELT
HYLSA IVM
100% DRI, 1.0% C, MIDREX
COREX/MIDREX WITH 60% H.M.
20.43%
20.24%
19.55%
17.73%
13.72%
10.57%
5.72%
\\Da0002\01052901\common\DOE REPORT OCT 2000\Section 4.doc Page 20 of 39
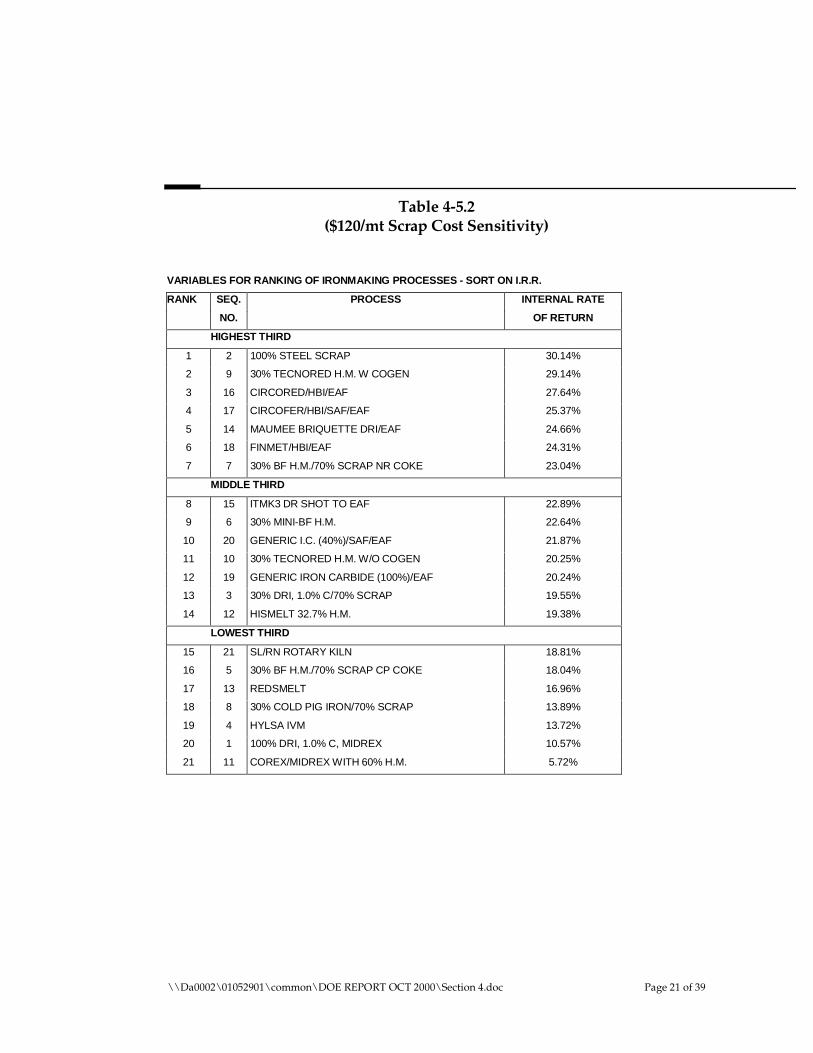
Table 4-5.2($120/mt Scrap Cost Sensitivity)
VARIABLES FOR RANKING OF IRONMAKING PROCESSES - SORT ON I.R.R.
RANK SEQ.
NO.
PROCESS INTERNAL RATE
OF RETURN
HIGHEST THIRD
1
2
3
4
5
6
7
2
9
16
17
14
18
7
100% STEEL SCRAP
30% TECNORED H.M. W COGEN
CIRCORED/HBI/EAF
CIRCOFER/HBI/SAF/EAF
MAUMEE BRIQUETTE DRI/EAF
FINMET/HBI/EAF
30% BF H.M./70% SCRAP NR COKE
30.14%
29.14%
27.64%
25.37%
24.66%
24.31%
23.04%
MIDDLE THIRD
8
9
10
11
12
13
14
15
6
20
10
19
3
12
ITMK3 DR SHOT TO EAF
30% MINI-BF H.M.
GENERIC I.C. (40%)/SAF/EAF
30% TECNORED H.M. W/O COGEN
GENERIC IRON CARBIDE (100%)/EAF
30% DRI, 1.0% C/70% SCRAP
HISMELT 32.7% H.M.
22.89%
22.64%
21.87%
20.25%
20.24%
19.55%
19.38%
LOWEST THIRD
15
16
17
18
19
20
21
21
5
13
8
4
1
11
SL/RN ROTARY KILN
30% BF H.M./70% SCRAP CP COKE
REDSMELT
30% COLD PIG IRON/70% SCRAP
HYLSA IVM
100% DRI, 1.0% C, MIDREX
COREX/MIDREX WITH 60% H.M.
18.81%
18.04%
16.96%
13.89%
13.72%
10.57%
5.72%
\\Da0002\01052901\common\DOE REPORT OCT 2000\Section 4.doc Page 21 of 39
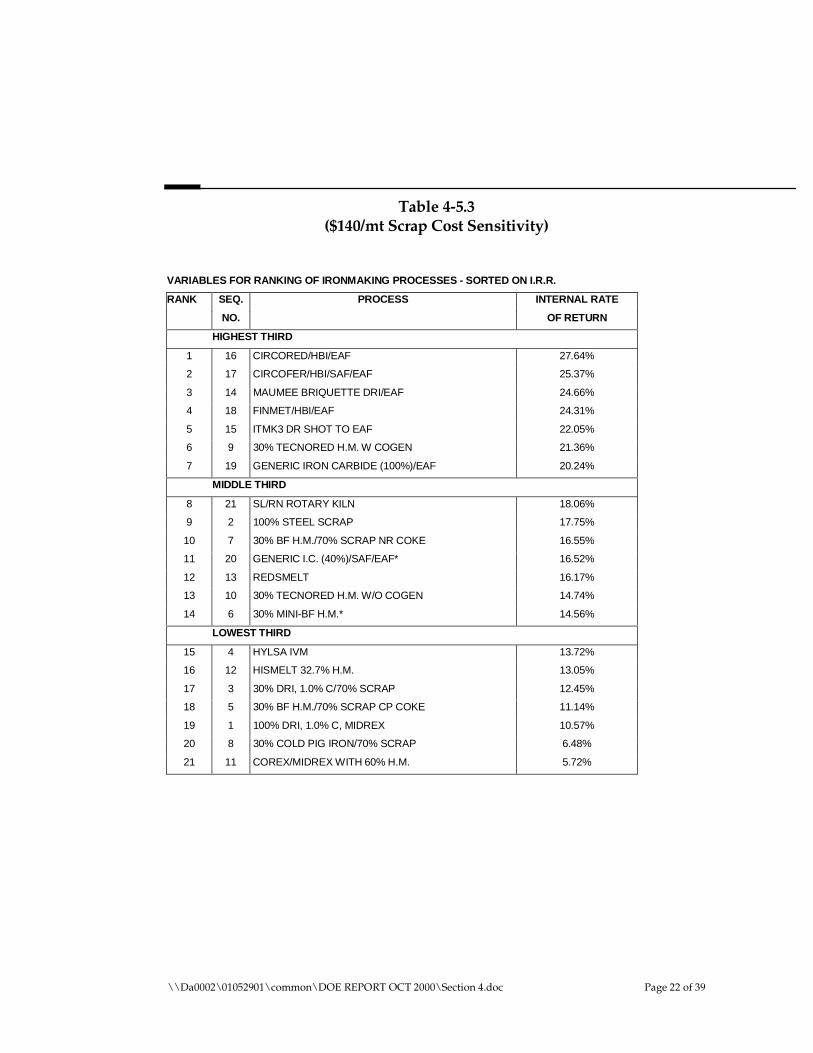
Table 4-5.3($140/mt Scrap Cost Sensitivity)
VARIABLES FOR RANKING OF IRONMAKING PROCESSES - SORTED ON I.R.R.
RANK SEQ.
NO.
PROCESS INTERNAL RATE
OF RETURN
HIGHEST THIRD
1
2
3
4
5
6
7
16
17
14
18
15
9
19
CIRCORED/HBI/EAF
CIRCOFER/HBI/SAF/EAF
MAUMEE BRIQUETTE DRI/EAF
FINMET/HBI/EAF
ITMK3 DR SHOT TO EAF
30% TECNORED H.M. W COGEN
GENERIC IRON CARBIDE (100%)/EAF
27.64%
25.37%
24.66%
24.31%
22.05%
21.36%
20.24%
MIDDLE THIRD
8
9
10
11
12
13
14
21
2
7
20
13
10
6
SL/RN ROTARY KILN
100% STEEL SCRAP
30% BF H.M./70% SCRAP NR COKE
GENERIC I.C. (40%)/SAF/EAF*
REDSMELT
30% TECNORED H.M. W/O COGEN
30% MINI-BF H.M.*
18.06%
17.75%
16.55%
16.52%
16.17%
14.74%
14.56%
LOWEST THIRD
15
16
17
18
19
20
21
4
12
3
5
1
8
11
HYLSA IVM
HISMELT 32.7% H.M.
30% DRI, 1.0% C/70% SCRAP
30% BF H.M./70% SCRAP CP COKE
100% DRI, 1.0% C, MIDREX
30% COLD PIG IRON/70% SCRAP
COREX/MIDREX WITH 60% H.M.
13.72%
13.05%
12.45%
11.14%
10.57%
6.48%
5.72%
\\Da0002\01052901\common\DOE REPORT OCT 2000\Section 4.doc Page 22 of 39
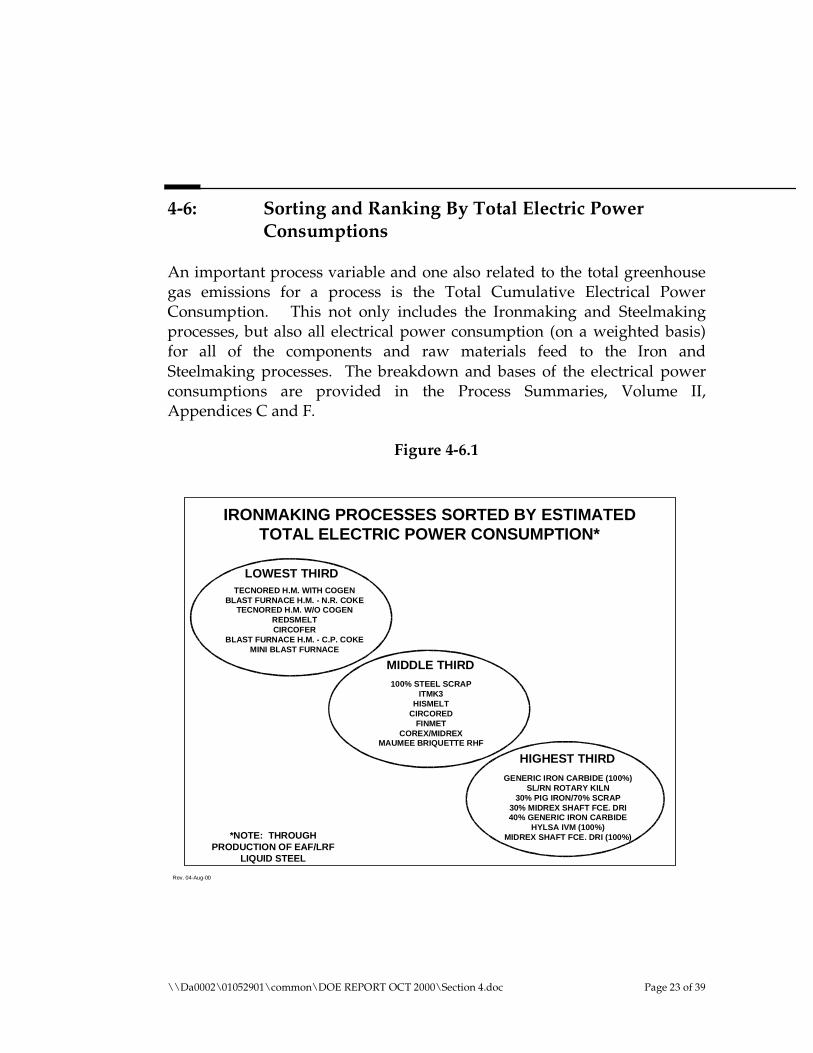
4-6: Sorting and Ranking By Total Electric Power Consumptions
An important process variable and one also related to the total greenhouse gas emissions for a process is the Total Cumulative Electrical Power Consumption. This not only includes the Ironmaking and Steelmaking processes, but also all electrical power consumption (on a weighted basis) for all of the components and raw materials feed to the Iron and Steelmaking processes. The breakdown and bases of the electrical power consumptions are provided in the Process Summaries, Volume II, Appendices C and F.
Figure 4-6.1
IRONMAKING PROCESSES SORTED BY ESTIMATED TOTAL ELECTRIC POWER CONSUMPTION*
HIGHEST THIRD
GENERIC IRON CARBIDE (100%) SL/RN ROTARY KILN
30% PIG IRON/70% SCRAP 30% MIDREX SHAFT FCE. DRI 40% GENERIC IRON CARBIDE
HYLSA IVM (100%) MIDREX SHAFT FCE. DRI (100%)
LOWEST THIRD
MIDDLE THIRD
*NOTE: THROUGH PRODUCTION OF EAF/LRF
LIQUID STEEL
TECNORED H.M. WITH COGEN BLAST FURNACE H.M. - N.R. COKE
TECNORED H.M. W/O COGEN REDSMELT CIRCOFER
BLAST FURNACE H.M. - C.P. COKE MINI BLAST FURNACE
100% STEEL SCRAP ITMK3
HISMELT CIRCORED
FINMET COREX/MIDREX
MAUMEE BRIQUETTE RHF
Rev. 04-Aug-00
\\Da0002\01052901\common\DOE REPORT OCT 2000\Section 4.doc Page 23 of 39

Table 4-6.1
VARIABLES FOR RANKING OF IRONMAKING PROCESSES - SORT ON TOTAL ELECTRICITY
RANK SEQ.
NO.
PROCESS TOTAL ELEC.
(kWhr/mt LS)
LOWEST THIRD
1
2
3
4
5
6
7
9
7
10
13
17
5
6
30% TECNORED H.M. W COGEN
30% BF H.M./70% SCRAP NR COKE
30% TECNORED H.M. W/O COGEN
REDSMELT
CIRCOFER/HBI/SAF/EAF
30% BF H.M./70% SCRAP CP COKE
30% MINI-BF H.M.
307.58
660.35
685.69
690.28
780.99
795.44
795.44
MIDDLE THIRD
8
9
10
11
12
13
14
2
15
12
16
18
11
14
100% STEEL SCRAP
ITMK3 DR SHOT TO EAF
HISMELT 32.7% H.M.
CIRCORED/HBI/EAF
FINMET/HBI/EAF
COREX/MIDREX WITH 60% H.M.
MAUMEE BRIQUETTE DRI/EAF
822.45
825.40
847.37
900.84
907.76
942.91
966.09
HIGHEST THIRD
15
16
17
18
19
20
21
19
21
8
3
20
4
1
GENERIC IRON CARBIDE (100%)/EAF
SL/RN ROTARY KILN
30% COLD PIG IRON/70% SCRAP
30% DRI, 1.0% C/70% SCRAP
GENERIC I.C. (40%)/SAF/EAF
HYLSA IVM
100% DRI, 1.0% C, MIDREX
972.95
999.74
1,002.39
1,030.37
1,185.22
1,267.37
1,326.73
\\Da0002\01052901\common\DOE REPORT OCT 2000\Section 4.doc Page 24 of 39
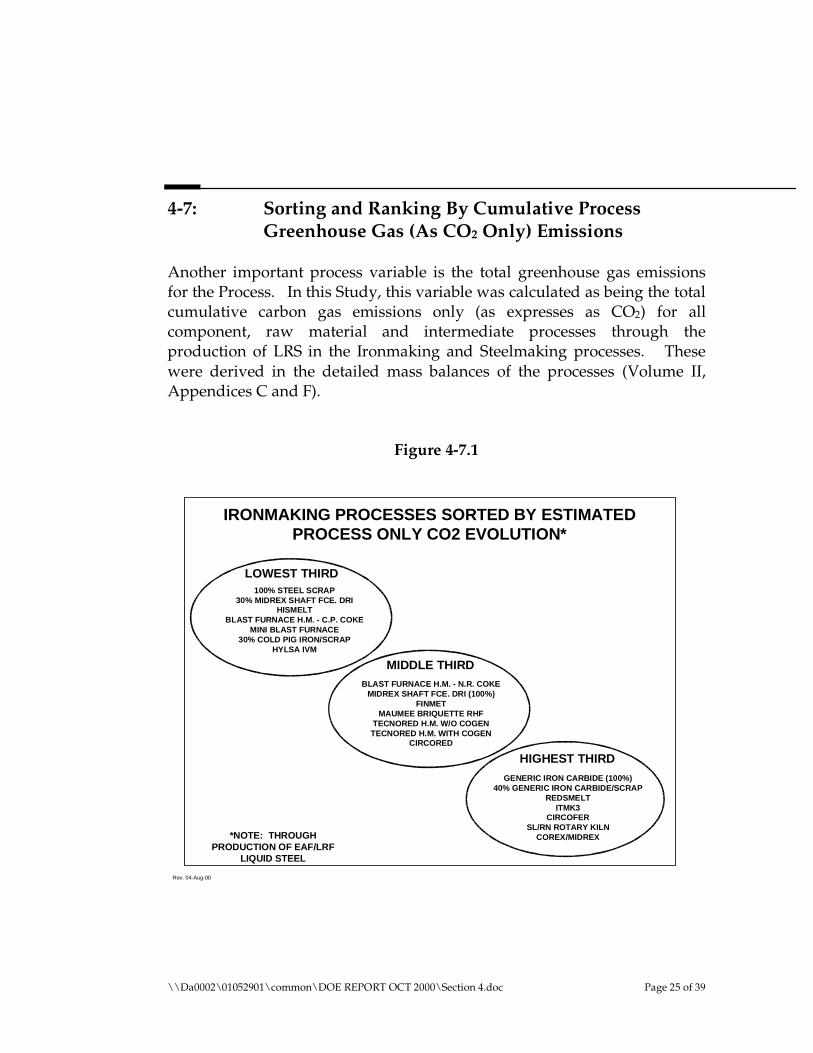
4-7: Sorting and Ranking By Cumulative Process Greenhouse Gas (As CO2 Only) Emissions
Another important process variable is the total greenhouse gas emissions for the Process. In this Study, this variable was calculated as being the total cumulative carbon gas emissions only (as expresses as CO2) for all component, raw material and intermediate processes through the production of LRS in the Ironmaking and Steelmaking processes. These were derived in the detailed mass balances of the processes (Volume II, Appendices C and F).
Figure 4-7.1
IRONMAKING PROCESSES SORTED BY ESTIMATED PROCESS ONLY CO2 EVOLUTION*
HIGHEST THIRD
GENERIC IRON CARBIDE (100%) 40% GENERIC IRON CARBIDE/SCRAP
REDSMELT ITMK3
CIRCOFER SL/RN ROTARY KILN
COREX/MIDREX
LOWEST THIRD
MIDDLE THIRD
*NOTE: THROUGH PRODUCTION OF EAF/LRF
LIQUID STEEL
100% STEEL SCRAP 30% MIDREX SHAFT FCE. DRI
HISMELT BLAST FURNACE H.M. - C.P. COKE
MINI BLAST FURNACE 30% COLD PIG IRON/SCRAP
HYLSA IVM
BLAST FURNACE H.M. - N.R. COKE MIDREX SHAFT FCE. DRI (100%)
FINMET MAUMEE BRIQUETTE RHF
TECNORED H.M. W/O COGEN TECNORED H.M. WITH COGEN
CIRCORED
Rev. 04-Aug-00
\\Da0002\01052901\common\DOE REPORT OCT 2000\Section 4.doc Page 25 of 39
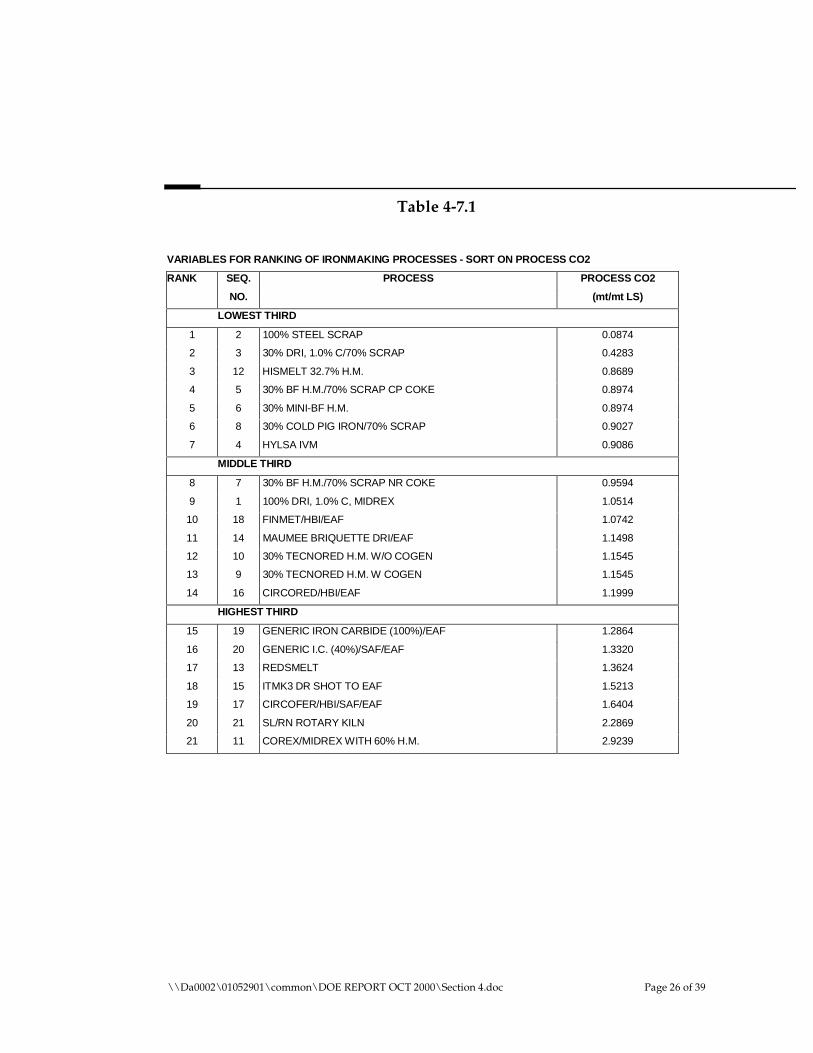
Table 4-7.1
VARIABLES FOR RANKING OF IRONMAKING PROCESSES - SORT ON PROCESS CO2
RANK SEQ.
NO.
PROCESS PROCESS CO2
(mt/mt LS)
LOWEST THIRD
1
2
3
4
5
6
7
2
3
12
5
6
8
4
100% STEEL SCRAP
30% DRI, 1.0% C/70% SCRAP
HISMELT 32.7% H.M.
30% BF H.M./70% SCRAP CP COKE
30% MINI-BF H.M.
30% COLD PIG IRON/70% SCRAP
HYLSA IVM
0.0874
0.4283
0.8689
0.8974
0.8974
0.9027
0.9086
MIDDLE THIRD
8
9
10
11
12
13
14
7
1
18
14
10
9
16
30% BF H.M./70% SCRAP NR COKE
100% DRI, 1.0% C, MIDREX
FINMET/HBI/EAF
MAUMEE BRIQUETTE DRI/EAF
30% TECNORED H.M. W/O COGEN
30% TECNORED H.M. W COGEN
CIRCORED/HBI/EAF
0.9594
1.0514
1.0742
1.1498
1.1545
1.1545
1.1999
HIGHEST THIRD
15
16
17
18
19
20
21
19
20
13
15
17
21
11
GENERIC IRON CARBIDE (100%)/EAF
GENERIC I.C. (40%)/SAF/EAF
REDSMELT
ITMK3 DR SHOT TO EAF
CIRCOFER/HBI/SAF/EAF
SL/RN ROTARY KILN
COREX/MIDREX WITH 60% H.M.
1.2864
1.3320
1.3624
1.5213
1.6404
2.2869
2.9239
\\Da0002\01052901\common\DOE REPORT OCT 2000\Section 4.doc Page 26 of 39
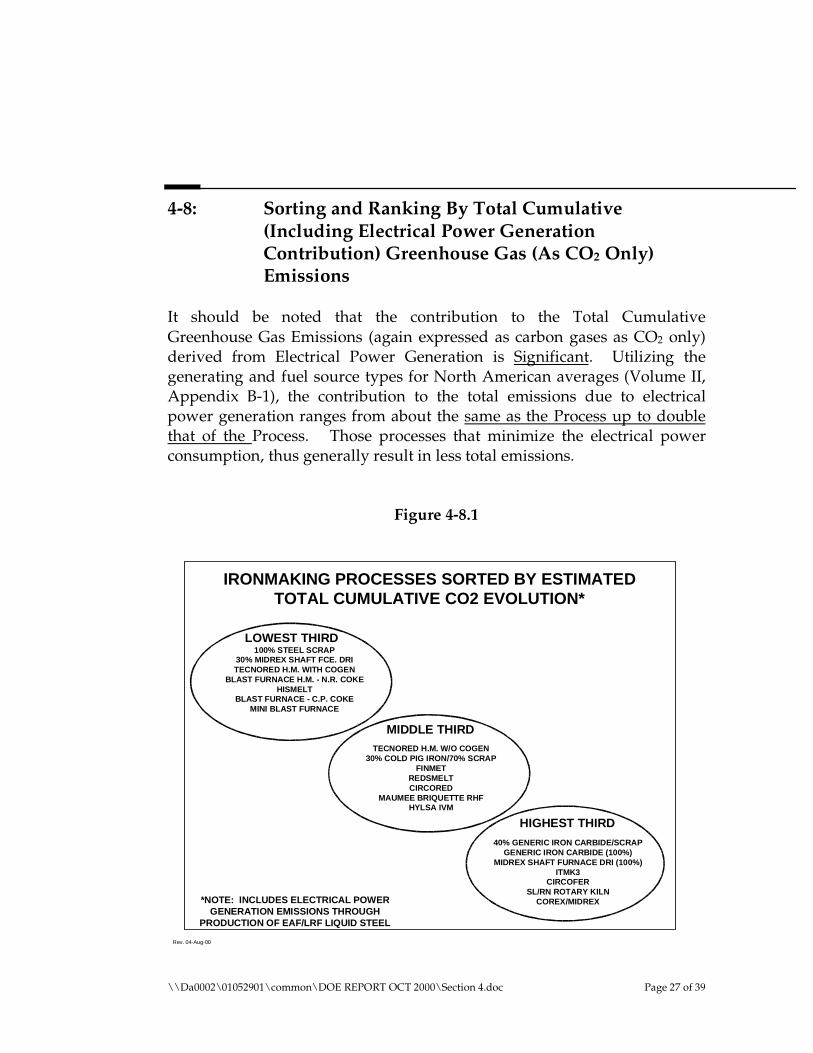
4-8: Sorting and Ranking By Total Cumulative (Including Electrical Power Generation Contribution) Greenhouse Gas (As CO2 Only) Emissions
It should be noted that the contribution to the Total Cumulative Greenhouse Gas Emissions (again expressed as carbon gases as CO2 only) derived from Electrical Power Generation is Significant. Utilizing the generating and fuel source types for North American averages (Volume II, Appendix B-1), the contribution to the total emissions due to electrical power generation ranges from about the same as the Process up to double that of the Process. Those processes that minimize the electrical power consumption, thus generally result in less total emissions.
Figure 4-8.1
IRONMAKING PROCESSES SORTED BY ESTIMATED TOTAL CUMULATIVE CO2 EVOLUTION*
HIGHEST THIRD
40% GENERIC IRON CARBIDE/SCRAP GENERIC IRON CARBIDE (100%)
MIDREX SHAFT FURNACE DRI (100%) ITMK3
CIRCOFER SL/RN ROTARY KILN
COREX/MIDREX
LOWEST THIRD
MIDDLE THIRD
*NOTE: INCLUDES ELECTRICAL POWER GENERATION EMISSIONS THROUGH
PRODUCTION OF EAF/LRF LIQUID STEEL
100% STEEL SCRAP 30% MIDREX SHAFT FCE. DRI TECNORED H.M. WITH COGEN
BLAST FURNACE H.M. - N.R. COKE HISMELT
BLAST FURNACE - C.P. COKE MINI BLAST FURNACE
TECNORED H.M. W/O COGEN 30% COLD PIG IRON/70% SCRAP
FINMET REDSMELT CIRCORED
MAUMEE BRIQUETTE RHF HYLSA IVM
Rev. 04-Aug-00
\\Da0002\01052901\common\DOE REPORT OCT 2000\Section 4.doc Page 27 of 39

Table 4-8.1
VARIABLES FOR RANKING OF IRONMAKING PROCESSES - TOTAL CUMULATIVE CO2
RANK SEQ.
NO.
PROCESS TOTAL CO2
(mt/mt LS)
LOWEST THIRD
1
2
3
4
5
6
7
2
3
9
7
12
5
6
100% STEEL SCRAP
30% DRI, 1.0% C/70% SCRAP
30% TECNORED H.M. W COGEN
30% BF H.M./70% SCRAP NR COKE
HISMELT 32.7% H.M.
30% BF H.M./70% SCRAP CP COKE
30% MINI-BF H.M.
0.8909
1.3681
1.4350
1.5615
1.6418
1.6746
1.6746
MIDDLE THIRD
8
9
10
11
12
13
14
10
8
18
13
16
14
4
30% TECNORED H.M. W/O COGEN
30% COLD PIG IRON/70% SCRAP
FINMET/HBI/EAF
REDSMELT
CIRCORED/HBI/EAF
MAUMEE BRIQUETTE DRI/EAF
HYLSA IVM
1.7799
1.8170
1.9022
1.9921
2.0217
2.0310
2.0646
HIGHEST THIRD
15
16
17
18
19
20
21
20
19
1
15
17
21
11
GENERIC I.C. (40%)/SAF/EAF
GENERIC IRON CARBIDE (100%)/EAF
100% DRI, 1.0% C, MIDREX
ITMK3 DR SHOT TO EAF
CIRCOFER/HBI/SAF/EAF
SL/RN ROTARY KILN
COREX/MIDREX WITH 60% H.M.
2.0648
2.1738
2.2617
2.2742
2.3528
3.1988
3.7839
\\Da0002\01052901\common\DOE REPORT OCT 2000\Section 4.doc Page 28 of 39
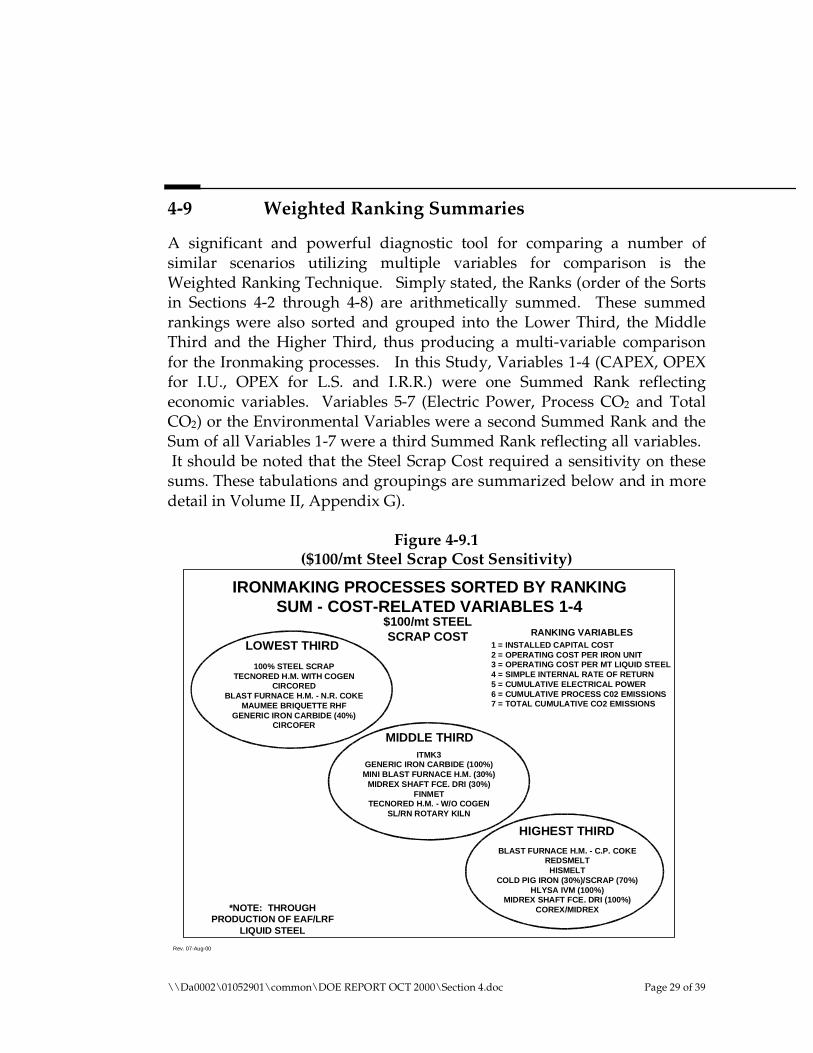
4-9 Weighted Ranking Summaries
A significant and powerful diagnostic tool for comparing a number of similar scenarios utilizing multiple variables for comparison is the Weighted Ranking Technique. Simply stated, the Ranks (order of the Sorts in Sections 4-2 through 4-8) are arithmetically summed. These summed rankings were also sorted and grouped into the Lower Third, the Middle Third and the Higher Third, thus producing a multi-variable comparison for the Ironmaking processes. In this Study, Variables 1-4 (CAPEX, OPEX for I.U., OPEX for L.S. and I.R.R.) were one Summed Rank reflecting economic variables. Variables 5-7 (Electric Power, Process CO2 and Total CO2) or the Environmental Variables were a second Summed Rank and the Sum of all Variables 1-7 were a third Summed Rank reflecting all variables. It should be noted that the Steel Scrap Cost required a sensitivity on these
sums. These tabulations and groupings are summarized below and in more detail in Volume II, Appendix G).
Figure 4-9.1($100/mt Steel Scrap Cost Sensitivity)
IRONMAKING PROCESSES SORTED BY RANKING SUM - COST-RELATED VARIABLES 1-4
HIGHEST THIRD
BLAST FURNACE H.M. - C.P. COKE REDSMELT
HISMELT COLD PIG IRON (30%)/SCRAP (70%)
HLYSA IVM (100%) MIDREX SHAFT FCE. DRI (100%)
COREX/MIDREX
LOWEST THIRD
100% STEEL SCRAP TECNORED H.M. WITH COGEN
CIRCORED BLAST FURNACE H.M. - N.R. COKE
MAUMEE BRIQUETTE RHF GENERIC IRON CARBIDE (40%)
CIRCOFER
MIDDLE THIRD ITMK3
GENERIC IRON CARBIDE (100%) MINI BLAST FURNACE H.M. (30%)
MIDREX SHAFT FCE. DRI (30%) FINMET
TECNORED H.M. - W/O COGEN SL/RN ROTARY KILN
*NOTE: THROUGH PRODUCTION OF EAF/LRF
LIQUID STEEL
RANKING VARIABLES 1 = INSTALLED CAPITAL COST 2 = OPERATING COST PER IRON UNIT 3 = OPERATING COST PER MT LIQUID STEEL 4 = SIMPLE INTERNAL RATE OF RETURN 5 = CUMULATIVE ELECTRICAL POWER 6 = CUMULATIVE PROCESS C02 EMISSIONS 7 = TOTAL CUMULATIVE CO2 EMISSIONS
$100/mt STEEL SCRAP COST
Rev. 07-Aug-00
\\Da0002\01052901\common\DOE REPORT OCT 2000\Section 4.doc Page 29 of 39

Figure 4-9.2($120/mt Steel Scrap Cost Sensitivity)
IRONMAKING PROCESSES SORTED BY RANKING SUM - COST-RELATED VARIABLES 1-4
HIGHEST THIRD
TECHNORED H.M. - W/O COGEN HISMELT
BLAST FURNACE H.M. - C.P. COKE HYLSA IVM (100%)
COLD PIG IRON (30%)/ SCRAP (70%) MIDREX SHAFT FCE. DRI (100%)
COREX/MIDREX
LOWEST THIRD 100% STEEL SCRAP
CIRCORED MAUMEE BRIQUETTE RHF
CIRCOFER TECNORED H.M. WITH COGEN
ITMK3 FINMET
MIDDLE THIRD GENERIC IRON CARBIDE (100%)
BLAST FURNACE H.M. - N.R. COKE GENERIC IRON CARBIDE (40%)
SL/RN ROTARY KILN MINI BLAST FURNACE H.M. (30%)
MIDREX SHAFT FCE. DRI (30%) REDSMELT
*NOTE: THROUGH PRODUCTION OF EAF/LRF
LIQUID STEEL
RANKING VARIABLES 1 = INSTALLED CAPITAL COST 2 = OPERATING COST PER IRON UNIT 3 = OPERATING COST PER MT LIQUID STEEL 4 = SIMPLE INTERNAL RATE OF RETURN 5 = CUMULATIVE ELECTRICAL POWER 6 = CUMULATIVE PROCESS C02 EMISSIONS 7 = TOTAL CUMULATIVE CO2 EMISSIONS
$120/mt STEEL SCRAP COST
Rev. 07-Aug-00
\\Da0002\01052901\common\DOE REPORT OCT 2000\Section 4.doc Page 30 of 39

Figure 4-9.3($140/mt Steel Scrap Cost Sensitivity)
IRONMAKING PROCESSES SORTED BY RANKING SUM - COST-RELATED VARIABLES 1-4
HIGHEST THIRD
TECHNORED H.M. - W/O COGEN HISMELT
HYLSA IVM (100%) BLAST FURNACE H.M. - C.P. COKE
MIDREX SHAFT FCE. DRI (100%) COLD PIG IRON (30%)/ SCRAP (70%)
COREX/MIDREX
LOWEST THIRD
CIRCORED MAUMEE BRIQUETTE RHF
CIRCOFER 100% STEEL SCRAP
ITMK3 FINMET
GENERIC IRON CARBIDE (100%)
MIDDLE THIRD TECNORED H.M. WITH COGEN
SL/RN ROTARY KILN GENERIC IRON CARBIDE (40%)
BLAST FURNACE H.M. - N.R. COKE REDSMELT
MIDREX SHAFT FCE. DRI (30%) MINI BLAST FURNACE H. M. (30%)
*NOTE: THROUGH PRODUCTION OF EAF/LRF
LIQUID STEEL
RANKING VARIABLES 1 = INSTALLED CAPITAL COST 2 = OPERATING COST PER IRON UNIT 3 = OPERATING COST PER MT LIQUID STEEL 4 = SIMPLE INTERNAL RATE OF RETURN 5 = CUMULATIVE ELECTRICAL POWER 6 = CUMULATIVE PROCESS C02 EMISSIONS 7 = TOTAL CUMULATIVE CO2 EMISSIONS
$140/mt STEEL SCRAP COST
Rev. 07-Aug-00
\\Da0002\01052901\common\DOE REPORT OCT 2000\Section 4.doc Page 31 of 39
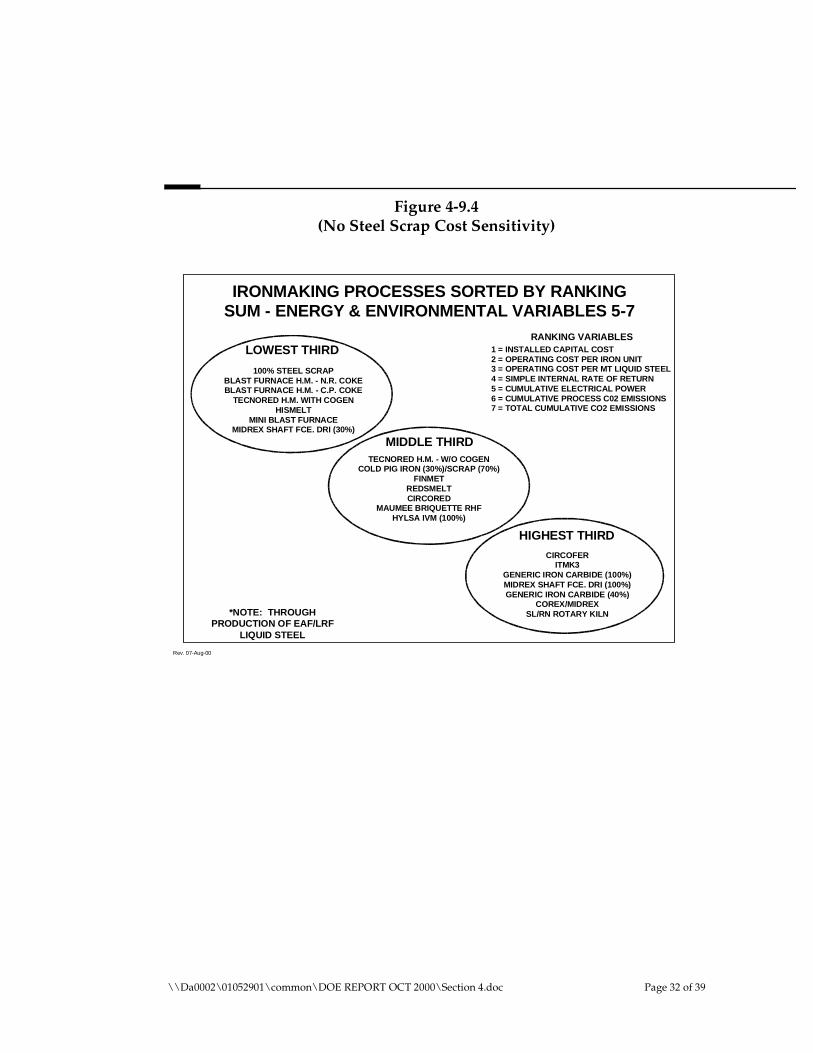
Figure 4-9.4(No Steel Scrap Cost Sensitivity)
IRONMAKING PROCESSES SORTED BY RANKING SUM - ENERGY & ENVIRONMENTAL VARIABLES 5-7
HIGHEST THIRD
CIRCOFER ITMK3
GENERIC IRON CARBIDE (100%) MIDREX SHAFT FCE. DRI (100%) GENERIC IRON CARBIDE (40%)
COREX/MIDREX SL/RN ROTARY KILN
LOWEST THIRD
100% STEEL SCRAP BLAST FURNACE H.M. - N.R. COKE BLAST FURNACE H.M. - C.P. COKE
TECNORED H.M. WITH COGEN HISMELT
MINI BLAST FURNACE MIDREX SHAFT FCE. DRI (30%)
MIDDLE THIRD TECNORED H.M. - W/O COGEN
COLD PIG IRON (30%)/SCRAP (70%) FINMET
REDSMELT CIRCORED
MAUMEE BRIQUETTE RHF HYLSA IVM (100%)
*NOTE: THROUGH PRODUCTION OF EAF/LRF
LIQUID STEEL
RANKING VARIABLES 1 = INSTALLED CAPITAL COST 2 = OPERATING COST PER IRON UNIT 3 = OPERATING COST PER MT LIQUID STEEL 4 = SIMPLE INTERNAL RATE OF RETURN 5 = CUMULATIVE ELECTRICAL POWER 6 = CUMULATIVE PROCESS C02 EMISSIONS 7 = TOTAL CUMULATIVE CO2 EMISSIONS
Rev. 07-Aug-00
\\Da0002\01052901\common\DOE REPORT OCT 2000\Section 4.doc Page 32 of 39
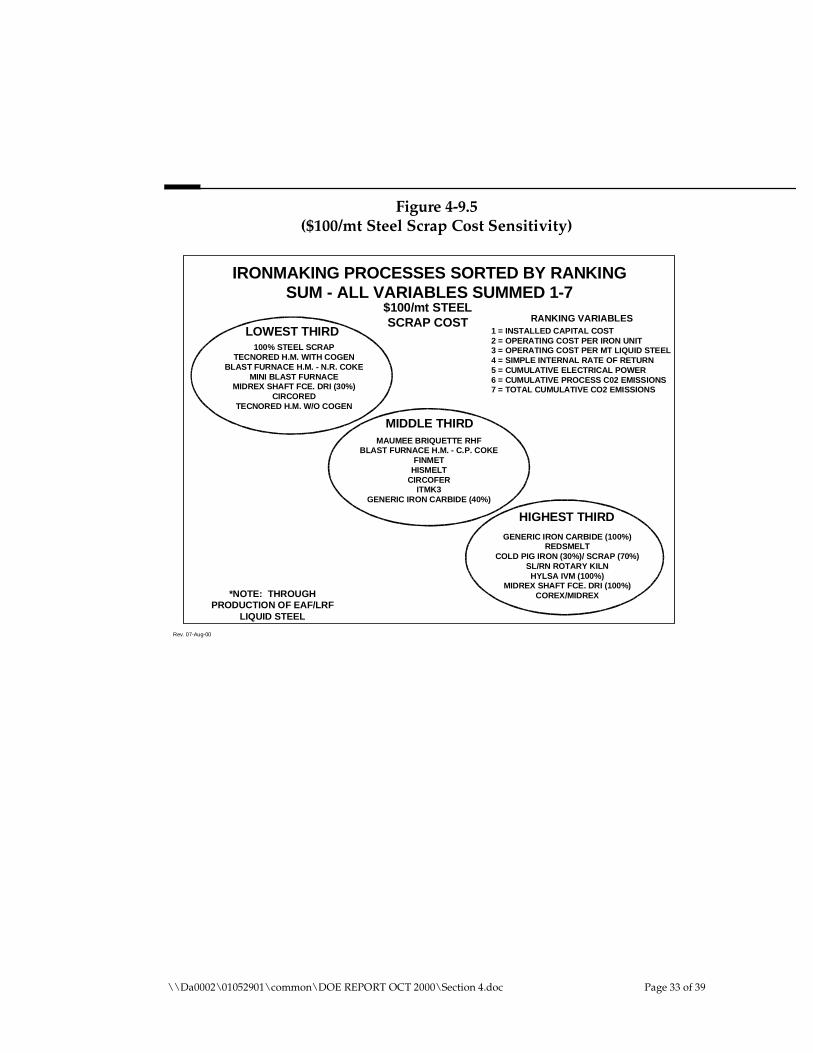
Figure 4-9.5($100/mt Steel Scrap Cost Sensitivity)
IRONMAKING PROCESSES SORTED BY RANKING SUM - ALL VARIABLES SUMMED 1-7
HIGHEST THIRD
GENERIC IRON CARBIDE (100%) REDSMELT
COLD PIG IRON (30%)/ SCRAP (70%) SL/RN ROTARY KILN
HYLSA IVM (100%) MIDREX SHAFT FCE. DRI (100%)
COREX/MIDREX
LOWEST THIRD 100% STEEL SCRAP
TECNORED H.M. WITH COGEN BLAST FURNACE H.M. - N.R. COKE
MINI BLAST FURNACE MIDREX SHAFT FCE. DRI (30%)
CIRCORED TECNORED H.M. W/O COGEN
MIDDLE THIRD MAUMEE BRIQUETTE RHF
BLAST FURNACE H.M. - C.P. COKE FINMET
HISMELT CIRCOFER
ITMK3 GENERIC IRON CARBIDE (40%)
*NOTE: THROUGH PRODUCTION OF EAF/LRF
LIQUID STEEL
RANKING VARIABLES 1 = INSTALLED CAPITAL COST 2 = OPERATING COST PER IRON UNIT 3 = OPERATING COST PER MT LIQUID STEEL 4 = SIMPLE INTERNAL RATE OF RETURN 5 = CUMULATIVE ELECTRICAL POWER 6 = CUMULATIVE PROCESS C02 EMISSIONS 7 = TOTAL CUMULATIVE CO2 EMISSIONS
$100/mt STEEL SCRAP COST
Rev. 07-Aug-00
\\Da0002\01052901\common\DOE REPORT OCT 2000\Section 4.doc Page 33 of 39
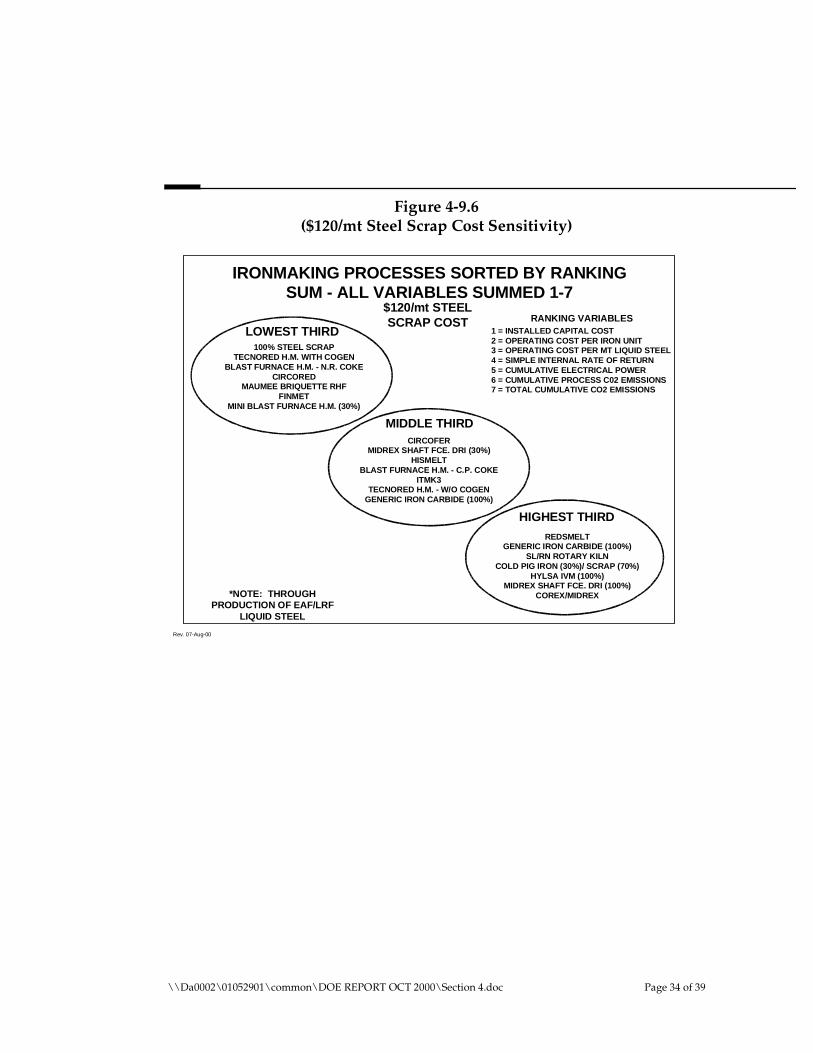
Figure 4-9.6($120/mt Steel Scrap Cost Sensitivity)
IRONMAKING PROCESSES SORTED BY RANKING SUM - ALL VARIABLES SUMMED 1-7
HIGHEST THIRD
REDSMELT GENERIC IRON CARBIDE (100%)
SL/RN ROTARY KILN COLD PIG IRON (30%)/ SCRAP (70%)
HYLSA IVM (100%) MIDREX SHAFT FCE. DRI (100%)
COREX/MIDREX
LOWEST THIRD 100% STEEL SCRAP
TECNORED H.M. WITH COGEN BLAST FURNACE H.M. - N.R. COKE
CIRCORED MAUMEE BRIQUETTE RHF
FINMET MINI BLAST FURNACE H.M. (30%)
MIDDLE THIRD CIRCOFER
MIDREX SHAFT FCE. DRI (30%) HISMELT
BLAST FURNACE H.M. - C.P. COKE ITMK3
TECNORED H.M. - W/O COGEN GENERIC IRON CARBIDE (100%)
*NOTE: THROUGH PRODUCTION OF EAF/LRF
LIQUID STEEL
RANKING VARIABLES 1 = INSTALLED CAPITAL COST 2 = OPERATING COST PER IRON UNIT 3 = OPERATING COST PER MT LIQUID STEEL 4 = SIMPLE INTERNAL RATE OF RETURN 5 = CUMULATIVE ELECTRICAL POWER 6 = CUMULATIVE PROCESS C02 EMISSIONS 7 = TOTAL CUMULATIVE CO2 EMISSIONS
$120/mt STEEL SCRAP COST
Rev. 07-Aug-00
\\Da0002\01052901\common\DOE REPORT OCT 2000\Section 4.doc Page 34 of 39

Figure 4-9.7($140/mt Steel Scrap Cost Sensitivity)
IRONMAKING PROCESSES SORTED BY RANKING SUM - ALL VARIABLES SUMMED 1-7
HIGHEST THIRD
TECNORED H.M. - W/O COGEN SL/RN ROTARY KILN
GENERIC IRON CARBIDE (100%) HYLSA IVM (100%)
COLD PIG IRON (30%)/ SCRAP (70%) MIDREX SHAFT FCE. DRI (100%)
COREX/MIDREX
LOWEST THIRD
100% STEEL SCRAP TECNORED H.M. WITH COGEN
CIRCORED BLAST FURNACE H.M. - N.R. COKE
MAUMEE BRIQUETTE RHF FINMET
CIRCOFER
MIDDLE THIRD ITMK3
MINI BLAST FURNACE H.M. (30%) MIDREX SHAFT FCE. DRI (30%)
GENERIC IRON CARBIDE (100%) BLAST FURNACE H.M. - C.P. COKE
HISMELT REDSMELT
*NOTE: THROUGH PRODUCTION OF EAF/LRF
LIQUID STEEL
RANKING VARIABLES 1 = INSTALLED CAPITAL COST 2 = OPERATING COST PER IRON UNIT 3 = OPERATING COST PER MT LIQUID STEEL 4 = SIMPLE INTERNAL RATE OF RETURN 5 = CUMULATIVE ELECTRICAL POWER 6 = CUMULATIVE PROCESS C02 EMISSIONS 7 = TOTAL CUMULATIVE CO2 EMISSIONS
$140/mt STEEL SCRAP COST
Rev. 07-Aug-00
\\Da0002\01052901\common\DOE REPORT OCT 2000\Section 4.doc Page 35 of 39

Table 4-9.8: RANKING OF IRONMAKING PROCESSES - RESEQUENCED ORDER
(BASIS: 1.00 MM mt LIQUID STEEL PER YEAR, $120/mt STEEL SCRAP COST)
SEQ. PROCESS CAPEX OPEX I.U. OPEX L.S. I.R.R. ELEC. PROC. CO2 TOTAL CO2 TOTALS TOTALS TOTALS T.S.RANK T.S.RANK T.S.RANK
NO. RANKING RANKING RANKING RANKING RANKING RANKING RANKING (1-4) (1-7) (5-7) (1-4) (1-7) (5-7)
(1) (2) (3) (4) (5) (6) (7)
1 100% DRI, 1.0% C, MIDREX 20 4 18 0 1 9 17 72 119 47 20 20 1
2 100% STEEL SCRAP 1 1 13 1 8 1 1 16 26 10 1 1
3 30% DRI, 1.0% C/70% SCRAP 5 15 15 13 18 2 2 48 70 22 13 9
4 HYLSA IVM 19 2 12 9 0 7 14 62 103 41 18 19 1
5 30% BF H.M./70% SCRAP CP COKE 9 18 16 16 6 4 6 59 75 16 17 11
6 30% MINI-BF H.M. 4 17 17 9 5 7 47 66 19 12 7
7 30% BF H.M./70% SCRAP NR COKE 8 11 11 7 2 8 4 37 51 14 9
8 30% COLD PIG IRON/70% SCRAP 10 9 20 8 7 6 9 67 99 32 19 18
9 30% TECNORED H.M. W COGEN 3 13 9 2 1 13 3 27 44 17 5
10 30% TECNORED H.M. W/O COGEN 2 21 19 11 3 12 8 53 76 23 15 13
11 COREX/MIDREX WITH 60% H.M. 21 20 21 21 13 21 21 83 138 55 21 21 2
12 HISMELT 32.7% H.M. 12 16 14 14 10 3 5 56 74 18 16 10
13 REDSMELT 16 10 8 17 4 7 11 51 83 32 14 15 1
14 MAUMEE BRIQUETTE DRI/EAF 14 3 1 5 14 11 13 3 1 8 3 5 1
15 ITMK3 DR SHOT TO EAF 15 4 3 8 9 18 18 30 75 45 6 12 1
16 CIRCORED/HBI/EAF 6 6 6 3 11 14 12 21 58 37 2 4 1
17 CIRCOFER/HBI/SAF/EAF 7 8 7 4 5 19 19 26 69 43 4 8 1
18 FINMET/HBI/EAF 13 7 5 6 12 10 10 1 3 2 7 6 1
19 GENERIC IRON CARBIDE (100%)/EAF 18 2 2 12 15 15 16 34 80 46 8 14 1
20 GENERIC I.C. (40%)/SAF/EAF 11 9 10 10 19 16 15 40 90 50 10 16 1
21 SL/RN ROTARY KILN 17 5 4 15 16 20 20 41 97 56 11 17 2
1 2 2
1 1 2
7
3
1 1 1
2
1
2 6 3
3 6 3
\\Da0002\01052901\common\DOE REPORT OCT 2000\Section 4.doc Page 36 of 39
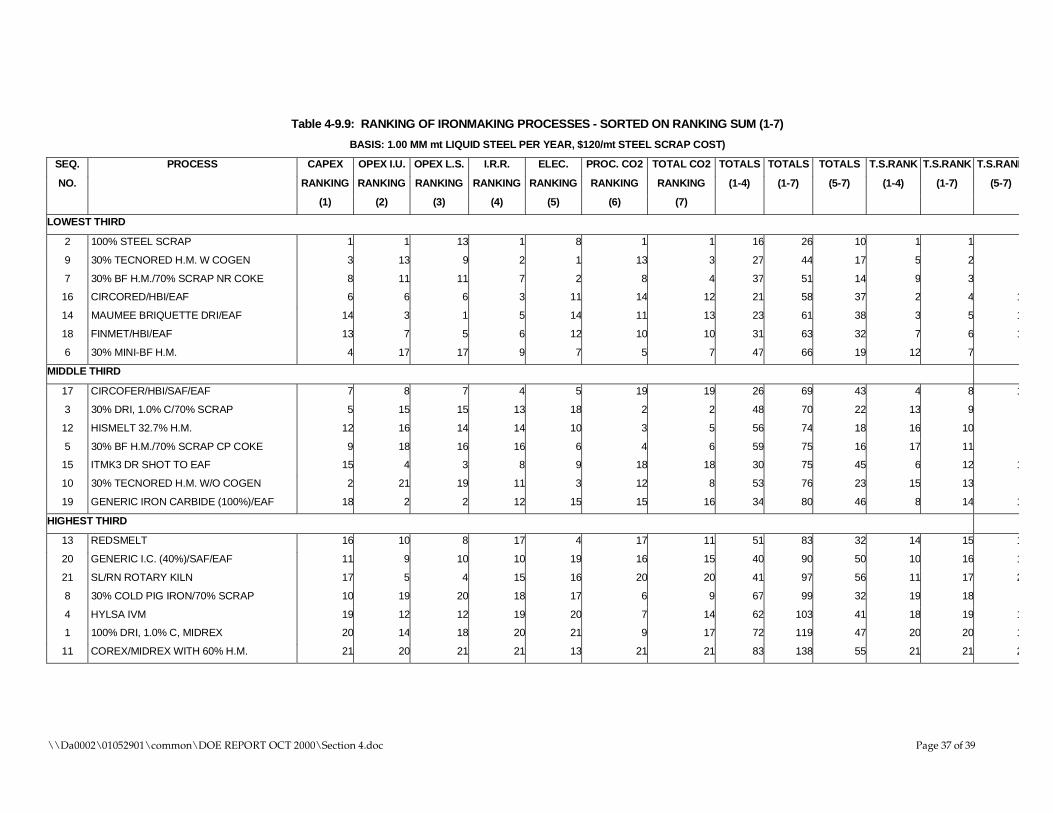
Table 4-9.9: RANKING OF IRONMAKING PROCESSES - SORTED ON RANKING SUM (1-7)
BASIS: 1.00 MM mt LIQUID STEEL PER YEAR, $120/mt STEEL SCRAP COST)
SEQ. PROCESS CAPEX OPEX I.U. OPEX L.S. I.R.R. ELEC. PROC. CO2 TOTAL CO2 TOTALS TOTALS TOTALS T.S.RANK T.S.RANK T.S.RANK
NO. RANKING RANKING RANKING RANKING RANKING RANKING RANKING (1-4) (1-7) (5-7) (1-4) (1-7) (5-7)
(1) (2) (3) (4) (5) (6) (7)
LOWEST THIRD
2 100% STEEL SCRAP 1 1 13 1 8 1 1 16 26 10 1 1
9 30% TECNORED H.M. W COGEN 3 13 9 2 1 13 3 27 44 17 5 2
7 30% BF H.M./70% SCRAP NR COKE 8 11 11 7 2 8 4 37 51 14 9 3
16 CIRCORED/HBI/EAF 6 6 6 3 11 14 12 21 58 37 2 4 1
14 MAUMEE BRIQUETTE DRI/EAF 14 3 5 14 11 13 23 61 38 3 5 1
18 FINMET/HBI/EAF 13 7 5 6 12 10 10 31 63 32 7 6 1
6 0% MINI-BF H.M. 4 17 17 5 7 47 66 19 12 7
MIDDLE THIRD
17 CIRCOFER/HBI/SAF/EAF 7 8 7 4 5 19 19 26 69 43 4 8 1
3 30% DRI, 1.0% C/70% SCRAP 5 15 15 13 18 2 2 48 70 22 13 9
12 HISMELT 32.7% H.M. 12 16 14 14 10 3 5 56 74 18 16 10
5 30% BF H.M./70% SCRAP CP COKE 9 18 16 16 6 4 6 59 75 16 17 11
15 ITMK3 DR SHOT TO EAF 15 4 3 8 9 18 18 30 75 45 6 12 1
10 30% TECNORED H.M. W/O COGEN 2 21 19 11 3 12 8 53 76 23 15 13
19 GENERIC IRON CARBIDE (100%)/EAF 18 2 2 12 15 15 16 34 80 46 8 14 1
HIGHEST THIRD
13 REDSMELT 16 10 8 17 4 7 11 51 83 32 14 15 1
20 GENERIC I.C. (40%)/SAF/EAF 11 9 10 10 19 16 15 40 90 50 10 16 1
21 SL/RN ROTARY KILN 17 5 4 15 16 20 20 41 97 56 11 17 2
8 30% COLD PIG IRON/70% SCRAP 10 19 20 18 17 6 67 99 32 19 18
4 HYLSA IVM 19 2 12 19 0 7 14 62 103 41 18 19 1
1 100% DRI, 1.0% C, MIDREX 20 14 18 20 21 9 17 72 119 47 20 20 1
11 COREX/MIDREX WITH 60% H.M. 21 20 21 21 13 21 21 83 138 55 21 21 2
1
3 7 9
1
9
1 2
\\Da0002\01052901\common\DOE REPORT OCT 2000\Section 4.doc Page 37 of 39
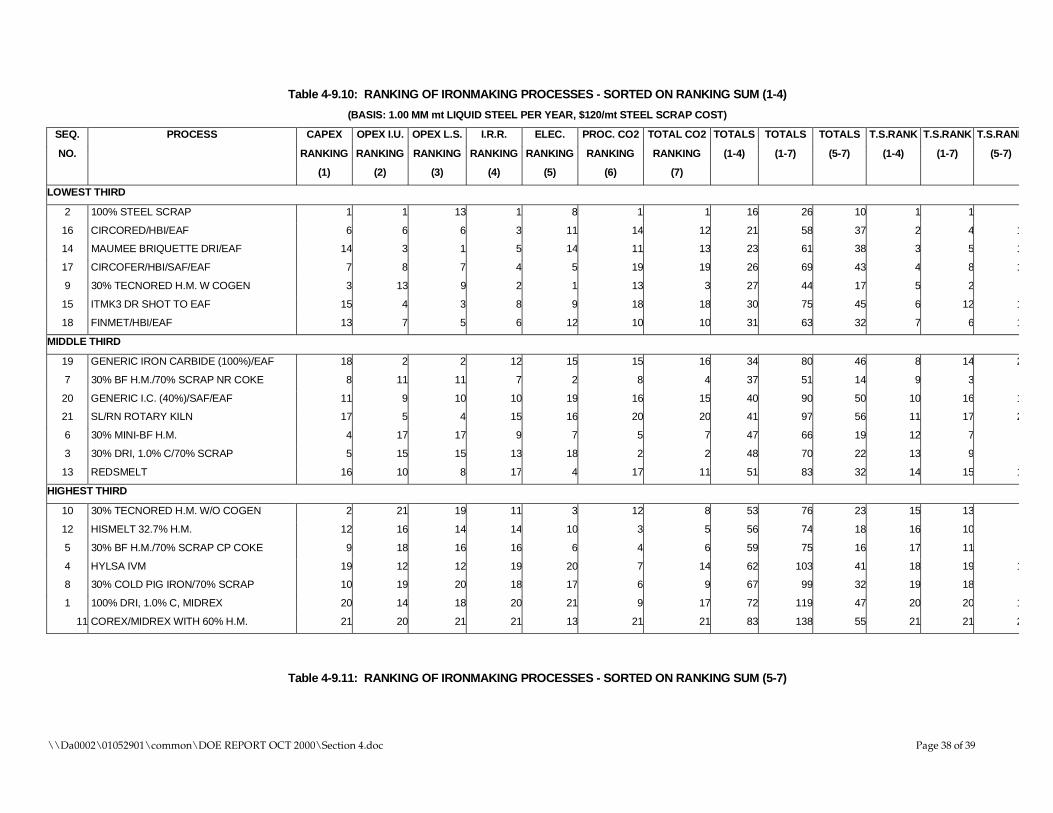
Table 4-9.10: RANKING OF IRONMAKING PROCESSES - SORTED ON RANKING SUM (1-4)
(BASIS: 1.00 MM mt LIQUID STEEL PER YEAR, $120/mt STEEL SCRAP COST)
SEQ. PROCESS CAPEX OPEX I.U. OPEX L.S. I.R.R. ELEC. PROC. CO2 TOTAL CO2 TOTALS TOTALS TOTALS T.S.RANK T.S.RANK T.S.RANK
NO. RANKING RANKING RANKING RANKING RANKING RANKING RANKING (1-4) (1-7) (5-7) (1-4) (1-7) (5-7)
(1) (2) (3) (4) (5) (6) (7)
LOWEST THIRD
2 100% STEEL SCRAP 1 1 13 1 8 1 1 16 26 10 1 1
16 CIRCORED/HBI/EAF 6 6 6 3 11 14 12 21 58 37 2 4 1
14 MAUMEE BRIQUETTE DRI/EAF 14 3 5 14 11 13 23 61 38 3 5 1
17 CIRCOFER/HBI/SAF/EAF 7 8 7 4 5 19 19 26 69 43 4 8 1
9 30% TECNORED H.M. W COGEN 3 13 9 2 1 13 3 27 44 17 5 2
15 ITMK3 DR SHOT TO EAF 15 4 3 8 9 18 18 30 75 45 6 12 1
18 FINMET/HBI/EAF 13 7 5 6 12 10 10 31 63 32 7 6 1
MIDDLE THIRD
19 GENERIC IRON CARBIDE (100%)/EAF 18 2 2 12 15 15 16 34 80 46 8 14 2
7 30% BF H.M./70% SCRAP NR COKE 8 11 11 7 2 8 4 37 51 14 9 3
20 GENERIC I.C. (40%)/SAF/EAF 11 9 10 10 19 16 15 40 90 50 10 16 1
21 SL/RN ROTARY KILN 17 5 4 15 16 20 20 41 97 56 11 17 2
6 0% MINI-BF H.M. 4 17 17 9 5 7 47 66 19 12 7
3 30% DRI, 1.0% C/70% SCRAP 5 15 15 13 18 2 2 48 70 22 13 9
13 REDSMELT 16 10 8 17 4 7 11 51 83 32 14 15 1
HIGHEST THIRD
10 30% TECNORED H.M. W/O COGEN 2 21 19 11 3 12 8 53 76 23 15 13
12 HISMELT 32.7% H.M. 12 16 14 14 10 3 5 56 74 18 16 10
5 30% BF H.M./70% SCRAP CP COKE 9 18 16 16 6 4 6 59 75 16 17 11
4 HYLSA IVM 19 2 12 9 0 7 14 62 103 41 18 19 1
8 30% COLD PIG IRON/70% SCRAP 10 19 20 18 17 6 67 99 32 19 18
1 100% DRI, 1.0% C, MIDREX 20 14 18 20 21 9 17 72 119 47 20 20 1
11 COREX/MIDREX WITH 60% H.M. 21 20 21 21 13 21 21 83 138 55 21 21 2
1
3 7
1
1 1 2
9
Table 4-9.11: RANKING OF IRONMAKING PROCESSES - SORTED ON RANKING SUM (5-7)
\\Da0002\01052901\common\DOE REPORT OCT 2000\Section 4.doc Page 38 of 39

(BASIS: 1.00 MM mt LIQUID STEEL PER YEAR, $120/mt STEEL SCRAP COST)
SEQ. PROCESS CAPEX OPEX I.U. OPEX L.S. I.R.R. ELEC. PROC. CO2 TOTAL CO2 TOTALS TOTALS TOTALS T.S.RANK T.S.RANK T.S.RANK
NO. RANKING RANKING RANKING RANKING RANKING RANKING RANKING (1-4) (1-7) (5-7) (1-4) (1-7) (5-7)
(1) (2) (3) (4) (5) (6) (7)
LOWEST THIRD
2 100% STEEL SCRAP 1 1 13 1 8 1 1 16 26 10 1 1
7 30% BF H.M./70% SCRAP NR COKE 8 11 11 7 2 8 4 37 51 14 9 3
5 30% BF H.M./70% SCRAP CP COKE 9 18 16 16 6 4 6 59 5 16 7 11
9 0% TECNORED H.M. W COGEN 3 13 9 2 13 3 27 44 17 5 2
12 HISMELT 32.7% H.M. 12 16 14 14 10 3 5 56 74 18 16 10
6 0% MINI-BF H.M. 4 17 17 9 5 7 47 66 19 12 7
3 30% DRI, 1.0% C/70% SCRAP 5 15 15 13 18 2 2 48 70 22 13 9
MIDDLE THIRD
10 30% TECNORED H.M. W/O COGEN 2 21 19 11 3 12 8 53 76 23 15 13
8 30% COLD PIG IRON/70% SCRAP 10 19 20 18 17 6 67 99 32 19 18
18 FINMET/HBI/EAF 13 7 5 6 12 10 10 31 63 32 7 6 1
13 REDSMELT 16 10 8 17 4 17 11 51 3 32 4 15 1
16 CIRCORED/HBI/EAF 6 6 6 3 11 14 12 21 58 37 2 4 1
14 MAUMEE BRIQUETTE DRI/EAF 14 3 5 14 11 13 23 61 38 3 5 1
4 YLSA IVM 19 12 12 19 20 7 14 62 103 41 18 19 1
HIGHEST THIRD
17 CIRCOFER/HBI/SAF/EAF 7 8 7 4 19 19 26 69 43 4 8 1
15 ITMK3 DR SHOT TO EAF 15 4 3 8 9 18 18 30 75 45 6 12 1
19 GENERIC IRON CARBIDE (100%)/EAF 18 2 2 12 15 15 16 34 80 46 8 14 1
1 100% DRI, 1.0% C, MIDREX 20 14 18 20 21 9 17 72 119 47 20 20 1
20 GENERIC I.C. (40%)/SAF/EAF 11 9 10 10 19 16 15 40 90 50 10 16 1
11 COREX/MIDREX WITH 60% H.M. 21 20 21 21 13 21 21 83 138 55 21 21 2
21 SL/RN ROTARY KILN 17 5 4 15 16 20 20 41 97 56 11 17 2
7 1
3 1
3 7
9
8 1
1
H
5
\\Da0002\01052901\common\DOE REPORT OCT 2000\Section 4.doc Page 39 of 39
Section 5: Summary and Conclusions
5-1: Conclusions From Sorts
A number of conclusions can be draw from examination of the grouping of the sorted variables developed in this Study. It can be concluded that those Ironmaking processes (i.e., Process Scenario through EAF/LRF production of LRS) that consistently ended up in the lowest (or most desirable) grouping, would have more desired economics or more favorable environmental impacts than those processes that consistently were grouped in the Middle or Highest groupings.
In the Resequenced Selected Process Scenarios (as ordered in Table 4-9.8) there are 21 selected processes. Thus these were grouped into groups of 7 for purposes of comparison. The discussions below focus processes with common attributes that favor their ranking in the sorted groupings. In addition, attention is called to any specific attribute of a process that moves it into a more favorable or less favorable grouping.
In this subjective analysis of the key variables developed for each process scenario, a consensus on those processes or process attributes that show a favorable potential will be developed.
\\Da0002\01052901\common\DOE REPORT OCT 2000\Section 5.doc Page 1 of 18
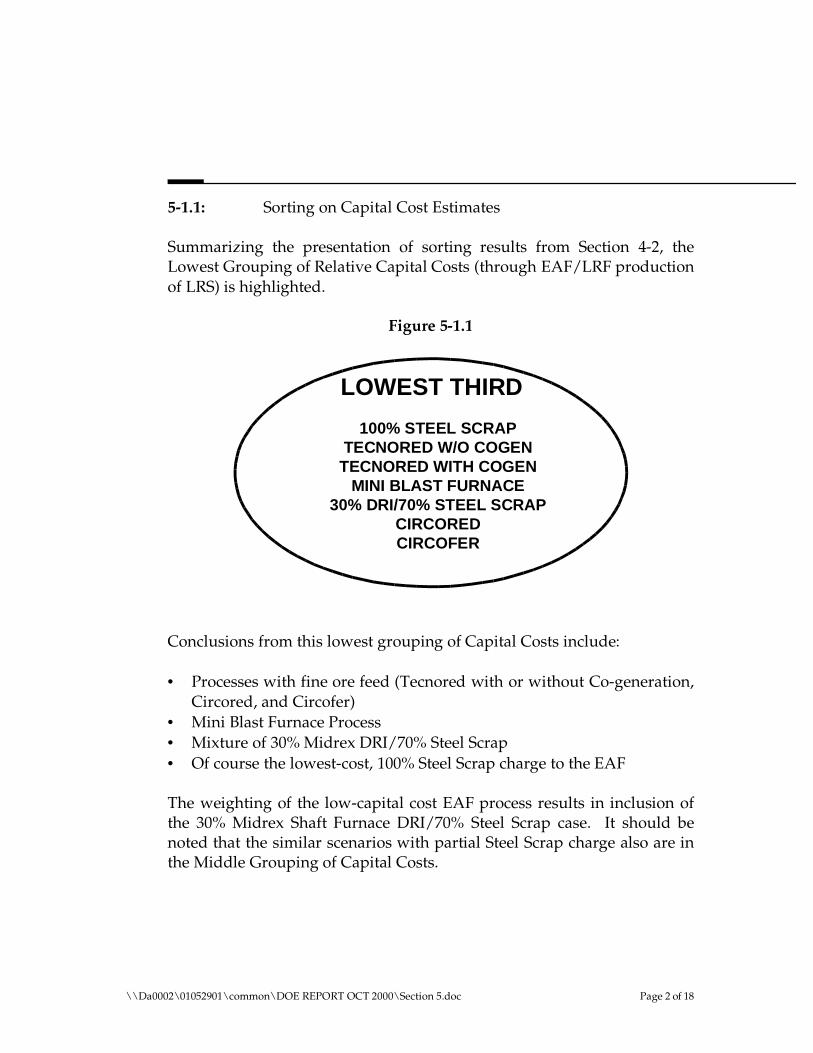
5-1.1: Sorting on Capital Cost Estimates
Summarizing the presentation of sorting results from Section 4-2, the Lowest Grouping of Relative Capital Costs (through EAF/LRF production of LRS) is highlighted.
Figure 5-1.1
LOWEST THIRD
100% STEEL SCRAP TECNORED W/O COGEN
TECNORED WITH COGEN MINI BLAST FURNACE
30% DRI/70% STEEL SCRAP CIRCORED CIRCOFER
Conclusions from this lowest grouping of Capital Costs include:
• Processes with fine ore feed (Tecnored with or without Co-generation, Circored, and Circofer)
• Mini Blast Furnace Process • Mixture of 30% Midrex DRI/70% Steel Scrap • Of course the lowest-cost, 100% Steel Scrap charge to the EAF
The weighting of the low-capital cost EAF process results in inclusion of the 30% Midrex Shaft Furnace DRI/70% Steel Scrap case. It should be noted that the similar scenarios with partial Steel Scrap charge also are in the Middle Grouping of Capital Costs.
\\Da0002\01052901\common\DOE REPORT OCT 2000\Section 5.doc Page 2 of 18
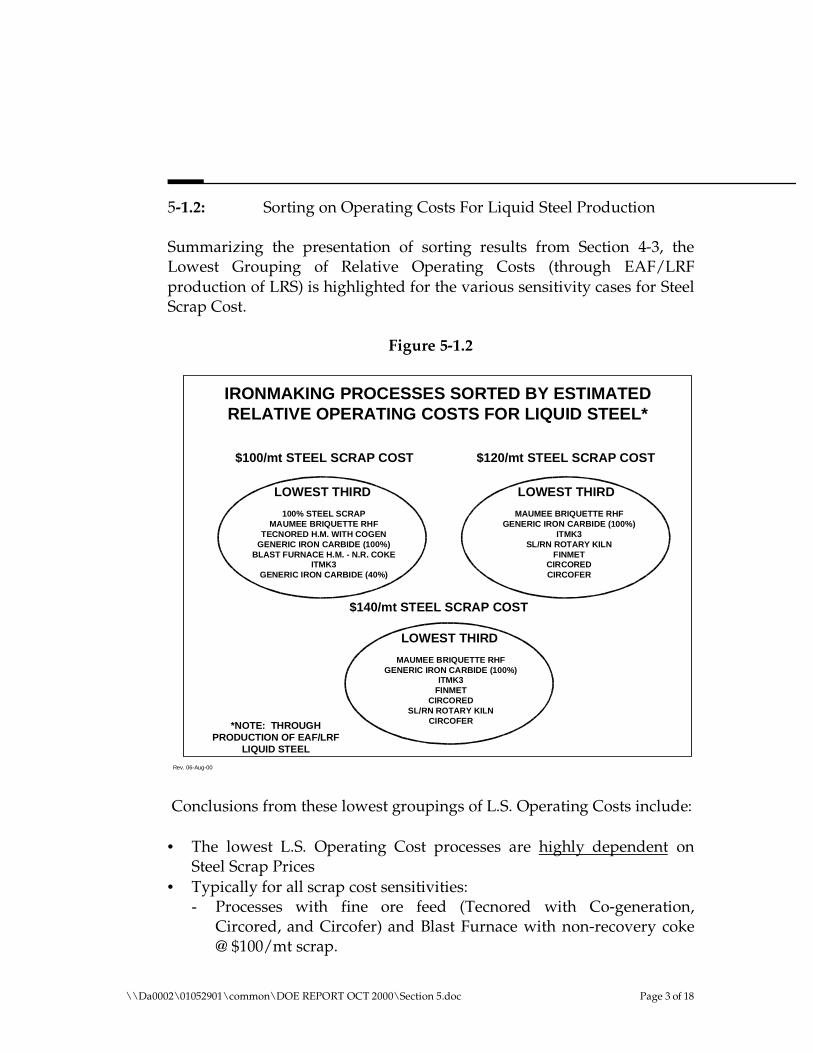
5-1.2: Sorting on Operating Costs For Liquid Steel Production
Summarizing the presentation of sorting results from Section 4-3, the Lowest Grouping of Relative Operating Costs (through EAF/LRF production of LRS) is highlighted for the various sensitivity cases for Steel Scrap Cost.
Figure 5-1.2
IRONMAKING PROCESSES SORTED BY ESTIMATED RELATIVE OPERATING COSTS FOR LIQUID STEEL*
LOWEST THIRD
100% STEEL SCRAP MAUMEE BRIQUETTE RHF
TECNORED H.M. WITH COGEN GENERIC IRON CARBIDE (100%)
BLAST FURNACE H.M. - N.R. COKE ITMK3
GENERIC IRON CARBIDE (40%)
*NOTE: THROUGH PRODUCTION OF EAF/LRF
LIQUID STEEL
$100/mt STEEL SCRAP COST
LOWEST THIRD
MAUMEE BRIQUETTE RHF GENERIC IRON CARBIDE (100%)
ITMK3 SL/RN ROTARY KILN
FINMET CIRCORED CIRCOFER
$120/mt STEEL SCRAP COST
LOWEST THIRD
MAUMEE BRIQUETTE RHF GENERIC IRON CARBIDE (100%)
ITMK3 FINMET
CIRCORED SL/RN ROTARY KILN
CIRCOFER
$140/mt STEEL SCRAP COST
Rev. 06-Aug-00
Conclusions from these lowest groupings of L.S. Operating Costs include:
• The lowest L.S. Operating Cost processes are highly dependent on Steel Scrap Prices
• Typically for all scrap cost sensitivities: - Processes with fine ore feed (Tecnored with Co-generation,
Circored, and Circofer) and Blast Furnace with non-recovery coke @ $100/mt scrap.
\\Da0002\01052901\common\DOE REPORT OCT 2000\Section 5.doc Page 3 of 18

- Fine ore feed processes (MauMee, Iron Carbide, ITMK3, Finmet, Circored, and Circofer) and SL/RN @ $120/mt and $140/mt scrap costs.
- These include the lower-cost Rotary Hearth as well as the Fluidized-Bed process.
Except at the lowest scrap price with the low-cost Hot Metal producers (i.e., Tecnored or Blast Furnace both with co-generation), the lowest cost processes are those with low-cost iron ore fines as the primary iron unit feed.
5-1.3: Sorting on Operating Costs For Iron Unit Production
Summarizing the presentation of sorting results from Section 4-4, the Lowest Grouping of Relative Operating Costs for Iron Unit production is highlighted.
Figure 5-1.3
LOWEST THIRD
GENERIC IRON CARBIDE (100%) MAUMEE BRIQUETTE RHF
ITMK3 SL/RN ROTARY KILN
CIRCORED FINMET
\\Da0002\01052901\common\DOE REPORT OCT 2000\Section 5.doc Page 4 of 18
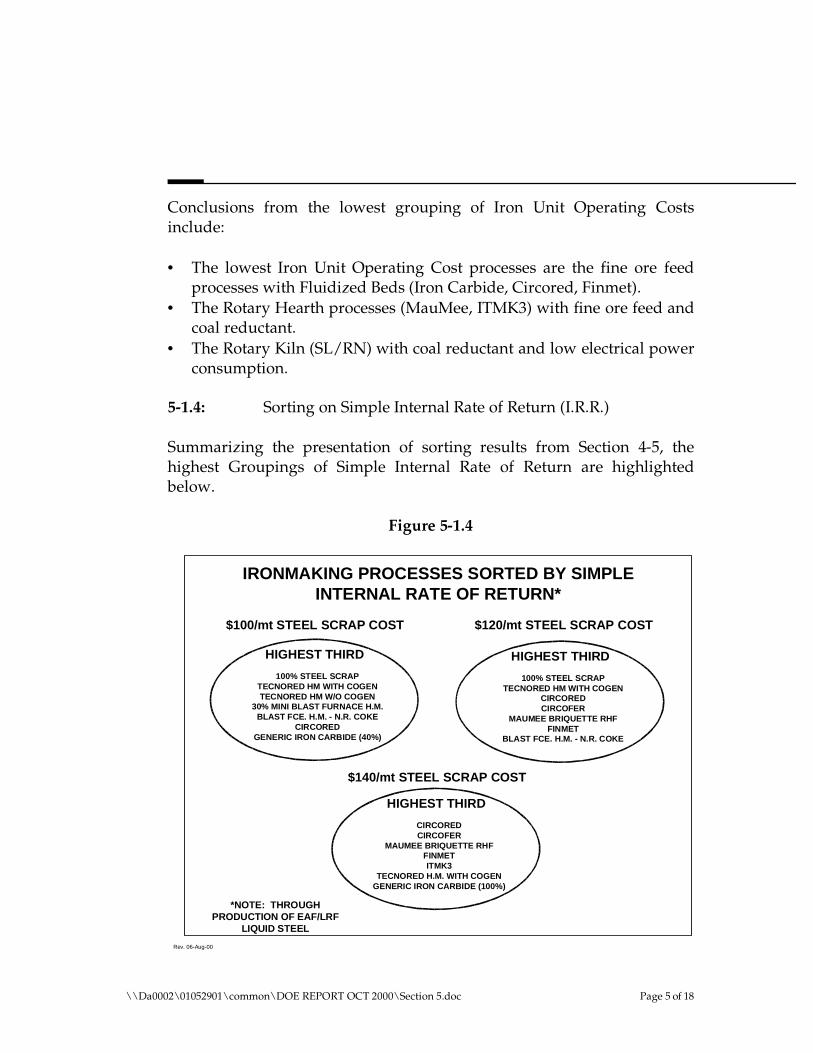
Conclusions from the lowest grouping of Iron Unit Operating Costs include:
• The lowest Iron Unit Operating Cost processes are the fine ore feed processes with Fluidized Beds (Iron Carbide, Circored, Finmet).
• The Rotary Hearth processes (MauMee, ITMK3) with fine ore feed and coal reductant.
• The Rotary Kiln (SL/RN) with coal reductant and low electrical power consumption.
5-1.4: Sorting on Simple Internal Rate of Return (I.R.R.)
Summarizing the presentation of sorting results from Section 4-5, the highest Groupings of Simple Internal Rate of Return are highlighted below.
Figure 5-1.4
IRONMAKING PROCESSES SORTED BY SIMPLE INTERNAL RATE OF RETURN*
HIGHEST THIRD
100% STEEL SCRAP TECNORED HM WITH COGEN TECNORED HM W/O COGEN
30% MINI BLAST FURNACE H.M. BLAST FCE. H.M. - N.R. COKE
CIRCORED GENERIC IRON CARBIDE (40%)
*NOTE: THROUGH PRODUCTION OF EAF/LRF
LIQUID STEEL
$100/mt STEEL SCRAP COST
HIGHEST THIRD
100% STEEL SCRAP TECNORED HM WITH COGEN
CIRCORED CIRCOFER
MAUMEE BRIQUETTE RHF FINMET
BLAST FCE. H.M. - N.R. COKE
$120/mt STEEL SCRAP COST
HIGHEST THIRD
CIRCORED CIRCOFER
MAUMEE BRIQUETTE RHF FINMET ITMK3
TECNORED H.M. WITH COGEN GENERIC IRON CARBIDE (100%)
$140/mt STEEL SCRAP COST
Rev. 06-Aug-00
\\Da0002\01052901\common\DOE REPORT OCT 2000\Section 5.doc Page 5 of 18
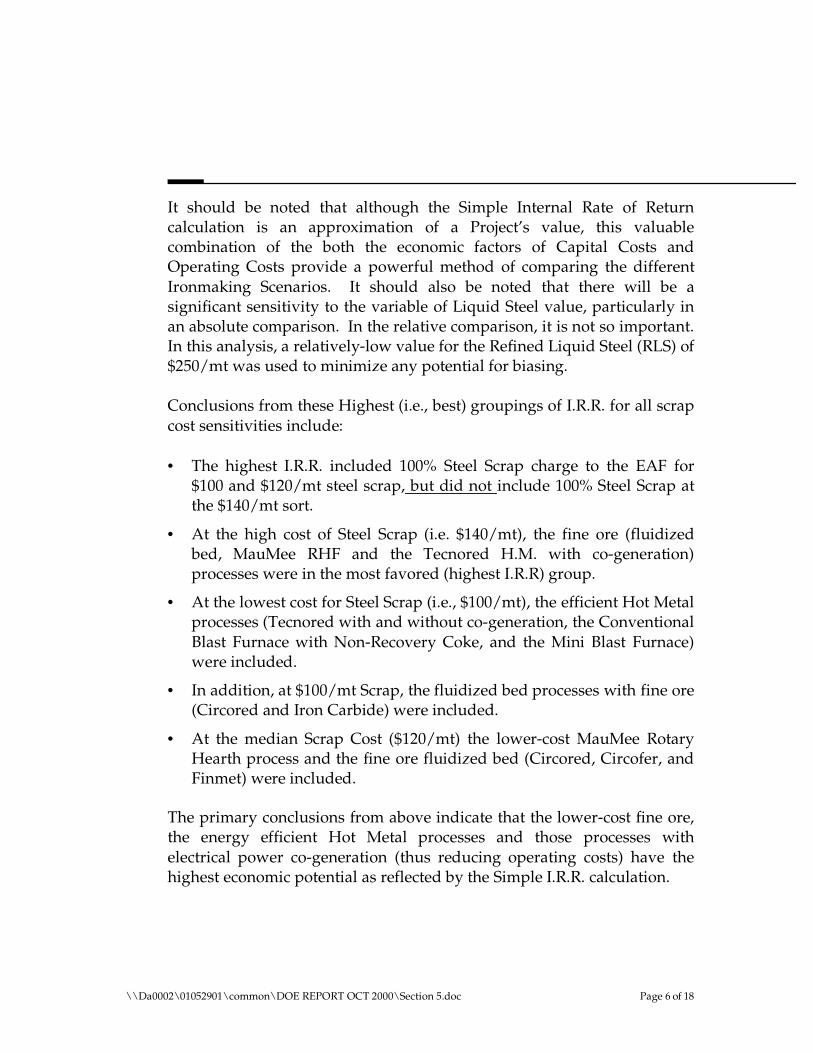
It should be noted that although the Simple Internal Rate of Return calculation is an approximation of a Project’s value, this valuable combination of the both the economic factors of Capital Costs and Operating Costs provide a powerful method of comparing the different Ironmaking Scenarios. It should also be noted that there will be a significant sensitivity to the variable of Liquid Steel value, particularly in an absolute comparison. In the relative comparison, it is not so important. In this analysis, a relatively-low value for the Refined Liquid Steel (RLS) of $250/mt was used to minimize any potential for biasing.
Conclusions from these Highest (i.e., best) groupings of I.R.R. for all scrap cost sensitivities include:
• The highest I.R.R. included 100% Steel Scrap charge to the EAF for $100 and $120/mt steel scrap, but did not include 100% Steel Scrap at the $140/mt sort.
• At the high cost of Steel Scrap (i.e. $140/mt), the fine ore (fluidized bed, MauMee RHF and the Tecnored H.M. with co-generation) processes were in the most favored (highest I.R.R) group.
• At the lowest cost for Steel Scrap (i.e., $100/mt), the efficient Hot Metal processes (Tecnored with and without co-generation, the Conventional Blast Furnace with Non-Recovery Coke, and the Mini Blast Furnace) were included.
• In addition, at $100/mt Scrap, the fluidized bed processes with fine ore (Circored and Iron Carbide) were included.
• At the median Scrap Cost ($120/mt) the lower-cost MauMee Rotary Hearth process and the fine ore fluidized bed (Circored, Circofer, and Finmet) were included.
The primary conclusions from above indicate that the lower-cost fine ore, the energy efficient Hot Metal processes and those processes with electrical power co-generation (thus reducing operating costs) have the highest economic potential as reflected by the Simple I.R.R. calculation.
\\Da0002\01052901\common\DOE REPORT OCT 2000\Section 5.doc Page 6 of 18
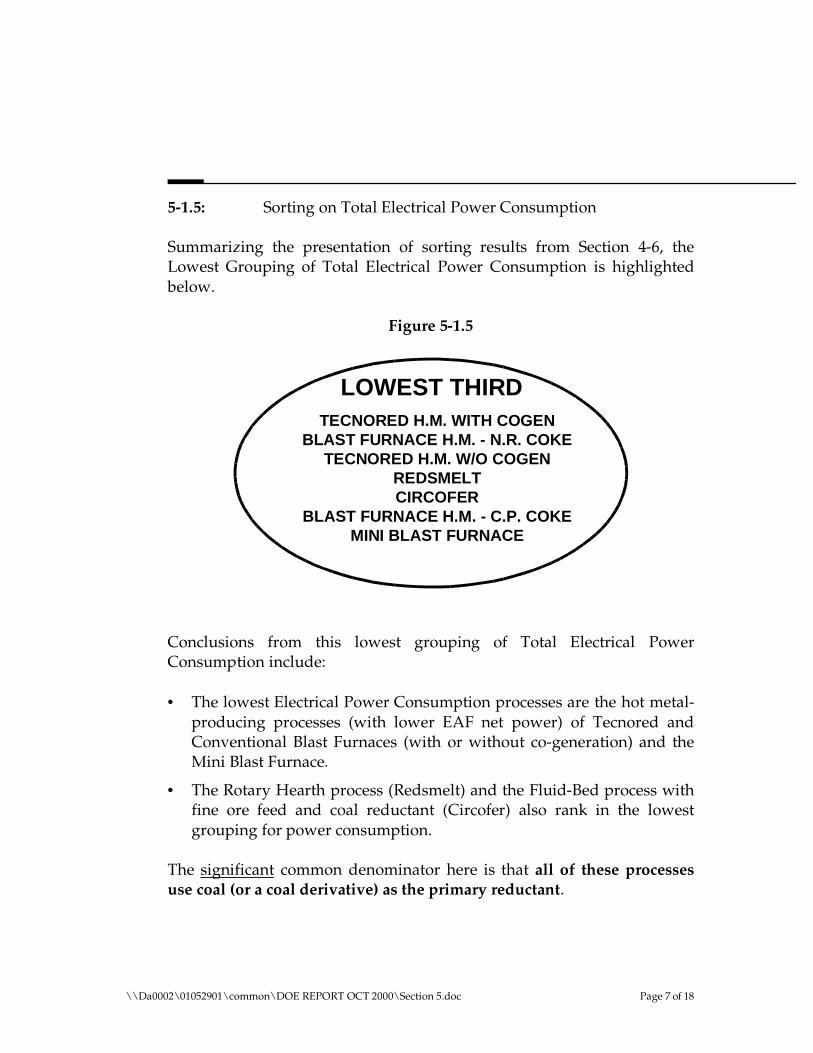
5-1.5: Sorting on Total Electrical Power Consumption
Summarizing the presentation of sorting results from Section 4-6, the Lowest Grouping of Total Electrical Power Consumption is highlighted below.
Figure 5-1.5
LOWEST THIRD TECNORED H.M. WITH COGEN
BLAST FURNACE H.M. - N.R. COKE TECNORED H.M. W/O COGEN
REDSMELT CIRCOFER
BLAST FURNACE H.M. - C.P. COKE MINI BLAST FURNACE
Conclusions from this lowest grouping of Total Electrical Power Consumption include:
• The lowest Electrical Power Consumption processes are the hot metal-producing processes (with lower EAF net power) of Tecnored and Conventional Blast Furnaces (with or without co-generation) and the Mini Blast Furnace.
• The Rotary Hearth process (Redsmelt) and the Fluid-Bed process with fine ore feed and coal reductant (Circofer) also rank in the lowest grouping for power consumption.
The significant common denominator here is that all of these processes use coal (or a coal derivative) as the primary reductant.
\\Da0002\01052901\common\DOE REPORT OCT 2000\Section 5.doc Page 7 of 18
5-1.6: Sorting on Cumulative Process (only) Greenhouse Gas (as CO2) Emissions
Summarizing the presentation of sorting results from Section 4-7, the Lowest Grouping of Total Cumulative Process Greenhouse Gas Emissions is highlighted below.
Figure 5-1.6
LOWEST THIRD 100% STEEL SCRAP
30% MIDREX SHAFT FCE. DRI HISMELT
BLAST FURNACE H.M. - C.P. COKE MINI BLAST FURNACE
30% COLD PIG IRON/SCRAP HYLSA IVM
Conclusions from this lowest grouping of Total Cumulative Process Emissions include:
• The 100% Steel Scrap EAF.
• The Hot Metal-producing process of Conventional Blast Furnace with conventional Co-Product Coke (without combustion co-generation), B.F. Pig Iron and the Mini Blast Furnace are in the lower emissions group.
• The Shaft Furnace DRI processes (Midrex and HYLSA IVM) are in the lowest group likely by virtue of the low emissions from the natural gas fired shaft furnace direct reduction processes.
• The Hismelt Oxygen Reactor process also ranked in the Lowest Group for Process Emissions.
Note: This does not include the electrical power component that would influence total emissions.
\\Da0002\01052901\common\DOE REPORT OCT 2000\Section 5.doc Page 8 of 18
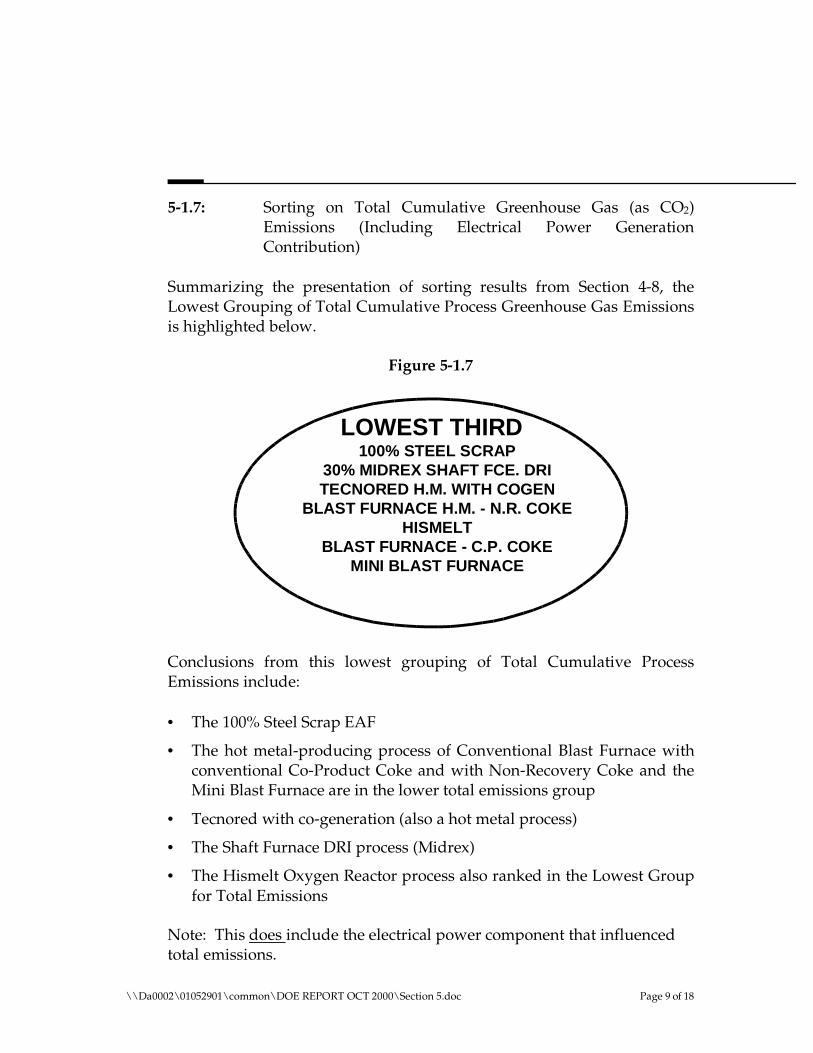
5-1.7: Sorting on Total Cumulative Greenhouse Gas (as CO2) Emissions (Including Electrical Power Generation Contribution)
Summarizing the presentation of sorting results from Section 4-8, the Lowest Grouping of Total Cumulative Process Greenhouse Gas Emissions is highlighted below.
Figure 5-1.7
LOWEST THIRD 100% STEEL SCRAP
30% MIDREX SHAFT FCE. DRI TECNORED H.M. WITH COGEN
BLAST FURNACE H.M. - N.R. COKE HISMELT
BLAST FURNACE - C.P. COKE MINI BLAST FURNACE
Conclusions from this lowest grouping of Total Cumulative Process Emissions include:
• The 100% Steel Scrap EAF
• The hot metal-producing process of Conventional Blast Furnace with conventional Co-Product Coke and with Non-Recovery Coke and the Mini Blast Furnace are in the lower total emissions group
• Tecnored with co-generation (also a hot metal process)
• The Shaft Furnace DRI process (Midrex)
• The Hismelt Oxygen Reactor process also ranked in the Lowest Group for Total Emissions
Note: This does include the electrical power component that influenced total emissions.
\\Da0002\01052901\common\DOE REPORT OCT 2000\Section 5.doc Page 9 of 18
5-2: Conclusions From Ranking Sorts
The Relative Process Variables utilized for the Ranking Sort Analysis were:
1. CAPEX 2. OPEX for Iron Unit 3. OPEX for Liquid Steel 4. Simple Internal Rate of Return 5. Total Cumulative Electrical Power 6. Total Cumulative Process (Only) Emissions 7. Total Cumulative Emissions (Process and Equivalent E.P. Emissions)
The Ranking Sort Analysis, or regrouping the processes on the sums of their numeric variable sort sequences (from Section 4), was done for all Scrap Cost sensitivities of $100/mt, $120/mt and $140/mt where appropriate. The sums of the sort sequences for variables 1-4 reflect economic considerations, the sums of variables 5-7 reflect energy and environmental considerations and the sums of all of the variables 1-7 present an overall picture of the process scenarios.
5-2.1: Ranking Sort on Economic Variables (1-4)
Referring to the Table 4-9.10 and Volume II, Appendix G, for the Sort and Grouping on the Ranking sums of Economic-Related Variables 1-4, the following groupings are obtained:
• Lower Grouping: Most desirable or favorable processes • Middle Grouping: Intermediate desirability • Highest Grouping: Least desirable or favorable processes
These results are presented in pictorial form in Figures 5-2.1 through 5-2.3.
\\Da0002\01052901\common\DOE REPORT OCT 2000\Section 5.doc Page 10 of 18
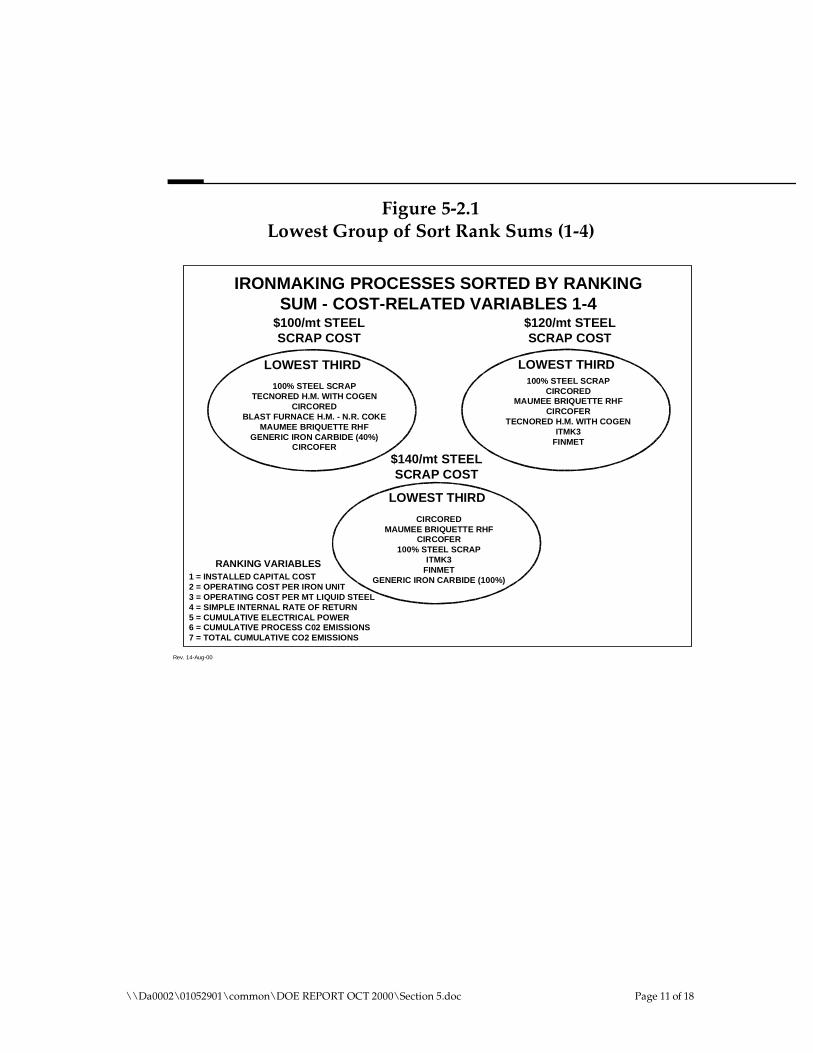
Figure 5-2.1Lowest Group of Sort Rank Sums (1-4)
IRONMAKING PROCESSES SORTED BY RANKING SUM - COST-RELATED VARIABLES 1-4
LOWEST THIRD
100% STEEL SCRAP TECNORED H.M. WITH COGEN
CIRCORED BLAST FURNACE H.M. - N.R. COKE
MAUMEE BRIQUETTE RHF GENERIC IRON CARBIDE (40%)
CIRCOFER
RANKING VARIABLES 1 = INSTALLED CAPITAL COST 2 = OPERATING COST PER IRON UNIT 3 = OPERATING COST PER MT LIQUID STEEL 4 = SIMPLE INTERNAL RATE OF RETURN 5 = CUMULATIVE ELECTRICAL POWER 6 = CUMULATIVE PROCESS C02 EMISSIONS 7 = TOTAL CUMULATIVE CO2 EMISSIONS
$100/mt STEEL SCRAP COST
LOWEST THIRD
CIRCORED MAUMEE BRIQUETTE RHF
CIRCOFER 100% STEEL SCRAP
ITMK3 FINMET
GENERIC IRON CARBIDE (100%)
LOWEST THIRD 100% STEEL SCRAP
CIRCORED MAUMEE BRIQUETTE RHF
CIRCOFERTECNORED H.M. WITH COGEN
ITMK3FINMET
$120/mt STEEL SCRAP COST
$140/mt STEEL SCRAP COST
Rev. 14-Aug-00
\\Da0002\01052901\common\DOE REPORT OCT 2000\Section 5.doc Page 11 of 18
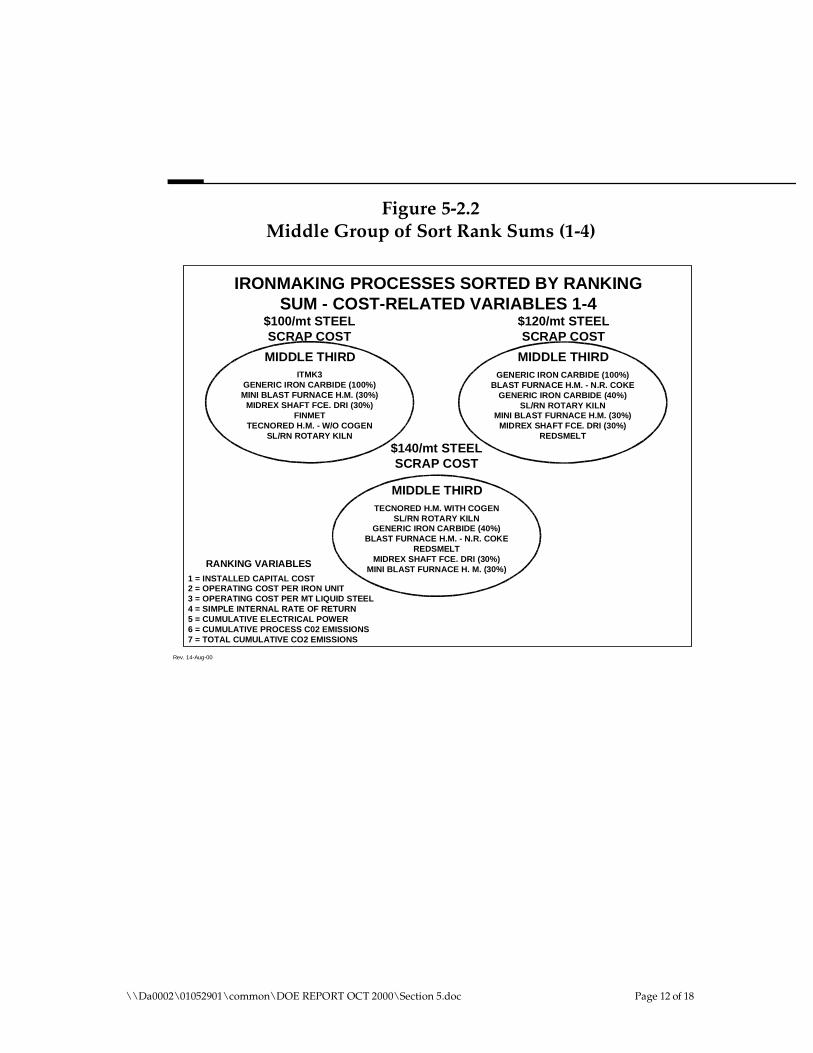
Figure 5-2.2Middle Group of Sort Rank Sums (1-4)
IRONMAKING PROCESSES SORTED BY RANKING SUM - COST-RELATED VARIABLES 1-4
MIDDLE THIRD GENERIC IRON CARBIDE (100%)
BLAST FURNACE H.M. - N.R. COKE GENERIC IRON CARBIDE (40%)
SL/RN ROTARY KILN MINI BLAST FURNACE H.M. (30%)
MIDREX SHAFT FCE. DRI (30%) REDSMELT
RANKING VARIABLES
1 = INSTALLED CAPITAL COST 2 = OPERATING COST PER IRON UNIT 3 = OPERATING COST PER MT LIQUID STEEL 4 = SIMPLE INTERNAL RATE OF RETURN 5 = CUMULATIVE ELECTRICAL POWER 6 = CUMULATIVE PROCESS C02 EMISSIONS 7 = TOTAL CUMULATIVE CO2 EMISSIONS
$120/mt STEEL SCRAP COST
MIDDLE THIRD TECNORED H.M. WITH COGEN
SL/RN ROTARY KILN GENERIC IRON CARBIDE (40%)
BLAST FURNACE H.M. - N.R. COKE REDSMELT
MIDREX SHAFT FCE. DRI (30%) MINI BLAST FURNACE H. M. (30%)
MIDDLE THIRD ITMK3
GENERIC IRON CARBIDE (100%) MINI BLAST FURNACE H.M. (30%)
MIDREX SHAFT FCE. DRI (30%) FINMET
TECNORED H.M. - W/O COGEN SL/RN ROTARY KILN
$140/mt STEEL SCRAP COST
$100/mt STEEL SCRAP COST
Rev. 14-Aug-00
\\Da0002\01052901\common\DOE REPORT OCT 2000\Section 5.doc Page 12 of 18
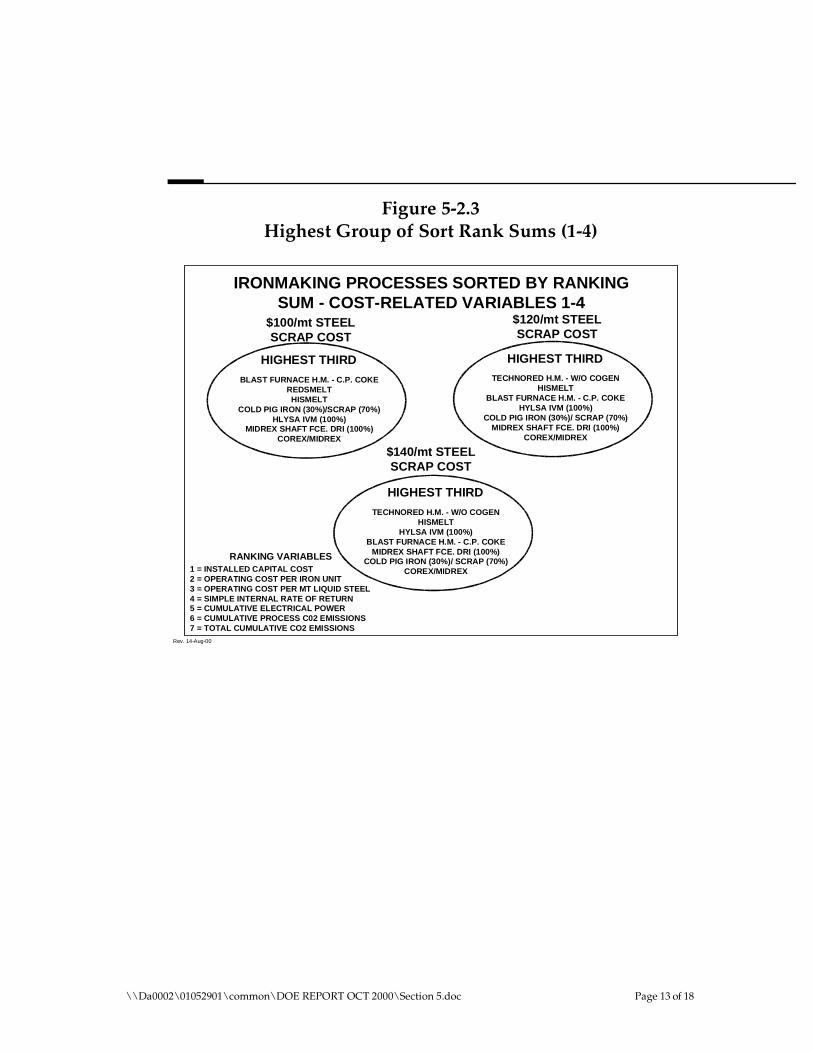
Figure 5-2.3Highest Group of Sort Rank Sums (1-4)
IRONMAKING PROCESSES SORTED BY RANKING SUM - COST-RELATED VARIABLES 1-4
HIGHEST THIRD
TECHNORED H.M. - W/O COGEN HISMELT
HYLSA IVM (100%) BLAST FURNACE H.M. - C.P. COKE
MIDREX SHAFT FCE. DRI (100%) COLD PIG IRON (30%)/ SCRAP (70%)
COREX/MIDREX
RANKING VARIABLES 1 = INSTALLED CAPITAL COST 2 = OPERATING COST PER IRON UNIT 3 = OPERATING COST PER MT LIQUID STEEL 4 = SIMPLE INTERNAL RATE OF RETURN 5 = CUMULATIVE ELECTRICAL POWER 6 = CUMULATIVE PROCESS C02 EMISSIONS 7 = TOTAL CUMULATIVE CO2 EMISSIONS
$140/mt STEEL SCRAP COST
HIGHEST THIRD
TECHNORED H.M. - W/O COGEN HISMELT
BLAST FURNACE H.M. - C.P. COKE HYLSA IVM (100%)
COLD PIG IRON (30%)/ SCRAP (70%) MIDREX SHAFT FCE. DRI (100%)
COREX/MIDREX
HIGHEST THIRD
BLAST FURNACE H.M. - C.P. COKE REDSMELT
HISMELT COLD PIG IRON (30%)/SCRAP (70%)
HLYSA IVM (100%) MIDREX SHAFT FCE. DRI (100%)
COREX/MIDREX
$120/mt STEEL SCRAP COST
$100/mt STEEL SCRAP COST
Rev. 14-Aug-00
\\Da0002\01052901\common\DOE REPORT OCT 2000\Section 5.doc Page 13 of 18
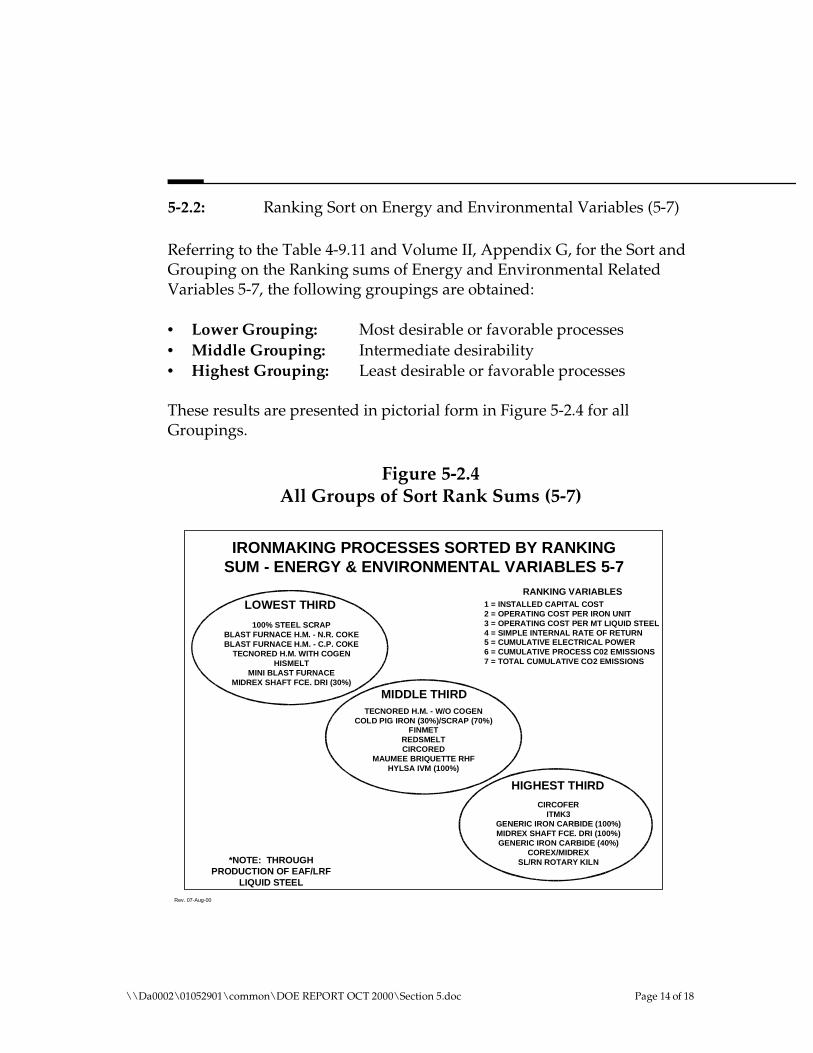
5-2.2: Ranking Sort on Energy and Environmental Variables (5-7)
Referring to the Table 4-9.11 and Volume II, Appendix G, for the Sort and Grouping on the Ranking sums of Energy and Environmental Related Variables 5-7, the following groupings are obtained:
• Lower Grouping: Most desirable or favorable processes • Middle Grouping: Intermediate desirability • Highest Grouping: Least desirable or favorable processes
These results are presented in pictorial form in Figure 5-2.4 for all Groupings.
Figure 5-2.4All Groups of Sort Rank Sums (5-7)
IRONMAKING PROCESSES SORTED BY RANKING SUM - ENERGY & ENVIRONMENTAL VARIABLES 5-7
HIGHEST THIRD
CIRCOFER ITMK3
GENERIC IRON CARBIDE (100%) MIDREX SHAFT FCE. DRI (100%) GENERIC IRON CARBIDE (40%)
COREX/MIDREX SL/RN ROTARY KILN
LOWEST THIRD
100% STEEL SCRAP BLAST FURNACE H.M. - N.R. COKE BLAST FURNACE H.M. - C.P. COKE
TECNORED H.M. WITH COGEN HISMELT
MINI BLAST FURNACE MIDREX SHAFT FCE. DRI (30%)
MIDDLE THIRD TECNORED H.M. - W/O COGEN
COLD PIG IRON (30%)/SCRAP (70%) FINMET
REDSMELT CIRCORED
MAUMEE BRIQUETTE RHF HYLSA IVM (100%)
*NOTE: THROUGH PRODUCTION OF EAF/LRF
LIQUID STEEL
RANKING VARIABLES 1 = INSTALLED CAPITAL COST 2 = OPERATING COST PER IRON UNIT 3 = OPERATING COST PER MT LIQUID STEEL 4 = SIMPLE INTERNAL RATE OF RETURN 5 = CUMULATIVE ELECTRICAL POWER 6 = CUMULATIVE PROCESS C02 EMISSIONS 7 = TOTAL CUMULATIVE CO2 EMISSIONS
Rev. 07-Aug-00
\\Da0002\01052901\common\DOE REPORT OCT 2000\Section 5.doc Page 14 of 18

5-2.3: Ranking Sort on All Variables (1-7)
Referring to the Table 4-9.9 and Volume II, Appendix G, for the Sort and Grouping on the Ranking sums of All Variables 1-7, the following groupings are obtained:
• Lower Grouping: Most desirable or favorable processes • Middle Grouping: Intermediate desirability • Highest Grouping: Least desirable or favorable processes
These results are presented in pictorial form in Figures 5-2.5 through 5-2.7 for all Groupings.
Figure 5-2.5Lowest Group of Sort Rank Sums (1-7)
IRONMAKING PROCESSES SORTED BY RANKING SUM - ALL VARIABLES SUMMED 1-7
LOWEST THIRD 100% STEEL SCRAP
TECNORED H.M. WITH COGEN BLAST FURNACE H.M. - N.R. COKE
MINI BLAST FURNACE MIDREX SHAFT FCE. DRI (30%)
CIRCORED TECNORED H.M. W/O COGEN
RANKING VARIABLES
1 = INSTALLED CAPITAL COST 2 = OPERATING COST PER IRON UNIT 3 = OPERATING COST PER MT LIQUID STEEL 4 = SIMPLE INTERNAL RATE OF RETURN 5 = CUMULATIVE ELECTRICAL POWER 6 = CUMULATIVE PROCESS C02 EMISSIONS 7 = TOTAL CUMULATIVE CO2 EMISSIONS
$100/mt STEEL SCRAP COST
LOWEST THIRD
100% STEEL SCRAP TECNORED H.M. WITH COGEN
CIRCORED BLAST FURNACE H.M. - N.R. COKE
MAUMEE BRIQUETTE RHF FINMET
CIRCOFER
LOWEST THIRD 100% STEEL SCRAP
TECNORED H.M. WITH COGEN BLAST FURNACE H.M. - N.R. COKE
CIRCORED MAUMEE BRIQUETTE RHF
FINMET MINI BLAST FURNACE H.M. (30%)
$120/mt STEEL SCRAP COST
$140/mt STEEL SCRAP COST
Rev. 14-Aug-00
\\Da0002\01052901\common\DOE REPORT OCT 2000\Section 5.doc Page 15 of 18

Figure 5-2.6Middle Group of Sort Rank Sums (1-7)
IRONMAKING PROCESSES SORTED BY RANKING SUM - ALL VARIABLES SUMMED 1-7
MIDDLE THIRD CIRCOFER
MIDREX SHAFT FCE. DRI (30%) HISMELT
BLAST FURNACE H.M. - C.P. COKE ITMK3
TECNORED H.M. - W/O COGEN GENERIC IRON CARBIDE (100%)
RANKING VARIABLES
1 = INSTALLED CAPITAL COST 2 = OPERATING COST PER IRON UNIT 3 = OPERATING COST PER MT LIQUID STEEL 4 = SIMPLE INTERNAL RATE OF RETURN 5 = CUMULATIVE ELECTRICAL POWER 6 = CUMULATIVE PROCESS C02 EMISSIONS 7 = TOTAL CUMULATIVE CO2 EMISSIONS
$120/mt STEEL SCRAP COST
MIDDLE THIRD ITMK3
MINI BLAST FURNACE H.M. (30%) MIDREX SHAFT FCE. DRI (30%)
GENERIC IRON CARBIDE (100%) BLAST FURNACE H.M. - C.P. COKE
HISMELT REDSMELT
MIDDLE THIRD MAUMEE BRIQUETTE RHF
BLAST FURNACE H.M. - C.P. COKE FINMET
HISMELT CIRCOFER
ITMK3 GENERIC IRON CARBIDE (40%)
$140/mt STEEL SCRAP COST
$100/mt STEEL SCRAP COST
Rev. 14-Aug-00
\\Da0002\01052901\common\DOE REPORT OCT 2000\Section 5.doc Page 16 of 18
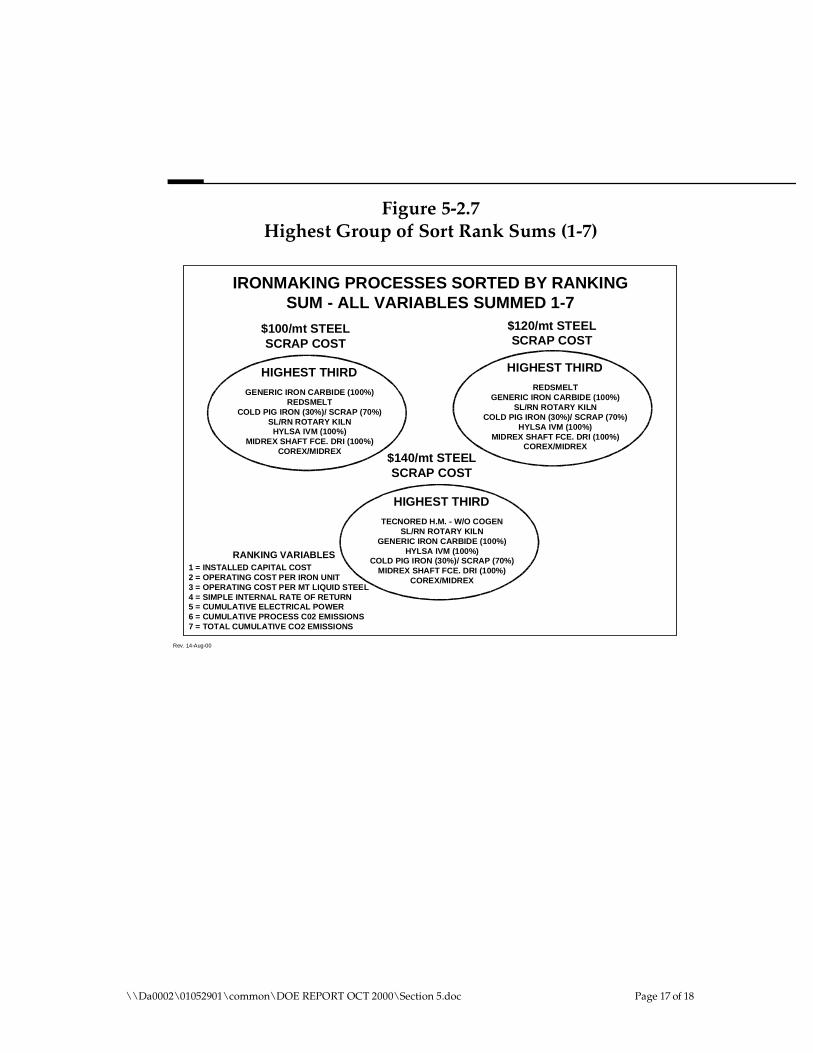
Figure 5-2.7Highest Group of Sort Rank Sums (1-7)
IRONMAKING PROCESSES SORTED BY RANKING SUM - ALL VARIABLES SUMMED 1-7
HIGHEST THIRD
TECNORED H.M. - W/O COGEN SL/RN ROTARY KILN
GENERIC IRON CARBIDE (100%) HYLSA IVM (100%)
COLD PIG IRON (30%)/ SCRAP (70%)MIDREX SHAFT FCE. DRI (100%)
COREX/MIDREX
RANKING VARIABLES 1 = INSTALLED CAPITAL COST 2 = OPERATING COST PER IRON UNIT 3 = OPERATING COST PER MT LIQUID STEEL 4 = SIMPLE INTERNAL RATE OF RETURN 5 = CUMULATIVE ELECTRICAL POWER 6 = CUMULATIVE PROCESS C02 EMISSIONS 7 = TOTAL CUMULATIVE CO2 EMISSIONS
$140/mt STEEL SCRAP COST
HIGHEST THIRD
REDSMELTGENERIC IRON CARBIDE (100%)
SL/RN ROTARY KILNCOLD PIG IRON (30%)/ SCRAP (70%)
HYLSA IVM (100%) MIDREX SHAFT FCE. DRI (100%)
COREX/MIDREX
HIGHEST THIRD
GENERIC IRON CARBIDE (100%) REDSMELT
COLD PIG IRON (30%)/ SCRAP (70%) SL/RN ROTARY KILN
HYLSA IVM (100%) MIDREX SHAFT FCE. DRI (100%)
COREX/MIDREX
$120/mt STEEL SCRAP COST
$100/mt STEEL SCRAP COST
Rev. 14-Aug-00
\\Da0002\01052901\common\DOE REPORT OCT 2000\Section 5.doc Page 17 of 18
5-3: General Conclusions From Sorting and Rank Sums
It should be noted that the following overall conclusions can be made from the sorted, grouped and ranked sum variables reflecting the Ironmaking process scenarios:
• The processes with the best combined economics (CAPEX and OPEX impacts in the I.R.R. calculation) can be grouped into those Fine Ore based processes with no scrap charge and those producing Hot Metal for charge to the EAF.
• A pronounced sensitivity to Steel Scrap Cost was felt less by the Hot Metal Processes and the Fine Ore Processes.
• In terms of evolving processes, the Tecnored Process (and in particular, the lower-operating cost process with integral co-generation of electrical power) was in the most favorable groupings at all scrap cost sensitivities.
• It should be noted also that the Conventional Blast Furnace process utilizing Non-Recovery coke (from a continuous coking process with integral co-generation of electrical power) also showed favorable Relative Economics for the low and median Scrap Cost sensitivities.
• The lower-cost, more efficient MauMee briquetted feed Rotary Hearth Process under initial commercialization also was grouped in the most favorable groups (for median and high scrap cost sensitivities).
Those processes with lower-cost raw materials (i.e., fine ore and/or non-metallurgical coal as the reductant) had favorable combined economics. In addition, the hot metal processes (in part due to the sensible heat impacts in the EAF and due to their inherently lower costs) also had favorable combined economics.
As a group, the processes with the Hot Metal processes had lower Total Cumulative Electrical Power Consumption, lower Process Emissions, and lower Total Emissions (including Electrical Power generation). These were reflected also in the Ranking Sums. The exception was the Shaft Furnace DRI process (Midrex) that was in the lower group for the environmental variables.
\\Da0002\01052901\common\DOE REPORT OCT 2000\Section 5.doc Page 18 of 18