Global assessment of biomass suitability for ironmaking ... · Biomass steelmaking Blast furnace...
17
Contents lists available at ScienceDirect Sustainable Energy Technologies and Assessments journal homepage: www.elsevier.com/locate/seta Original article Global assessment of biomass suitability for ironmaking – Opportunities for co-location of sustainable biomass, iron and steel production and supportive policies Hana Mandova a,b , William F. Gale a,c, ⁎ , Alan Williams a , Andrew L. Heyes d , Peter Hodgson e , Kamal H. Miah f a School of Chemical and Process Engineering (SCAPE), University of Leeds, Leeds LS2 9JT, UK b Centre for Doctoral Training in Bioenergy, University of Leeds, Leeds LS2 9JT, UK c Centre for Integrated Energy Research, University of Leeds, Leeds LS2 9JT, UK d Department of Mechanical and Aerospace Engineering, University of Strathclyde, Glasgow G1 1XQ, UK e Tata Steel, Swinden Technology Centre, Moorgate, Rotherham S60 3AR, UK f Department of Materials Science and Engineering, University of Sheffield, Sheffield S10 2TN, UK ARTICLE INFO Keywords: Bioenergy suitability Biomass steelmaking Blast furnace ironmaking Multi-criteria analysis Industrial decarbonization ABSTRACT Iron and steel production processes are amongst the biggest industrial contributors to the global carbon emis- sions, and national as well as international obligations are set to drive their significant emission reductions. One of the possible strategies is to partially substitute fossil fuels used during the iron ore reduction process by sustainably-sourced biomass. The extent of the opportunities for such fuel switching, however, varies for each country. Theoretically, biomass into ironmaking should be only supported for countries which present co-lo- cation of sustainably domestically sourced biomass in sufficient quantity, a substantial iron and steel industry and supportive national policies. Using a multi-criteria global suitability assessment approach developed in this research, the status of coun- tries’ steel industry, sustainable biomass resources and supportive policies were examined for top 40 steel production countries via the blast furnace ironmaking route. The results highlight those countries with sig- nificant potential to use domestically sourced biomass for such application and advance the efficient use of the limited biomass resources from the global perspective. Specifically countries such as Canada, Sweden, China, USA and France were identified as the most suitable, but other countries present opportunities that could be overcome if the corresponding barriers are identified. Introduction The iron and steel sector is the largest industrial CO 2 emitter, con- tributing to nearly 7% of the total global industrial greenhouse gas emissions [1] and requiring on average of 800 kg of coal for every metric ton of crude steel [2]. Due to the importance of steel’s numerous applications in economic development and in low carbon technologies, increasing demand for steel products has been forecasted until at least 2050 [3]. Therefore to limit global warming below 2 °C, it is estimated the sector must lower the CO 2 emissions relative to those in 2011 by 13% by 2025 [4]. Application of sustainably sourced biomass has been identified as an effective short term CO 2 mitigation strategy for ir- onmaking [5]. Materials for iron and steel production, such as iron ore, limestone and metallurgical coal/coke are globally traded, hence so can be biomass for use in ironmaking. However, fuel switching for those geographic locations that have a sufficient amount of nationally pro- duced biomass can additionally: • reduce emissions by eliminating those occurring from very long distance bulk transport of the fossil fuels – for example, Borjesson and Gustavsson [6] estimated that sourcing biomass regionally could emit over 70% less of CO 2 emissions than importing coal; • benefit the local economy – looking at Brazil for example, one can see that support for local agriculture can be a very significant po- litical driver for biomass utilization [7]; • provide the steel industry with a better opportunity to control the sustainability of biomass sourcing – keep the regulation of the sus- tainability of biomass supply and use within the same government. https://doi.org/10.1016/j.seta.2018.03.001 Received 5 May 2017; Received in revised form 17 October 2017; Accepted 6 March 2018 ⁎ Corresponding author at: School of Chemical and Process Engineering (SCAPE), University of Leeds, Leeds LS2 9JT, UK. E-mail address: [email protected] (W.F. Gale). Sustainable Energy Technologies and Assessments 27 (2018) 23–39 2213-1388/ © 2018 The Authors. Published by Elsevier Ltd. This is an open access article under the CC BY license (http://creativecommons.org/licenses/BY/4.0/). T
Transcript of Global assessment of biomass suitability for ironmaking ... · Biomass steelmaking Blast furnace...
Contents lists available at ScienceDirect
Sustainable Energy Technologies and Assessments
journal homepage: www.elsevier.com/locate/seta
Original article
Global assessment of biomass suitability for ironmaking – Opportunities forco-location of sustainable biomass, iron and steel production and supportivepolicies
Hana Mandovaa,b, William F. Galea,c,⁎, Alan Williamsa, Andrew L. Heyesd, Peter Hodgsone,Kamal H. Miahf
a School of Chemical and Process Engineering (SCAPE), University of Leeds, Leeds LS2 9JT, UKb Centre for Doctoral Training in Bioenergy, University of Leeds, Leeds LS2 9JT, UKc Centre for Integrated Energy Research, University of Leeds, Leeds LS2 9JT, UKd Department of Mechanical and Aerospace Engineering, University of Strathclyde, Glasgow G1 1XQ, UKe Tata Steel, Swinden Technology Centre, Moorgate, Rotherham S60 3AR, UKfDepartment of Materials Science and Engineering, University of Sheffield, Sheffield S10 2TN, UK
A R T I C L E I N F O
Keywords:Bioenergy suitabilityBiomass steelmakingBlast furnace ironmakingMulti-criteria analysisIndustrial decarbonization
A B S T R A C T
Iron and steel production processes are amongst the biggest industrial contributors to the global carbon emis-sions, and national as well as international obligations are set to drive their significant emission reductions. Oneof the possible strategies is to partially substitute fossil fuels used during the iron ore reduction process bysustainably-sourced biomass. The extent of the opportunities for such fuel switching, however, varies for eachcountry. Theoretically, biomass into ironmaking should be only supported for countries which present co-lo-cation of sustainably domestically sourced biomass in sufficient quantity, a substantial iron and steel industryand supportive national policies.
Using a multi-criteria global suitability assessment approach developed in this research, the status of coun-tries’ steel industry, sustainable biomass resources and supportive policies were examined for top 40 steelproduction countries via the blast furnace ironmaking route. The results highlight those countries with sig-nificant potential to use domestically sourced biomass for such application and advance the efficient use of thelimited biomass resources from the global perspective. Specifically countries such as Canada, Sweden, China,USA and France were identified as the most suitable, but other countries present opportunities that could beovercome if the corresponding barriers are identified.
Introduction
The iron and steel sector is the largest industrial CO2 emitter, con-tributing to nearly 7% of the total global industrial greenhouse gasemissions [1] and requiring on average of 800 kg of coal for everymetric ton of crude steel [2]. Due to the importance of steel’s numerousapplications in economic development and in low carbon technologies,increasing demand for steel products has been forecasted until at least2050 [3]. Therefore to limit global warming below 2 °C, it is estimatedthe sector must lower the CO2 emissions relative to those in 2011 by13% by 2025 [4]. Application of sustainably sourced biomass has beenidentified as an effective short term CO2 mitigation strategy for ir-onmaking [5]. Materials for iron and steel production, such as iron ore,limestone and metallurgical coal/coke are globally traded, hence so can
be biomass for use in ironmaking. However, fuel switching for thosegeographic locations that have a sufficient amount of nationally pro-duced biomass can additionally:
• reduce emissions by eliminating those occurring from very longdistance bulk transport of the fossil fuels – for example, Borjessonand Gustavsson [6] estimated that sourcing biomass regionallycould emit over 70% less of CO2 emissions than importing coal;
• benefit the local economy – looking at Brazil for example, one cansee that support for local agriculture can be a very significant po-litical driver for biomass utilization [7];
• provide the steel industry with a better opportunity to control thesustainability of biomass sourcing – keep the regulation of the sus-tainability of biomass supply and use within the same government.
https://doi.org/10.1016/j.seta.2018.03.001Received 5 May 2017; Received in revised form 17 October 2017; Accepted 6 March 2018
⁎ Corresponding author at: School of Chemical and Process Engineering (SCAPE), University of Leeds, Leeds LS2 9JT, UK.E-mail address: [email protected] (W.F. Gale).
Sustainable Energy Technologies and Assessments 27 (2018) 23–39
2213-1388/ © 2018 The Authors. Published by Elsevier Ltd. This is an open access article under the CC BY license (http://creativecommons.org/licenses/BY/4.0/).
T
The objective of the work is hence to identify which countries havethe potential to use domestic biomass resources for emission reductionpurposes in their iron and steel industry.
The importance of emission reduction within the iron and steelsector is acknowledged by the industry, but its low profitability [8], thecurrent economic uncertainty, oversupply of steel on the market to-gether with maintaining competitive advantage limit any low carbontechnological investments in this sector [9]. As biomass production isdifferent to fossil fuels, biomass could reduce the industry’s issues re-lated to the fluctuation of the fossil fuel prices, as well as overcomeconcerns related to fuel security and diversity - as long as an efficientutilization of the limited biomass resources is reached and biomass issustainably sourced. Sustainable sourcing in this work is defined as abiomass supply chain that preserves or enhances the role of biomass inthe already existing ecosystem. Therefore, to be treated as suitable inthe present work, policies incentivizing biomass use for ironmakingapplications should not only include the appropriateness of biomass forthe given country [10] but also cover strategies for its sustainablesourcing.
Multiple review papers recently published on biomass utilizationwithin iron and steel plants [11–13] indicate a rising interest in suchapplication from both academia and industry. The greatest potential foron-site biomass integration is for the integrated blast furnace-basicoxygen furnace (BF-BOF) route [14], which provides 73% of the world’ssteel [15]. Here, biomass can partially substitute for fossil fuels at thecoke making stage [16], in the sintering process [17] or directly in theblast furnace [18]. The varied characteristics that different biomasstypes have, as well as the diverse upgrading technologies, providemultiple possibilities, but also complex constraints for its utilizationwithin the ironmaking process [19]. Mathieson et al. [14] estimatedthat biomass can overall reduce up to 58% of net CO2 emissions from acommon BF-BOF route. Such emission saving, however, can be onlyachieved when the utilized biomass is satisfying carbon neutrality, andit is required that the governments provide support and control to theprivate and third sector to achieve biomass adoption [20].
The uncertainty in the whole system viability of biomass use iscurrently a bigger drawback than the technical limitations of using suchfuel in the process [21]. The fuel cost and availability [22,23], andrising concerns about sustainability of biomass supply [24] greatly limitits further deployment. A study by Thrän et al. [25] identified that thebiomass potential greatly varies under different scenarios and for dif-ferent regions. Hence the overall question of where the use of bioenergyin the iron and steel making industry is actually suitable can only beanswered meaningfully in context. This is because the size of the steelindustry, nature and origin of biomass resources and policies all differbetween countries.
Knowledge on the regional fitness of bioenergy for iron and steelindustry also benefits both the steel industry and policy formulation, inthe latter case aiming at supporting long term sustainability of renew-able energy integration [26]. As an illustration of the different out-comes of general, versus country specific studies, a previous generalstudy on the electricity sector identified bioenergy as the least suitableamongst all renewables [27], but a different study stated that bioenergycan play an important role in more site-specific energy projects [26].Hence bioenergy application is not suitable for every application andacross all locations, and should be supported only after its suitability forthe specific location and application is assessed. Increasing confidencein such suitability is especially important at present, as currently theintegration of renewable fuels into ironmaking is not attractive for in-vestors and requires substantial support and co-operation from policymakers to promote it [28].
Location suitability studies have been done primarily on electricitygeneration from renewables, such as wind [29,30] and solar [31],which demonstrated the different suitability of renewables for differentlocations on national as well as international level. However, there is agap in literature for bioenergy and particularly its application into
industries such as iron and steel. Wang et al. [32] and Suopajärvi andFabritius [33] analyzed the possibility of biomass use for iron making inSweden and Finland, respectively, but those countries correspond to-gether to less than 1% of the total global crude steel production via BF-BOF [15]. The gap leaves decision makers in steel producing countriesacross the world with the strategic decision of whether the adoption ofbioenergy in the industry is actually a suitable strategy for its dec-arbonization. The present study was done to bridge the gap and revealhow opportunities or barriers differ between countries and ensuresustainable use of biomass.
The overall aim of this work is to identify and down select countrieswhich are potentially suitable for integrating bioenergy into their ironand steel making processes via the BF-BOF route. Specifically, the studycovers bioenergy possibilities within coke oven, sinter plant as well asblast furnace (for top charging as well as pulverized coal injection). Thespecific objectives are:
• to develop a Global Suitability Index, an assessment framework thatuses steel production, bioenergy and policy factors for each countryto provide a quantitative measure of suitability for domesticallysourced biomass use in blast furnace ironmaking; and
• to provide an informed judgment for which countries domesticallysourced bioenergy in blast furnace ironmaking should be furtherconsidered.
Defining the suitability of countries convincingly requires in depthanalysis, such as detailed techno-economic and life cycle assessment[34], which implies a significant investment of time and effort. Thecurrent work is the initial step before such analyses are performed. Assuch, it avoids expending effort on detailed studies of unsuitable loca-tions, but also allows the policy community to evaluate countries whichwould not be considered otherwise.
Previously, there have been various efforts to develop indices thatidentify and/or rank entities by their fitness as a function of purpose orcontext. Some key examples of these are the:
• Habitat Suitability Index [35], the approach popular for ecosystemassessment studies;
• World Trilemma Index [36] for comparison countries based on theirability to provide sustainable energy policies; and
• Land Suitability Index [37] evaluating the land suitability for thedefined use.
Adaption of each of these indices, in isolation, would be able toindicate the fitness of deployment of bioenergy in iron and steelmakingacross the world, but only from a single perspective. Instead, to providea holistic picture, it is necessary to integrate these into a single indexthat captures the key top level factors as a function of geography. Themethodology used in the present paper for achieving this integration isto formulate a new multi-criteria global suitability assessment. Thework concentrates exclusively on the BF-BOF route, and there bioe-nergy opportunities specifically presented by the coke oven, sinter plantand blast furnace, to facilitate comparison of like with like. However,with suitable input data, the presented approach can be adapted toother routes to iron and steel production and a Global Suitability Indexmethodology could readily be modified to consider the insertion ofrenewables into other industries. A key focus of the work is to reducethe extent of subjectivity in assessing fitness for purpose, when com-pared with established methods [38], although this cannot be elimi-nated entirely.
The next Section “Methodology” describes the Global SuitabilityIndex, the methodology developed for this assessment study, followedby the obtained results. Section “Discussion” compares the outcomeswith the current practice and summarizes the model’s limitations andfuture improvements. The final Section presents the conclusions of thestudy.
H. Mandova et al. Sustainable Energy Technologies and Assessments 27 (2018) 23–39
24

Methodology
‘Global suitability’ is defined here as the disposition of a country foradapting alternative fuels in the studied sector, determined by com-paring countries. This section describes the algorithm used to assessglobal suitability.
Methodology development
In this paper, we have developed a Global Suitability Index which isan integrated approach for assessing fitness, taking into consideration acombination of variables of intended purpose (in the present case in-sertion of bioenergy into BF ironmaking). Most of the time, the as-sessment of suitability requires using corresponding standards and/oran expert judgement [38] on setting the threshold for the fitness levels.An innovative methodology has been created in the present work,which does not require such a step, as the thresholds are defined by thedata. This reduces the subjectivity aspects in the fitness assessmentanalysis and makes suitability assessments easier.
The methodology incorporates the relevant features of previousindices. In detail, the hierarchical approach of the Habitat SuitabilityIndex [35], where the variables are grouped into sub-indicators to re-flect the suitability of a specie in a given aspect, is followed to combinethe sub-indicators into the final index value. The required standardi-zation and transformation of the data were revised from the WorldEnergy Trilemma Index [36]. Categorization of the obtained values andmeaning of each level were adapted from the Land Suitability Index[37]. The summary of adapted features from each model is provided inFig. 1. To facilitate the end use, the proposed methodology for this workwas designed to be able to be reproduced without the need for anysophisticated software.
Global Suitability Index
To obtain the suitability value for each country, several of socio-economical, geographical, technical as well as political variables wereconsidered (Table 1). Those variables were grouped into three factors toprovide information on steel production status via BF-BOF route, sus-tainable biomass resources and governmental inclination for the use of
alternative fuels for each country. There are numerous variables thatcould (and ideally should) be included in the Global Suitability Index.However, there were various limitations on the variable selection, in-cluding:
• Limitations on the available data in literature – data available forsome relevant countries, but not others
• Data reliability – e.g. data that is anecdotal and/or lacking in vali-dation
• Data applicability – data was found only for specific steelworks andnot the country’s entire iron and steel industry
• Data compatibility – cases where it was not practicable to renderdata in a consistent form, e.g. the unit of assessment differed be-tween countries.
Table 1 is a list of all variables that the authors contemplated toinclude in the Global Suitability Index and summarizes the reasoningfor their inclusion/exclusion (for further detail, see Appendix A).
The final Global Suitability Index as well as its intermediate factorsare on a scale between 0 and 3, which is split into three categories toclassify each country’s suitability as either low (< 1), moderate (≥1and< 2) or high (≥2) in the studied aspect (explained in further detailin results section “Results”). The following subsections provide detailson the calculations, supported by graphical representation in Fig. 2.Due to page limits, the sections below present a methodological over-view and the full details of mathematical methodology may be found inthe supplementary material.
Calculation of the intermediate factorsFor the final Global Suitability Index, in total 15 variables (plus 1
sustainable forest policy variable) were evaluated and split into threefactors: steel production (SF ), bioenergy (BF ) and policy (PF ). In detail,the steel production factor synthesizes variables to assess country’spotential for the alloy’s long term production via the BF-BOF route. Thebioenergy factor, on the other hand, estimates the size of the bioenergyresources relative to the size of the steel production via the BF-BOFroute. The policy factor then reflects the country’s governmental in-centive, motivation and support for the use of alternative fuels, im-portant aspect for successful fuel switching. Information how variables
Fig. 1. Summary of features adapted by the Global Suitability Index from the three previous models. The main concept was adapted from the Habitat Suitability Index [35]. The datatransformation and handling performed in this study was customized from World Energy Trilemma Index [36] and Land Suitability Index [37].
H. Mandova et al. Sustainable Energy Technologies and Assessments 27 (2018) 23–39
25
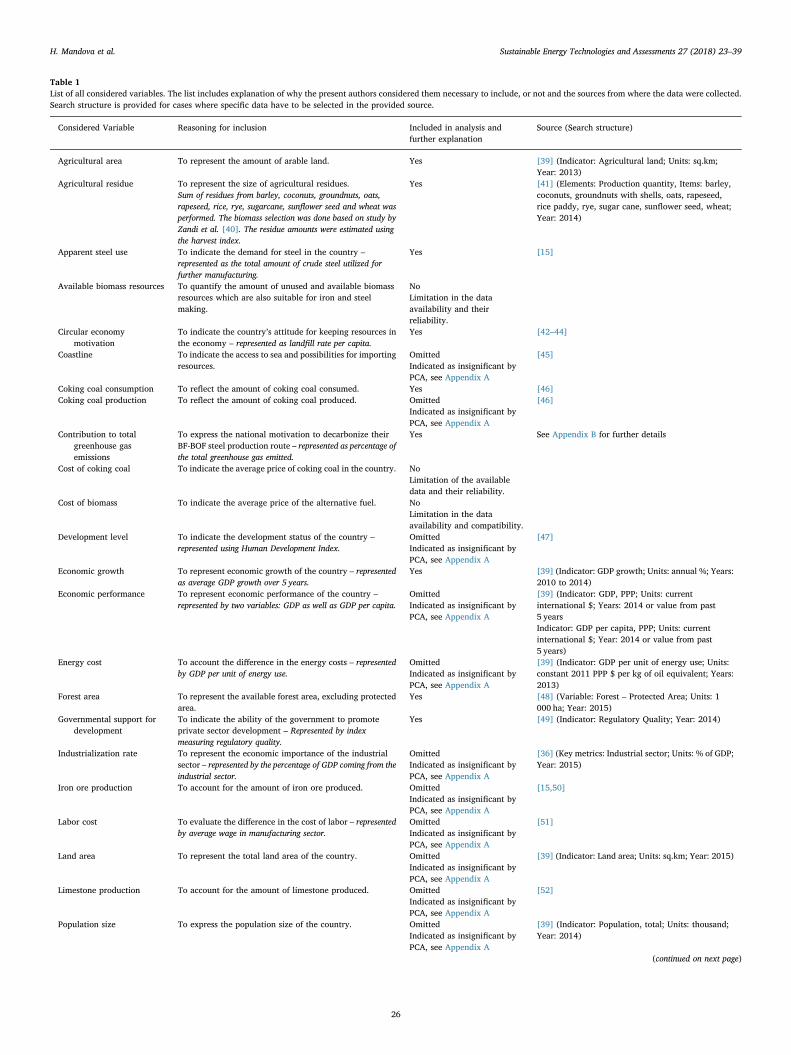
Table 1List of all considered variables. The list includes explanation of why the present authors considered them necessary to include, or not and the sources from where the data were collected.Search structure is provided for cases where specific data have to be selected in the provided source.
Considered Variable Reasoning for inclusion Included in analysis andfurther explanation
Source (Search structure)
Agricultural area To represent the amount of arable land. Yes [39] (Indicator: Agricultural land; Units: sq.km;Year: 2013)
Agricultural residue To represent the size of agricultural residues.Sum of residues from barley, coconuts, groundnuts, oats,rapeseed, rice, rye, sugarcane, sunflower seed and wheat wasperformed. The biomass selection was done based on study byZandi et al. [40]. The residue amounts were estimated usingthe harvest index.
Yes [41] (Elements: Production quantity, Items: barley,coconuts, groundnuts with shells, oats, rapeseed,rice paddy, rye, sugar cane, sunflower seed, wheat;Year: 2014)
Apparent steel use To indicate the demand for steel in the country –represented as the total amount of crude steel utilized forfurther manufacturing.
Yes [15]
Available biomass resources To quantify the amount of unused and available biomassresources which are also suitable for iron and steelmaking.
NoLimitation in the dataavailability and theirreliability.
Circular economymotivation
To indicate the country’s attitude for keeping resources inthe economy – represented as landfill rate per capita.
Yes [42–44]
Coastline To indicate the access to sea and possibilities for importingresources.
OmittedIndicated as insignificant byPCA, see Appendix A
[45]
Coking coal consumption To reflect the amount of coking coal consumed. Yes [46]Coking coal production To reflect the amount of coking coal produced. Omitted
Indicated as insignificant byPCA, see Appendix A
[46]
Contribution to totalgreenhouse gasemissions
To express the national motivation to decarbonize theirBF-BOF steel production route – represented as percentage ofthe total greenhouse gas emitted.
Yes See Appendix B for further details
Cost of coking coal To indicate the average price of coking coal in the country. NoLimitation of the availabledata and their reliability.
Cost of biomass To indicate the average price of the alternative fuel. NoLimitation in the dataavailability and compatibility.
Development level To indicate the development status of the country –represented using Human Development Index.
OmittedIndicated as insignificant byPCA, see Appendix A
[47]
Economic growth To represent economic growth of the country – representedas average GDP growth over 5 years.
Yes [39] (Indicator: GDP growth; Units: annual %; Years:2010 to 2014)
Economic performance To represent economic performance of the country –represented by two variables: GDP as well as GDP per capita.
OmittedIndicated as insignificant byPCA, see Appendix A
[39] (Indicator: GDP, PPP; Units: currentinternational $; Years: 2014 or value from past5 yearsIndicator: GDP per capita, PPP; Units: currentinternational $; Year: 2014 or value from past5 years)
Energy cost To account the difference in the energy costs – representedby GDP per unit of energy use.
OmittedIndicated as insignificant byPCA, see Appendix A
[39] (Indicator: GDP per unit of energy use; Units:constant 2011 PPP $ per kg of oil equivalent; Years:2013)
Forest area To represent the available forest area, excluding protectedarea.
Yes [48] (Variable: Forest – Protected Area; Units: 1000 ha; Year: 2015)
Governmental support fordevelopment
To indicate the ability of the government to promoteprivate sector development – Represented by indexmeasuring regulatory quality.
Yes [49] (Indicator: Regulatory Quality; Year: 2014)
Industrialization rate To represent the economic importance of the industrialsector – represented by the percentage of GDP coming from theindustrial sector.
OmittedIndicated as insignificant byPCA, see Appendix A
[36] (Key metrics: Industrial sector; Units: % of GDP;Year: 2015)
Iron ore production To account for the amount of iron ore produced. OmittedIndicated as insignificant byPCA, see Appendix A
[15,50]
Labor cost To evaluate the difference in the cost of labor – representedby average wage in manufacturing sector.
OmittedIndicated as insignificant byPCA, see Appendix A
[51]
Land area To represent the total land area of the country. OmittedIndicated as insignificant byPCA, see Appendix A
[39] (Indicator: Land area; Units: sq.km; Year: 2015)
Limestone production To account for the amount of limestone produced. OmittedIndicated as insignificant byPCA, see Appendix A
[52]
Population size To express the population size of the country. OmittedIndicated as insignificant byPCA, see Appendix A
[39] (Indicator: Population, total; Units: thousand;Year: 2014)
(continued on next page)
H. Mandova et al. Sustainable Energy Technologies and Assessments 27 (2018) 23–39
26
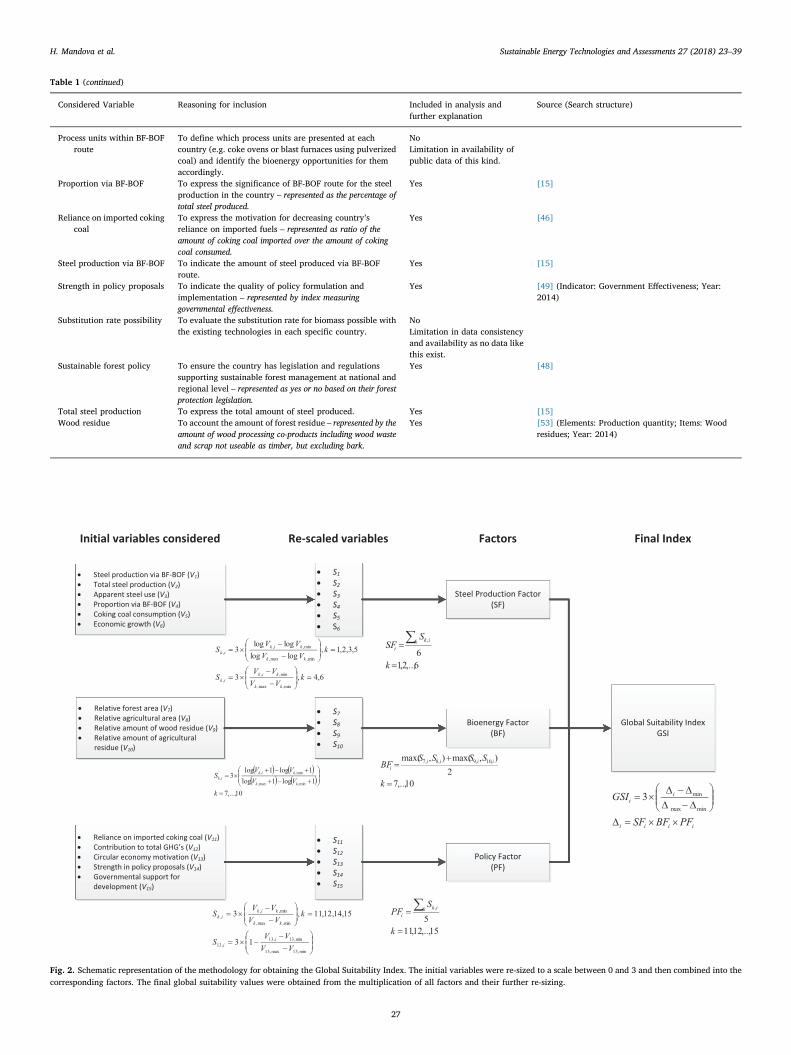
Table 1 (continued)
Considered Variable Reasoning for inclusion Included in analysis andfurther explanation
Source (Search structure)
Process units within BF-BOFroute
To define which process units are presented at eachcountry (e.g. coke ovens or blast furnaces using pulverizedcoal) and identify the bioenergy opportunities for themaccordingly.
NoLimitation in availability ofpublic data of this kind.
Proportion via BF-BOF To express the significance of BF-BOF route for the steelproduction in the country – represented as the percentage oftotal steel produced.
Yes [15]
Reliance on imported cokingcoal
To express the motivation for decreasing country’sreliance on imported fuels – represented as ratio of theamount of coking coal imported over the amount of cokingcoal consumed.
Yes [46]
Steel production via BF-BOF To indicate the amount of steel produced via BF-BOFroute.
Yes [15]
Strength in policy proposals To indicate the quality of policy formulation andimplementation – represented by index measuringgovernmental effectiveness.
Yes [49] (Indicator: Government Effectiveness; Year:2014)
Substitution rate possibility To evaluate the substitution rate for biomass possible withthe existing technologies in each specific country.
NoLimitation in data consistencyand availability as no data likethis exist.
Sustainable forest policy To ensure the country has legislation and regulationssupporting sustainable forest management at national andregional level – represented as yes or no based on their forestprotection legislation.
Yes [48]
Total steel production To express the total amount of steel produced. Yes [15]Wood residue To account the amount of forest residue – represented by the
amount of wood processing co-products including wood wasteand scrap not useable as timber, but excluding bark.
Yes [53] (Elements: Production quantity; Items: Woodresidues; Year: 2014)
Fig. 2. Schematic representation of the methodology for obtaining the Global Suitability Index. The initial variables were re-sized to a scale between 0 and 3 and then combined into thecorresponding factors. The final global suitability values were obtained from the multiplication of all factors and their further re-sizing.
H. Mandova et al. Sustainable Energy Technologies and Assessments 27 (2018) 23–39
27
Table2
List
ofva
riab
lesco
nsidered
fortheglob
alsuitab
ility
analysis
andtheirgrou
ping
into
thereleva
ntfactors.Th
etablepresen
tsva
riab
lena
mes,the
irco
rrespo
ndingsymbo
lsan
dinform
ationon
anyda
tamod
ification
performed
totheoriginal
data
colle
cted
.
Variableco
nsidered
Symbo
lCalcu
lation
sUnits
Year
SteelP
rodu
ctionFa
ctor
Steelprod
uction
viaBF
-BOF
V1
Non
ekt
2014
Totalsteelprod
uction
V2
Non
ekt
2014
App
aren
tsteeluse
V3
Non
ekt
2014
Prop
ortion
viaBF
-BOF
V4
Non
e%
2014
Cok
ingco
alco
nsum
ption
V5
Non
ekt
2015
Econ
omic
grow
thV6
Ave
rage
across
5ye
ars
%Be
tween20
10an
d20
14
Variableco
nsidered
Symbo
lCalcu
lation
sUnits
Year
BioenergyFa
ctor
Sustaina
bleforest
polic
yBina
ryva
riab
leye
s/no
2014
Relativeforest
area
V7
∗Su
stai
nabl
e fo
rest
pol
icy
Fore
st a
rea
Stee
l pro
duct
ion
via
BF-B
OF
ha/t
2015
2014
Relativeag
ricu
ltural
area
V8
Agr
icul
tura
l are
aSt
eel p
rodu
ctio
n vi
a BF
-BO
Fha
/t20
1320
14
Relativeam
ount
ofwoo
dresidu
eV9
Woo
d re
sidu
eSt
eel p
rodu
ctio
n vi
a BF
-BO
Fm
/t320
1420
14
Relativeam
ount
ofag
ricu
ltural
residu
eV10
Agr
icul
tura
l res
idue
Stee
l pro
duct
ion
via
BF-B
OF
t/kt
2014
2014
Variableco
nsidered
Symbo
lCalcu
lation
sUnits
Year
PolicyFa
ctor
Relianc
eon
impo
rted
coking
coal
V11
−C
okin
g co
al c
onsu
mpt
ion
Cok
ing
coal
pro
duct
ion
Cok
ing
coal
con
sum
ptio
n20
1520
15
Con
tributionto
totalGHG’s
V12
SeeApp
endixBforfurthe
rde
tails
%20
14Circu
larecon
omymotivation(see
Table1)
V13
Non
ekg
percapita
2014
Streng
thin
polic
yprop
osals
V14
Non
e20
14Gov
ernm
entalsupp
ortforde
velopm
ent
V15
Non
e20
14
H. Mandova et al. Sustainable Energy Technologies and Assessments 27 (2018) 23–39
28

listed in Table 1 were transformed and grouped into the factors de-scribed above is provided in Table 2.
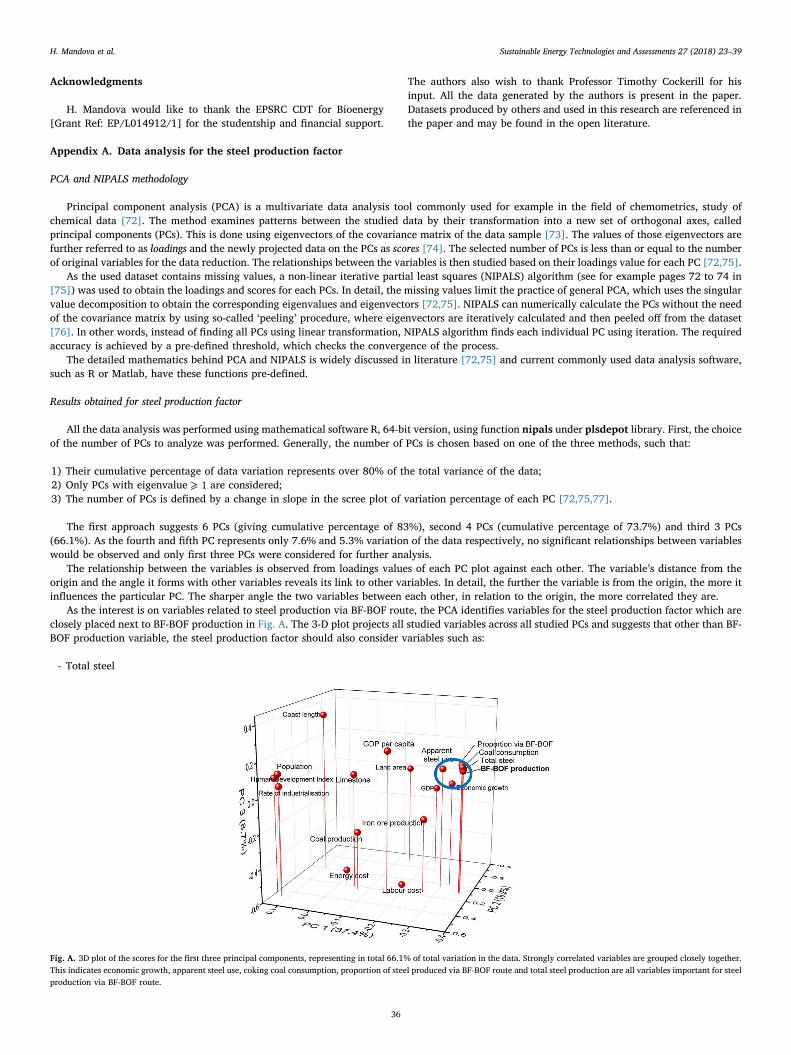
The associated variables for steel production factor were selectedusing a multivariate statistical tool, principal component analysis(PCA), which identified correlated variables to blast furnace route ir-onmaking and subsequent steel production. The issue of incompletedata was overcome by using nonlinear iterative partial least squares(NIPALS) algorithm. The details on the mathematics are provided inAppendix A. The choice of variables for bioenergy factor was to ensuresustainable sourcing of woody biomass. Therefore the forest areavariable V7 is omitted from analysis for those countries which do nothold forest protection legislation and sustainable forest policy.
The methodology puts each variable on a common scale by valuecomparison, to provide end users with robust and flexible evaluationwithout requiring them to have expert knowledge in any of the in-dividual variables. In further detail, the values for each variable arerescaled to values between 0 and 3, where 0 is given to the smallestvalue in the dataset and 3 to the largest. Intermediate values Sk i, foreach variable k are hence obtained using the following equation
⎜ ⎟= × ⎛⎝
−−
⎞⎠
SV V
V V3k i
k i k
k k,
, ,min
,max ,min (1)
Where Vk i, is the recorded value for variable k for country i, andVk,max and Vk,min are the corresponding maximum and minimum valuesrespectively.
The varying nature of the collected data requires modification of Eq.(1) for certain variables to retain their meaning, whilst still keepingthem on the same scale. For variables Vk with a high magnitude outlier(mainly for the steel production factor, due to China or India’s values),variables Vk were logarithmically transformed before the data re-scalingto decrease the impact of the outliers.
Variables Vk in bioenergy factor contained both high magnitudeoutliers as well as values smaller than one. To those, 1 has been addedto the observed values before the logarithmic transformation took placeto prevent taking logarithms of values smaller than 1. Variable V13,occurring in the policy factor, required to be reversed as its increasingvalues actually indicated lower fit. This was done by subtracting thevalues from 1.
The sub-indicators Sk for each factor were combined by addition andaveraged. The equal importance of each variable is assumed because
the information found in the literature was not sufficient to make a non-arbitrary consistent unequal weighting (although it would be easy forresearchers using this methodology in future to assign non-equalweightings if they wish). For the bioenergy factor, the supply of woodybiomass and agricultural residues was given equal weighting, to avoiddiscriminating between sources. Given that there is competition forbiomass resources in most countries, whichever of these two was thelarger supply was considered, rather than the sum of these or treatingthese individually. In view of the sustainability implications of the useof woody biomass, a country was only considered to have a supply ofthis, if either there is legislation on the sustainable use of forest pro-ducts or the supply concerned consists only of residue from other ap-plications of wood.
The authors are aware of the subjectivity implicit in any rankingsystem that uses weightings (equal or otherwise), but see this as un-avoidable in an initial down selection. Further details on the metho-dology are represented in Fig. 2 and can be found in the supplementarymaterial that accompanies this paper.
Calculation of the Global Suitability IndexThe Global Suitability Index assesses the suitability of introducing
bioenergy into a country’s steel sector by simultaneously assessing thepotential for steel production via BF-BOF route, relative bioenergy re-sources and governmental support. The three factors are combined viamultiplication = × ×SF BF PFΔi i i i, using the approach adopted in theLand Suitability Index, to score higher countries consistent across allthree factors above countries which are strong in one and weak in theother. Achieving the Global Suitability Index GSI( )i values split acrossthe levels from 0 (low) to 3 (high) was performed using Eq. (2):
⎜ ⎟= × ⎛⎝
−−
⎞⎠
GSI 3 Δ ΔΔ Δi
i min
max min (2)
where Δmin and Δmax are the minimum and maximum values achievedfrom multiplying together all factors.
Results
The final suitability value for using sustainably sourced bioenergyfor the iron and steel production via BF-BOF is a reflection of countries’relative performance across the three studied factors: steel production,
Fig. 3. Meaning of values for each factor and the final Global Suitability Index. The scale ranges between 0 and 3, where values up to 1 indicate low performance, between 1 and 2moderate performance, and above 2 outstanding performance of a country in the studied aspect.
H. Mandova et al. Sustainable Energy Technologies and Assessments 27 (2018) 23–39
29
bioenergy and policy. For each indicator, every country obtained ascore on continuous scale between 0 and 3. This scale was split intothree categories, to classify each country either as insignificant, averageor dominant first with respect to each factor and then with respect tothe global suitability. Detailed meaning of each category in relation tothe studied indicator is presented in Fig. 3. The classified results are
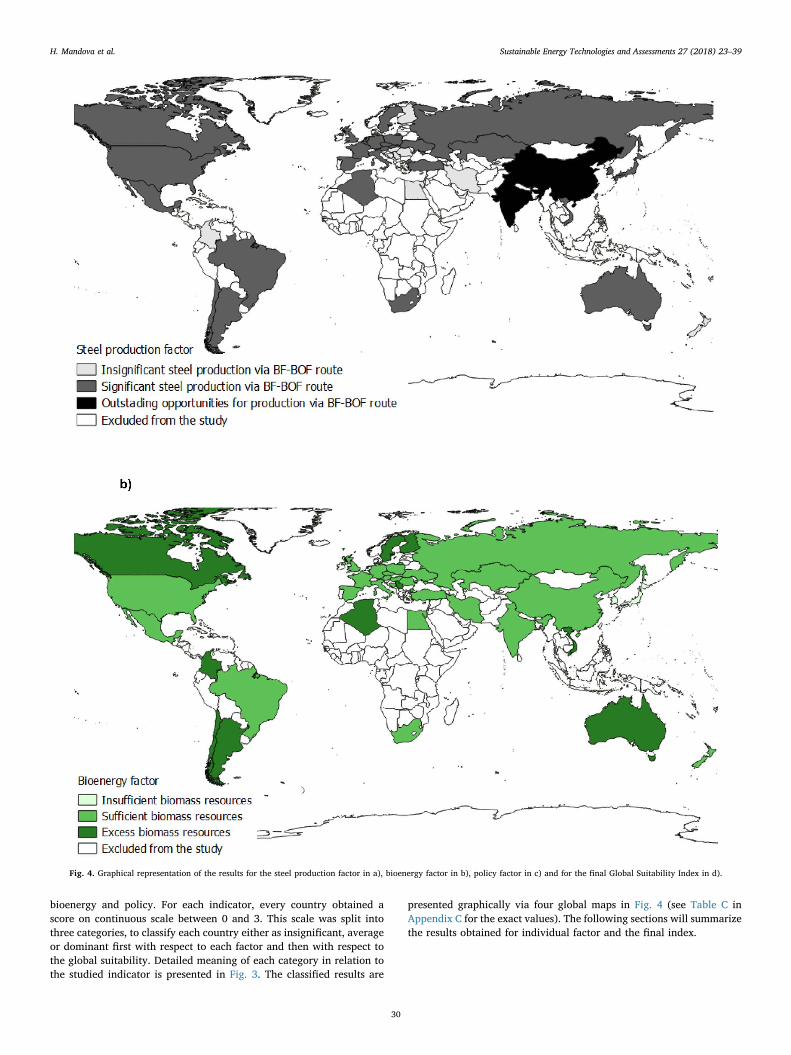
presented graphically via four global maps in Fig. 4 (see Table C inAppendix C for the exact values). The following sections will summarizethe results obtained for individual factor and the final index.
Fig. 4. Graphical representation of the results for the steel production factor in a), bioenergy factor in b), policy factor in c) and for the final Global Suitability Index in d).
H. Mandova et al. Sustainable Energy Technologies and Assessments 27 (2018) 23–39
30
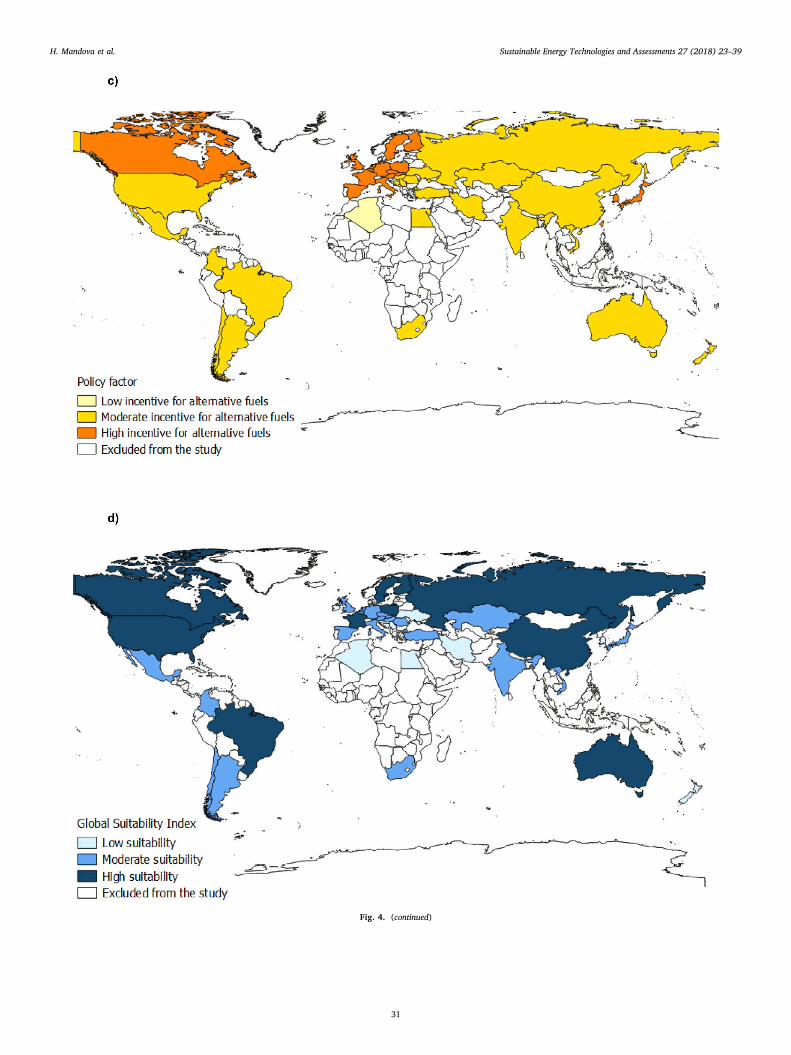
Fig. 4. (continued)
H. Mandova et al. Sustainable Energy Technologies and Assessments 27 (2018) 23–39
31
Steel production factor
The classification of the countries based on their significance interms of long term iron and steel production via BF-BOF route is pre-sented in Fig. 4a. Countries shaded black present outstanding oppor-tunities for iron and steel production by this route. Darker grey arecountries which steel production via BF-BOF route is still significant forthe global steel market and light grey are countries classified as insig-nificant, all done by relatively comparing countries under study.
Out of the total 40 countries studied, the steel production factorclassified 2 countries as world leading and 9 with steel production asinsignificant. China scored the highest in the factor, with a high leadbefore India, all classified as world leading and listed based on thegiven scores. Japan, Russia and South Korea, world second, third andfourth biggest producers of steel via BF-BOF route respectively [15], areclassified just below the class split and are shown as significant.Countries classified as insignificant for the world steel productionmarket are Hungary, Finland, Iran, Bosnia and Herzegovina, Colombia,Romania, Egypt, Serbia and New Zealand, listed in descending order.
Bioenergy factor
The amount of technically suitable and sustainably sourced biomassresources relative to the country’s amount of the steel production viaBF-BOF route is graphically represented in Fig. 4b. Comparable coun-tries with a relative excess amount of suitable biomass resources (⩾ 2)are colored dark green. Mint green are countries with a sufficientamount of suitable biomass for partial fossil fuel substitution (⩾ 1and<2), and countries with insufficient biomass resources are high-lighted light green.
The bioenergy factor selected 10 countries with surplus sustainablebiomass resources and identified 6 with insufficient biomass resources.Countries with score higher than or equal to 2 are Colombia, Australia,Chile, Canada, Argentina, Algeria, Serbia, Sweden, Vietnam andFinland, listed in descending order. There are in total twenty-fourcountries with potentially sufficient suitable and sustainable biomassresources (having values< 2 and ⩾ 1), where Kazakhstan, Romaniaand Brazil obtained scores just below the threshold for being classifiedin the higher category and United Kingdom, Czech Republic, Bosnia andHerzegovina, China, Ukraine and Germany were touching the thresholdfor lower category (see Table C in the appendix). Countries with scoresbelow 1 are Slovakia, Netherlands, Belgium, Japan, South Korea andTaiwan, also listed in descending order.
Policy factor
The governmental motivation for using the alternative fuels in ironand steel making via BF-BOF route is represented using the policyfactor, and the results are shown in Fig. 4c. Orange color representscountries for which it is expected that the government would and is ableto successfully support the use of alternative fuels. Governments forcountries colored yellow are expected to give moderate support andincentive. Lastly, light yellow shades indicate countries with expectedlimited support for the fuel switching.
In the policy factor, 17 countries were classified with highly sup-portive governments for the alternative fuels. In the top category, i.e.,with values above and including 2, were mainly European countriessuch as Sweden, Austria, Finland, Germany, Belgium, Netherlands,Slovakia, UK, France, Czech Republic, Spain, Italy and Poland. Japan,Taiwan, South Korea as well as Canada were also categorized with highgovernmental support. Algeria, on the other hand, was the only countrywith score on the other side of the scale with value less than 1, where alow or non-existing interest from government for the use of alternativefuels in the steel sector can be expected.
Dominant countries overall
The combined performance across all factors, expressed by theGlobal Suitability Index, is shown in the world map in Fig. 4d. Coun-tries colored dark blue are identified as countries with high suitabilityfor integrating bioenergy into their steel production via the BF-BOFroute. Turquois colored countries are countries with moderate suit-ability and light blue countries with low suitability for the use of thealternative fuels in the steel sector. The final global suitability valuesare also presented in Fig. 5, where countries are ordered in their as-cending values. Comparison of countries’ performances across all threefactors reveals the factors in which each specific country underperformsor over-performs, and enhances understanding about the potentialbarriers for deployment of sustainable bioenergy in the studied sector.
The Global Suitability Index identified 10 countries as highly sui-table for the bioenergy integration into iron and steel making. Top fiveare Canada, Sweden, China, the United States, France, listed in thedescending order. China scored the highest in the steel productionfactor, whereas Canada and the United States scored the highest in thebioenergy factor. For France and Sweden, on the other hand, the policyfactor was the most dominant. Other highly suitable countries areFinland, Australia, Poland, Brazil and Russia. However, a gap of 0.2 canbe observed between the last country in the top 5 (France) and the nextcountry (Finland).
Out of the 40 studied countries in total, 9 of them were identified asunsuitable. Those were Ukraine, Iran, Serbia, Egypt, New Zealand,Algeria, Bosnia and Herzegovina, South Korea and Taiwan. Eventhough some of them scored in the highest category in one of the ex-amined factors, e.g., Serbia (Bioenergy factor of 2.1), Algeria(Bioenergy factor of 2.2), South Korea (Policy factor of 2.57) or Taiwan(Policy factor of 2.5), their underperformance in other factors gavethem an overall Global Suitability Index value below 1.
Multiple countries presented a strong performance across a combi-nation of two factors, but greatly lacking the third factor. The Venndiagram in Fig. 6 demonstrates the opportunities as well barriers thateach country would be facing, based on which set they are included inor excluded from, respectively. Certain countries are also listed on theborders of a particular set (such as Brazil, Russia, China, etc.), whichdemonstrates they satisfy the studied factor with limitations. Bosnia-Herzegovina, New Zealand and Iran are placed outside the Venn dia-gram as their results demonstrated low significance (i.e., values belowmedian value) across all studied sets.
Discussion
Current bioenergy use in the steel sector and model credibility
Comparing the global suitability indices with national shares ofworld production of iron and steel using the BF-BOF route (Fig. 7), itcan be seen that several of major players in iron and steelmaking, i.e.China, Russia, USA and Brazil have high suitability for sustainablebioenergy use in BF-BOF. Combining their high suitability index, withtheir major role in world steel production, suggests that widespreaddeployment of bioenergy in these few countries would be a significantstep towards transitioning the global iron and steel industry to the useof renewables. On the other hand, the moderate suitability of Japan,India and Germany, and low suitability of South Korea, Ukraine andTaiwan indicate that major steelmaking countries can contain barrierswhich limit the deployment of bioenergy in the sector. Thereforechoosing where to introduce alternative fuels based purely on the sizeof the steel industry would be a deficient approach.
The authors attempted to compare the outcomes of the GlobalSuitability Index with:
• studies of the future potential of bioenergy in individual countries,as found in the literature;
H. Mandova et al. Sustainable Energy Technologies and Assessments 27 (2018) 23–39
32

• evidence of actual deployment of bioenergy in iron and steelmaking.
The availability of data for such validation were not sufficient todeliver a full validation of the Global Suitability Index approach butarguably, the lack of such data is the reason why a Global SuitabilityIndex is needed, as an initial ranking tool. Nonetheless, a number ofinteresting observations were made:
• Sweden, Finland, Australia and Brazil with a high Global SuitabilityIndex are either already using bioenergy in iron and steelmaking orhave done extensive research in the field.
Out of the listed countries, only Brazil has full scale industrialpractice of bioenergy in steelmaking, with a number of fully operationalcharcoal blast furnaces [54]. Brazil is the world’s largest wood-basedcharcoal producer, where most of it is used by the iron and steel sector[55]. Even with this successful practice, Brazil achieved a Global Suit-ability Index of just 2.0 putting it in the lower half of the high suitabilitycategory. This is due to a below average score in the policy factor, in-dicating potential barriers from the governmental side and a need forincreased attention to be paid to the sustainability of biomass usage,e.g. through managed forests.
The situation in Sweden, by contrast, is different. The very highpolicy factor and high bioenergy factor classify Sweden as one of themost suitable countries, even though biomass has not been commer-cially applied into iron and steelmaking yet. Multiple studies have fo-cused on this topic [56,57] and with the Fossil Free Sweden initiative tobecome first fossil-free wealthy nation [58], the very high global suit-ability value of 2.9 indicates high suitability and an excellent oppor-tunity.
Extensive research on bioenergy in iron and steel production hasbeen done also in Australia [59]. Australia’s high suitability value ismainly due to high bioenergy factor, corresponding to the potential ofunused wood residues [60]. However, in view of Australian’s extensivecoking coal resources [61] and costs of charcoal of US$386 per metricton, in comparison to coal of around US$90 per metric ton [62], bio-mass is not currently competitive with coal in BF-BOF applications. As aresult, companies considering biomass, such as Arrium, have put anyfurther research and development in this area on hold. Hence thesuitability value of 2.1 reflects the country’s major potential, but
Fig. 5. Comparison of the final Global Suitability Index values (top) and the sum of all three factors considered (bottom). Size of the individual bar represents the country’s opportunity orbarrier in the studied factor when compared with other countries.
Fig. 6. Venn diagram comparing opportunities and barriers that each studied country isfacing for blast furnace ironmaking. Countries within steel production set have iron andsteel industry that has been identified as significant on the global market, those withinbioenergy set as containing sufficiently large sustainably sourced biomass resources foriron making application, and countries with supporting national policies for adaptation ofalternative fuel uses have been enclosed in the policy set.
H. Mandova et al. Sustainable Energy Technologies and Assessments 27 (2018) 23–39
33

exploitation of this would require a desire to move away from coal.Finland’s suitability value of 2.1 indicates the potential, as discussed
in work by Suopajärvi [33,63]; however, its low significance on thesteel market (steel production factor of 0.9) makes it sit on thethreshold.
• In common with Sweden, the countries Canada, China, the USA andFrance also have very high Global Suitability Index, but unlikeSweden, these countries do not yet appear to be actively consideringthe opportunity.
The highest suitability index was that of Canada, which same asFrance scored above median value across all contributory factors.Canadian program run by the Canadian Steel Producers Associationshowed strong interest on the use of biomass in iron and steel making asa substitute for fossil fuels [28]. The contribution of only 0.6% to theglobal steel produced via BF-BOF route [15], however, might not have asufficient impact on the global bioenergy integration into this sector.
The opposite in terms of the global steel production is true forChina, which steel production factor of 3 significantly impacted its finalindex value. The low value of China’s bioenergy factor is due to its highsteel production and indicates the size of the resource in relative terms.In absolute terms China is a large producer of biomass and is alreadysupplying a large amount of charcoal to Japan and South Korea pro-ducing 10% of the global fuel wood in 2010 [64]. As China is targetingto have a 15 and 20% non-fossil fuel share of its total energy supply by
2020 and 2030 respectively [65], the Global Suitability Index indicateda potential opportunity for the use of bioenergy in iron and steel sectorin this country, with the important caveat that the biomass needs to besourced sustainably.
Large existing biomass resources are also in the USA. The USA hasthe potential to supply 15–20% of the total global biomass [66], and isexpected to see the largest annual growth in bioenergy use in industrybetween 2010 and 2030 [67]. However, charcoal prices would have tobe the lowest in the world so that it is competitive with coal [62]. Onthe other hand, a study specific for a plant in the North East of Franceshowed that the injection of charcoal fines at tuyeres can be profitablefor this plant [34], and the observed high Global Suitability Index valuein this study encourages to perform further research into bioenergyintegration within iron and steel industry for this region.
• Argentina have chosen to deploy bioenergy in iron and steelmaking,although its Global Suitability Index is moderate.
Argentina has two charcoal fired blast furnaces in the northwest ofthe country, where plantations of eucalyptuses are specially grownmainly for this purpose [68]. The medium performance in the finalsuitability index is mostly due to the steel production and policy factors.The high bioenergy factor highlight the bioenergy potential, howeverthe other factors show the low significance of Argentina’s steel pro-duction and potential issues with low governmental support and con-cerns about sustainable biomass sourcing. We stress that this refers only
Fig. 7. The suitability values for biomass integration into iron and steel making based on the country’s share in the global crude steel production via BF-BOF route in 2014. Based on datafrom World Steel Association [15].
H. Mandova et al. Sustainable Energy Technologies and Assessments 27 (2018) 23–39
34
to BF-BOF and differs from the stance that Argentina is demonstrating,for electricity production, through their Renewables program, wherethey want to reach 20% of their electricity production from renewablesby 2025 [69].
• Belgium and Netherlands have successfully deployed bioenergy on asignificant scale in cement industry, another carbon intensive in-dustry, however their suitability index for bioenergy in the steelindustry is close to 1.0 (i.e., sitting at the limited suitabilitythreshold).
The successful deployment of bioenergy in other industries suggeststhat it should be relatively easy for them to expand their current effortsinto iron and steelmaking [70]. However, the Global Suitability Index ispointing out the limitation in biomass availability for the two countriesby scoring 0.9 in the bioenergy factor. Indeed, biomass is imported andbiomass availability is already considered as a barrier for it furtherimplementation [71]. Hence the identified low suitability of bioenergyfor iron and steel sector for this country is rational when aiming atpromoting the use of local resources.
• Several countries scored particularly high in bioenergy and policyfactors, however, their Global Suitability Index value was thengreatly reduced due to their low steel production factor. This revealsbiomass opportunities for different sectors within the country or forbiomass trade deals between countries.
If only policy and bioenergy factors were considered, Colombia,Chile, Canada, Finland and Sweden would be amongst the top 5 mostsuitable countries, (Fig. 5). This indicates these countries have un-tapped sustainable biomass resource potential and that further focus oneffectively utilizing it might be worthwhile – not only for the iron andsteel industry.
Limitations and potential for further improvements
The bioenergy factor used in this paper accounts only for the totalamount of biomass resources that are potentially suitable for use inironmaking and can be sustainably sourced. Thus the Global SuitabilityIndex does not consider competition for the resources from other sec-tors. This limitation of the work should be recognized when a selectedcountry is chosen for possible bioenergy deployment. Further analysisof total available biomass resources – specifically identifying their typeas well as upgrading possibilities – and projected demand from otherindustries should be performed to accurately identify their true extent.Additionally, life cycle assessment studies should be performed toachieve the greatest environmental benefit. This was out of the scope ofthis work as its purpose is developing a tool for initial screening ofsuitable country based on potential, when compared with other coun-tries.
The lack of publicly available data on the ironmaking process unitsin each country limited more accurate definition of possibilities forbioenergy integration into this industry. Different biomass types andlater their upgrading process allow fossil fuel substitution at differentamounts at each unit. The choice of the biomass type, upgrading pro-cess and the unit in which the bio-based product will be utilized thenimpacts feasibility of the solution. As each country is specific in pro-ducing different types of bio-based fuels and in characteristics of itsironmaking process units, the combination of these two factors influ-ences greatly the overall suitability of each country. This work treatedthis simplification as inevitable, however, scope for improvement ispresent.
The proposed methodology also treated each of the factors: steelproduction, bioenergy and policy, with the same importance, and re-sults might differ where the weightings are otherwise. Therefore asensitivity analysis should be performed to see the impact of each
factor. This is considered as future work together with scenario mod-elling. Such work will further reveal which factor is crucial for in-tegrating bioenergy into steel production sector.
Lastly, this methodology has not considered the economical aspects.The financial struggles of the iron and steel plants, recent decrease inproduction and shut downs of major players make the use of biomassunappealing if it is not profitable. Work done by Feliciano-Bruzual [62]identified the price required for charcoal to be competitive with coal,however only for nine countries. The authors are aware of the highimportance of the fuel price on the suitability aspect, which is not onlyaffected by the biomass type but also varies over the year based on itsavailability. The limited data in the literature made it difficult to obtainconsistent information on the specific biomass prices for all the coun-tries under study (where the prices also vary based on the location ofthe specific plant considered for the biomass utilization), therefore thecost variable was omitted from the present analysis. However, a moredetailed economic analysis is planned, wherein a suitable country orcountries will be selected based on the current work.
Conclusion
The paper presented a methodology, the Global Suitability Index,for selection of countries which are offering the greatest potential foradoption of domestically and sustainably sourced biomass in their na-tional primary blast furnace ironmaking. Apart from the reduction ofprocess emissions, using nationally sourced biomass would also elim-inate emissions from bulk transport of the substituted fossil fuels, en-sure sustainable biomass sourcing and benefit local economy. Henceeven though biomass can be globally traded, the same as other rawmaterials required for the iron making process, identifying the co-lo-cation of iron and steel production, sustainable biomass resources andsupportive policies for using alternative fuels has been considered inthis study as the most effective way for adaptation of the alternativefuel. The Global Suitability Index developed thus consists of three fac-tors, labelled as steel production, bioenergy and policy respectively.The study particularly focused on the top 40 countries by volume forblast furnace ironmaking and their suitability level was defined by theircomparison.
Countries with the greatest opportunities to utilize biomass in thisway were Canada, Sweden, China, USA and France. For all thesecountries, significant steel production via BF-BOF route and sustainablebiomass resources were present, and they also scored high in the policyfactor. It can be conclude that their current policy frameworks have atleast the potential to promote alternative fuels in the sector and that itmight be worthwhile for policy makers in these countries to considerthe opportunity in more depth. At the same time, from the energymanagement point of view, the utilization of biomass resources for suchapplication in those countries would be a strategic step for the dec-arbonization of their steel industry. Highly suitable were also Finland,Australia, Poland, Brazil and Russia, however potential barriers havebeen identified. In detail, Finland and Australia underperformed in thesteel production factor, indicating low importance of their BF-BOFroutes on the global market, which makes it less attractive from theglobal emission reduction point of view. Brazil and Russia under-performed in the policy factor, but are strong in the other two factors.This suggests that one of key barriers for success in these countries is alack of sufficient governmental policy support, which could be ad-dressable.
Overall, whilst we have only developed a methodology for an initialdown selection, the results indicate where bioenergy in iron and steelmaking has a promising prospect, and further evaluation should beconsidered. This would include evaluation of available resources, cost-analysis and techno-economics which would further examine the po-tential for such application, and shape policies supporting its im-plementation.
H. Mandova et al. Sustainable Energy Technologies and Assessments 27 (2018) 23–39
35
Acknowledgments
H. Mandova would like to thank the EPSRC CDT for Bioenergy[Grant Ref: EP/L014912/1] for the studentship and financial support.
The authors also wish to thank Professor Timothy Cockerill for hisinput. All the data generated by the authors is present in the paper.Datasets produced by others and used in this research are referenced inthe paper and may be found in the open literature.
Appendix A. Data analysis for the steel production factor
PCA and NIPALS methodology
Principal component analysis (PCA) is a multivariate data analysis tool commonly used for example in the field of chemometrics, study ofchemical data [72]. The method examines patterns between the studied data by their transformation into a new set of orthogonal axes, calledprincipal components (PCs). This is done using eigenvectors of the covariance matrix of the data sample [73]. The values of those eigenvectors arefurther referred to as loadings and the newly projected data on the PCs as scores [74]. The selected number of PCs is less than or equal to the numberof original variables for the data reduction. The relationships between the variables is then studied based on their loadings value for each PC [72,75].
As the used dataset contains missing values, a non-linear iterative partial least squares (NIPALS) algorithm (see for example pages 72 to 74 in[75]) was used to obtain the loadings and scores for each PCs. In detail, the missing values limit the practice of general PCA, which uses the singularvalue decomposition to obtain the corresponding eigenvalues and eigenvectors [72,75]. NIPALS can numerically calculate the PCs without the needof the covariance matrix by using so-called ‘peeling’ procedure, where eigenvectors are iteratively calculated and then peeled off from the dataset[76]. In other words, instead of finding all PCs using linear transformation, NIPALS algorithm finds each individual PC using iteration. The requiredaccuracy is achieved by a pre-defined threshold, which checks the convergence of the process.
The detailed mathematics behind PCA and NIPALS is widely discussed in literature [72,75] and current commonly used data analysis software,such as R or Matlab, have these functions pre-defined.
Results obtained for steel production factor
All the data analysis was performed using mathematical software R, 64-bit version, using function nipals under plsdepot library. First, the choiceof the number of PCs to analyze was performed. Generally, the number of PCs is chosen based on one of the three methods, such that:
1) Their cumulative percentage of data variation represents over 80% of the total variance of the data;2) Only PCs with eigenvalue ⩾ 1 are considered;3) The number of PCs is defined by a change in slope in the scree plot of variation percentage of each PC [72,75,77].
The first approach suggests 6 PCs (giving cumulative percentage of 83%), second 4 PCs (cumulative percentage of 73.7%) and third 3 PCs(66.1%). As the fourth and fifth PC represents only 7.6% and 5.3% variation of the data respectively, no significant relationships between variableswould be observed and only first three PCs were considered for further analysis.
The relationship between the variables is observed from loadings values of each PC plot against each other. The variable’s distance from theorigin and the angle it forms with other variables reveals its link to other variables. In detail, the further the variable is from the origin, the more itinfluences the particular PC. The sharper angle the two variables between each other, in relation to the origin, the more correlated they are.
As the interest is on variables related to steel production via BF-BOF route, the PCA identifies variables for the steel production factor which areclosely placed next to BF-BOF production in Fig. A. The 3-D plot projects all studied variables across all studied PCs and suggests that other than BF-BOF production variable, the steel production factor should also consider variables such as:
- Total steel
Fig. A. 3D plot of the scores for the first three principal components, representing in total 66.1% of total variation in the data. Strongly correlated variables are grouped closely together.This indicates economic growth, apparent steel use, coking coal consumption, proportion of steel produced via BF-BOF route and total steel production are all variables important for steelproduction via BF-BOF route.
H. Mandova et al. Sustainable Energy Technologies and Assessments 27 (2018) 23–39
36
- Coal consumption- Apparent steel use- Proportion of steel produced via BF-BOF route- Economic growth
The results also revealed interesting information about low impact of population size and rate of industrialization on the steel production, asthose variables were on the other side of the graph. Further analysis and discussion on which factors make countries successful candidates for steelproduction is not within the scope of this paper, because of the focus on initial down-selection.
Appendix B. Further calculation details
Due to the limitation in the available data, the following assumptions and corresponding calculations were performed to obtain the contributionof BF-BOF steelmaking route to country’s total greenhouse gas emission (GHG’s):
• The crude steel production data via BF-BOF route was obtained from World Steel Association [15] (obtained directly or converted to metric ton).
• Secondary data for the GHG’s occurring during the iron and steel production was obtained from Gabi Database [78], focusing on Life CycleInventories. From here, the emission intensity of German based BF-BOF route of 1.94 tCO2eq per metric ton of crude steel was obtained.Assumption was made to use this emission intensity value to calculate the emission intensity of the iron and steel production in other countries.This is likely to underestimate GHG’s production for those countries whose iron and steel production processes are less modern than Germany’s,but this was unavoidable as iron and steelmaking GHG’s data was not available for many of the countries studied.
• The estimated GHG’s amount was then a product of the amount of steel produced via the BF-BOF route within each country and the specifiedemission intensity.
• Total GHG’s produced by each country was obtained from World Resources Institute [79] (in MtCO2eq).
• The percentage contribution of the BF-BOF steel production to the country’s total GHG’s was then the quotient of country’s emissions from the BF-BOF steel production and total GHG’s.
Appendix C. Detailed results
Table C presents results obtained for each factor and the final GSI values. The results are rounded to 1 decimal place and the scores categorized in
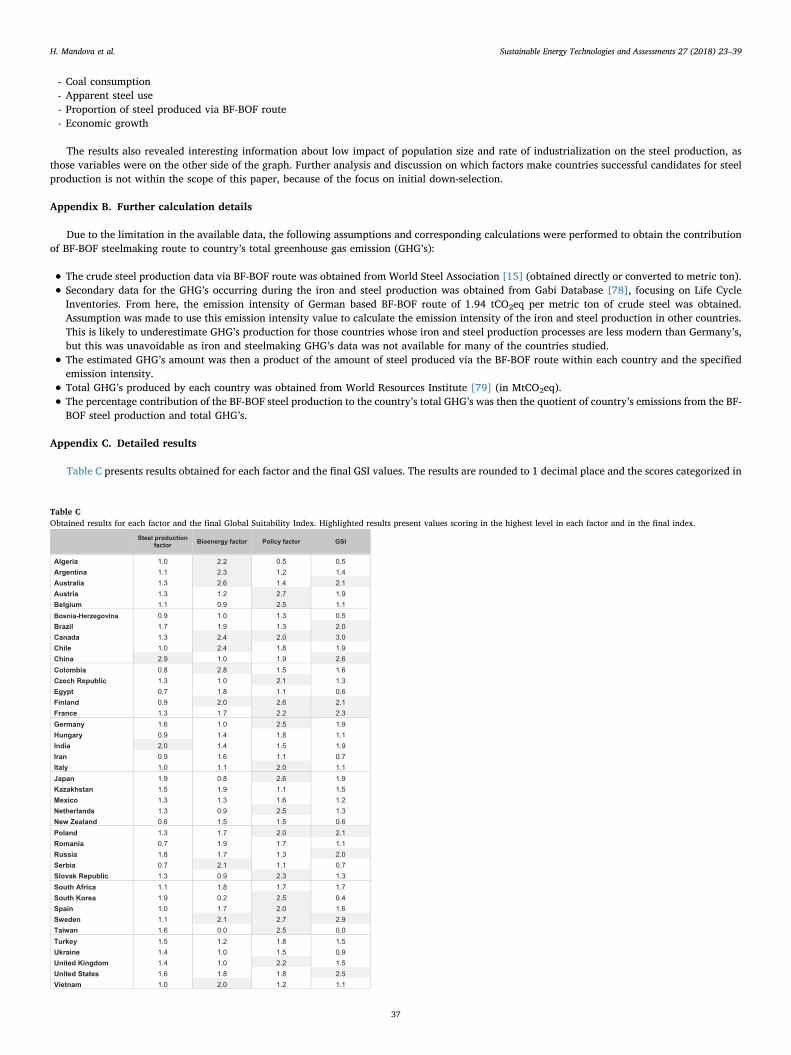
Table CObtained results for each factor and the final Global Suitability Index. Highlighted results present values scoring in the highest level in each factor and in the final index.
H. Mandova et al. Sustainable Energy Technologies and Assessments 27 (2018) 23–39
37
the highest level of each factor.
Appendix D. Supplementary data
Supplementary data associated with this article can be found, in the online version, at http://dx.doi.org/10.1016/j.seta.2018.03.001.
References
[1] World Steel Association. Steel’s contribution to a low carbon future and climateresilient societies; 2017.
[2] World Steel Association. Fact sheet – steel and raw materials; 2014.[3] Hatayama H, Daigo I, Matsuno Y, Adachi Y. Outlook of the world steel cycle based
on the stock and flow dynamics. Environ Sci Technol 2010;44:6457–63. http://dx.doi.org/10.1021/es100044n.
[4] IEA. Tracking Clean Energy Progress 2014. Paris; 2014.[5] Hanrot F, Sert D, Babich A, Pietruck R, Fernandez-Lopez M, Diez MA, et al. Short
term CO2 mitigation for steelmaking (SHOCOM). Luxembourg; 2011.[6] Börjesson P, Gustavsson L. Regional production and utilization of biomass in
Sweden. Energy 1996;21:747–64. http://dx.doi.org/10.1016/0360-5442(96)00029-1.
[7] Usher P, Lea-Langton A, Camargo-Valero MA, Gale WF, Ross A. Integrating mi-croalgae into the Brazilian program for biodiesel production and use. Biofuels2014;5:45–52. http://dx.doi.org/10.4155/bfs.13.65.
[8] OECD. Steel market developments Q4 2015. Paris; 2016.[9] OECD. Greening steel: innovation for climate change mitigation in the steel sector.
Paris; 2015.[10] Oliver T, Lew D, Redlinger R, Prijyanonda C. Global energy efficiency and renew-
able energy policy options and initiatives. Energy Sustain Dev 2001;5:15–25.http://dx.doi.org/10.1016/S0973-0826(08)60266-5.
[11] Mousa E, Wang C, Riesbeck J, Larsson M. Biomass applications in iron and steelindustry: an overview of challenges and opportunities. Renew Sustain Energy Rev2016;65:1247–66. http://dx.doi.org/10.1016/j.rser.2016.07.061.
[12] Wei R, Zhang L, Cang D, Li J, Li X, Xu CC. Current status and potential of biomassutilization in ferrous metallurgical industry. Renew Sustain Energy Rev2017;68:511–24. http://dx.doi.org/10.1016/j.rser.2016.10.013.
[13] Suopajärvi H, Pongrácz E, Fabritius T. The potential of using biomass-based redu-cing agents in the blast furnace: a review of thermochemical conversion technolo-gies and assessments related to sustainability. Renew Sustain Energy Rev2013;25:511–28. http://dx.doi.org/10.1016/j.rser.2013.05.005.
[14] Mathieson JG, Rogers H, Somerville MA, Jahanshahi S, Ridgeway P. Potential forthe use of biomass in the iron and steel industry. Chemeca 2011 – Eng. A BetterWorld. Barton: Engineers Australia; 2011. p. 1065.
[15] World Steel Association. Steel Statistical Yearbook 2015. Brussels; 2015.[16] Matsumura T, Ichida M, Nagasaka T, Kato K. Carbonization behaviour of woody
biomass and resulting metallurgical coke properties. ISIJ Int 2008;48:572–7. http://dx.doi.org/10.2355/isijinternational.48.572.
[17] Cheng Z, Yang J, Zhou L, Liu Y, Guo Z, Wang Q. Experimental study of commercialcharcoal as alternative fuel for coke breeze in iron ore sintering process. EnergyConvers Manag 2016;125:254–63. http://dx.doi.org/10.1016/j.enconman.2016.06.074.
[18] Babich A, Senk D, Fernandez M. Charcoal behaviour by its injection into the modernblast furnace. ISIJ Int 2010;50:81–8. http://dx.doi.org/10.2355/isijinternational.50.81.
[19] Suopajärvi H, Kemppainen A, Haapakangas J, Fabritius T. Extensive review of theopportunities to use biomass-based fuels in iron and steelmaking processes. J CleanProd 2017;148:709–34. http://dx.doi.org/10.1016/j.jclepro.2017.02.029.
[20] Morello TF. Carbon neutral merchant pig iron in Brazil: alternatives that allowdecoupling from deforestation. Energy Sustain Dev 2015;27:93–104. http://dx.doi.org/10.1016/j.esd.2015.04.008.
[21] Babich A, Senk D. Biomass use in the steel industry: back to the future? Stahl Eisen2013;133:57–67.
[22] DECC. Industrial decarbonisation and energy efficiency roadmaps to 2050 – Ironand steel; 2015.
[23] IEA CCC. CO2 abatement in the iron and steel industry. London; 2012.[24] Burchart-Korol D. Sustainability and eco-efficiency assessment of biomass use in
steelmaking. In: Proc. 22nd Int. Conf. Metall. Mater. (Metal 2013), Brno; 2013, p.1740–6.
[25] Thrän D, Seidenberger T, Zeddies J, Offermann R. Global biomass potentials – re-sources, drivers and scenario results. Energy Sustain Dev 2010;14:200–5. http://dx.doi.org/10.1016/j.esd.2010.07.004.
[26] Troldborg M, Heslop S, Hough RL. Assessing the sustainability of renewable energytechnologies using multi-criteria analysis: suitability of approach for national-scaleassessments and associated uncertainties. Renew Sustain Energy Rev2014;39:1173–84. http://dx.doi.org/10.1016/j.rser.2014.07.160.
[27] Stein EW. A comprehensive multi-criteria model to rank electric energy productiontechnologies. Renew Sustain Energy Rev 2013;22:640–54. http://dx.doi.org/10.1016/j.rser.2013.02.001.
[28] EUROFER. A Steel Roadmap for a Low Carbon Europe 2050. Brussels; 2014.[29] Silva Herran D, Dai H, Fujimori S, Masui T. Global assessment of onshore wind
power resources considering the distance to urban areas. Energy Policy2016;91:75–86. http://dx.doi.org/10.1016/j.enpol.2015.12.024.
[30] Al-Yahyai S, Charabi Y, Gastli A, Al-Badi A. Wind farm land suitability indexing
using multi-criteria analysis. Renew Energy 2012;44:80–7. http://dx.doi.org/10.1016/j.renene.2012.01.004.
[31] Perpiña Castillo C, Batista e Silva F, Lavalle C. An assessment of the regional po-tential for solar power generation in EU-28. Energy Policy 2016;88:86–99.
[32] Wang C, Mellin P, Lövgren J, Nilsson L, Yang W, Salman H, et al. Biomass as blastfurnace injectant – considering availability, pretreatment and deployment in theSwedish steel industry. Energy Convers Manag 2015;102:217–26. http://dx.doi.org/10.1016/j.enconman.2015.04.013.
[33] Suopajärvi H, Fabritius T. Towards more sustainable ironmaking-an analysis ofenergy wood availability in Finland and the economics of charcoal production.Sustain 2013;5:1188–207. http://dx.doi.org/10.3390/su5031188.
[34] Fick G, Mirgaux O, Neau P, Patisson F. Using biomass for pig iron production: atechnical, environmental and economical assessment. Waste Biomass Valorization2014;5:43–55. http://dx.doi.org/10.1007/s12649-013-9223-1.
[35] Fish and Wildlife Services. Habitat suitability index models and instream flowsuitability curves: Brown trout. Lafayette; 1986.
[36] World Energy Council. Energy Trilemma Index 2016. https://www.worldenergy.org/data/trilemma-index/ (accessed January 5, 2016).
[37] Marull J, Pino J, Maria J. A land suitability index for strategic environmental as-sessment in metropolitan areas. Landscpae Urban Plann 2007;81:200–12. http://dx.doi.org/10.1016/j.landurbplan.2006.11.005.
[38] Geng G, Wang Z, Zhao J, Zhu N. Suitability assessment of building energy savingtechnologies for office buildings in cold areas of China based on an assessmentframework. Energy Convers Manag 2015;103:650–64.
[39] The World Bank. Data 2014. http://data.worldbank.org/topic (accessed February15, 2016).
[40] Zandi M, Martinez-Pacheco M, Fray TAT. Biomass for iron ore sintering. Miner Eng2010;23:1139–45. http://dx.doi.org/10.1016/j.mineng.2010.07.010.
[41] FAO. Production - Crops 2014. http://www.fao.org/faostat/en/#data/QC (ac-cessed October 9, 2017).
[42] Eurostat. Each person in the EU generated 475 kg of municipal waste in 2014. 2016.http://ec.europa.eu/eurostat/documents/2995521/7214320/8-22032016-AP-EN.pdf (accessed August 5, 2016).
[43] Hoornweg D, Bhada-Tata P. A global review of solid waste management.Washington; 2012.
[44] United Nations Statistics Division. Municipal waste treatment 2011. http://unstats.un.org/unsd/environment/wastetreatment.htm (accessed July 26, 2016).
[45] CIA. Library field listing: Coastline n.d. https://www.cia.gov/library/publications/the-world-factbook/fields/2060.html (accessed February 15, 2016).
[46] IEA. Coal information; 2016.[47] United Nations. Human development reports. Hum dev index its components 2014.
http://hdr.undp.org/en/composite/HDI (accessed February 15, 2016).[48] FAO. Global Forest Resources Assessments 2015. http://www.fao.org/forest-
resources-assessment/explore-data/en/ (accessed September 16, 2016).[49] The World Bank. Worldwide Governance Indicators 2014. http://info.worldbank.
org/governance/wgi/index.aspx#home (accessed December 11, 2016).[50] Tuck CA. 2012 Minerals yearbook; 2014.[51] Trading Economics. Wages in manufacturing 2014. http://www.tradingeconomics.
com/country-list/wages-in-manufacturing (accessed February 15, 2016).[52] Miller MM. Lime 2014. http://minerals.usgs.gov/minerals/pubs/commodity/lime/
mcs-2014-lime.pdf (accessed May 6, 2016).[53] FAO. Forestry – Forestry Production and Trade 2014. http://www.fao.org/faostat/
en/#data/FO (accessed October 8, 2017).[54] OECD. Developments in steelmaking capacity of non-OECD economies 2010. Paris:
OECD Publishing; 2011. http://dx.doi.org/10.1787/steel_non-oecd-2010-en-fr.[55] Vakkilainen E, Kuparinen K, Heinimö J. Large industrial users of energy biomass;
2013.[56] Mellin P, Wei W, Yang W, Salman H, Hultgren A, Wang C. Biomass availability in
Sweden for use in blast furnaces. Energy Procedia 2014;61:1352–5. http://dx.doi.org/10.1016/j.egypro.2014.12.125.
[57] Wei W, Mellin P, Yang W, Wang C, Hultgren A, Salman H. Utilization of biomass forblast furnace in Sweden; 2013.
[58] Governmental Offices of Sweden. Fossil Free Sweden n.d. http://www.government.se/government-policy/fossil-free-sweden/ (accessed September 16, 2016).
[59] Mathieson JG, Rogers H, Somerville MA, Ridgeway P, Jahanshahi S. Use of biomassin the iron and steel industry – an Australian perspective. 1st Int. Conf. Energy Effic.CO2 Reduct. Steel Ind. (EECR Steel 2011) – Inc. METEC InSteelCon 2011. The SteelInstitute VDEh; 2011. p. 1–10.
[60] Australian Government – Department of Resources Energy and Tourism. Bioenergy.Aust. Energy Resour. Assess., Canberra: abare.gov.au; 2010, p. 309–44.
[61] IEA. Coal 2015. Paris; 2015.[62] Feliciano-Bruzual C. Charcoal injection in blast furnaces (Bio-PCI): CO2 reduction
potential and economic prospects. J Mater Res Technol 2014;3:233–43. http://dx.doi.org/10.1016/j.jmrt.2014.06.001.
[63] Suopajärvi H, Pongrácz E, Fabritius T. Bioreducer use in Finnish blast furnace ir-onmaking – analysis of CO2 emission reduction potential and mitigation cost. ApplEnergy 2014;124:82–93. http://dx.doi.org/10.1016/j.apenergy.2014.03.008.
H. Mandova et al. Sustainable Energy Technologies and Assessments 27 (2018) 23–39
38
[64] Junginger M, Goh CS, Faaij A, editors. International bioenergy trade: history, status& outlook on securing sustainable bioenergy supply, demand and markets. SpringerScience & Business Media; 2013.
[65] IEA. World Energy Outlook 2015. Paris; 2015.[66] IRENA. Renewable energy prospects: United States of America. Abu Dhabi; 2015.[67] IRENA. Global bioenergy supply and demand projections: a working paper for
REmap 2030. Abu Dhabi; 2014.[68] Block G, editor. Interlaw book on renewable energies. Primento; 2015.[69] Bacchiocchi G, Longhin F, Liniado G, Abal P. Argentina Renewable Energy
Program; 2016. p. 1–5. https://www.cliffordchance.com/briefings/2016/08/argentina_renewableenergyprogram.html (accessed October 16, 2016).
[70] Vesterinen P, Alakangas E, Veijonen K, Junginger M. Prospects of bioenergy in newindustrial sectors – D2.3. Jyväskylä; 2010.
[71] EUBioNet. Biomass fuel trade in Europe 2012. http://www.eubionet.net/default.asp?SivuID=25484 (accessed August 31, 2016).
[72] Varmuza K, Filzmoser P. Introduction to multivariate statistical analysis in che-mometrics. CRC Press; 2009.
[73] Esmaeili A, Shokoohi Z. Assessing the effect of oil price on world food prices:
application of principal component analysis. Energy Policy 2011;39:1022–5. http://dx.doi.org/10.1016/j.enpol.2010.11.004.
[74] Cornillon PA, Guyader A, Husson F, Jegou N, Josse J, Kloareg M, et al. R for sta-tistics. CRC Press; 2012.
[75] Esbensen KH, Guyot D, Westad F, Houmoller LP. Multivariate data analysis-inpractice: an introduction to multivariate data analysis and experimental design.Multivariate data analysis; 2002.
[76] Vandeginste BGM, Sielhorst C, Gerritsen M. NIPALS algorithm for the calculation ofthe principal components of a matrix. TrAC Trends Anal Chem 1988;7:286–7.http://dx.doi.org/10.1016/0165-9936(88)80007-4.
[77] Davò F, Alessandrini S, Sperati S, Delle Monache L, Airoldi D, Vespucci MT. Post-processing techniques and principal component analysis for regional wind powerand solar irradiance forecasting. Sol Energy 2016;134:327–38. http://dx.doi.org/10.1016/j.solener.2016.04.049.
[78] Kupfer T, Baitz M, Colodel CM, Kokborg M, Scholl S, Rudolf M, et al. GaBi Database& Modelling Principles; 2017.
[79] World Resources Institute. CAIT climate data explorer 2014. http://cait.wri.org/historical (accessed October 8, 2017).
H. Mandova et al. Sustainable Energy Technologies and Assessments 27 (2018) 23–39
39