
IPCR - Riken...Editors F. Ambe M. Imamura M.Odera H. Sakairi A. Hashizume This volume contains...
186
Vol. 8 the Institute of Physical and Chemical Research IPCR cyclotron Progress Report 1974 Wako-shi, Saitama Pref., JAPAN
Transcript of IPCR - Riken...Editors F. Ambe M. Imamura M.Odera H. Sakairi A. Hashizume This volume contains...

Vol. 8
the Institute of Physical and Chemical Research
IPCR cyclotronProgress Report 1974
Wako-shi, Saitama Pref., JAPAN

IPeR Cyclotron Progress Report
The Institute of Physical and Chemical Research HRIKAGAKU KENKYUSHO" Wako-shi, Saitama, 351 JAPAN
December, 1974
Vol. 8
Editors
F. Ambe M. Imamura
M.Odera H. Sakairi
A. Hashizume
This volume contains recent information of the IPCR Cyclotron, informal reports and
abstracts of papers which will be published at scientific meetings or in publications
by staff members, guests, and visitors.
All rights reserved. This report or any part thereof may not be reproduced in any
form (including photostatic or microfilm form) without written permission from
the publisher.

CONTENTS
Page
1. INTRODUCTION
2. MACHINE OPERATION ............................................................................................. . 2
3. MACHINE DEVELOPMENT AND ACCELERATOR PHYSICS
3- 1. Acceleration of Boron Ions in the Cyclotron .............................................. .
4. NUCLEAR PHYSICS Scattering and Reactions
4 - 1. Incident Energy Dependence of Optimum Q-Values in Multinucleon Transfer Reactions Induced
4
by Heavy Ions ............ ... ............... ..... ............................. ....... ..... ...... ............... 6
4-2.
4- 3.
4- 4.
4 - 5.
4- 6.
4- 7.
4 - 8.
4-9.
4-10.
Multi-nucleon Transfer Reactions on Mo-Isotopes by 14N at EL ~97 MeV .................................................................................. .
Single-nucleon Transfer Reactions on 92Mo Induced by 14N and 12C ...................................................................... .
Transfer Reactions Induced by 14N on 12C at 79 MeV .................................................................................. .
Analysis of Elastic Scattering of 16 0 by 19F ................................................ .
DWBA Analyses of One-nucleon Transfer Reactions Induced by Heavy Ions on the N~28 Target Nuclei
Long-Range a-Particle Decays and Level Structure of 216Ra
Angular Distributions of Long-Range a-Particles Emitted from High Spin States in 216 Ra and Statistical Tensors
The eHe,3He), eHe,3He'), and eHe, a) Reactions on 13C ........................ .
A Study of Resonance States Induced by 160eHe, d)17F and 28SieHe, d) 29 p Reactions
4 - 11. 58,6o ,62,64NieHe, d) 59,61 ,63, 65 CU Reactions
and the Correlation between Unbound States and
12
15
19
24
27
30
32
34
40
Resonance States .. ................ .. ........... ........ .. ...... ... ..... ... ...... ..... ..... .... ............... 44
4 - 12. Analyses of CreHe, d)Mn Reactions at 29.29 MeV..................................... 48

4- 13. Full Finite-Range DWBA Calculations for Heavy-Ion Induced Two-Nucleon Transfer Reactions 52
4- 14. Two-Nucleon Transfer Reactions between Heavy-Ions ................... ............... 55
4- 15. One- and Two-step Processes in the Heavy-Ion Induced Two-Nucleon Transfer Reaction ........................................ ............. ............. ... 58
4- 16. CCBA Analysis of (p, t) Reactions on Rare-Earth Nuclei .............. ............... 61
4-17. Folding Model for Nucleus-Nucleus Optical Potential 64
4-18. Role of the 12C-Core Exchange in the 160_12C Elastic Scattering ... ............................... ...... ............. ........... ............... 68
5. NUCLEAR PHYSICS Nuclear Spectroscopy
5- l. Lifetime Measurement of the 6+ (2976 keY) State in 46Ca and E2 Effective Charges in (1 f 7 / 2 )±2 Nuclei .................................... .. . 73
5- 2. High-Spin State Yields in 88y Relative 1 + State in 90Nb Excited via 89y'+ ex Reaction ............................................................ .... . 76
5- 3. Short Life Radioisotopes and Isomers Observed via Ir + C Reactions .. .......... ...... ...... ........ ... ..... ......... .......... ... .................... ...... ... .... 79
5-4. Monopole Effective Charges 82
6. NUCLEAR INSTRUMENTATION
6- 1. Performance of the IPCR Polarized Ion-Source 84
6- 2. Investigation of Residual Gases in the Ionizer of Polarized Ion Source ... .......... .............. ..... ... .... ...................... ..... ... 89
6- 3. Mech~'nical Design of a Polarized Ion Source
for the INS Cyclotron ........................ , .............................................................. . 93
7. ATOMIC AND SOLID-STATE PHYSICS
7- l. Inner-Shell Excitation by Nitrogen Ions and Alpha Particles (3) 97
7-2. Positron Annihilation in Y and Nb .................... .... ........................................ 99
7-3. A Damage Function Based on the Focused Replacement Collision Model .............. '" ........ .............................. ............ ...... 101
7 - 4. Secondary Electron Emission from Al and Ni by Fast-proton Bombardment ................................. ........ .............. ................ 104

8. RADIOCHEMISTRY AND NUCLEAR CHEMISTRY
8-1. Charged-Particle Activation Analysis . ..... ... .............. ......... ........ .... .. ............ ... 106
8-2. Mossbauer Emission Spectroscopy of 119Sn after the EC Decay of 119Sb ......................................................................... 108
8-3. Behavior of Tritium and Hydrogen Atoms on Metal Surface ......... .......... .... III
8-4. Mass Asymmetry in the Fission of Actinide Nuclei 113
9. RADIATION CHEMISTRY AND RADIATION BIOLOGY
9-1. Heavy-Ion Radiolysis of Liquid Aldehydes .... ................ ...... .......... ........... .... 118
9-2. Optical and ESR Studies on Single Crystals of KBr and CdS Irradiated with Heavy Ions ....... ... ... ..... .. .. .. ..... ......... .... ... .. ...... 120
9- 3. LET Effect on the Radiation-Induced Polymerization of Styrene ........................................................ ....... ........ ............. :............ ...... 123
9- 4. Inactivation of a Radioresistant Vegetative Bacterium Micrococcus radiodurans by Charged Particles .. ..... ..... .... ..... ..... ........ ..... ..... ... 126
9-5. LET Effects on Production of DNA Single-Strand Breaks and Their Repair in ~ coli Blr .... ............... .... ... ........ ........ ..... ......... ... ...... .... 129
10. PREPARATION OF RADIOISOTOPES AND LABELED COMPOUNDS
10-1. Production of Radioisotopes and Preparation of Labeled Compounds for Medical Use ..... . ... .... .... ....... ....... ...... ..... ............. 133
11. RADIATION MONITORING
11-1. Routine Monitoring 134
12. A NEW MACHINE
12- 1. The Variable-Frequency Linac Project Status at Autumn 1974 .......................................................................... 136
12- 2. Design Study Using Cavity Models ................................................. ........ .. ...... 138
12- 3. Summary of Measurements on Electrical Characteristics of Model Cavities I and II 139
12- 4. Voltage Distribution at the Gap of Model II with the Drift Tubes Removed .... ... ..... ............. ............... ........... ........... ........ 142

13.
14.
12- 5. Results of Measurements on Model III of Linac
Cavity having a Stem of Circular-Shape ....................... ......... .......... ............... 144
12- 6. Results of Measurements on the Model IV of
the Linac Cavity .................................................................. :.......................... 146
12-7. Design of the Linac Cavity
General ...................................................................................... ............... 148
12- 8. Design of the Linac Cavity
Mechanical Problems ......... .......... ................. ... ........................................ 150
12- 9. Design of the Linac Cavity Cooling ... ........ ............ ....... ...... ...... ........ ... ...... ..... ... ......... ... ... .... ..... .......... 151
12- 10. Design of the Linac Cavity Vacuum Consideration
1 2- 11. Distribution of Magnetic Flux Density in the
153
Poles of Drift Tube Quadrupole Lenses ...................................................... '" 155
1 2- 12. A Circuit Using a PIN Diode Switch for Measurements of the Q-values of a Cavity at High Resonant Frequencies 157
12-13. Trial Fabrication of Coils for Drift Tube Quadrupoles 159
12- 14. Effects of Non-uniformity of Voltage between Drift Tube Gaps ......... ... ... ....... ....... ..... .......... . ........ ...... .... ..... ...... ..... 161
12- 15. Computer Codes for Orbit Dynamics in the Heavy Ion Linac ....... ............ ......................... ....... ... ...... .......... ... .. ..... ... .......... 164
LIST OF PUBLICATIONS 165
LIST OF PERSONNEL 168
15. LIST OF OUTSIDE USERS AND THEIR THEMES ................................................. 171
AUTHOR INDEX .... ....................... ...... .. .......................... .. .......................................... 175

1. INTRODUCTION
The cyclotron has been operated for eight years with prudent care to and constant
improvements by the technical staffs and operation crew. Total work time of the machine
reached as much as 38,000 h until the end of 1974.
As in the previous years, the heavy ion acceleration was the main mode of operation in
this year. The acceleration of boron ions was tested and proved successful.
Experimental and theoretical studies on nuclear reactions and level structures were
continued. Researches related to radiation chemistry and radiation biology were carried out
mainly using heavy ions. On-line optical and ESR spectroscopy was applied to study the
difference in LET effects by heavy and light projectiles. Charged-particle activation analysis,
production of radio-isotopes and preparation of labeled compounds for medical use were carried
out. The analysis on the states of atomic electrons by the methods such as inner shell
excitation by heavy ions and measurements of angular correlation of annihilation gamma-rays
were made .
The development of the polarized ion source has been completed. It is scheduled to be
installed in the cyclotron of the Institute for Nuclear Study, University of Tokyo, in 1975 and
will be used by people of the both institutes, IPCR and INS.
The heavy-ion linac project was approved by the Government this year. The progress of
its construction and related researches will be described in this and the following issues.
It is our great regret to announce the sudden death of Dr. H. Tahara, Chief of the Organic
Synthesis Laboratory, on January 2, 1975. His work on the preparation of 18F-labeled compounds
greatly contributed to the field of medical diagnosis.
Hitosi Hagihara, Chairman
The Cyclotron Board
2
2. MACHINE OPERATION
H. Nakajima, K. Ogiwara, S. Fujita, K. Ikegami,
T. Kageyama, S. Kohara, and H. Takebe
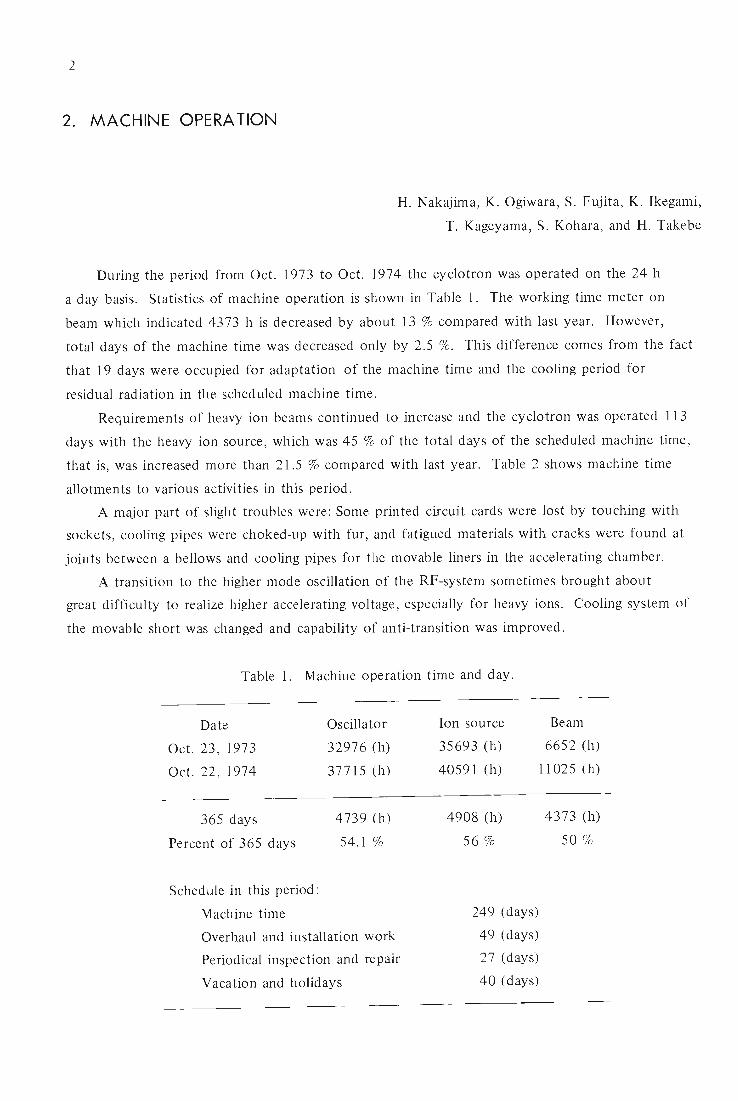
During the period from Oct. 1973 to Oct. 1974 the cyclotron was operated on the 24 h
a day basis. Statistics of machine operation is shown in Table 1. The working time meter on
beam which indicated 4373 h is decreased by about 13 % compared with last year. However,
total days of the machine time was decreased only by 2.5 %. This difference comes from the fact
that 19 days were occupied for adaptation of the machine time and the cooling period for
residual radiation in the scheduled machine time.
Requirements of heavy ion beams continued to increase and the cyclotron was operated 113
days with the heavy ion source, which was 45 % of the total days of the scheduled machine time,
that is, was increased more than 21.5 % compared with last year. Table 2 shows machine time
allotments to various activities in this period.
A major part of slight troubles were: Some printed circuit cards were lost by touching with
sockets, cooling pipes were choked-up with fur, and fatigued materials with cracks were found at
joints between a bellows and cooling pipes for the movable liners in the accelerating chamber.
A transition to the higher mode oscillation of the RF-system sometimes brought about
great difficulty to realize higher accelerating voltage, especially for heavy ions. Cooling system of
the movable short was changed and capability of anti-transition was improved.
Table 1. Machine operation time and day.
Date
Oct. 23, 1973
Oct. 22, 1974
365 days
Percent of 365 days
Schedule in this period:
Machine time
Oscillator
32976 (h)
37715 (h)
4739 (h)
54.1 %
Overhaul and installation work
Periodical inspection and repair
Vacation and holidays
Ion source
35693 (h)
40591 (h)
4908 (h)
56 %
249 (days)
49 (days)
27 (days)
40 (days)
Beam
6652 (h)
11025 (h)
4373 (h)
50 %

Table 2. Scheduled machine time and subjects of activity in the period, IX
Subject Heavy ion
Direct reaction 1561 (h)
Nuc!. phys. 1 In-beam spectroscopy 549
RI prod uction 0
Nuclear chemistry 0
Fields other Radiation chemistry 172
than nucl. phys. Radiation biology 131
Solid state physics 0
Inner atomic shell excitation study 24
I Nuclear medicine 0
Ou tside users Nuclear fuel study 0
RI Production 24
Development of 45 instruments
Total 2506 (h)
Percent in total 45.3 %
Maintenance operation and engineering
Exchange of ion source
Reserved for machine time adjustment and cooling of radiation
Machine inspection and repair
Total
Light particles
1670 (h)
142
84
433
13
80
222
0
192
121
17
46
3020 (h)
54.7 %
58 (h)
456 (h)
624 (h)
1138 (h)
Total
3231 (h)
691
84
433
185
211
222
24
192
121
41
91
5526 (h)
100 %
3

4
3. MACHINE DEVELOPMENT AND ACCELERATOR PHYSICS
3-1. Acceleration of Boron Ions In the eyc lotron
A. Shimamura and I. Kohno
It was planned to accelerate B ions in the cyclotron. For this purpose, the production of
multiply-charged ions of B using the IPCR ion source was studied at a test bench, and sufficient
quantities of IOB3+ and 11 B3+ ions were obtained. These B ions were successfully accelerated in
the cyclotron employing the following procedure.
( I ) Gas flow system
Figure I shows the gas flow system of BC 13 , which was used as the sample gas. Since
I on source
Cyclotron vaul t
-~-~-. - 0=-
Pressure gauge
V / / /
Slow leak / volve
Piran i gauge
V
Control room lllJ
Ice box
Fig. I. Gas flow system.
l
~ _:_-~11B2+ :
Gas : BC1 3
Arc power = 700 V , 2 .3 A
p = 2.5 X 10⁻⁵ Torr.
Magnetic field = 0. 6 Wb / m2
/;~ I, I , II I, II
/ I --/ V ,;;:'--
H Exhausting ,....L,b=------' =-,' pip e
R.P
(\J N
Fig. 2. A m/q spectrum of the ion beam measured at the test bench when BCI 3 gas was
fed. Arc power: 700V, 2.3A, Vac. = 2.5 x 10- 5 Torr. Magnetic field = 0.6 Wb/m2 .

5
BC 13 is a liquid whose vapor pressure at 0° C is about 400 Torr, the reservoir of BC 13 was
dipped in ice-water. This gas was introduced into the ion source through a slow leak valve. The
gas flow system was evacuated by an auxiliary rotary pump. Since BC 13 reacts with H2 0 in
the air, the exhausted gas was discharged to outdoors using a blower so as not to make any
trouble. The gas flow rate was measured with a Pirani gauge.
(2) Production of multiply-charged ions of B
Figure 2 shows the m/ q spectrum of lOB and 11 B ions measured in the test bench. 1) In
the spectrum peaks corresponding to IIB+, 10B+, IlB 2+, IO B2+, 11B3+ and 1°B3+ ions were found. As
the yields were measured in a unit of electric current, the particle yield of B3+ ions was
one-third times that of B+ ions at the same current reading.
(3) Acceleration of B ions
10B3+ and I1B3+ ions were accelerated in the cyclotron. Fig. 3 shows a m/q spectrum of
ions accelerated in the cyclotron when BC 13 gas was introduced into the ion source.
The spectrum was measured by varying the strength of the magnetic field at a radius of
69cm. These 11 B3+ and 1°B3+ ions were extracted from the cyclotron at intensities of 4 /lA
and 1 /lA respectively. The energy ranges of 11B3+ and 10B3+ ions obtained in the IPCR
cyclotron were 50 to 72 MeV for the former and 45 to 70 MeV for the latter.
Reference
1 jJ.A
E
~ 500 nA
(3rd) 35C14 +
~1 (3rd) 37 C14+
~l (3 rd)
35C13+
~l N
200 220 240 250 280 300 320 340 350 380
Magneti c current (A)
Gas ' BCb f = 5.947 MHz
Vd = 5 1 kV Arc power = 350V , 4.2 A
R =59cm P =5.4XIO- 6 Torr .
Fig. 3. A m/q spectrum of the ion beam in the cyclotron when
BC1 3 gas was fed to the source.
1) I. Kohno et al.: IPCR Cyclotron Progr. Report,!, 13 (1967).

6
4. NUCLEAR PHYSICS
Scattering and Reactions
4-1. Incident Energy Dependence of Optimum O-Values in
Multinucleon Transfer Reactions Induced by Heavy Ions
T. Mikumo, I. Kohno, K. Katori, T. Motobayashi,
S. Nakajima, M. Yoshie, and H. Kamitsubo
We report here on the systematics of positions of the maximum in the distribution of
excitation energy Exm (B) and the corresponding Q-Values Qm (B) of a residual nucleus B, deduced
from the continuous spectra ("bumps") of b of the reactions of type A (a, b) B, and on their
dependence on Ea' Using 14N and l2C beams and targets of f-p shell nuclei csoTi, 52Cr, 53Cr
and 54Fe), we studied nuclear reactions at energies about twice to three times higher than the
Coulomb barrier (EL = 60 ,...., 95 MeV). The reactions studied are listed in Table 1, together
with useful experimental conditions and experimental results. Typical spectra for 52Cr + l4N
reactions at 80 MeV at 8 L = 22° are shown in Fig. 1.
Table 1. Multi-nucleon transfer reactions. A (a, b) B.
Ei/Bc E· - B e (b) A=a EL (MeV) Ei (MeV) 1 c b measured L
(ro= 1.4fm) (ro= 1.4fm) (deg)
52Cr + l4N 95 74.9 2.89 49.0 13C, l2C, 12B, 11 B, lOB , lOBe
9Be, 7Be, 7Li, 6Li, 4He 16, 20, 25
90 70.9 2.73 44.6 16,25,18,22, 27
80 63.0 2.43 37.1 18,22,27
70 55.2 2.16 29.3 22, 27
64 50.4 1.95 24.5 20, 27
53Cr + l4N 90 71.2 2.74 45.0 160, ISO, l5N, l3C, l2C, 10, 12,15,18
11 B, lOB, lOBe , 9Be, 24,27,30,33
7Be, 7 Li, 6Li, 4He
50Ti + 14N 70 54.7 2.41 32.0 13C, l2C, iJ B, l6B 25
54Fe +14N 70 55.6 1.94 26.9 26
52Cr + 12C 90 73.1 2.97 48.5 lOB , lOBe , 9Be, 7Be 18
70 56.9 2.31 32.3 lOB , lOBe, 9Be 18,22
60 48.8 1.98 24.2 17,19,22,25,27
50Ti + l2C 60 48.4 2.13 25.7 25
54Fe + 12C 60 49.1 1.86 22.7 25

30
20
10
30
20
10
20
10
80
60 ~ 40 c ::J 0 20 u
60 40
20
200
100
400
300
200
100
52C r + 14N 80Me V
50 40 30 E x (MeV)
20 10 o
Fig. 1. Energy spectra of l3 C, 12C, liB, lOB, 9Be, 7Li and 6Li particles
emitted in the 52Cr + 14N reaction at an energy of 80 MeV and
a laboratory angle of 22 degrees.
7
Note first the following characteristic features about the Qm (B) of reactions, in particular,
52Cr + 14N (EL = 95 , 90, 80, 70 and 64 MeV) and 53Cr + 14N (EL = 90 MeV) which were
most widely studied.
(1) For incident c.m. energies Ei considerably higher than the Coulomb barrier Bc for the
a+A system, the spectrum shape of b is mainly characterized by a continuous bell-shaped form
(bump). The shapes of bumps are very asymmetric for smaller n, the number of transferred
nucleons, while they approach symmetric forms for the larger n. Further insight of the energy
spectra of 53Cr + 14N at 90 MeV at various angles reveals the existence of two components in
the bump (with b = 13C, 12C, liB, lOB): a higher energy part (hard component) and a lower
energy part (soft component), the peaks of which are separated by ;::: 10 MeV. They correspond ,
presumably, to "quasi-elastic" and "deep-inelastic" processes,t) respectively. In the angular range

8
investigated (8 L == 10 - 33°). the relative intensity of the hard component is higher at forward
angles, while that of the soft component higher at larger angles. We discuss separately about
the characteristic features of their angular distributions and the absolute yields. Following
discussions are concerned with the systematics of peak positions of overall bumps.
(2) The spectrum shape does not reflect the structure of target nuclei sensitively. For
instance, the spectra of 52Cr + 14N -+ 54Mn + 12C and 53Cr + 14N -+ 55Mn + 12C are quite
similar in shape at the same bombarding energy.
(3) In general, IQm (B) I increases with an increase In n for a given incident channel
(Fig. 2) as reported elsewhere.2) The accuracy of the values of Qm is, in most cases, within
about ± 2 MeV.
(4) Qm (B) varies very slowly with 8 L, angle of emission of b , and often remains almost
constant throughout a wide range of 8 L investigated , especially in S3Cr + 14N -+ 55Mn + 12C
o~--~--~----~--~---,----,----,---,,---,---~----------~
- 5p5n
o 16° (f)16o(53Cr )
® 25°
o 22° • 27"
o 20° • 27°
- 50 L---~--~----L----L--~----~---L--~,---~--~----------~ o 23 4 5 6
n ( number of t ransfer! 2d nuc leons )
Fig. 2. Qrn vs. n (number of transferred nucleons) curves for 13C, 12C, 12B, II B, lOB,
lOBe , 9Be, 7Be, 7Li, 6Li and 4He particles emitted from the 52Cr + 14N
reactions at energies of 64, 70, 80 and 95 MeV, and the 53Cr + 14N reaction
at an energy of 90 MeV.

- 10
- 20
> Q)
~ -30 E Gf
- 40
- 50
/,'
53C r + 14]\' 90 MeV
20 30 40 8 1. ( cleg )
Fig. 3. Qm vs. 8L
(detected laboratory angle) curves for 13C, 12C,
II B, lOB and 9Be particles emitted from the 53Cr + 14N
reaction at an energy of 90 MeV. For II B, lOB and 9Be
hard and soft components are not separated.
with a very high Qgg value (+ 5.28 Me V), Qgg being the Q-value of the reaction leaving the
both final products in the ground states. This situation is shown in Fig. 3 in contrast with
the cases for sub-Coulomb or near-Coulomb reactions, where Exm (B) is strongly dependent on
8 L ·3)
(5) Absolute yield of the peak of the bump is strongly dependent on Qgg values among
the isotopes studied.
We now discuss the systematics of peak positions of bumps. If we plot Qm values as a
function of n, we obtain an almost linear reaction,
9
until n reaches a certain number of transferred nucleons no , as shown in Fig. 2. For 52Cr + 14N
and 53Cr + 14N (EL = 64 '" 95 MeV), no = 5 is at higher energies, while no = 4 at lower
energies. The vlues of Q'S are found to be almost proportional to Ei in 52Cr + 14N reactions,
giving a relation:
In these cases Q = -(5 '" 8) MeV/nucleon and ~ varies with a, but is nearly independent of Ei·
These relations hold in either of the proton and neutron transfers; in other words, for the
same a, adjacent A and a given Ei, Qm,s are almost the same for a given n (between isobars of
products b), e.g., in 12C and 12B, lOB, and lOBe, 7Be and 7Li (despite large differences in Ex m (B)
between isobars of the residuals B).
These characteristics are interpreted as follows: Qm is rewritten as
10
- 10
G I . = 20° 0 - _ _ 22 ° 18° 16° 16°
---0 - ---------0 - - - - - - - - ---0-- ---0 13C 0 -----_0 __ 0 -_ ----_ 12 - --0____ ----0----------0 -----0 C
1:::::. ...... ..... .....
\7 ....... ::.:..................... -.."""- ........ -...0 ---e __ .......... _~=---- ------0 -----0 lIB
X-_~~~-... ----==~~~D--_- __ +- _ - • .:::-- \7- - ----6. __ ----+ -::::::::::::-- ------ ---""""6. lOB @............ -- ___ --::::::::::,__ --\1<. ..........
'....... -... ...... -.. --::.::-::::--- .................. \1 98 ............ - ...... +__ -_..::: __ • e
'©- - - - _ - -- ,r:::::..-:.. - - _ 7 --..... --_+_ --_::.. Be - -..... .', 7L'
...................... @ .......... -+6Lii ---
- 20
- 30
::.-O.l
~ - 40
- 50
--- ----@.... 52 C,. + 14 :\
.......... ............. @ 4
He - 60
- 70
60 70 80 90 100 EL ( l'vle \ ' )
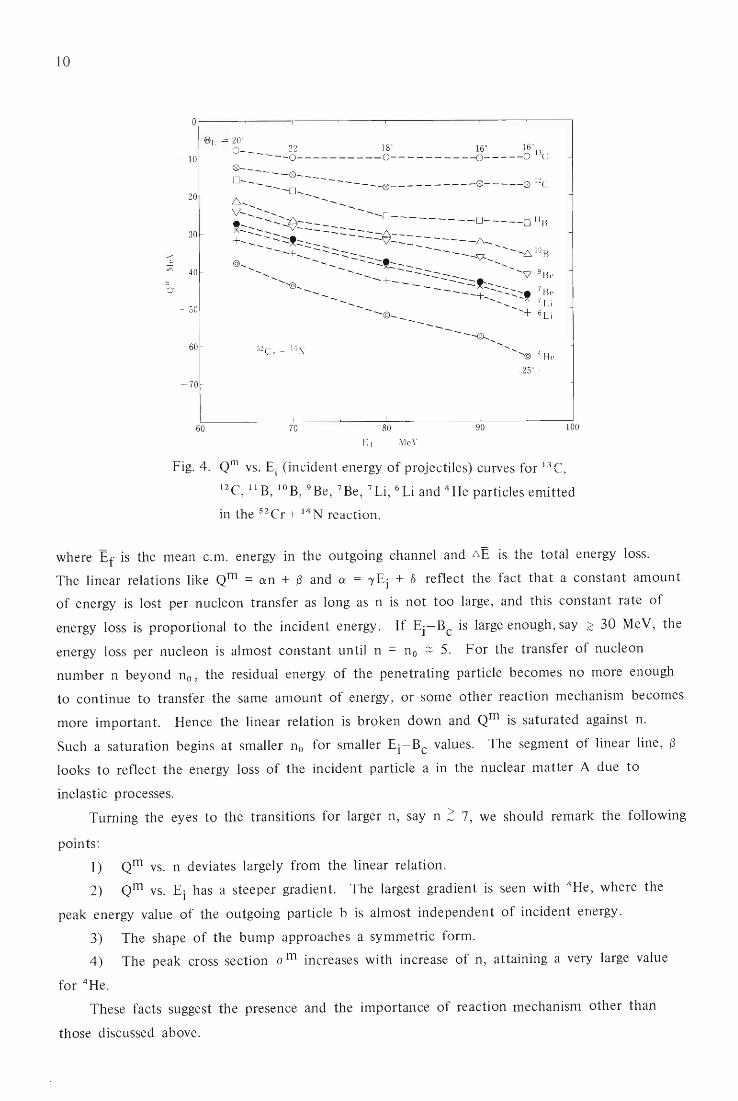
Fig. 4. Qm vs. E j (incident energy of projectiles) curves for l3C,
12C, lIB , lOB, 9Be, 7Be, 7Li, 6Li and 4He particles emitted
in the 52Cr + 14N reaction.
where Ef is the mean c.m. energy in the outgoing channel and 6E is the total energy loss.
The linear relations like Qm = an + ~ and a = 'Y Ei + 0 reflect the fact that a constant amount
of energy is lost per nucleon transfer as long as n is not too large, and this constant rate of
energy loss is proportional to the incident energy. If Ei-Bc is large enough, say ~ 30 MeV, the
energy loss per nucleon is almost constant until n = no ;::: 5. For the transfer of nucleon
number n beyond no, the residual energy of the penetrating particle becomes no more enough
to continue to transfer the same amount of energy, or some other reaction mechanism becomes
more important. Hence the linear relation is broken down and Qm is saturated against n.
Such a saturation begins at smaller no for smaller Ei-Bc values. The segment of linear line, ~
looks to reflect the energy loss of the incident particle a in the nuclear matter A due to
inelastic processes.
Turning the eyes to the transitions for larger n, say n ~ 7, we should remark the following
points:
1) Qm vs. n deviates largely from the linear relation.
2) Qm vs. Ei has a steeper gradient. The largest gradient is seen with 4He, where the
peak energy value of the outgoing particle b is almost independent of incident energy.
3) The shape of the bump approaches a symmetric form.
4) The peak cross section a m increases with increase of n, attaining a very large value
for 4He.
These facts suggest the presence and the importance of reaction mechanism other than
those discussed above.

1 1
The studies on the systematic features about Qm, together with the absolute cross sections
and angular distributions, may throw light on the elucidation of the mechanism of multinucleon
transfer reactions.
References
1) D. H. E. Gross and H. Kalinowski: Phys. Lett., 48B, 302 (1974); A. G. Artukh,
G. F. Gridnev, V. L. Mikheec, V. V. Volkov, and J. Wilczynski: JlNR E7-6970, Dubna
(1973); J. Wilczynski: Phys. Lett., 47B, 484 (1973).
2) T. Mikumo, 1. Kohno, K. Katori, T. Motobayashi, S. Nakajima, M. Yoshie, and H. Kamitsubo:
Proc. lnt. Conf. Reactions between complex Nuclei, Nashville, 1, 64 (1974).
3) N. Anantaraman, K. Katori, and J. P. Schiffer: Proc. of "Symp. on Heavy Ion Transfer
Reactions", Argonne National Laboratory, PHY-1973B, 413 (1973); W. von Oertzen:
ibid., p. 675 (1973).

12
4-2. Multi-nucleon Transfer Reactions on Mo-Isotopes
by 14N at E L = 97 MeV
M. Yoshie, H. Kamitsubo, K. Katori, I. Kohno,
T. Motobayashi, S. Nakajima, and T. Mikumo
Multi-nucleon transfer reactions between heavy nuclei sufficiently high above the Coulomb
barrier have attracted much attention in connection with the reaction mechanism. Systematic
data presented by the DUBNA group!) show quite interesting behavior in the cross sections,
which depend on the reaction Q-values (Qgg) regularly. Discussions on this regularities and
their interpretations are found in the literature.}) Also, Q-values which give maximum cross
sections in the energy spectra were interpreted considering the reaction kinematics.2 )
Particle production cross sections of He, Li, Be, B, C, and 0 isotopes in the bombardment
of all the stable Mo-isotopes by 14N projectiles supplied by the Cyclotron were measured at
EL = 97 MeV at two angles () = 25° and 30°. Conventional counter telescope systems were
used to identify the particles. Self supporting targets had the thicknesses from 0.45 to 1.0
mg/ cm 2. The overall energy resolution was 1 MeV in the worst case. Particle yields were
normalized to the forward angle elastic scattering yields measured with the same counter to
give the absolute values of production cross sections.
By varying the targets from looMo to 92Mo, Qgg changes its value appreciably for a certain
reaction, which makes it possible to study the dependence of the cross sections and the
spectrum shape on Qgg. On the other hand, it is expected that the angular distributions of
- 5 - 10 - 15 Q gg ( l\leV )
Fig. 1. Production cross sections of B-isotopes in bombardment of
Mo-isotopes by 14 N at EL = 97 MeV. The numbers in the
figure are the mass numbers of the targets.

products do not suffer much changes from the classical estimates. So, the cross sections
measured at certain fixed angle are good measures of total cross sections if one type of
ejectile is considered. As an example, production cross sections of B-isotopes are plotted
against Qgg in Fig. 1. The yields of lOB and 12B are each on one line, whereas the cross
sections of lIB from the odd mass targets are slightly smaller than those from the even mass
targets. Note that in the former case the neutron numbers of the target residues are even
for even mass targets and odd for odd mass targets, whereas the situation is opposite in the
latter case. This fact may be due to the effect of the pairing energy.
To characterize the bell-shaped energy spectrum, three Q-values were defined as follows:
one is the Q-value which gives the maximum cross sections (Qm), and the remainning two are
those for which each cross section is a half of that at Qm. These three Q-values are shown
also for the B-isotopes in Fig. 2. As the target becomes lighter, the spectrum becomes
nallower. Despite the large changes in Qgg' the Qm remains rather constant, which indicates
the importance of reaction kinematics.
~las~ number of thp tar~('l
12 H II I> IIJ II
100 9897969594 92 100 9897969594 92 100 9897969534 92
l) ""
- 10
01
~-~25O .------------ 20
() '" • 30 0
@~ "--"'-0-." ."-.. ~\ __ A25 ° @~
~30°
30 ~~ ~
~30' • 25 ' lip .. - 40
? ~ .
- 50'-------------------""------'
Fig. 2. Three Q-values which characterize the
energy spectra of B-isotopes with Q gg
are plotted against the mass numbers
of the targets. Energy spectra have
maxima at QID and f' = Q1 - Q2 gives
the FWHM.
13

14
References
1) A. G. Altukh, G. H. Gridnev, V. L. Mikheev, V. V. Volkov, and 1. Wilczynski: Nucl.
Phys., A211 , 299 (1973) and the references therein.
2) P. J. Siemens, J. P. Bondorf, D. H. E. Gross, and F. Dickmann: Phys. Lett., 36B, 24
(1971).

15
4-3. Single-nuc leon Transfer Reactions on 92Mo Induced
by 14N and 12C
M. Yoshie, K. Katori, I. Kohno, T. Mikumo,
T. Motobayashi, S. Nakajima, and H. Kamitsubo
In order to elucidate the validity of the semi-classical and DWBA theories, single nucleon
transfer reactions on 92Mo by l4N and 12C were studied. l) Beam energies were 97 and 75 MeV
for 14N, and 90 and 60 MeV for 12C ions. Conventional counter telescopes were used to detect
the emitted particles and the data were recorded on a magnetic tape event by event for later
analyses. A self-supporting target of 450 f.1g/cm 2 was used and the typical energy resolution was
400 keV.
Angular distributions for four transfer channels were measured in the 14N induced reactions,
and only the proton transfer was studied in the 12C induced reactions. The angular distributions
of elastic scatterings were also measured, and these data were analyzed with the optical model
using a search code.2) Representative parameter sets are listed in the Table 1.
Table 1. Optical potential.
System EL (MeV) V (MeV) W (MeV) ro (fm) a (fm) rc (fm)
92Mo + 14N 97 (75) 94 (117) 25 1.15 0.5 1.2
92Mo + 12C' 90 (60) 120 (127) 25 1.13 0.5 1.2
92Mo + lIB 70 100 25 1.15 0.5 1.2
Optical potential parameters which are found under the constraints rR = r I = r o' aR = aI = a.
Energy dependence is explained by varying the depth V.
Single particle levels studied by the light-ion transfer reactions3) have also been observed in
the present study. Two different projectiles made it possible to study the effects of kinematical
matching conditions, that is, the l2C induced reactions have large negative Q-values compared
with those of l4N induced reactions, and only the high spin levels are favored III the former case.
As an example, energy spectra of neutron stripping reactions are given in Fig. 1. In the
e 2C, llC) reaction, d 5 /2 and Sl/2 states are suppressed. The semi-classical theory developed by
Brink4) reproduces the data well at least qualitatively.
The angular distributions are shown in Fig. 2, together with the theoretical cross sections
calculated using the exact finite range DWBA code developed by Tamura and Low.S) Since the
first excited states (Pll2) were not resolved from the ground states (g912) in the proton transfer
reactions, the DWBA fits were made using the following formula:
do I = N ~ C2 S(I) C2 S(2) do I dn expo states dn DW ,

16
140
120
100 Q)
c: c: 80 0
is "-II> 60 ..... c: => 0
u 40
20
Q)
c:
50
40
2i 30 = u "-~ 20 c: => o
u 10
92Mo (12C, l1C )93Mo
EL = 90MeV
d3/2~ ~ 97/2
h11l2
t
92 Mo (1 '1.J , 13 N ) 9 3 M 0 9712 S1/2
[L = 97 MeV (1.36) (0.95)
Bt = 25°
hl1!2 (2 .32)
Ex (MeV)
dSI2
~
dSI2 grnd
Fig. 1. Energy spectra of neutron stripping reactions on 92Mo by 14N
and 12C. The same states in 93Mo are populated in both
reactions, but the peak strengths are different from each other
(see text).
where C2S(l) and C2S(2) are the S'-factors of the heavy system found in the references3), and
those of the light system calculated by Cohen and Kurath.6) N is a normalization factor.
The transferred nucleon was assumed to be bound in a potential well of Woods-Saxon form with
a radius of R = 1.2A1/3 and the diffuseness a = 0.65 fm, where A is the mass number of the
core nucleus. The well depth V was searched around 60 Me V to give the actual binding energy,
and VLS was 7 MeV. The N-factor defined above varied from 0.5 to 0.8 case by case in the
calculations on the angular distributions to ground state groups of the residual nuclei induced
by 14N. Incident energy dependence of the magnitudes of the cross sections was well accounted
for. The e2C, llB) and e2C, 13N) reactions shown in Fig. 2 had N-factors of about 1.7 and 0.9
respectively, which are slightly larger than those in the case with 14 N. In the proton transfer
reactions, positions of the angular distribution maximum differ by a few degrees between stripping
and pick-up, whereas in the neutron transfer reactions it does not. The DWBA theory explains
these differences reasonably well.

10100 20· 30° 40° 20" 30· 40°
0.1
9~o+ 14N 97 MeV
(14N , 13 N) 93Mo
2d 5/2 grnd
I 9 9/2 grnd
~ ~\
(I/I" Q
1 1\
92Mo + 12C 90MeV
(12C ,l1S)93Tc
1 9 9/2 grnd
+2p l/2 0.396
(14N,150)9INb Q~ \
199/2 grnd I \ (12c,13N) 91Nb +2p1/2 0.100 9 2 19912 grnd
, ~VfJ/ \ f t~t t + 2M 0.100
!v Lf/ 1f 1 f !/I~!"~ \
I) \ t A(0, f
L, "c I "To ! ~ t . 199/2 grnd
+2PI/2 0.396
8 o.m.
Fig. 2. Angular distributions of single nucleon transfer
reactions on 92 Mo by 14 Nand 12 C obtained by the
DWBA calculation (solid lines). Incident channel
optical parameters given in Table I are also used
for the exit channel.
17
In the (12C, liB) and (l2C, 13N) reactions, the calculated angular distributions take always
backward positions compared with the experimental ones. For the (l2C, lIB) reaction, the use
of the exit channel parameters which reproduce the elastic scattering of liB on 92Mo does not
remove this discrepancy.
References
1) M. Yoshie, K. Katori, I. Kohno, T. Mikumo, T. Motobayashi, S. Nakajima, and H.
Kamitsubo: Proc. Intern. Conf. on Reactions between Complex Nuclei, Nashville,
North-Holland, Amsterdam (1974).

18
2) T. Wada: IPCR Cyclotron Progr. Rep., b 87 (1968).
3) R. L. Kozub and D. H. Youngblood: Phys. Rev., C4, 535 (1971); J. B. Moorhead and
R. A. Moyer: ibid., 184, 1205 (1969); R. L. Kozub and D. H. Youngblood: ibid., C7,
404 (1973); R. Chapman, J. E. Kitching, and W. Mclatchie: Nucl. Phys., A196, 347 (1972).
4) D. M. Brink: Phys. Lett., 40B, 37 (1972); N. Anyas-Weiss, J. Becker, T. A. Belote, J. C.
Cornell, P. S. Fisher; P. N. Hudson, A. Menchaca-Rocha, A. D. Panagiotou, and D. K. Scott:
ibid., 45B, 231 (1973).
5) T. Tamura and K. S. Low: Compo Phys. Commun., (in press).
6) S. Cohen and D. Kurath: Nucl. Phys., A101, 1 (1967).

19
4-4. • 14 12
Transfer Reactions Induced by N on C at 79 MeV
T. Motobayashi, 1. Kohno, S. Nakajima, M. Yoshie,
K. Katori, T. Mikumo, and H. Kamitsubo
Transfer reactions induced by 14N and 12C on (f-p) shell nucleP) and heavy nucleF) have
been reported previously. In these cases multi-nucleon transfer reactions showed only a "bump"
in the energy spectrum. Because of large level densities together with the rather poor energy
resolution (400 - 600 ke V) we could not see any transition to a certain level of the residual
en ...... C :::J o
U
200
100
E = 79MeV
Eh=10.3°
0.0 (312-)
.. . 2.3J "0-contom i
. N . . .1\ (112+~.· . . .. .. ... ~ ::: .... ~ ":.<" j '\.~..J }. . . , ... :.' ~~:: .. ,: . ., . ., ... " " ....• ,....... ( .. ~ .. ~. /. \
OL....-____ .':·:::i-•• ',: " '. ." ;/v..; ',: ..
Fig. 1. Energy spectrum of reactions 12C e4 N, I3C) 13N and 12C e4 N,
12C) 14N. lOA MeV and 13.2 MeV peaks in the reaction 12C
e4 N, 12C) 14N are expected to be populated due to the
excitation of both 14N and 12C(4A3 MeV 2+).

10 5 5
...:
If)
"-
.D
E
~ " ........ b "
0.5
0.1
0.0
5 a
12
C +
14N
79 M
eV
., .'.,
12C
(14N
,'3C
) 13
N
10 \.
\ .,
'-'a
\
.'. '.,
. '. ..... \
.' .... . .. \ ...
...... -. '. ' .
3.5
6
MeV
(5/
2+)
., ..........
.. ... '2
C('
4N ,
'3N
) 13
C
'. '._.-.
3.8
5 M
eV (
5jz+
) .,.
...\ \ ...
. '\ \ \ '+
-+ '+ \ +,,,
,
, .
.'./
12C(
14N
,'5
N)"
C
T"'
;,. '+
0.0
M
eV
'+'+-f--
+
St.
m,
Fig
. 2.
A
ngul
ar d
istr
ibu
tio
ns
of
on
e-n
ucl
eon
str
ipp
ing
reac
tio
ns
12C
C4N
, 13
C)1
3N a
nd 1
2CC
4N,
13N
)
13C
and
pic
k-up
rea
ctio
n 12
CC
4N,
lSN
)llC
.
0.5
\.-.\
0.1
12
C +
14N
79
MeV
Ela
stic
sc
atte
ring
V =
65
MeV
rR=
1.21
fm
OR
=0
.48
fm
W=
20
r=I.
35
0=0.
25
~ 0.
5
E
+,+-
+/+\
I'
~
........ ~
0.1
\ +
\ +,+ .
. +. J
T, ,,
+ \
l.., ....
.. •
+
'.
\
12C
( 14
N, 1
3C)
13N
+
\ \.-.
~ .. \ . ....
{\
'. i··
. /.-
.'. .
. '.
\ \,-
\ .r
+\
••
._.
\/
\ ,++
+\ +\
,+ \
,. ••
+
"-.'+
"
2.34
MeV
(1/
2+)
12C
( 14N
,'2
C)
14N
4.43
MeV
('2
C*
2+)
0.0
M
eV
0.5
0.1
a
Sc
.rn,
Fig.
3.
Ang
ular
dis
trib
uti
on
s o
f el
asti
c sc
atte
ring
,
on
e-n
ucl
eon
tra
nsf
er r
eact
ion
12 C
C4
N,
13
C)
13 N
(s 1
/ 2
),
and
tw
o-n
ucl
eon
tra
nsf
er r
eact
ion
12C
C4N
, 12
C)1
4N.
Fo
r el
asti
c sc
atte
ring
, so
lid
line
is
calc
ulat
ed u
sing
th
e o
pti
cal
po
ten
tial
of
Ref
. 7
.
N o

21
nucleus. We have done an experiment on transfer reactions induced by 79 MeV 14N on 12C, for
light nuclei having relatively low level densities. In the experiment 14N4+ beams provided by the
IPCR cyclotron were used. A L1E-E counter telescope was used to identify emitted particles.
Signals from the L1 E and E counters were processed by parallel analog-to-digital converters
(A.D.C.s). Signals from A.D.C.s were stored event by event on a magnetic tape using a DDP-124
computer. After the experiment, the data were analyzed by means of Goulding-type mass
identification formula. The target was of 12C self-supported foil about 70 pg/ cm2 thick. The
energy resolution was 350 - 500 keV.
(I) One-nucleon transfer reactions
The spectrum of the 12C C4N, 13C) 13N reaction is shown in Fig. 1. Like transfer reactions
on heavier nuclei, the peaks corresponding to low lying states of 13N are prominent. Angular
distributions of some one-nucleon transfer reactions are shown in Figs. 2 and 3. For the angular
distribution for the 2.34 MeV (1/2+) state in 13N excited by 12C C4N, 13C) 13N, its diffraction
pattern is out of phase to that of elastic scattering shown also in Fig. 3. The diffraction
modeP) indicates that this phasing is due to the even-L transfer, whereas the transfer reaction
by 14N is expected to populate the S1 /2 state with L = I, because ' the transferred proton is in
the P1l2 orbit of 14N. This discrepancy has been also found by the Berkeley group4) for the
12C C4N, 13N) 13C reaction through which the 3.09 MeV (SI/2) state in 13C (the analogue state
of the 2.34 MeV state in 13N) were excited.
(2) 12C C4N, 12C) 14N
The spectrum for the two-nucleon (d) transfer reaction is shown in Fig. 1. We can see
some selectively excited peaks even at higher excitation energies. This is very different from
the case of heavier targets. It is also remarkable that the 4.4 MeV state in 12C is strongly
excited. This means that d+12C (4.43 Me V) is more likely than d+12C (0.0 MeV) as the structure
of 14N or the coupled channel effect of the excitation of 12C (0.0 MeV) to 12C (4.43 MeV) is
important.
E = 79 MeV
30
14 ,7 (6+) ?
139( 4-t) ? . 1 ( 1 (41" )
Ex
0 6.04 6 .13 6.92 8.87 9.84
10.36
r Main (7) configuration
O-t OP-Oh 0+ 4P-4h
T TP- l h r 4P-4h 2- 1 P- l h 2-t 4+ 4P- 4h
~ 20
1
.1' : 1036 1:'~21 2' : " I~ .. !~9 .84 ' 6.1 3 (3- )
, "': ':'"' ',,' .\~II 'il(r) .6.04 (O-t ) 11.1 4+
o u
10
, . ...... '.' . .:.. .. J. .\ j ~2~\ ·1 .:;. -!::... :,.::::: .. ,:./;: ·-:-·r .<.- li!j .. I~\
'. '. '. : .•.. _ '::'.: :.' ~ .:1)\\':' , .... . ... ' .' ~ .. \ . ..,... .. .... 0 L-~10~0--------~~~2~0~0------------~3~0~0------------~~----~~--~~-
13.9 4i"
14.7 6-t (2P-2 h)
0.0 (0 +)
n
Chan nels
Fig. 4. Energy spectrum of the 12CC4N, I°B) 16 0 reaction. Excitation energies, J11" , and a
possible configulation8) of 16 0 are indicated.

22
(3) 12C e4 N, lOB) 160
The spectrum of the 12C e4N, lOB) 160 reaction is shown in Fig. 4. Many states in 160
were identified. Compared with other data on a-transfer reactions,s),6) the excitation of (4p - 4h)
states is rather weaker. This indicates that the e4 N, lOB) reaction is not so dominated by the
a-cluster transfer process as in case of (6Li, d) or e2C, BBe). Angular distributions for 6.05 MeV
(0+) + 6.13 MeV (3 - ) and 6.92 MeV (2+) +7.11 MeV (3-) (mainly 6.92 MeV) are shown in
Fig. 5.
References
0.5
0.1
~ 0.5 (/)
.........
.0
E
~ '-.. 0.1 b -0
0.5
o
+ + +
10
12C( 14N, 108) 160
ELab =79MeV
+ .++ +
Ex~7MeV
(2++ 1-)
+ + + .". + ' ••• '
20 30
Bc.m .
Fig. 5. Angular distributions of the 12Ce4N,
IOB) 16 0 reaction.
1) I. Kohno, S. Nakajima, I. Yamane, M. Yoshie, M. Odera, and H. Kamitsubo: IPCR
Cyclotron Progr. Rep., ~, 23 (1972).
2) T. Motobayashi, I. Kohno, S. Nakajima, M. Yoshie, K. Katori , T. Mikumo, and H. Kamitsubo:
ibid. , 2, 32 (1973).
3) K. R. Greider: "Nuclear Reactions Induced by Heavy Ions", North-Holland, Amsterdam,
p. 217 (1970).

4) R. M. de Vries, M. S. Zisman, J. G. Gramer, K.-L. Liu, F. D. Becchetti, B. G. Harvey,
H. Homeyer, D. G. Kovar, J. Mahoney, and W. von Oertzen: Phys. Rev. Lett., 32, 680
(1974).
5) K. Meier-Ewert, K. L. Bethge, and K.-O. Pfeiffer: Nucl. Phys., A110, 142 (1968).
23
6) G. J. Wozniak, H. L. Harney, K. H. Wilcox, and Joseph Cerny: Phys. Rev. Lett., 28, 1278
( 1972).
7) I. Kohno: Sci. Papers I. P.C.R., 68, 38 (1974).
8) G. E. Brown and A. M. Green: Nucl. Phys., 75, 401 (1966).

24
4-5. Analysis of Elastic Scattering of 160 by 19F
T. Motobayashi and B. Imanishi
When there is a large probability for a nucleus B to be represented as a composite of two
nuclei a and c, an exchange of the nucleus a is expected to be very important in the interaction
between Band a. l) We analyzed elastic scattering of 160 by 19F by the coupled channel method2)
considering the exchange process of 160-core. In this analysis the FACOM 230-75 computer of
I.P.C.R. was used.
If we consider only the direct and transfer channel , and also neglect the spin-dependent
force , the total wave function of anguler momentum L is written as
where rand R represent the co-ordinate vectors between B and a, and between band c,
respectively (Fig. 3) , and r = 1 ~ I ' N is the number of constituent nucleons of core a or b, and
a (- 1 )N-factor appears through the exchange of the nucleus a and b. Substituting this wave
function into the equation ,
we obtain the equation for u(r) ,
f E- (-~~ +~ L (L + l ) + U(r)) } u(r) 1 2 f.1. dr2 2 f.1. r2
+ {E_ (_~~+LL (L+ l ) + U (r))} 2 f.1 dr2 2 f1 r 2
\ d ' K(l ) , J r ( r , r )u ( r ' )
\ '{ ( 2 ) U K (1 ) ' } (' ) 0 + J dr K (r, r ' ) - ( r ) ( r, r ) u r = , (1)
where
K (1 ) ( r, r ' ) = ( _l )N Jrr ' ~ dr dT' ¢ ( r, R )¢ ( r; R' )
K (21(r,r' ) = (- 1 )N Jrr , ~dr dT' ¢ ( r , R ) ! Vab (x ) + Vac (R' ) }¢(T',R) ¢ (r,r' )
and J is the lacbian for co-ordinate transformation (f, R) to (f, r'), and U(r) is the optical
potential between Band a. K(2)-UK(l ) is the exact DWBA form factor in the post-form, and
K(I) is called non-orthogonal kernel. As K(l) and K(2) in Eqn. (1) are both non-local operators,
it is time-consuming to solve it for computer calculation. We have first made the calculation of
heavy ion approximation (H.I.A.) which is not so time-consuming. In order to consider the
effect of K(1) to some extent, we solve the equation for vCr) obtained by the transformation
v = y' I + K( 0u. If the terms of the order (K(I))2 or higher are neglected, the equation of

. ........ .. +' • ... -+-.
O.S
H.l. A.
~. + - •.• ~ 21.4 MeV
+ + +-+-+-+----Optictical potential
V =SO MeV O1F0.444fm W = 10 MeV 0r= 0 .360fm rR = 1.3Sfm rr = 1.37 t m
~ O.S "- V\:::ev b
0 .1 ~------~~----------
OOS bound state (160 + t )
- 1.3 fm o=0.7 f m (c.f. p. =O.S )
--- - 2.0 fm O=0.6Sfm ( cf. p. = 0.2 )
0 .01~-----------~~~r-~~·
30 60 90
8c.m.
Fig. 1. Angular distributions at E = 21.4, 25.8,
and 32.0 Me V. The parameters of the
optical potential are decided so as to fit
to the data of forward angle scatterings
where the transfer process is negligible.
b
Fig. 3. Co-ordinate vectors of the
system. In our case , c is
tri ton, a and b are both
160, and B = (c+b) = (c+a)
is 19F.
25
Recoi I effect
- Wi th re co i I
--- H.l. A .
O. S
O. I I--------------~~-----
8 c.m.
Fig. 2. Full recoil calculation (solid lines) is
compared with H.I.A. calculation (dashed
lines) . For each case the same value of
coefficient of fractional parentage is used.
O.S
O.S
Coupled channel (H.IA )
2S .8 MeV
bS( r=llfm _ ................... -~, a =08 1m
.... ViS = 66 MeV ....... cf p =04
\ .'. ~ ... - ---no couple
\ .v..\ (\; .. ~
8 c.m.
Fig. 4. Angular distributions of elastic and inelastic
scatterings obtained by the coupled channel
calculation. The calculated values of the
inelastic scatterings are multiplied by 20.

26
H.I.A. is [ E - {_L~+L L (L+l) +U(r)
2 f1 dr2 2 f1 r 2
+ 1 (K (post) + K (prior ) \ )]V(r)= 0 J l + K (l ) 2 J J l + K (l) ,
where K(post) and K(prior) are exact no-recoil DWBA form factors in the post· and prior-form
respectively.
The cross sections of H.I.A. calculated are compared with the data in Fig. 1. Data at 32
MeV were obtained by Kyoto University group ,3) and data at 21.4 and 25.8 MeV were obtained
using the tandem Van de Graaff accelerator at the University of Tokyo. In this calculation 19F
is considered to be 160+t, and the potential of Woods-Saxon type was used for the interaction
between 160 and t. Two kinds of parameter-sets (which were chosen to reproduce the binding
energy of 19F) were used for this potential, and both sets gave good fits to the data. This
indicates the importance of 160-core-exchange process and the insensitivity of the nuclear interior.
Coefficients of fractional parentage (c.f.p.) for 19F = 160+t obtained are in good agreement with
the results of the LCONO method obtained by the Hiderberg group.4)
However, a full recoil calculation for solving exactly the Eqn. (1) gives a conclusion different
from the result of H.I.A. In Fig. 2 the results of full recoil calculation are compared with that
of H.I.A. This indicates that the calculation of H.I.A. overestimates the transfer amplitude. This
strong recoil effect is due to the fact that the transferred particle (triton) is rather heavy
compared with the case in which the transferred particle is a nucleon. 5)
We also have calculated the cross sections for the inelastic scatterings by the coupled channel
method (H.I.A.). We took into account the couplings between the ground state 0/2+), the
0.2 MeV-state (5/2+) , and 1.5 ~1eV-state (3/2+) of 19F. These states are assumed to have the
C60+t)-structure, and two kinds of the reaction process were considered. One is the inelastic
process arising from the excitation of 19F by the interaction between triton in 19F and projectile 160. The other is the transfer process in which triton is transferred to projectile 160 to form
the excited state of 19F. The results are shown in Fig. 4. Though the diffraction phase is the
same as that of the experimental results, the absolute value cannot be reproduced by the
calculation above (the calculated value is about 20 times smaller than the experimental value).
References
1) G. M. Temmer: Phys. Lett., 1, 10 (962); W. von Oertzen: Nucl. Phys., A148, 529 (970).
2) B. Imanishi: Proc. of Symp. on Heavy-Ion Scattering at Argonne, .ANL-7837, 295 (971).
3) K. Fujii et al.: Private communication.
4) A. Gamp, H. G. Bohlen, M. Feil, N. Marquardt, W. von Oertzen, and R. L. Walter: Proc.
of Symp. on Heavy-Ion Transfer Reactions at Argonne, Argonne Physics Devision Informal
Report, PHY -1973B, 503 (1973).
5) B. Imanishi, H. Ohnishi, and O. Tanimura: Proc. of Conf. on Reactions between Complex
Nuclei, 1, 25 (974).
27
4-6. DWBA Analyses of One-nuc leon Transfer Reactions Induced
by Heavy Ions on the N = 28 Target Nuclei
S. Nakajima, 1. Kohno, and M. Yoshie
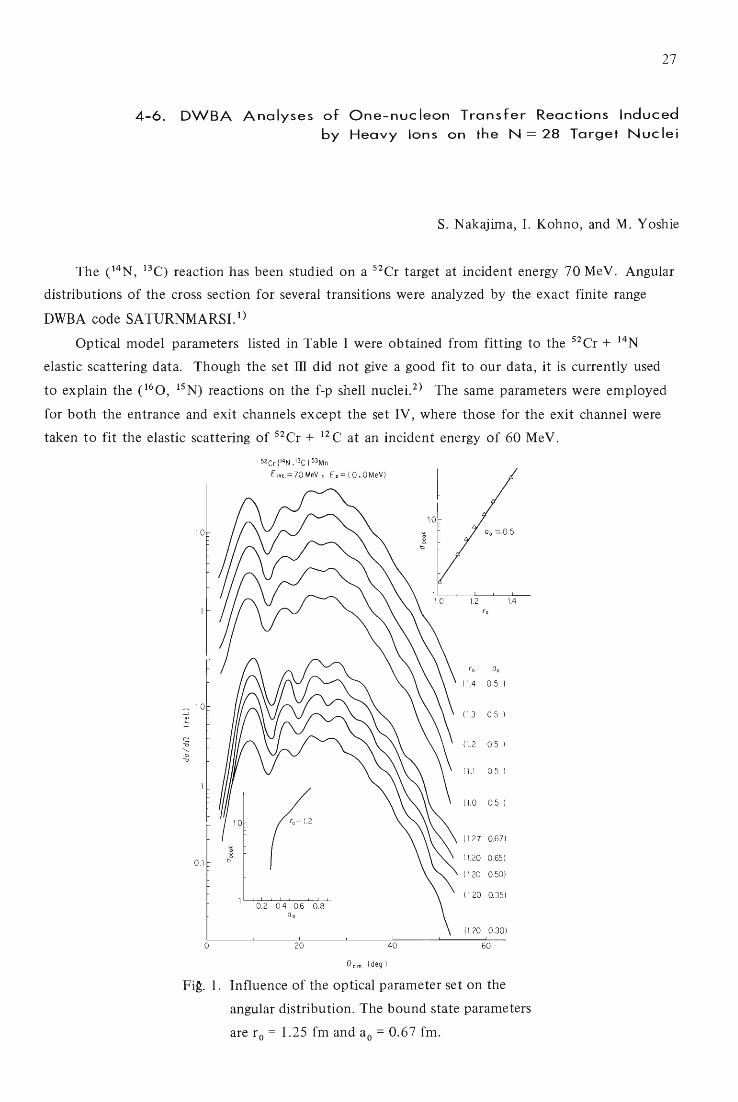
The e4N, 13e) reaction has been studied on a 52Cr target at incident energy 70 MeV. Angular
distributions of the cross section for several transitions were analyzed by the exact finite range
DWBA code SATURNMARSI. 1)
Optical model parameters listed in Table 1 were obtained from fitting to the 52Cr + 14N
elastic scattering data. Though the set ill did not give a good fit to our data, it is currently used
to explain the ct6o, ISN) reactions on the f-p shell nuclei. 2 ) The same parameters were employed
for both the entrance and exit channels except the set IV, where those for the exit channel were
taken to fit the elastic scattering of 52Cr + 12 C at an incident energy of 60 MeV.
52Cr(14N .13C) 53Mn
Einc. =70MeV, E(=(O.OMeV)
10
1.2 1.4
ro 0 0
114 0,5 )
., 11.3 0.5 ) -~ 11.2 0.5 ) 't)
.......
.g III 05 )
11.0 0,5 )
11.2 7 0.67)
0 .1 11.20 0.65 )
11.20 0.50)
1120 0.35) 0.2 04 0.6 0.8
0 0
11.20 0.30)
0 20 40 60
e c,m. I deg )
Fi~. 1. Influence of the optical parameter set on the
angular distribution. The bound state parameters
are ro = 1.25 fm and ao = 0.67 fm.

28
Table 1. Optical model parameter sets used in calculation.
V W rR rl aR aI (MeV) (MeV) (fm) (fm) (fm) (fm)
Set I 60.0 8.0 1.02 1.18 0.70 0.52
Set ill 100.0 40.0 1.22 1.22 0.49 0.49
Set IV { entrance 60.0 11.1 1.02 1.18 0.70 0.52
exit 60.0 18.25 1.04 1.18 0.78 0.56
Set V 100.3 40.1 1.12 1.09 0.52 0.56
The results of DWBA calculations using these parameters are shown in Fig. 1. The proton
bound state wave function was obtained from a Woods-Saxon potential with r 0 = 1.25 fm and
ao = 0.67 fm. The results of DWBA calculations were highly sensitive to the choice of these
parameters. The set IV reproduced satisfactorily the experimental angular distribution in shape
but its magnitudes were more than 5 times as large as the experimental values. As is shown in
Fig. 2, it is possible to reduce the absolute strength by using smaller bound state parameters.
52Cr(14N,13C )53Mn
E,nc .= 70MeV , E.=(O,OMeV)
10
0.1 , " ill
o 20 40
Bc.m (deg .)
Fig. 2. Influence of changing the bound state
parameters on the angular distribution.
The optical potential parameter set IV
was adopted in calculation.
60

On the other hand, the set ill reproduced proper magnitudes with the standard bound state
parameters (r ° = 1.25 fm, ao = 0.67 fm). Contributions of the interior of nucleus to the results
of calculation seems of different degree for the set III and IV.
Experimental results have been obtained also with the targets of 50Ti and 54Pe. Analysis of
these data is going on.
References
1) T. Tamura and K. S. Low: Private communication.
29
2) H. J. Korner, G.C.Morrison, L. R. Greenwood, and R. H. Siemssen: Phys. Rev., C7, 107 (1973).

30
4-7. long-Range a-Particle Decays and level Structure of · 216Ra
T. Nomura, K. Hiruta, M. Yoshie, H. Ikezoe,
T. Fukuda, and O. Hashimoto*
We have studied the level structure of 216Ra by means of in-beam spectroscopy for
long-range a-particle decays and 'Y-rays following the 2osPbe 2C, 4n) and 207Pbe 2C, 3n) reactions
and established the level sequence up to 11- (possibly 14+), including a 7 nsec isomer with spin
8+. Short-lived a-particle decays were observed from 4+, 6+, 8+, and 10+ states; their reduced
widths were estimated from the branching ratios of a- to 'Y-transitions.
-r--- (14 +)( 329l.3 )
: 344.3
• -T - - - (12 + ) (2947.0 ) I I I
612.9
11 - 2334.1
309. 1 10 + 2025.0
314 .6
203.5 8 + 1710.4
6+ 1506.9 11.593 (0.12 )
343 .5 11.270 (0.88 ) 4 + 1163.4 11 . 061 ( 0 . 58 )
475 .5 10 .723 (0.23 k
2+ 687.9 9.765 (0.98 ) F 9 . 559 (100 )
Qa ( r a j rtotal ) 0 + 0
MeV fir) 216Ra
Fig. 1. A decay scheme of 216 Ra established in this
work. The level sequence of 212Rn is taken
from Ref. 1.
* Institute for Nuclear Study, Tokyo University
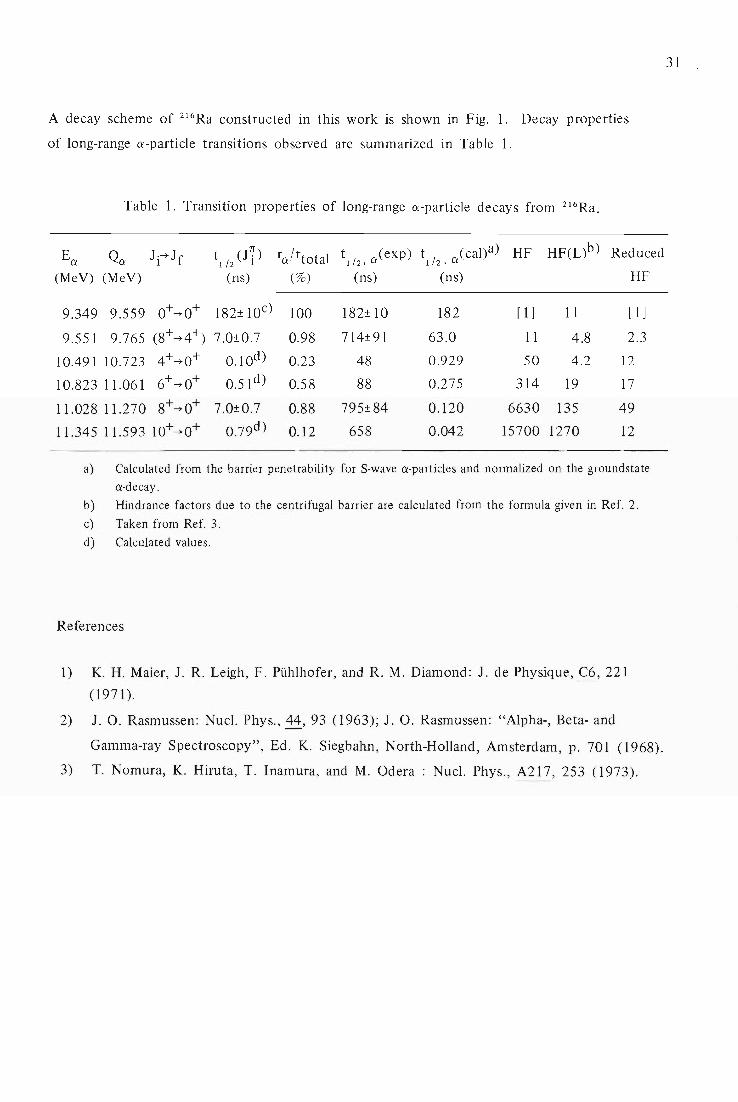
A decay scheme of 216Ra constructed in this work is shown in Fig. 1. Decay properties
of long-range a-particle transitions observed are summarized in Table 1.
Table 1. Transition properties of long-range a-particle decays from 216Ra.
Ea Qa Ji~Jf t1 /2 (1i) ra/rtotal t / a(exp) 1 2, t (cal)a) I12, a HF HF(L)b) Reduced
(MeV) (MeV) (ns) (%) (ns) (ns) HF
9.349 9.559 O+~O+ 182± 10c) 100 182± 10 182 [ 1 ] 11 [ 1 ]
9.551 9.765 (8+~4+) 7.0±0.7 0.98 714±91 63.0 11 4.8 2.3
10.491 10.723 4+~0+ 0.10d) 0.23 48 0.929 50 4.2 12
10.823 11.061 6+~0+ 0.51 d) 0.58 88 0.275 314 19 17
11.028 11.270 8+~0+ 7.0±0.7 0.88 795±84 0.120 6630 135 49
11.345 11.593 10+ ~O+ 0.79d) 0.12 658 0.042 15700 1270 12
a) Calculated from the barrier penetrability for S-wave a-particles and normalized on the groundstate a-decay.
b) Hindrance factors due to the centrifugal barrier are calculated from the formula given in Ref. 2.
c) Taken from Ref. 3.
d) Calculated values.
References
1) K. H. Maier, J. R. Leigh, F. Pilhlhofer, and R. M. Diamond: J. de Physique, C6, 221
(1971).
2) J. O. Rasmussen: Nuc!. Phys., 44, 93 (1963); J. O. Rasmussen: "Alpha-, Beta- and
Gamma-ray Spectroscopy", Ed. K. Siegbahn, North-Holland, Amsterdam, p. 701 (1968).
3) T. Nomura, K. Hiruta, T. Inamura, and M. Odera : Nuc!. Phys., A217, 253 (1973.).
31

32
4-8. Angular Distributions of long-Range a-Particles Emitted from
High Spin States in 216Ra and Statistical Tensors
T. Fukuda, T. Nomura, W. Kutschera, and K. Hiruta
In a preceeding paperI), we have shown that high-spin states in 216Ra decay with a-particle
transition in competition with ),-ray emission. Angular distributions of these a-particles must
be governed by the high rank of statistical tensors like· P6 and Ps, and therefore are expected
to give more complete information on the nuclear alignment produced by nuclear reactions,
which can hardly be obtained by ),-ray angular distribution measurements.
Angular distributions of a-particles from J+ (J = 4, 6, 8: 216Ra) -+ 0+ e12 Rn) transitions
were measured from 6° to 90° in the 207PbC 2C, 3n) reaction at Ec12 = 72 MeV. Figure I shows
the angular distributions normalized to the yield of the ground-to-ground decay whose angular
distribution must be isotropic. The angular distribution of the 8+ -+ 0+ a-particle transition
can be written in the following way:
W ( e) ex L P k ( J = 8) b k (L = 8) F k (0 L L) P k ( cos e) k
2.5
I I _2 .0
o§
t I 8+-0+
>- 1/ L 0
-e 2 1.5 -0 I I a; >-
Cl> 6+- 0+ >
I / "'(:; a; 1.0 0:: I I
I I 4+-0+
/ : 0.5 I I I
I I j I I I I 0~-L~2~0~~~40~~~6~0--~~80~~
e (deg.)
Fig. 1. Angular distributions of a-particles
from the 4+, 6+, and 8+ states in
216Ra.

33
where the notation is conventional (bk is the particle parameter for a-transition with angular
momentum L = 8). It should be noted that the angular distributions for 4+ --* 0+ and 6+ --* 0+
can be expressed using the same statistical tensors because they are populated by the E2
-y-transitions following the -y-decay of the 8+ state!)
The statistical tensors for the 8+ state yielded from a preliminary analysis of
wee: 8+ --* 0+) is given in Table 1. A more accurate analysis is now in progress.
Table 1. Statistical tensors for the 8+ state.
Ps PIO
-0.762 ± 0.025 0.562 ± 0.035 -0.234 ± 0.045 0.065 ± 0.054 - 0.012 ± 0.053
Reference
1) T. Nomura, K. Hiruta, M. Yoshie, H. Ikezoe , T. Fukuda, and O. Hasimoto IPCR
Cyclotron Progress Report, 8 30 (1974) -,

34
4-9. 3 3 3 3 / 3 . 13
The (He, He), (He, He), and ( He, Q:') Reactions on C
T. Fujisawa, H. Kamitsubo, T. Wada, M. Koike
Y. Tagishi, '* and T. Kanai
Differential cross sections of eHe, 3He), eHe, 3He'), and eHe, a) reactions on 13C have
104
L -+-' (f)
-...... ...a E ~ 10 2
~ "b -0
101
10
°
o o
£> 0
°0
o
00 o a
o o 0
• 29.2 MeV
.. 34.7 MeV
• 39.6 MeV
.. -. . ...
... . . . ...... .. . .
ec.rn .
.
. .
. . .
.. .....
. .
..
........
....... . . . .......... . .....
Fig. l. a) Elastic scattering. The open mark indicates the cross section obtained from
subtracting the estimated yield of the elastic scattering on 12 C from the overlaped
yields of the elastic scatterings on 12C and 13C.
* Tokyo Univ. of Education

13C(3He ,3He') 13C
3.09 MeV state
. . . ,
+ , ·u,! ,.
'ii' .. J~ ! ! !,+tt+++,' +','
f~t +
.... ~
,~t tt U H t . . t . . t t
t f
10-1-
• ! ,··-tt f ! +'tnt, m,
tt T
IO~~O----~3~0~O----~~----~-----1~2-0-0
L +-' if)
'-
-El0-1
~ "-.. b "b
e c.rn.
b) The 3.09 MeV 0/2+) state of 13 c.
"
13C (3He, 3He') '3C
6 .73 MeV sta te
+- ++ +4 H · t t t . ~ t
t t
; T 1 , .
10'
10°
~101 ......... ...0
E
c::: "b "-..
.g 10°
10-1
10'
13 C ( 3 He, 3 H e') 1 3 C
I·. 3.68 MeV state + 3.85 MeV state
. . . .. . -.......... .
a.- •••••••• ..... .
35
.. . . . . . . . .
...
.............
. .... ..
.. ~ ... ........
e •••••••
.................. ............. .. ..
.. ...... ...
e c.m.
.. ...
.. ..
-. . ... ... .. .
c) Sum of the 3.68 MeV 0/2-) and 3.85 MeV
(5/2+) states of 13C.
13C( 3He, 3He') 13 C
7.50 MeV state + 7. 55 MeV state + 7. 68 MeV state
..... . . ..1 .. . ... . ... - ..
I ••••••••••
.... ......
... . ..... .
................ ........
. . ..... -... -. ....
...........
.... ~ ........................
.. . . . .. . .
1 0-~L:-o-----=3~0-=-o -----=6~O-=-o ------::9:-::0-=o-------;1~2:::;-O;;--o lvO~O----~3=0~O--~6~0~O ----~9~0-=-O ----~12:-::0-=O-----::1~5:::;-0~O--~180°
e c. m. Sc.m.
d) The 6.87 MeV (5/2+) state of 13C. e) Sum of the 7.50 MeV, 7.55 MeV and 7.68 MeV
(3/2+) states of 13 C.
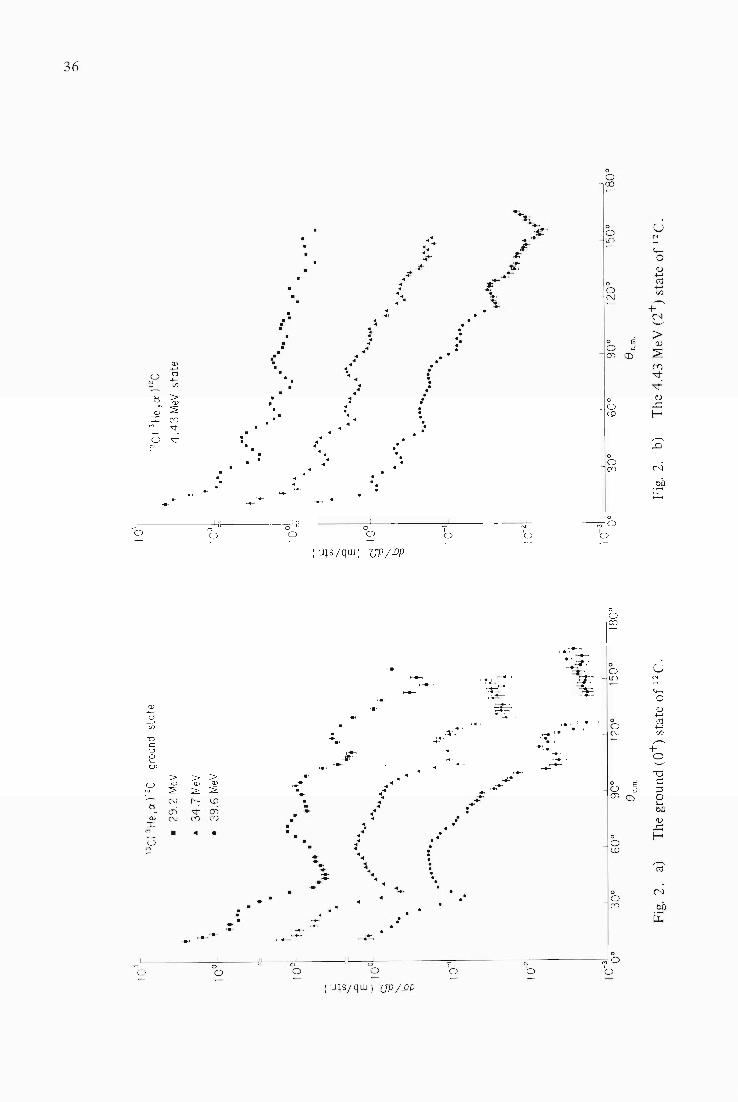
Fig. 1. Angular distributions of the differential cross sections of the 13CeHe, 3He)13 C
and 13 Ce He, 3 He/ )13 C reactions.
101
13C(
3H
e,a
)12C
gr
ound
st
ate
• 29
.2 M
eV
, T
100
l ,
1 Oo~
\
.&
34.7
MeV
• 39
.6 M
eV
" ...
t --
. H
"
• ,i
.
• I"
, ••
' ,
b 1
· u"
'
U>
• ~
j
~ at
f '
,'.
rl 10
'
....
~...
'"
'-.
••••
I
-0
£ "'-..
• .£.
b U
b -
t ~
10-1
. . . .....
.... .
.. ... ..+
• tf
+
t tt
t t
+ ,
, !
T
t
'h
t jlffi W
\ '+ '!
10-2
~
! t ! !!
\ P
t
f Ht
II r~f
f# ij f
1 O-~o
I 1
1 1
30
0 6
00
900
1200
a c. m
.
Fig
. 2.
a)
T
he g
roun
d (0
+)
stat
e o
f 12
C.
101 I
! ,
100 1
J II .b
T
U
>
........
. .n
E
~
~
100
~
'-.. .g
10-1
10-2
' ...
I· • . . .. ..
13C(
3H
e ,e
x )12
C
4.4
3 M
eV
stat
e
.. . .
... .....
. ...
.... . . .
. ... .
••
.AJt
. ..
.. -..
....
..
.....
...
A. .
.
••
£
... .. ....
........
.... .. .....
........
.......
. ..
l£ ...
.....
.. ·f.
• n·
tttt
tt
!
4 ~, •
••
'f •
f.
t...
... ~t
!'f
'T"t
t tt
t++/
10- 6
0 310
0 60
0 90
0 12
00
1500
18
00
a c. m
.
Fig.
2.
b)
The
4.4
3 M
eV (
2+)
stat
e o
f 12
C.
W
0\

-..:
-+-'
(f
)
........
Ll E
10°
10-\ IJ
~ 1
0-\
~
.g 1 0
-2
10-
3 -4
10
0"
lij 11!!+'
!o 1_,
rtf.t
. .. A •
. A
t ,
t
ii, T 13
C(3
He,
cx)'2
C
7.66
MeV
st
ate
!t+!
+
! +
!
f f/H
++
lA,A
++
~ T
+
• +
H
t +
+
+
+
,'H H
II
Il I I
I
lit!!
fI!!~ ! II j
30
0 6
00
90
0
Bc.
rn.
+tf~
120
0
t !!j!
~1 150
0
Fig.
2.
c)
The
7.6
6 M
eV (
0+)
stat
e o
f 12
C.
~
......
(f)
........
Ll E
~
10°
10-\
10-\
~ 1
0-\
t:>
"1:J
10-2
+ !
f Itl
13C(
3H
e ,e
x) 12
C
9.6
4 M
eV
stat
e
• !+
i • I, +
' +
i !' +
j • •
;
f i! +
+
, ..
• T'
...
+ I
f
f t
t A.·
·U •
.. ft
·Hh
tf f
*++++
+f
4+
'tf /1
tt
;+,+
H
tt!,
+,
,
!tH
+
,ff
!tttfH
t f f t
t t
t !'t+
it' f
;tt
+!+r
'f
10- 00
3'0
0 61 0
0 91 0
0 12
00
150
0 18
00
B c.
rn.
Fig.
2.
d)
The
9.6
4 M
eV (
3-)
sta
te o
f 12
C.
w
-...
)
38
f)
• ,
..
.. . .
.. .. .
.
13 C( 3He , 0')12 C
12. 7 MeV state
•• J' ••• . ..
. . .... ..... . . .. . . . . . .
........... • .& .............. ..
......
.... . . .. . ......... . .. .. . ..... . ...
10-2
0~o.----,3~0~o.---~60noo----~9~0~o----~1~2~0~o----~~----180°
e c. rn .
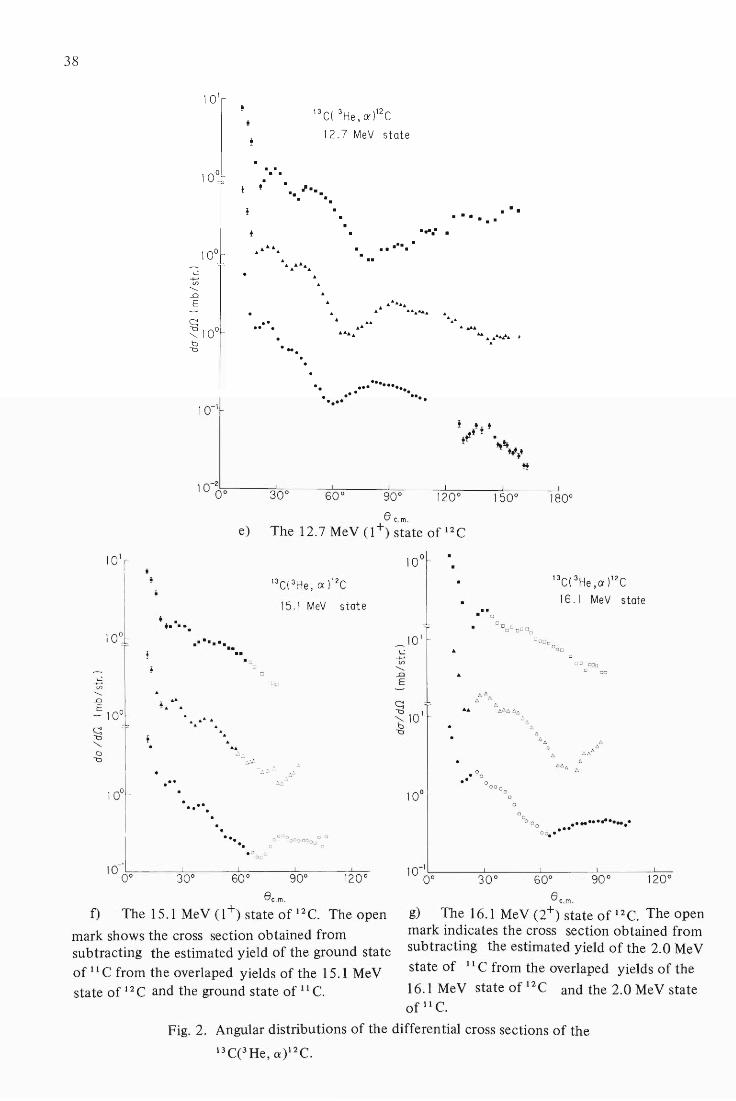
e) The 12.7 MeV (1+) state of 12C
13 C{3H e, ex )12C
15 .1 MeV state .. • 0
13C{3He,cx)12C
16.1 MeV state
+ • + ••••
.... t.. ..
.. . .
. -... -. ..
... .... ... .. ..
.... .
..
. .
....
o • 0
•• 0
00°0
o
O D 000
o DO
o o 0 00 ................. .
I
..... 0000000 0 000°0°
. 0 0 0 0
1 0-~~o~--~3~!0~O~--~60~O~--~9~!0~O-----1~2-0-o
00._
Scm . Sc.rn.
The 15.1 MeVO+)stateof I2 C. The open g) The 16.1 MeV(2+)stateof I2 C. The open
mark shows the cross section obtained from subtracting the estimated yield of the ground state
mark indicates the cross section obtained from subtracting the estimated yield of the 2.0 MeV
of 11 C from the overlaped yields of the 15.1 MeV state of 12C and the ground state of 11 C.
state of II C from the overlaped yields of the
16.1 MeV state of 12C and the 2.0 MeV state of 11 C.
Fig. 2. Angular distributions of the differential cross sections of the

39
been measured at incident energies of 29.2, 34.7, and 39.6 MeV in order to study the mechanism
of these reactions. The angular distributions of the differential cross sections are shown in
Figs. I and 2. The experimental procedure of the study was reported previously. 1)
Reference
1) T. Fujisawa, H. Kamitsubo, T. Wada, M. Koike, Y. Tagishi, and T. Kanai: IPCR Cyclotron
Progr. Rep., 7, 46 (1973).

40
4-10. 16 3 17
A Study of Resonance States Induced by O( He, d) F and 28 3 29 .
Si ( He, d) P Reactions
K. Koyama, N. Nakanishi, H. Yokomizo,
S. Yamada, and H. Ohnuma
Recently the study of stripping reactions leading to unbound states have been improved
very much, particularly on the theoretical treatment in the framework of the DWBA. An
interesting object of this study is the possibility of comparing the unbound form factors with
those extracted from the resonance reactions, which may be a cross check to the mechanisms
of these two different types of reactions.
Differential cross sections were measured on the reaction 28SiCHe, d)29P at an incident
energy of 29.3 MeV and the reaction 160CHe, d)17F at 41.5 MeV. The 28Si target was
a self-supporting foil of natural silicon with thickness of 1.98 mg/cm2 which was prepared by
vacuum evaporation. The 160 target was of gas type. Two gas chambers were prepared; one
had 5 J,Lm nickel foil windows, the other had 3 J.Lill Havar foil and 0.5 mg/cm2 Mylar foil windows,
and gas pressures were 365 Torr. and 260 Torr. respectively.
CI> C C C
L U
2000
1500
...... 1000 '" -+-' C
'" o U
500
1500
lo)
~ o
~ 1000
28 S j( J He,dl 29p
E3He = 29.3 MeV
BLob. = 15° '" c => o
U
( b)
160! 3He,dl l7 F
E3He=41.5MeV
BLab. = 17.5°
200 400
1200 I 1400
Channel number ,I I
"
600 800 1000 1200 1400 Channel number
Fig. 1. Typical spectra of deuteron from the reactions 28SiCHe, d)29 P and 160CHe, d)17F.
15
10
5
~ ~
>< Lu
0
5

Table 1. The optical potential parameters for 3He and deuteron.
The notations are
v r a
3He + 28Si 151 1.11 0.73
3He + 160 185 1.18 0.56
d + 29p 80 1.15 0.81
d + 17F 79.3 1.15 0.81
Vso rso a so
3He + 28Si 6.4 1.28 0.41
3He + 160 4.5 1.3 0.6
d + 29p
d + 17F
1 0°,---------------------------~
160(3 He ,3He)160 ..
of.
\ 0-2 0~o--~~~3~0~o~--~~6~0~o~--~~90~O
Sc.rn.
Fig. 2. The angular distributions of 3 He
elastically scattered from 28 Si
and 16 0. The curves are obtained
by an optical model calculation.
the same as used in Ref. 1.
W
24.8
8.17
rc
1.25
1.3
1.4
1.4
rw aw
1.60 0.756
1.67 1.46
102
wD
2.1
20
20
rD aD
1.0 0.86
1.34 0.68
1.34 0.68
1. 78MeV 2+
(6.05 MeV 0+ 6.13 MeV T
(6.92 MeV
7.12 MeV . . . Sc.rn.
Fig. 3. The angular distributions of 3 He
inelastically scattered from 28 Si
and 16 0. The curves are obtained
by a DWBA calculation using
macroscopic form factors.
41

42
10'
10°
10°
10'
~ ~ 10° .0
E
10°
10-1
10-2
10-300
Fig. 4.
10'
28 S i (3He , d) 29p
E3He = 29.3 MeV
10°
3.\0 MeV 5/2t-
• 0.0 MeV 1/2+
+ • + 10'
3.43 MeV
t
1.36 Wev 3/2+ t + + 4.08 MeV
+ t c.: '+ (3 /2 - ) ~1O-1 f + ~ t t + , .D E
I
ttl t t 1. 96 MeV 512+ t
10 '
+ 3/2-
f t t t t t t 2.4 MeV 3/2 + 10°
liZ-\ • • 5.75 MeV
t t + +\ t j t tt +t t ~Mev
j j 3/2+
ttf j +~ 10-1
6.33 MeV (512+)
10-2
30° 90° 0° 30° ec.m. Bc.m.
The differential cross sections of the reaction 28 SiC He, d)29 p. The curves
are obtained by a DWBA calculation. For the resonance states (higher
energy states than 2.745 MeV), we used loosely bound form factors.
t t 90-

43
The energy spectra of deuteron, helium-3 and a-particles were measured by using an ORTEC
particle identification system. Typical energy spectra of deuterons are shown in Fig. 1. Figure
2 gives the angular distributions of 3He elastically scattered from 28Si and 160, and the curves
are obtained by an optical model calculation using the code "SEARCH", 1) the parameters being
given in Table 1. Figure 3 shows the angular distributions of 3He inelastically scattered from
28Si and 160.
~ '--D
E
10 2c----------------,
10°
10 1
.\
\ \ \. \,
. , . \~+ '. g.,,-
. .
.. ,
\
••••• r
2 5.7MeV
.. ~ 1 I J. I 10 - Os,-o --'---------'----::-'-:30=0 ------'----.j -----"-Or-
T------c-
6L-oo--l.--.J
Bc.m
Fig. 5. The differential cross
sections of the reaction 16 0
e He, d)17P. The curves are
similar to those of Fig. 4 .
The resonance states are
higher energy states than
0.601 MeV.
Figures 4 and 5 show the differential cross sections of the reactions 28SieHe, d)29P and 160 eHe, d) 17F, respectively. The solid curves of Figs. 3, 4 and 5 give preliminary predictions
obtained by a DWBA calculation using the code DWUCK with a computer TOSBAC-3400.
For the resonance states, we used loosely bound form factors. The optical potentials of
deuteron were deduced from C. M. Perey and F. G. Perey's formula,2) and they are given in
Table 1. Calculations using resonance form factors are now in progress.
References
1) T. Wada: IPCR Cyclotron Progr. Rep., ~, 87 (1968).
2) C. M. Perey and F. G. Perey: Nuclear Data Table, .!1, No.4, 293 (1974).

44
4-11. 58,60,62, 64
N· (3
H d) 59, 61, 63,65 . d
I e, Cu Reactions an
the Correlation between Unbound States and
Resonance States
R. Sakaguchi, M. Nakamura, S. Takeuchi, *
N. Nakanishi, and S. Takeda**
Particular interest in stripping reactions to unbound states was recently initiated by papers1)-3)
reporting anomalies in eRe, d) and (d, n) reactions. In spite of remarkable progress thereafter
in the theoretical treatment4 )-6) on one-nucleon transfer reactions to unbound states, it has not
been established to use this reaction as a spectroscopical tool, because of the uncertainty in
treating the continuum background, which is observed at the enhanced unbound state peak in the
energy spectrum of emitted particles. The final state selectivity due to the direct reaction
mechanism is, however, effective in these reactions if we choose the incident beam energy high
enough, and this selectivity gives us useful information about the structure of resonance states
found in (p, po) and (p, p') reactions on the same target.
3Re-beams of various energies between 22 and 47 Me V from the Cyclotron were bombarded
on the Ni-isotope targets and emitted deuterons were measured with a 6E - E counter telescope
and a Goulding type particle identifier. Figure 1 shows typical deuteron spectra in eRe, d)
IJ') ..... c :;J
o <..)
Excitation energy
a) 6°NieHe, d)61 Cu, e Lab = 25° , E3 He =
35.5 MeV
IJ') ..... c :;J
o <..)
30 Excitat;on energy
b) 62NieHe, d)63 Cu, e Lab = 30°, E3He = 35.5 MeV
Fig. 1. Typical deuteron energy spectra obtained in e He, d) reactions.
* Department of Physics, Kyoto University
** National Laboratory for High Energy Physics

10
10
58 N i ( ?' , d ) 59CU
10-
/70 Er =29.317MeV 40.0 MeV '" / \!
\ \ Experi ment al . 0
\ DWUCK -, (Pre lim inary) , ! , ~ \ 00 MeV 3/2-
\vI\ ': I \ / \ \ \ I \ 10 0 \ Q 1 \
,"" \ Q 0 \ I J
\ _,1/\ QI,/V\ \
Q Q Q \ \
101-
Q \ \ :g \ "-
d\ I E ~/
1Or-
II-
eC. m.
58Ni (T, d) 59Cu
I I I I
Er = 29 .317MeV 40.0 MeV Experimental. 0
DW UC K ( Preliminary)
! ! 3.586MeV(lp= 2) [
3.558 MeV
Q 3.629 MeV
Q !.
! Q 0
o
3.90 I MeV (fp= 1 ) I.AS af 59Ni (g.5.)
f
t J J
t Q !
! Q I.
o
o
o I
o
o
o Q Q
ott
o
[
4.267 MeV Q Q *4.313MeV (Pp=3) *4. 362MeVtj1p = I)
* l. A. S ot 59 N i
I I I
10° I
Fig. 2. Measured angular distributions in the 58 NiC He, d)65 eu
reaction. Optical potential parameters used to calculate
-
-
-:::
-::
the DWUCK are V R = 89.0 MeV, rR = 1.15 fm, aR = 0.81 fm,
W s = 19.6 MeV, rI = 1.34 fm , aI = 0.68 fm, for deuterons and
V R = 179.5 MeV, rR = 1.11 fm, aR = 0.77 fm, WI = 20.6 MeV,
rI = 1.615 fm, aI = 0.74 fm for 3He.
45

62N
i(3H
e,d)
63C
U
E3H
e=35
.5M
eV
10,
,10
10,
,10
9'S
\f\
\ \ ~
067
\ V
\ \(
\ \
. \
c 1
i.l\
~ '1°96
\\ ~
0.1 0
°
\ \
\ ~~
1.41
-.\
'\
\ \
\ .
\ ,,",
\\A \ \,
Sc.
rn.
~ .......
.0
2.06
'\+
Ir
V\
1 t •
\./~
\ ~~
\ 2
51
• \
1 \.
\L"'~
"" \ \ \ •
3.58
\
' ......
0.1 .:
1
.'\ \-
, \\ +,
4.0
6 ~ \ '~
,I
\\ .\
\ .. ,\.~
\ .'+
0.1
0.1
~ 50
° 0°
10
° 20
° 3
0°
40°
Sc.
rn
0.1 1 0.1
0.1
50°
Fig.
3.
62 N
ie H
e, d
)63
Cu
angu
lar
dist
ribu
tion
s. S
olid
lin
es
are
used
onl
y to
con
nect
the
mea
sure
d va
lues
.
10.O
r, ---------------------------,--------------------~
1.0
'" E 1.
0
0.1
f,4N
i I r
. d )65
Cu
Ang
ular
d
'str
,bu
lion
s
\ Er
= 3
5.5
MeV
V· ~+-~ .
1.62
0 M
eV
(f,t
) G
ND
f
\v \ O.7
7M"
if\ )- 2
1.0
Exp.
'VOl
DW
UC
K C
alcu
.
)He
V R=
+ 17
9.5
ro=
1.2
I W
I =+
20
.04
D
V R
= +
95.4
r o
=1.
075
Wrs
=+
11.
81
/ }A
\
ro=
1.51
ro
= 1.
31
\( 1.1
15 M
eV .l 2 '~
0.01
1 "
'"
O·
10·
20
· 3
0·
40
· 10
· 2
0·
30
· 4
0·
eLm
e"
m
Fig
. 4.
64
Nie
He,
d)6
5 C
u an
gula
r di
stri
buti
ons.
Sol
id l
ines
sho
w t
he
calc
ulat
ions
wit
h
DW
UC
K.
Use
d op
tica
l pa
ram
eter
s ar
e
V R
=
179.
5 M
eV,r
R
= 1
.21
fm,
Wv
=
20.0
4 M
eV,
r I =
1.
51 f
m f
or 3
He
and
V R
= 9
5.4
MeV
, r R
=
1.0
075
fm,
W s
=
11.8
1 M
eV, r
I =
1.
31 f
m f
or d
eute
rons
.
+::-
0\

47
reactions. There we notice a remarkable gross structure of the background bump in the proton
unbound energy region, over which enhanced peaks of unbound analog states are observed.
Calculations using the Vincent-Fortune type DWBA analysis coded by Igarashi and Kawai,7)
where the radial integral to r = 00 is replaced with the integral in the complex r-plane by use
of the analytical continuation, enabled to explain only the 1/30 of the proton width rp of the
enhanced unbound peak. Angular distributions of 58,62,64Ni(3He,d)59,63,65Cu are shown in
Figs. 2,3, and 4, respectively. For well-separated bound states, measured angular distributions were
fitted using the code of DWUCK (see Figs. 2 and 4). In order to investigate the origin of the
bump structure, energy spectra of deuterons were measured at various incident 3He-beam
energies, by ' changing the target mass. Remarkable features of the bump are as follows:
1) The yield of the background bump is strongly dependent on the incident beam energy.
Bump cross sections grow up as the beam energy increases.
2) The position of the maximum in the bump energy spectrum relative to the proton
separation energy does not change remarkably with increase of the target mass number.
Analysis on the bump structure using various form factors and models is in progress.
References
1) U. Strohbusch, H. J. Korner, G. C. Morrison, and J. P. Schiffer: Phys. Rev. Lett.,
28, 47 (1972).
2) R. L. McGrath, N. Cue, W. R. Hering, L. L. Lee, Jr., B. L. Liebler, and Z. Vager:
ibid., 25, 682 (1970).
3) S. A. A. Zaiai, C. L. Hollas, J. L. Horton, P. J. Riley, J. L. C. Ford, Jr., and C. M. Jones:
ibid., p. 1503 (1970).
4) B. J. Cole, R. Huby, and J. R. Mines: ibid., 26, 204 (1971).
5) C. M. Vincent and H. T. Fortune: Phys. Rev., C4, 236 (1971).
6) C. M. Vincent and H. T. Fortune: ibid., C8, 1084 (1973).
7) Private communications and M. Kawai and M. Igarashi: Research Center for Nuclear
Physics Report RCNP-P-l, p.40 (1974).

48
4-12. Analyses of Cr eHe, d) Mn Reactions at 29.29 MeV
N. Nakanishi, S. Takeda,* H. Ohnuma, S. Yamada,
H. Sakaguchi, M. Nakamura, S. Takeuchi, * * and K. Koyama
Differential cross sections were measured on the 50,52, 54Cr eHe, d)5 1, 53,55Mn reactions at
a 3He-energy of 29.29 MeV 1) and analyses of them have been carried out.
As optical model parameters were employed a deep potential family (V ~ 180 MeV) for
3He particles and a Perey-Perey's set for deuteron particles.
For proton-bound states, conventional DWBA analyses were carried out to obtain
theoretical angular distributions and spectroscopic factors. As an example, the calculated results
on sOCreHe, d)SlMn reactions are shown in Fig. 1 and Table 1. In Fig. 1, Rp = 2 and Rp =
were assigned to the 2.99 MeV level transfer in Refs. 2 and 3 respectively. However, it can
be seen that.e p = 3 gives better fits. Angular momentum R p = 3 may be assigned to the
4.93 MeV level.
Table 1. Transition strength of the sOCreHe, d)S 1 Mn (bound states).
r-E_h_-_-_2_9_.-..2 : MeV (Present) ,--.... __ E..:.:h~=..A .. -12_M-e-V_2)----. .e~ J1T C2 (2J+l)S Rp J1T C2 (2J+l)S' i p
0.24 3 7/2- 2.26
1.83 0.56
1.95 0.23
2.13 0.39
2.84 0.25
2.99 (3) 0.90
3.28 3 (5/2r 1.89
4.44 3 7/2- lAS { 0.85 (s=0.32)
4.71 (0.2) 0.04
4.93 3 0.08
r·074 5.10
5.128 lAS 0.77
* National Laboratory for High Energy Physics.
** Kyoto University.
3 7/5- 2.33
0.63
0.21
0.35
0.20
2 (3/2)+ {O.IS Oct)
0.06 (2d)
3 0.84
3 7/2- lAS 0.55
(2) 0.02
0.04
{ : 1/2- lAS (0.23 3/2- lAS 0.37
3 7/2-
3/2-
3/2- 1/2-
3/2- 1/2-
3/2- 1/2-
3/2- 1/2-
3 5/2-
2.62
0.75
0.33
0.54
0.39
0.04
2.69

50Cr( 3He,d )51Mn Eh =29. 29 MeV
.
~ ..
0.24 MeV
i= 3 71Z-
1O-1r--------------~-
\.,.A 1. 83MeV V \ i= 1
i,O,f------._·\_.=t--________ ·~_3_/ 2_-__
1.95 MeV Q= l
10' ---....~ •• • • • •
V\ 2. 13 MeV
"\ \.;~\ I ~ I \ \ 1 O°l-----\c-----------~~---
\/., =-=--;; ..\ 2.84MeV
• •• Q= 1
~ 40 50 50
. _.
~. .. . 10°f------ - -----ik-------
30
". \ \
+'
2.99 MeV (i=3)
4 .44 MeV lAS 1 =3 712 -
4.93 MeV
1= 3
~t=l ~= 3
{ 5.0 74
5.10 5.1 28 lA S
i = 1
49
Fig. 1. Angular distributions for transitions to bound states of sOCrCHe, d)Sl Mn
reaction at an incident energy of 29.29 MeV.
The 5.10 level is composed of lAS 5.074 and 5.128 MeV levels. It was unable to observe
these levels separately.
For proton-unbound states we have carried out some trial calculations to .reproduce these
angular distributions. Some of them are shown in Figs. 2 and 3 for the Ex = 12.35 MeV
9/2+ state of sSMn (the isobaric analogue state of sSCr 2.09 MeV 9/2+ state). Figure 2 shows
form factors for the paren.t nucleus, a loosely bound state and a single particle resonant state4)

50
55Mn 12 .35 MeV (55Cr 2.09 MeV 9/2+ lAS)
10-1 1------;~~------
/ \~: ... 10-2 1~'-' -----;_ ... ~ .. _;__---
x •
(Si ngle particle re sonance)
10- ' L --------- ~-~~--
(5'Cr+n) •
10-51-_ ___________ x
_· ---'----'(-=B-"-E=-10~ __ ~
10 20
r (1m)
30
Fig. 2. Form factors for a 12.35 MeV 9/2+ state of sSMn. Cross
sign, small dots and large ones show form factors of a
neutron of a parent nucleus, of a proton loosely bound
and of a proton on the assumption of a single particle
resonance, respectively.
f h = 29. 29 MeV
fx=12.35 MeV
-- S Ing le port Icle resonance
" " "
Parent nucleus
Loosely bound parton
~ .~,
.~, "
Sc.rn (deg.l
Fig. 3. A typical angular distribution for a sSMn
12.35 MeV 9/2+ proton-unbound state.
Calculated curves are normalized arbitrarily
to experimental points.

51
by cross signs, smaller and larger dots, respectively. Figure 3 shows the calculated angular
distributions and the experimental values. In this case, proton form factors were employed as
seen in Fig. 2. Overlap integrals were performed using a code "INS-DWBA2" ,5) which adopts
the Vincent-Fortune method6) in case of integration of a scattering state.
References
1) N. Nakanishi, S. Takeda, H. Ohnuma, S. Yamada, H. Sakaguchi, M. Nakamura, S. Takeuchi,
and K. Koyama: IPCR Cyclotron Progr. Rep.,1., 42 (1973).
2) J. Rapaport, T. Belote, and W. E. Dorenbuch: Nucl. Phys., AIOO, 280 (1967).
3) B. CUjec and I. M. Szoghy: Phys. Rev., 179, 1060 (1969).
4) W. R. Coker and G. W. Hoffmann: Z. Physik, 263, 179 (1973).
5) The code "INS-DWBA2" was newly improved by M. Igarashi.
6) C. M. Vincent and H. T. Fortune: Phys. Rev., C2, 782 (1970).

52
4-13. Full Finite-Range DWBA Calculations for Heavy-Ion Induced
Two-Nucleon Transfer Reactions
T. Takemasa
Recently heavy-ion induced two-nucleon transfer reactions have been of much interest.
Several authors l ) - 3) have attempted to calculate differential cross sections of such reactions.
However, all the calculations except the work of Bayman4) are based on a no-recoil approximation.
Apparently it may be misleading to ignore the recoil effects for these reactions and the
spectroscopic information can be only achieved through an exact finite-range calculation including
a microscopic form factor.
We have recently completed a finite-range full-recoil DWBA code which also includes the
microscopic form factor. 5) The methodology given there used the multipole expansion of the
two nucleon overlap in terms of the relative angular momentum .e of a transferred nucleon pair.
Here we report a finite-range full-recoil DWBA calculation for the reaction 12C (180, 160)
14Cg.S.. The optical potential parameters are the same as those used in Ref.3; Vo = 200 Me V,
Wvol = 10 MeV, R = 1.25 (A~/3 + A~/3) fm, and ao = 0.5 fm. The overlap < 14C 112C> is
assumed to be a pure (OPl/2)2 configuration and < 180 1160> to be the admixed configuration
given by Federman and Talmi.6)
We first investigated the convergence of the £ series. The differential cross sections were
calculated as a function of the quantum number e (Fig. 1). As can be seen, the convergence
is fairly rapid. We found that taking account up to e = 3 term is enough to ensure an
accuracy of better than - 2 % in the differential cross section. This fact points out that it
is quite practical to use this method for the systematic analysis of experimental data.
In Fig. 2, the finite-range full-recoil DWBA calculations are compared with the finite-range
no-recoil ones3) and also with the experimental data.7) The normalization factors N = aCe )exp.
la(e )theor. for the full-recoil (no-recoil) curves are 250 (500), III (72), and 140 (138) for
Elab = 16, 20, and 24 MeV, respectively. The full-recoil curve at Elab = 16 MeV is greatly
different from the no- recoil curve. However, the recoil effects do not affect the shape of the
angular distributions at Elab = 20 and 24 MeV.

£ =24 MeV
101
1=3
Fig. 1. Plot of the differential cross
sections for the 'f = 0 - 3 for the
reaction 12CeSO, 160)14C at g.s.
E1ab = 24 MeV.
'-........ en
........
..0
E
~ -a "'-b -0
53
10r-------------------------------~
No recoi I
Full reco i l
[= 16 MeV
0.1
E= 20MeV
0.1
[=24MeV
o 30 150
8 c.m• (deg.)
Fig. 2. Comparison of the finite-range
full-recoil and finite-range
no-recoil 3) DWBA calculations
with the experimental differential
cross section. 7)
180
54
References
1) A. J. Baltz and S. Kahana: Phys. Rev. Lett. , 29 , 1267 (1972).
2) A. Roberts: Nucl. Phys., A196 , 465 (1972).
3) R. A. Broglia et al.: Kernforschungsan1age Jii1ich Internal Report, 1973, (unpublished) .
4) B. F. Bayman: Phys. Rev. Lett. , 32; 71 (1974).
5) T. Takemasa: Phys. Lett., (1975), (in press).
6) P. Federman and I. Ta1mi: Phys. Lett., 12, 590 (1965).
7) P. H. Barker et al.: Proc. Int. Conf. on Nuclear Reactions Induced by Heavy Ions,
Heidelberg , 1969 , North-Holland, Amsterdam , p. 152 (1970).

55
4-14. Two-Nuc leon Transfer Reactions between Heavy Ions
T. Takemasa
A method 1) was developed for exact evaluation of the DWBA transition amplitude in
two-nucleon transfer reactions between heavy ions. It is based on an expansion of a two-nucleon
overlap fuction ('l' (b) I V I 'l' (b+ 2 ) > in multipole series of the relative angular momentum f of a
transferred nucleon pair. The perturbation interaction acting between the core and each
transferred nucleon is taken into account, and it is therefore possible to extract the proper
spectroscopic information by comparing the calculated results with the experimental data.
A
Fig. 1. Coordinate system for the reaction A(a, b)B where
B = A + 2n, a = b + 2n.
Figure 1 shows a relevant vector diagram for the two-nucleon transfer A(a, b) B (B = A +
2n, a = b + 2n). The form factor < 'l' 'l' I {V (r/l ) + V (r/2)} I 'l' 'l' > (post representation) B b A a
can be factorized as follows : < 'l'B 'l'b I { V (r/1 ) + V (r~)} I 'l'A 'l'a >
= < 'l'B I 'l'A> < 'l'b l { V (r/1) + V (r~)} I 'l'a > . (1 )
we consider a multipole expansion of the radial part of the overlap
< 'l'bl { V (r/1) + V (r'2)} I 'l'a > :
{ V ( r 11 ) + V (r 'z)} cD ~', (1)1, r ~ ) L' L '
=""'~ g '" '" (r, R z) [Y ff (f. ) X Y L' (R 2) ] M' , P' L ' pI L '
(2)

56
and a similar multipole expansion is carried out for the overlap Inserting
these expansions into Eqn. (1) and integrating over r, we can obtain the following expression
for the form factor :
(3)
where S AB(Sab) is the two-nucleon parentage coefficient for the target (projectile) nucleus, """-",
C(LL'SQLL') is the angular momentum coupling coefficient and S is the total spin angular
momentum of the two transferred nucleons. The radial part of the form factor F ,,-L~:' (R l , R2 ) QjLL'
can be expressed by
(4 )
where the function f~I: is the radial part of the multipole expansion of the overlap < WB' WA > . The angular momentum coupling diagram is exhibited in Fig. 2. It is to be observed that
the quantum number .£ is the total transferred angular momentum. The resultant formalism
which can exactly treat the DWBA amplitude for the two-nucleon transfer between heavy ions
has been coded by suitably extending the existing single-particle DWBA code DWBA4.3)
The coding has been checked by comparing results with those given by Bayman.4)
Fig. 2. Angular momentum coupling diagram in
a transfer reaction. The total angular
momentum of a transferred pair in the
projectile nucleus is l' = L' + S and it is
transferred to J = L + S in the residual
nucleus. The total transferred angular
momentum is.£ which is the sum of the
center of mass angular momentums in
the projectile and residual nuclei.
57
References
1) T. Takemasa: Phys. Lett., (in press).
2) C. W. Wong and D. M. Clement: Nucl. Phys., A183, 210 (1972).
3) H. Yoshida: DWBA code DWBA4 (unpublished).
4) B. F. Bayman: Phys. Rev. Lett.,ll, 71 (1974).

58
4-15. One-and Two-step Processes in the Heavy-Ion Induced
Two-nucleon Transfer Reaction
T. Kammuri
Two-nucleon transfer reactions induced by light particles have been analyzed by means of
the first-order DWBA method, in which the nucleon pair is assumed to be transferred through a
single interaction with the core. In the collision between two nuclei in the independent-particle
model limit, two nucleons can be transferred one by one, with one interaction in each transfer.
Usually two nucleons have some degrees of correlation. At least they belong to the same nuclear
system and can have a correlation distance of the order of nuclear diameter. Thus it is
interesting to study competition between simEltaneous and successive transfer processes in the
heavy-ion induced reactions. I), 2)
The transition amplitude can be written as
We expand this to the second order of the interaction and take the same restricted class of
intermediate states m :
(2 ) . 1. Tfi = < fIVf 11 > + L:< f IVf 1m > E - H +. < mlVi 11 > ,
m rn LC
(1)
(2)
where Hm is the unperturbed Hamiltonian in the intermediate channel and Va is the residual
interaction in the a-channel. We refer each term of Eqn. (2) as the amplitude of the post or
prior-post form. Due to the equality of the post and prior forms of the first order amplitude,
Eqn. (2) is equivalent to
Eqn. (2) can be rewritten so as to involve < m Iv m Ii> instead of < m I Vi Ii>,
(2 )
Tfi = < fl Vf Ii > - L:< fl Vf I m>< ml i > + 2::< fl Vf 1 i > m m
E- Jrn+ ic < mIVrn l i > .
(3)
(4 )
If both the projectile and target systems can be described by the shell model within the given
space of m, the first term is cancelled with the second term 1) and we get the post-post form
(2 ) • 1 . Tn = L:< f IVf I1> E- H + . < mIVrn ll > .
m rn lC (5)
Starting from Eqn. (3) we get the prior-prior form :
(6)

59
The reaction 48Ca ct60, 14C) sOYi to the lowest 0+, 2+, 4+, and 6+ states of sOYi at 58 MeV
incident energy3) has been analyzed in the no-recoil approximation. We have used the code
TWOST.4) The optical pararrieters are taken from Ref. 3 : V = 37 MeV, rOR = 1.35 fm ,
aR = 0.42 fm, W = 78 MeV, rO I = 1.27 fm, and aI = 0.28 fm. Simple configurations are
assumed for 50Ti and 160 :
< 14CI 16 0 > = (OPl /Z) Z, < 48CaI50Ti >= (Of7/ Z).z
The successive transfer is assumed to proceed via a channel m consisting of the ground states of
15N and 49SC. The cross sections in various representations differ from each other by about
30 %. In Figs. 1 and 2 we have compared the experimental data with the results of calculation.
The normalization constants defined by N = 8 exp / 8 calc are listed in Table 1. It can be seen
that the successive transfer dominates over the simultaneous transfer for all the transitions. It
should be noted that , although the two-step angular distributions for 4+ and 6+ transitions shown
in Fig. 2 do not have oscillatory behavior, we can change them so as to fit the experimental
shape by varying the Q value for the first or second step while fixing the overall Q value.
1.0
0 .5
4+ , 2 .6 8 MeV
~O.I ..c E
0.1
2+ , 1. 55 MeV
1. 0
0. 5 0.1 6+, 3.20 Me V
o lL_~_,-l;,1 _-----L_--:=l::-I _~_-='=I =___----'- .---:':::-----' 10 20 30 40
0.01
Sc.m. Sc.m.
Fig. 1. Angular distributions for the reaction Fig. 2. Same as in Fig. 1 except for the
48Cae60, 14C)50Ti leading to the lowest transitions to the lowest 4+ and 6+ states.
0+ and 2+ states at incident energy of
58 MeV. The solid and dashed lines are
the theoretical curves predicted by the
one- and two-step DWBA, respectively.

60
Table 1. Normalization constant(N = 0 / 0 1) peak exp ca c .
J1I" E*(MeV) None-step Ntwo-step
0+ 0.0 250 12.5
2+ 1.55 300 13.6
4+ 2.68 330 22.8
6+ 3.20 224 10
References
1) R. A. Broglia, U. Gotz, M. Ichimura, T. Kammuri, and A. Winther: Phys. Lett., 45B, 23
(1973).
2) T. Kammuri: ibid., SIB, 442 (1974).
3) W. Henning, D. G. Kovar, B. Zeidman, and J. R. Erskine: Phys. Rev. Lett., 32, 1015
(1974).
4) M. Toyama and M. Igarashi: DWBA code "TWOST" (unpublished).

61
4-16. CCBA Analysis of (p, t) Reactions on Rare-Earth Nuclei
M. Wakai,* M. Sano,* T. Takemasa, and S. Yamaji
Nuclear reactions are usually analyzed by using a zero-range DWBA method and it is a very
effective tool for study of the nuclear spectroscopy. Some of the present authors (M.S. and T.T.)
and M. SakagamP) analyzed (p, t) reactions on rare-earth nuclei by using the zero-range DWBA
method. They explicitly took into account of the difference between the deformation of a
target nucleus and that of a residual nucleus and obtained the following results: (1) the angular
distribution and the neutron number dependence of the ground state cross section are in good
agreement with the experimental results, (2) neither the magnitude of the cross section nor the
angular distributions for the 2+ and 4+ state transitions are well reproduced. The finite range
calculations2) were performed by one of the present authors (T.T.) and H. Yoshida to dissolve
the discrepancy between the experimental and the theoretical results based on the zero-range
DWBA. However the situation was not improved by introducing the effect of finite range of
nucleon-nucleon interaction.
Recently, the importance of the channel-coupling was emphasized and the CCBA method
was applied for analysis of (p, t) reactions. 3) The CCBA calculations showed that the contribution
of indirect processes is much larger than was expected and has an important effect on both
the cross sections and the angular distributions to make the agreement between the experimental
and theoretical results better. It has led us to reanalyze the (p, t) reactions on rare-earth nuclei
by using the CCBA method. The transition amplitude of CCBA for a transfer reaction A(a, b)B
is written as4)
Here 'lIa(+) and 'lIb(-) are solutions of a coupled-channel equation and a = b + x. We used the
source-term method developed by GlendenningS) to get the transition amplitudes. In this analysis,
the coupling of 0+, 2+, and 4+ states of a ground band were considered. The angular momentum
projection method is applied to obtain the nuclear wave functions of rotational states. I) The
optical parameters used in the analysis are tabulated in Table 1. Figures 1 and 2 show the
experimenta16) and theoretical angular distributions for 0+, 2+, and 4+ .transitions of 172Yb(p, t)
170 Vb. It can be seen that the CCBA method reproduces well the forward ~eak behavior of
2+ transition which the DWBA cannot expalin at all. According to our calculations, an indirect
process 0+ ~ 2+ transfe~ 2+ gives a large contribution and makes the value of the cross
section to 2+ state much larger. The forward peak behavior of the 2+ transition is reproduced
by the interference between the direct 0+ ~ 2+ process and the indirect process mentioned
* Osaka University

62
Table 1. Optical parameters used in the CCBA calculations.
.....: +-'
..!:?
.D
3-
c:: ~
"-b ~
Proton
V(MeV) 51.4
r~ (F) 1.17
a(F) 0.73
W(MeV) 2.59
WD(MeV) 7.50
r~ (F) 1.31
a/(F) 0.65
~(F) 1.20
103
\72 Yb (p,t) 17C>yb
~ £p = 51.7 MeV
102 ~ Exp (0+)
! Exp (2+ ) 0+
-- Col (0+) , . '-', ----- Col (2+) ....... " It
f',
2+
10'
... 1
10-10!:--- L-----=2l:-0 - ---L---
4L
O ----L---
6LO----L-----1
S0
Bcm (deg)
Fig. 1. Angular distributions for the g.s. and 2+
transitions.
103
102
~
~ 3-
10\
~ "-~
Triton
150.0
1.24
0.67
20.0
0.0
1.46
0.79
1.40
\72Yb (p,t) \7OYb
Ep = 51.7 MeV
- CCBA
Bcm (deg)
Fig. 2. Angular distributions for the 4+
transition.
above. The summed cross sections o'CI+) are defined by the· sum of differential cross sections
taken for 5° steps in the range 5° - 45°, and the ratios o(l+)/o( 0+) are plotted in Fig. 3. The
DWBA calculations l } give the ratios 0(2+)/0(0+) = 5 '" 10% and 0(4+)/0(0+) = 1 '" 5%. They
are too small compared with the experimental values: 20 '" 40 % and'" 5 % for 2+ and 4+
transitions, respectively. As is seen from Fig. 3, the CCBA calculations explain the experimental

-~ -
+1+ ...... 0
b b
60 -0-- Exp
-x- Col
50
40
--X~.--" _______ X
Gd Oy 30 2+
20
10 4+
0 90 100 110
N
Fig. 3. The ratios a(2+)/a(0+) and a(4+)/a(0+)
as a function of neu tron number N.
values fairly well. It is due to increase of a(2+) and a( 4+) which comes from the large
contributions of indirect processes.
The optical parameters used in these calculations are preliminary ones and may not be
most suitable. A parameter search is now in progress to get optimum values.
References
I) T. Takemasa, M. Sakagami, and M. Sano: Phys. Rev. Lett., 29 133 (1972).
2) T. Takemasa and H. Yoshida: Phys. Lett., 46B, 313 (1973); T. Takemasa: Nucl. Phys.,
A220, 31 (1974).
63
3) T. Tamura, D. R. Bes, R. A. Broglia, and S. Landsdowne: Phys. Rev. Lett., 25, 1507
(1970); ibid., 26, 156 (1971); R. J. Ascuitto, N. K. Glendenning, and B. S¢rensen: Phys.
Lett., 34B, 17 (1971); Nucl. Phys., A 183, 60 (1972).
4) S. K. Penny and G. R. Satchler: Nucl. Phys., 53, 145 (1964).
5) R. J. Ascuitto and N. K. Glendenning: Phys. Rev., 181, 1396 (1969); ibid., e2, 415 (1970).
6) Y. Ishizaki: Proc. Phys. Soc. Japan, 26, 147 (1971); Y. Sugiyama, 1. Kotame, T. Suehiro,
Y. Saji, H. Ogata, A. Stricker, I. Nomaka, and Y. Ishizaki: J. Phys. Soc. Japan, 30, 602
(1973).

64
4-17. Folding Model for Nucleus -Nucleus Optical Potential
K. Kammuri and T. Wada
A nucleon-nucleus or alpha-nucleus elastic scattering has been described successfully by a
folding model, in which an optical potential is approximated by a convolution of the target
density with nucleon-nucleon or alpha-nucleon interaction.·)- 3) Heavy-ion elastic scattering is
usually treated by a simple optical potential with Woods-Saxon shape. The optical parameters
show Igo's ambiguities. 4) With the aim of dissolving such ambiguities, we applied the folding
model to the heavy-ion scattering.
The real nuclear part of the optical potential is taken to be
V ld= ~ dr, ~ dr2Pa (~ ) v ( ~ - ;;) PA
(;:: ),
where P a and P A are the projectile and target total densities , respectively, and veri - r~) is
an effective nucleon-nucleon interaction. Similarly the Coulomb part is given by
V c(r)= \ dr. \ dr2 pg (;; ) _ 1 _ P ( r 2) ,
J J I r 1 - r~ I A
(1)
(2)
where Pc means a charge density. We assume that the imaginary part was proportional to the
density overlap of two systems,
27th2 \ \ W(r)= - ~ W J drl J dr2 pa (rl ) p A ( r l - r) . (3)
The coordinate vectors are shown in Fig. 1.
The form factor for the collective inelastic excitation can be derived from the folding
model. Assuming that only the even mass target system is excited vibration ally , its surface is
expressed by
R = RA (1 + L a 1 Y 1 ( 8, 1> )) . Af.1 I\. ,U 1\. /1
(4 )
Fig. 1. Coordinate vectors.
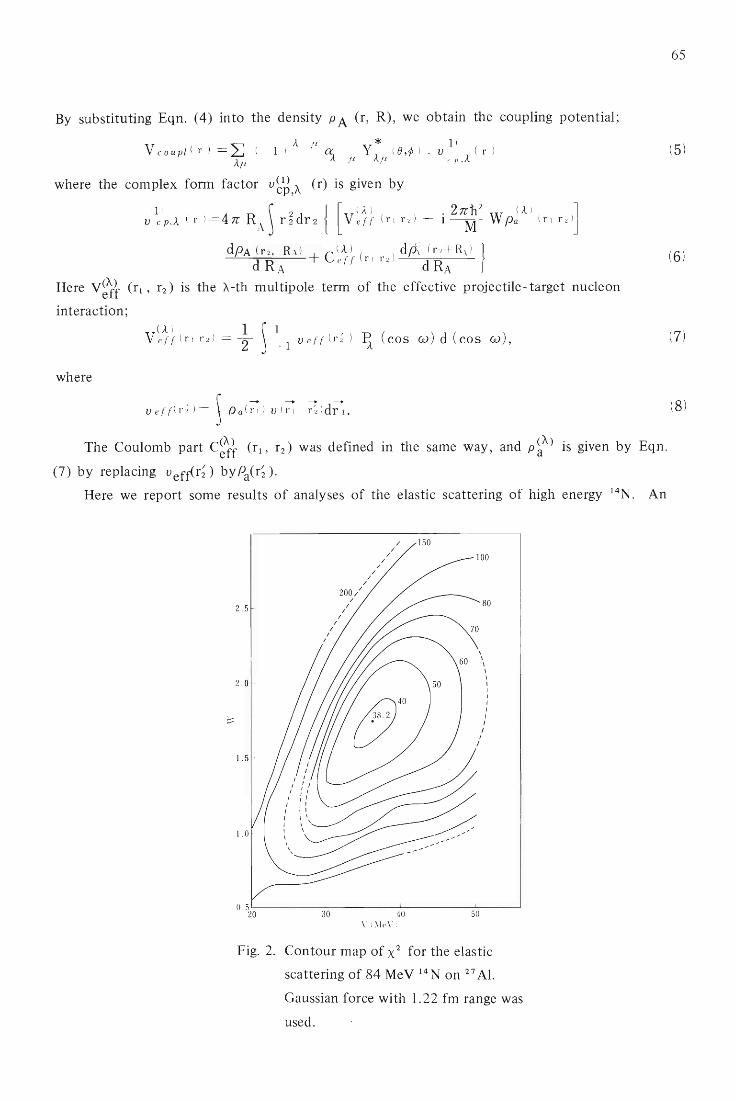
By substituting Eqn. (4) in to the density P A (r, R), we obtain the coupling potential;
Ie - /1 * 11 ) V co upl ( r ) = L (- 1 ) '~ y Ie ( e,~ ) , v (' p, 1e ( r )
leP - P p
where the complex form factor v~~ ,A (r) is given by
' 1) \ 2 J [ (A ) . 2 ITn 2 ( Ie ) ] v c P,1e ( r ) = 4 IT RAJ r 2 dr 2 1 V err ( f I f 2) - I -----rvr- W pa ( f I f2 )
dPA ( f 2, R d + C ( Ie ) ( ) dp~ ( f 2+ R\ ) ) d RA e rr f I f 2 d RA
H (A) ( ). h hi' 1 f h ff' . 'I 1 ere Veff rl, r2 IS t e A-t mu t!pO e term 0 tee ect!ve proJect! e-target nuc eon
interaction; ( Ie ) 1 \ 1
V err ( f I f 2) = 2 J _ 1 v err ( f ~) ~ (cos w ) d (cos w ),
where
u, rr1r;) = ~ Pa l ~ ) u l ~ - ;:; ) d;;.
The Coulomb part C~1} (r 1, r2) was defined in the same way, and p ~A) is given by Eqn.
(7) by replacing v efrCr~) by Pa(r; ).
Here we report some results of analyses of the elastic scattering of high energy 14N. An
2.5
/ /
I I
2.0
1.5
1.0
30
200/
I
/ I
/
/
/ /
/
/ /
/
V l " leV )
/ 150
80
40 50
Fig. 2. Contour map of x2 for the elastic
scattering of 84 MeV 14N on 27 AI.
Gaussian force with 1.22 fm range was
used.
65
(5 )
(6)
(7 )
(8 )
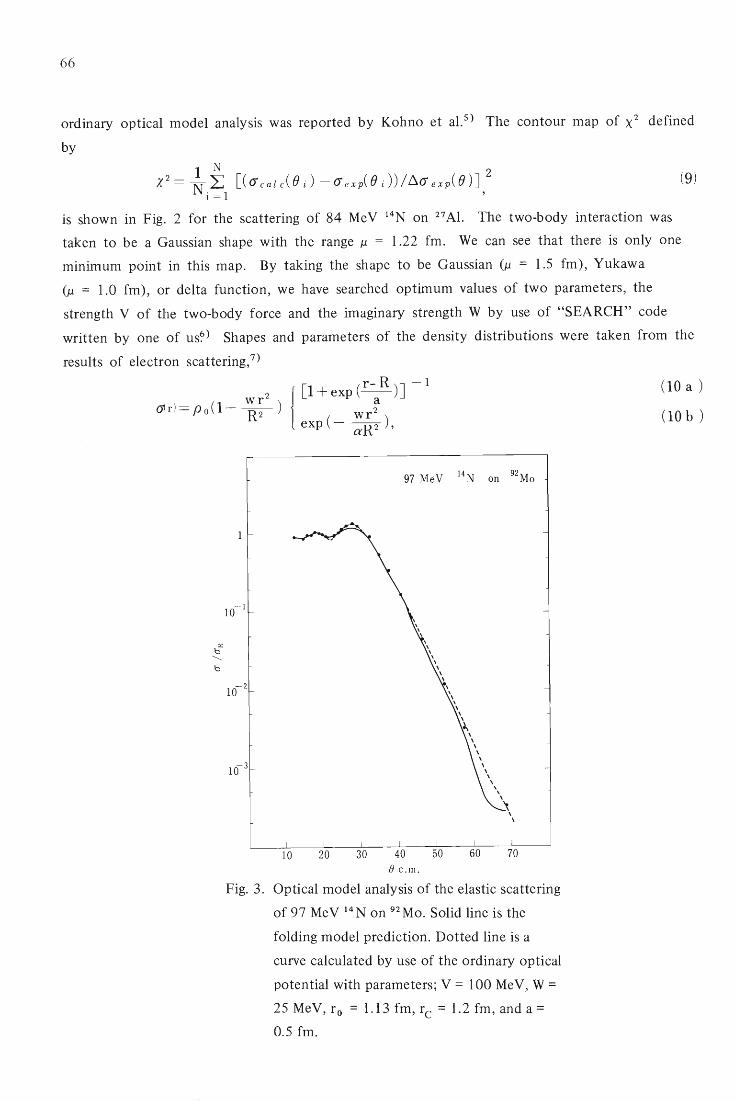
66
ordinary optical model analysis was reported by Kohno et aI. S) The contour map of x2 defined
by
is shown in Fig. 2 for the scattering of 84 MeV 14N on 27 AI. The two-body interaction was
taken to be a Gaussian shape with the range 11 = 1.22 fm. We can see that there is only one
minimum point in this map. By taking the shape to be Gaussian (11 = 1.5 fm), Yukawa
(9)
(11 = 1.0 fm), or delta function, we have searched optimum values of two parameters, the
strength V of the two-body force and the imaginary strength W by use of "SEARCH" code
written by one of us?) Shapes and parameters of the density distributions were taken from the
results of electron scattering,7)
a:: b '-b
97 MeV 14N on 92 Mo
10- 1
10- 2
10 20 () c.m.
Fig. 3. Optical model analysis of the elastic scattering
of 97 MeV 14 N on 92 Mo. Solid line is the
folding model prediction. Dotted line is a
curve calculated by use of the ordinary optical
potential with parameters; V = 100 MeV, W = 25 MeV, r 0 = 1.13 fm, re = 1. 2 fm, and a =
0.5 fm.
(lOa)
(lOb)

67
Table 1. Folding model parameters for the elastic scattering of 14N. (Projectile density is given by [1.03, 1.67])
E Target Gaussisn (1.5 fm) Yukawa (l.0 fm) 8-force ~ ~ ~
(MeV) density V W V W V W
(MeV) (MeV) (MeV) (MeV) (MeV) (MeV)
14N + 12C 65 [ 1.057 , 1.33] 18.28 4.73 15.92 5.00 4.93 1.00
14N + 27AI 65 [1.02, 0.52, 0.0] 10.81 1.39 7.87 0.87 3.39 1.66
14N + 27Al 84 [1.02, 0.52, 0.0] 14.35 1.86 14.27 2.08 3.03 1.51
14N + 28Si 84 [1.02, 0.52, 0.0] 14.59 2.09 13.67 2.00 4.58 2.67
14N + 58Ni 84 [1.124,0.5, - 0.185] 8.94 0.62 7.78 0.58 2.47 0.41
14N + 92Mo 97 [1.073, 0.52, 0.0] 10.50 1.44 8.62 1.10 2.49 1.04
where W = 3 a (2 + 5 a) / 2 (2+ 3 a). In Table 1, the density parameters are denoted by
[ro , a, Wj for Eqn. (10a), or by [ro , aJ for Eqn. (lOb). It should be noted that the strengths
V given by other sources such as (p , pi ) are around 20 MeV for the Gaussian force (p. = 1.5 fm)
and 30 MeV for the Yukawa force (p. = 1.0 fm).8) Finally in Fig. 3, experimental
angular distribution for the case of the elastic scattering of 97 MeV 14N on 92Mo is compared
with the predictions of the folding model and ordinary optical mode1. 9)
References
1) G. W. Greenless, G. J. Pyle , and Y. C. Tang: Phys. Rev ., 171, 1115 (1968).
2) P. Mailandt, J. S. Lilley, and G. W. Greenless: ibid., C8, 2189 (1973).
3) B. Tatischeff and I. Brissaud: Nucl. Phys. , A 155 , 89 (1970).
4) G. Igo: Phys. Rev. Lett., 1, 72 (1958).
5) I. Kohno, S. Nakajima, T. Tonuma, and M. Odera: J. Phys. Soc. Japan, 30,910 (1971).
6) T. Wada: Reports I.P.C.R. (in Japanese) , 46, 21 (1970).
7) J. P. Vary and C. B. Dover: Phys. Rev. Lett. , ll, 1510 (1973).
8) S. M. Austin: "The Two-Body Force in Nuclei" , Plenum Press, N. Y. London, p. 285 (1972).
9) I. Kohno: Private communication.

68
4-1 8. Role of the 12 16 12
C-Core Exchange in the 0- C
Elastic Scattering
H. Yoshida
The elastic scattering of two heavy ions which have identical cores with few nucleons outside
of one of the cores generally shows the backward rise in the angular distribution. This backward
rise of the angular distribution can be understood reasonably well as the transfer process of the
outer nucleons superposed on the shape elastic process. 1)- 8) The reactions considered here are
the following processes:
1
A+ (B+ X) ........................ (D)
( B~ X) + A-- B+ (A; X) ........................ (E)
b
Reaction (D) is a direct shape elastic process and reaction (E), where the identical cores A and B
are exchanged, is a transfer process of the cluster X. To take account of the both processes
simultaneously, the total wave function 'Ir properly antisymmetrized with respect to the interchange
of the identical cores A and B was used:
(1 )
Here the function X (ra) describes the relative motion of the colliding particles a and A, and
I aA> describes the intrinsic states of the two particles. The equation for the L-th partial wave
of X (rb) is obtained from the total Hamiltonian as follows:
(2 )
Here
(3a )

Table 1.
69
Dependence of the calculated cross sections on the nonnalization constant N which
can be regarded as the coupling strength of the · transfer channel.
8c~ 1.0 1.5 2.0 2.5
1660 0.58 0.56 0.56 0.55 } 1460 0.25 0.22 0.20 0.20 EL = 65 MeV
1720 2.21 2.34 2.25 2.06 } 1560 2.01 l.67 1.45 l.29 EL = 24 MeV
O'eal (8 )/N 2 (mb/ std
are not large for incident energies above the Coulomb barrier, showing that the effect is not very
important.4)-S) In fact, we can see from Table 1 that the calculated cross sections at EL =65
Me V increase roughly with N2 near the shell model limit (N= l.0) in consistence with the DWBA
prediction. But the cross section at the second peak 8 c.m.=156° of EL =24 MeV shows a
deviation from the N2 -dependence. The multistep transfer process plays a role in this case.
1.0
I. = II
O.It
~ '-- ;;
! 1.0 c: "0 '-b "0
0.1 .;;
Fig. 2. Comparison of the results calculated by
the local approximation (dashed lines)
with those of exact calculations (solid
line ).
\ \
\L = 8 \
L = 10
Fig. 3. The local approxImation potential UL (rb )
for several L-values. The non-orthogonality
term KLI) (rb
, ra) is not included here.

70
The normalization constant N is introduced to the r.h.s. of Eqn. (2) so that the calculated
values of the cross section may reproduce the experimental values at backward angles and J is
the Jacobian of the transformation to the coordinate ra. The spectroscopic factor SNL in Eqn.
(3b) is calculated by assuming the configurations p12 [444] llS and p8 [44] llS for 160 and 12C
states respectively. Eqn. (2) is solved numerically obtaining the angular distributions. The
solution includes the multistep transfer process. The results are compared with those of DWBA
to see the multistep transfer effect. As shown in Fig. 1, the differences from the DWBA results
l.0
0.1
~ ~ "..D
~ l.0
~ "b -0
Fig. 1. Comparison of the present calculations
(solid lines) with those of DWBA (dashed
lines). The angular distribution obtained
by use of the optical potential Db (rb )
only is drawn by a solid and dotted line
at EL = 24 MeV in order to show the
importance of the interference with the
DWBA amplitude. Parameter values of
the optical potential are V = 30 MeV,
W = 10 MeV, aR = 0.8 fm, aI = 0.45 fm,
rR
= 1.2 (EL = 24 MeV), 1.13 fm (EL = 65 and 80 MeV) and rI = 1.15 fm. The
normalization constant is N = 1.0 for
EL = 24 MeV and N = 1.5 for EL = 65
and 80 MeV.

At low energies, the r.h.s. of Eqn.(2) can be approximated by UL (r b)x L (r b) where the
local approximation potential UL
(rb
) is given by
71
(4)
since the partial wave XL (r) changes more slowly than the kernel KL (rb
, ra). In fact, angular
distributions calculated using the above approximation are similar to those obtained by the exact
calculations at low energies (Fig. 2). The potential UL (rb ) shows the parity dependence2) as
shown in Fig. 3. The potential is very much affected by the presence of the non-orthogonality
term KL (1) (rb , ra) in Eqn. (3) especially for lower partial waves and in nuclear interior regions.
But the calculated angular distributions remain unchanged whether the non-orthogonality term
is included or not (Fig. 4).
All the calculations have been performed so far by assuming the a-cluster transfer with
a spectroscopic factor of S20 e60~12C+a) = 0.296 obtained from configurations p12 [444] and
p8 [44] for 160 and 12C states respectively. The above choice of the configurations, however,
predicts the existence of the a *-clusters in nuclei. Preliminary calculations show that the
a*-clusters does not affect the angular distributions at low energies but at high energies the
angular distributions are shifted to the backward angles. A further study on the effect of the
1.0
0 . 1
120 140 160 180
e c. \ 1
Fig. 4. The effect of the non-orthogonality term
on the angular distributions. The results
calculated with and without the
non-orthogonality term are shown by
the solid and dashed lines respectively.

72
a *-clusters is now in progress.
References
1) A Gobbi, U. Matter, J ,-L. Perrenoud, and P. Marmier: Nucl. Phys., A 112, 537 (1968).
2) W. von Oertzen: ibid., A148, 529 (1970); W. von Oertzen and W. Norenberg: ibid.,
A207, 113 (1973); H. G. Bohlen and W. von Oertzen: Phys. Lett., 37B, 451 (1971).
3) C. K. Ge1bke, R. Bock, P. Braun-Munzinger, D. Fick, K. D. Hildenbrand, A. Richter, and
W. Weiss: Phys. Rev. Lett., 29, 1683 (1972); K. D. Hildenbrand, R. Bock. H. G. Bohlen,
P. Braun-Munzinger, D. Fick, C. K. Gelbke, W. von Oertzen, and W. Weise: Phys. Lett.,
42B, 425 (1972); C.K. Gelbke, R. Bock, P. Braun-Munzinger, D. Fick, K. D. Hildenbrand,
W. Weiss, and S. Wenneis: ibid., 43B, 284 (1973).
4) C. A. Mcmahan and W. Tobocman: Nucl. Phys., A202, 561 (1973).
5) G. Baur and C. K. Gelbke; ibid., A204, 138 (1973).
6) B. Imanishi: Preprint and private communications.
7) C. K. Gelbke, G. Baur, R. Bock, P. Braun-Munzinger, W. Grochulski, H. L. Harney, and
R. Stock: Nucl. Phys., A219, 253 (1974).
8) G. Baur and H. H. Wolter: Phys. Lett., 51 B, 205 (1974).

73
5. NUCLEAR PHYSICS Nuc lear Spectroscopy
5-1. ~ 46 lifetime Measurement of the 6 (2976 keY) State in Ca and
+2 E2 Effective Charges in (1 f 7/)- Nuclei
W. Kutschera, G. D. Sprouse, H. Ikezoe,
Y. Yamazaki, and T. Nomura
The mean lifetime of the first excited 6+ state in 46Ca has been measured with the pulsed
beam method to be Tm = 15.2 ± 0.8 ns. The state was populated via the reaction 48Ca(ex, ex2n)
46Ca with 50 MeV ex particles from the cyclotron. Electronic timing was performed between
the natural beam bursts of the cyclotron and ')'-rays observed with a Ge (Li) detector. Experimental
details are described in Ref. 1.
Table 1 summarizes the present experimental information!) on E2-decay properties of the
2+, 4+, and 6+ states in Of7/2 )±2 nuclei. The last column gives the additional charges 0 e = eeff
-1 for protons and 0 e = eeff for neutrons. The effective charges have been extracted from the
relation:
Here, the theoretical B (E2) values have been calculated with pure 0 f7/2 )±2 configurations and
harmonic oscillator wave functions.
The strong state dependence of the effective charges for 42Ca and 42Ti indicates large
admixtures of other configurations in the 2+ and 4+ states of these nuclei. On the other hand,
the 6+ -+ 4+ transitions in 42Ca and 46Ca are rather close to each other. Using the more refined wave
functions of Ogawa,2) who considers (p3/2f7/2)2 and (P3/2 f7/2)6 configurations, one obtains
a remarkable constant value of the neutron effective charge for the 6+ -+ 4+ transitions in 42Ca
and 46Ca: eeff (6+ -+ 4+, 42Ca) = 0.69 ± 0.01 e and eeff (6+ -+ 4+, 46Ca) = 0.68 ± 0.02 e.
These values should be close to the neutron core polarization charge in this mass region. It is
interesting to note that this value is close to the macroscopic estimate of Bohr and Mottelson: 3)
epol (neutron) = (Z/A+0.29) e =0.72 e.
The three proton nuclei 42Ti, 50Ti, and 54Fe are difficult to compare with each other,
since i) 42Ti shows an exceptionally low effective charge for the 6+ -+ 4+ transition, and ii) the
extraction of a reliable proton charge for the N = 28 isctones involves the more complex
excitation of both protons and neutrons to other f-p orbitals in order to obtain wave functions
of good isospin.

Tab
le
l.
E2-
deca
y pr
oper
ties
of
2+,
4+,
and
6+ s
tate
s in
(lf
7/ 2
)±2
N
ucle
i. -.
..]
+:>.
Mai
n T
rans
itio
n E'
)' T
a)
B
(E
2)
o eb
) N
ucle
us
m
conf
igur
a tio
n (k
eV)
(ps)
(e
2 fm
4)
(e)
I 2+ -
+ 0+
15
24
l.1
9 ±
0.
04
83.4
± 2
.8
2.09
± 0
.02
i5C
a 22
(V
f7/2
)2
4+ -
+ 2+
12
27
4.5
± 0
.5
65
± 7
' 1.
85 ±
0.1
0
6+ -
+ 4+
43
9 7.
79 ±
0.1
3 ns
6.
42 ±
0.1
1 0.
86 ±
0.0
1
( 2+ -
+ 0+
13
46
5.24
± 0
.54
35.1
±
3.6
l.
32
± 0
.07
>8
<
23
<
l.1
igC
a 26
(vf 7
/ 2r2
4+ -
+ 2+
12
31
no
t m
easu
red
6+ -
+ 4+
39
9 15
.2 ±
0.8
ns
5.31
±
0.2
8 0.
76 ±
0.0
2
I 2+ ->
0+
1555
0.
60 ±
0.1
0 15
0 ±
25
1.8
± 0
.3
i~ T
i 20
(1T
f 7/ 2
)2
(4+)
-+
2+
1121
>
1.8
<
23
0
<2
.5
(6+)
-+ (
4+)
366
26
± 5
ns
4.7
± 0
.9
-0.2
6 ±
0.0
7
I 2+ -
+ 0+
15
54
1.4
± 0
.2
66 ±
8
0.7
6±
0.1
1
~gTh
8 (1
Tf 7
/ 2 )2
4+
-+
2+
1121
7.
7 ±
l.
5 6
0 ±
12
0.68
± 0
.17
6+ -
+ 4+
52
4 0.
61
± 0
.02
ns
33.8
±
l.2
0.
87 ±
0.0
4
I 2+ -
+ 0+
14
08
l.3
8 ±
0.1
0 10
7 ±
8
1.18
± 0
.08
~~Fe
28
(1Tf
7/ 2r2
4+ -
+ 2+
11
31
5.7
±
l.2
77
±
16
0.85
± 0
.19
6+ -
+ 4+
40
9 l.
75
± 0
.03
ns
40.7
± 0
.7
1.00
± 0
.02
a) A
vera
ges
of
the
valu
es t
aken
fro
m v
ario
us e
xper
imen
ts.
b) oe
= ee
ff -
1 f
or p
roto
ns a
nd o
e =
eeff
for
neu
tron
s.

75
References
1) W. Kutschera, G. D. Sprouse, H. Ikezoe, Y. Yamazaki, and T. Nomura: Phys. Rev. Lett. (in press).
2) K. Ogawa: Private communication.
3) A. Bohr and B. Mottelson: Nuclear Structure, Benjamin, New York, Vol. II Chapt. 6

76
5-2. High-Spin State Yields In 88
Y Relative to 1 + State In 90
Nb Excited
via 89 y + a Reac tion
A. Hashizume, Y. Tendow, T. Katou, and H. Kumagai
A natural yttrium target was bombarded with a-particles and the 382 keY 0+) state in
90Nb was excited via the 89Y(a, 3n) reaction. In these experiments, the beam from Cyclotron
was passed through a mechanical beam chopper and, using a pulsed beam technique, the half-life
of the 382 ke V state was determined to be 6.19 ± 0.08 ms.I)
During the course of the study, in the delayed ,),-ray spectra, there were observed two 232
and 443 ke V ,),-rays, both decaying with a half-life of 14 ms (Fig. 1). These ')'-rays were
attributed to the cascade transitions from the 687 keY state to the ground state through the
231 keY (5- ) state in 88y.2) Figure 2 shows the relative excitation functions of those ')'-rays
together with the 258 keY ,),-ray emitted from the above mentioned 9omNb. Because the Q value
of 89Y(a , an)88y is lower than that of 89Y(a , 3nt oNb , the isomer 88my was conjectured to be
'" ~ 0:::
N N
• o
E ;:!; •
. '" -- E
::5 N
;:::; <D
~ % 1 ~-
~~r
200
Cha nne l numbe r
\..~ 40 - 80m s
• 90 :\b- 90 Ll'
400 600
Fig. l. Delayed ,),-ray spectra observed by bombarding
a-particles on 89 Y.
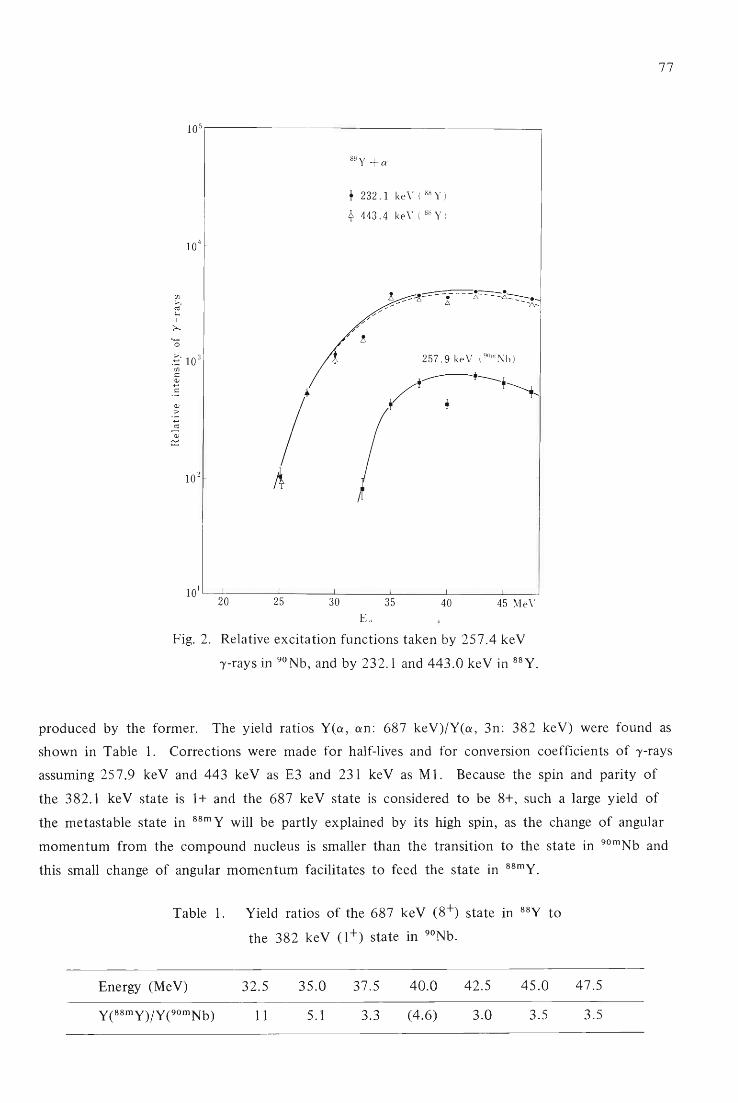
1o 5,----------------------------------------.
!
t 232.1 ke V ( 88 Y )
~ 443.4 ke V ( 88 Y )
257.9 keY (90Ill Nb )
+------+--, / ~, , +
1 01 '--::'":20:-----~2::':5------3-'-0------~-----4LO ---------.l45--M-
e-.J
V
Fig. 2. Relative excitation functions taken by 257.4 keY
r-rays in 90Nb, and by 232.1 and 443.0 keY in 88y.
77
produced by the former. The yield ratios Yea, an: 687 keY)/Y(a, 3n: 382 keY) were found as
shown in Table 1. Corrections were made for half-lives and for conversion coefficients of r-rays
assuming 257.9 keY and 443 keY as E3 and 231 keY as MI. Because the spin and parity of
the 382.1 keY state is 1 + and the 687 keY state is considered to be 8+, such a large yield of
the metastable state in 88m Y will be partly explained by its high spin, as the change of angular
momentum from the compound nucleus is smaller than the transition to the state in 90rnNb and
this small change of angular momentum facilitates to feed the state in 88rny.
Table 1. Yield ratios of the 687 keY (8+) state in 88y to
the 382 ke V (1+) state in 90Nb.
Energy (Me V) 32.5 35.0 37.5 40.0 42.5 45.0
11 5.1 3.3 (4.6) 3.0 3.5
47.5
3.5

78
References
1) A. Hashizume, H. Kumagai, Y. Tendow, and T. Katou: Nucl. Instr. and Meth., 119,209 (1974).
2) A. M. Morozov and V. V. Ramaev: Soviet Phys. JETP, !.i, 314 (1963).

79
5-3. Short Life Radioisotopes and Isomers Observed vIa I r + C Reactions
A. Hashizume, Y. Tendow, T. Katou, and H. Kumagai
In the region of nuclei whose mass numbers lie between about 190 and 210, many
isomeric states have been found because high spin orbitals such as h ll / 2 and i l3!2 are concerned
with those states. With the aid of a beam bunching technique reported previously /),2) the
radioisotopes and/or isomers of the half-lives in the ms region produced by the reaction 191Ir + C
and 193Ir + C were studied.
Powders of natural Ir and isotopically enriched 191Ir were used as targets. A 50 cm3 Ge (Li)
and a pure Ge detectors with high resolution (600 e V at 122 ke V) were employed for the
detection of '}'-rays. These detectors were placed at 90° to the direction of incident beams.
Gamma-ray spectra in the delay-time range from about I ms to 1000 ms after the irradiation
were studied as well as long lived residual activities. The excitation functions for -y-rays from
Ir + C reactions with incident beam energies from 65 to 95 MeV were also examined.
Figure I shows the ,},-ray spectra produced by the bombardment with C (95 MeV) on Ir
and 191Ir. In the case presented in this figure, the targets were bombarded for about 60 ms,
and after 50 ms from the end of irradiation ,},-ray spectra were taken by 4 (times) X 1024
(energies) channels for 800 ms. The irradiation was restarted after 100 ms delay from the end
of the ,},-ray measurements, and the same procedures were repeated. At a bombarding energy of
95 MeV, the (C, 5n) reaction was predominant and intense '}'-rays emitted in the ground state
decay of 200Bi to 200Pb together with de-exciting 428.2 keY -y-ray from the isomeric state in
200Bi (T1I2 = 0.4 S)3) were observed. Owing to the 191Ir(C, 5n) reaction, a 248.5 keY isomeric
transition (T 1/2 = 7.7 s) in 198Bi was also confirmed. The peaks corresponding to 197.6 and
317.9 keY are due to the ground state decay of 198Bi to 198Pb. According to the preliminary
measurements, the half-lives of 222.6 and 385.8 keY -y-rays were about I s. As the isomer
at 609.3 keY in 197Tl emits 222.5 and 386.7 keY -y-rays, these delayed -y-rays would be attributed
to these transitions and the relative excitation curves for the (C, 5n) reaction shown in Fig. 2
are not qualitatively contradictory to the (C, a 2n) reaction. However, there are some discrepancies
on the value of -y-ray energy and the half-life. Further, if the metastable state is excited through
the 191Ir(C, a 2n) 197TI reaction, there should be comparable feeds to the 748.5 keY (T1!2 = 28.7 ms) state in 199TI through the 193Ir (C, a 2n) 199TI reaction. We could not find any -y-rays
corresponding to the de-exciting transitions from the isomer decaying with such a half-life.
Further investigations is in progress comparing the Ir + C with Re + Nand Ir + B reaction to
reveal the true origin of the two '}'-rays and to establish the quantitative relations between isomers
and isotopes produced in the 191, 193Ir + C reactions.

~o
<1> c:: c:: C .s:: U ....... <I> ...... c:: ::> o
U
-<1> c:: c:: o
.s:: U '-'" c:: ::l o
U
'" M '" I I
J
o
Kex
191 1r + C .
650"'850ms
Ir + C
-(/)
O'l
650"'850ms
200 400 600 800
C han n e I n u m be r
Fig. 1. The 'Y-ray spectra from RI and isomers produced by 191 Ir + C and nat Ir + C
reactions measured with a pure germanium detector. Energy values and assignment
for 'Y-rays are given above the spectra with 198 Bi --+ 198 Pb ( 0 ), 199 Pb --+ 199 TI (.),
200 Bi --+ 200 Pb ([; ). The ordinate is arbitrary scale.

References
Q)
a ~ Q)
.~
-0 Q) 0::
if)
>-. o
~ > Q)
..os::.
lr + C
10° I -
~ 10-11-
<:;j
if)
o -+--' o
0::
2222.6keV ! 385.8 keV
10-~LO--------~8~0--------~9~O--------~1~00
ECllob l (MeV)
Fig. 2. Excitation curves for 222.6 and 385.8 keY
),-rays relative to 428.1 keY eOomBi) ,-ray.
81
1) A. Hashizume, Y. Tendow, T. Katou, and H. Kumagai: IPCR Cyclotron Prog. Rep., 1, 79
(1973).
2) A. Hashizume, H. Kumagai, Y. Tendow, and T. Katou: Nucl. Instr. and Methods, ill, 209
(1974).
3) U. Hagemann, K. H. Kaun, W. Neubert, W. Schulz, and F. Stary: Nucl. Phys., A 197, 111
( 1972).

82
5-4. Monopole Effective Charges
T. Suzuki
Much has been written on the importance of electric and magnetic core-polarization
phenomena in nucleus. 1) In particular, the effects of electric quadrupole and magnetic dipole
polarizations are extensively studied. The former is illustrated by the electric quadrupole moments
and transition probabilities associated with the single-neutron configuration,l),2) while the latter is
recognized from the deviation of the observed magnetic moments from the Schmidt values. 1),3)
Their effects are usually expressed in terms of a renormalization of the charge or spin g-factor
of the valence-nucleons, that is, a quadrupole "effective charge" or an "effective gs-factor" .1)
On the other hand, the change in the charge radius of a nucleus induced by the addition
of another neutron is systematically observed throughout the periodic table, as is well known as
isotope shift. 1 ),4) This phenomenon is interpreted to be due to a monopole core-polarization
effect, which may be expressed in terms of a monopole effective charge. 5)
The core-polarization charges can be estimated in terms of the coupling of an extra particle
with the collective vibrations of the core. A large part of the electric quadrupole polarization
charge (the polarization gs-factor) is considered as coming from the virtual excitation of the
electric quadrupole state (the magnetic dipole state) of the core whose excitation strength
exhausts a large fraction of the classical energy-weighted sum rule value. 1)-3),6) Indeed, recently,
such collective states have been observed in the continuum region through electron and hadron
scatterings. 7) The existence of a collective monopole state, which carries most of the classical
energy-weighted sum rule value, is also expected in a nucleus as pointed out by many authors. 5),8)
We have studied monopole effective charges, which are interpreted as resulting from the
virtual excitation of such a collective state in the core. The eigenfrequency of the monopole
vibration and the interaction Hamiltonian between a particle and the vibration are obtained by
making use of various sum rules. 9) The isoscalar and isovector monopole polarization charges
are estimated to be O.125e and O.0645eT3, respectively. Isotope and isotone shifts calculated by
employing these effective charges are in good agreement with experimental results. A large part
of the Nolen-Schiffer anomaly can be also explained in terms of the isovector monopole
polarization charge.
References
1) A. Bohr and B. R. Mottelson: "Nuclear Structure", Benjamin, New York, 1 (1969).
2) H. Horie and A. Arima: Phys. Rev., 99, 778 (1955); S. Fallieros and R. A. Ferrell: ibid.,

116, 660 (1959).
3) R. J. Blin-Stoy1e: Proc. Phys. Soc., A66, 1158 (1953); A. Arima and H. Horie: Progr.
Theor. Phys., 11,509 (1954).
4) L. R. B. Elton: "Nuclear Sizes", Oxford University Press, Oxford, (1961); Y. N. Kim:
"Mesic Atoms and Nuclear Structure", North-Holland, Amsterdam (1971).
5) R. W. Sharp and L. Zamick: Nucl. Phys., A208, 130 (1973); T. Suzuki: Preprint.
6) T. Suzuki: Phys. Rev., C8, 2111 (1973).
7) R. Pitthan and Th. Walcher: Phys. Lett., 36B, 563 (1971); S. Fukuda and Y. Torizuka:
Phys. Rev. Lett., 29, 1109 (1972); M. Nagao and Y. Torizuka: ibid. , 30, 1068 (1973);
M. B. Lewis and F. E. Bertrand: Nucl. Phys., A 196, 337 (1972); Y. Torizuka: Proc.
Intern. Conf. Nucl. Structure Studies Using Electron Scattering and Photoreaction, Sendai
(1972); E. Spamer: ibid.; L. W. Fagg: Proc. Intern. Conf. Photo nuclear Reaction and
Application, Asilomar (1973); Y. Torizuka: ibid.; M. B. Lewis: ibid.; Th. Walcher:
Proc. Intern. Conf. Nucl. Phys., Munich (1973).
8) J. Blomqvist: Nucl. Phys., Al03, 644 (1967); J. Damgaard, V. V. Gortchakov, G. M.
83
Vagradov, and A. Molinari: Nucl. Phys., A121, 625 (1968); L. Zamick: Phys. Lett., 31B,
160 (1970); N. Auerbach: Nucl. Phys., A 182, 247 (1972); R. W. Sharp and L. Zamick:
ibid., A223 331 (1974).
9) T. Suzuki and C. Hinohara: Phys. Rev., C9, 1186 (1974); T. Suzuki: Nucl. Phys., A220,
569 (1974).

84
6. NUCLEAR INSTRUMENTATION
6-1. Performance of the IPeR Polarized lon-Source
S. Motonaga, T. Fujisawa, M. Hemmi, H. Takebe
K. Ikegami, and Y. Yamazaki
A polarized ion-source was successfully operated on the test bench and is now being
installed in a cyclotron. The performance of the polarized ion-source was described.
( I) General description
The general design and overall components of the IPCR polarized ion source were described
in previous reports. I) The source is based on the atomic beam principle. Radio frequency
transitions followed by strong field ionization are used to produce a maximum obtainable nuclear
polarization. General arrangement of the source is shown in Fig. I schematically. The hydrogen
or deuterium molecules are dissociated in a pylex bottle by an rf discharge at a frequency of
20 MHz. The power dissipated in the discharge is 250 W. The pylex bottle is cooled by air
blast. Dissociated atoms diffuse through a single nozzle of inside-diameter of 3.5 mm and
length of 10 mm into a sextupole magnet. The electron spin states of the atoms are separated
in the field of sextupole magnet having a tapered aperture from 6.5 to 13.0 mm along its axis
of 35 em and producing a maximum field strength of 7.2 k gauss at pole tip radius. The atomic
beam polarized with respect to the electron spin is subjected to a high-frequency electromagnetic
field which induces transition by adiabatic passage2) and then ionized by electron impact in the
strong magnetic field.
DISSOSIATOR
Py re x tube; 35mm , 1.0. RF-power ; 20M Hz ,200W
Nozz le ; 3,5mm, 1.0 10mm , 1.0.
Coil ime ter ; 4 ,5 mm, I.O.
Q. = 0.25 t orr. l/sec P= 2x 10⁻⁵ torr
I on pump RF (125 ilsec )
SEXTUPOLE MAG NET TRANSITION IONIZER
Aperture. ent rance; 6,5mm <J2 - 6 B; 1500gauss exit ; 13 mm 3- 5 lonlzot ion electrod
Leng t h ; 350 mm 380 MHz, 16 W lO mm, I.O. , 145mm L
Bmox Coi l
; 7200 ga uss B; 40 , 117 gouss
;6mm,O.0. t.8 ;5 ,15gouss 8 turns/pole
P=4XI0-7 torr. o I
011 diffus ion pump ( 800 ilsec)
ACCE L- TUBE 120kV
20 30 40 50 , , '" I , "I
Scole [ em )
Fig. 1. General arrangement of the polarized ion source.

85
Two medium field transitions are used enabling different nuclear polarization states to be
selected in a simple manner. For deuterium both transitions of 3 to 5 and 2 to 6 are available
at a frequency of 380 MHz, with static fields at 40 and 120 gauss, respectively. These
transitions are done separately to obtain tensor polarization of P zz = -1 (3 to 5) and P zz = + 1
(2 to 6). Best measured neutron anisotropies N (0° )/N (90°) from the T (d, n) 4He reaction are
0.657 and 1.418 corresponding to P zz = +0.516 and -0.562.
(2) Measurement
The intensity of the atomic beam at the entrance to the ionizer was 3 X 101S atoms/cm2• sec
measured by means of the compression tube method using an ionization gauge. Pictures on
Mo0 3 targets placed at about 35 cm apart from the exit of the sextupole magnet showed
focusing and separating effects for the electron spin states.
The efficiency of ionization of the ionizer was observed by adding hydrogen gas into the
ionizing chamber and measurering the increase in the extracted ion beam current. The efficiency
was 4 X 10⁻³• Although this is not equal to the efficiency of ionizing an atomic beam because
the mean velocity of the atoms is higher than in the present measurement, it can be used for
comparative measurement.
The emittance of beam extracted from the ionizer was not measured. However, divergence
of ion beam seems to be not so large. The beam spot at a distance of 60 cm from the extraction
electrode in the ionizer was found less than 40 mm in diameter.
The ion beam intensity of 1 I1A was observed on optimum operation as the difference of the
currents at the end of the accelerating tube when the sextupole magnet was turned off and on.
For several hours of operation the beam intensity of 0.6 I1A was maintained stably. Therefore,
the intensity of 5 nA should be obtained at the target when the source is installed in a cyclotron
whose overall efficiency of injection, acceleration, extraction and transportation of beam is about
%.
The tensor polarization of the deuteron beam was measured by the neutron anisotropic
factor on the T (d, n) 4He reaction as described above. The differential cross section is
independent of the vector polarization of the beam and for a deuteron having the tensor component
P zz 3) it is given by
(jpol (e) = (J"unpol [1 - ~ P zz (3cos 2 e-I)],
where () is the angle between the spin quantization axis and the emitted neutron in the system
of the center of mass. Two plastic scintillators where placed at 0° and 90° with respect to the
beam direction and were 50 cm apart from a Tritium-Titanium target to detect emitted neutrons.
The ' asymmetry is of the form:
where a is the cross section and N is counts of the emitted neutrons. The asymmetry was
measured as a function of the static field Be at a fixed frequency. For a frequency of 380 MHz

86
,f1H\ () 3~5
1.40 Pzz =-0.562:t0.071
1.30
,;1 f Ili 1.20
0 ;f i Q) 1.10 z
.:::::: / \ 0 / \ z 1.00 \
\ >,
\ 0.
~ \
f f "§ 0.90 \ \
co <I: \ I
\ i 0.80
0.70 it' I ()Z-6 \'
Pzz =+0.516:t 0.058
0.60
40 50 60 710 v"-;-ll~1 0:----'--1:72-=-0 ---'----:-13=-=1 0:---'---.1.14-0
---1----1150
Be (gauss)
Fig. 2. Neutron anisotropy in the T( d, n)4 He reaction with
polarized deuterons.
the static field was varied in the regions from 40 to 150 gauss in order to investigate the
behavior of the 2 to 6 and the 3 to 5 transitions. The results are shown in Fig. 2. The
maximum values of the asymmetry measured were
R = 0.657 ± 0.034
R = 1.418 ± 0.69
corresponding to
for 2 to 6
for 3 to 5,
Pzz = 0.516 ± 0.058 for 2 to 6
Pzz = - 0.562 ± 0.071 for 3 to 5.
These values include only a correction for detector background with no beam on the target.
It is wellknown that an unanalyzed beam contains unpolarized D2 + components which dilutes
the measured polarization of the atom. The maximum peak of the polarization is relatively
sharp for the 2 to 6 transition. The 3 to 5 transition, however, shows a broad top in which
the static field can be varied without losing the polarization. In both cases the slopes were
quite steep. Since the values of the asymmetry of the 3 to 5 transition are not critically
affected by the drift of the field, this transition should be chosen in connection with the weak
field rf transition in order to change the sign of the polarization in case of operation in the
accelerator. Table 1 shows parameters of rf transition and polarization.
To investigate the efficiency of transition probability for various strengths of the rf
rotating field B 1, the neutron anisotropy was measured as a function of the rf rotating field

Table 1.
# 1 Particle Tra.nsition Frequency Staticfield
(MHz) (gauss)
1T I, 2, 3 10 8 Hydrogen
tTl , 2, 3, 4 10 11
Deuterium
1Tl,2, 3, 4 10 11
1T: static field is perpendicular to rf fields.
a: static field is parallel to rf fields .
(}12to6) Trans ition
Fr eq uen cy : 380 MHz
Stat ic fi eld: 54 ga uss
RF-transition parameters.
# 2 Gradient Transition Frequency
llH (MHz)
2
02 , 4 1480
3
03, 5 378
3 03 , 5 378
Gradien t : ± 2.5 gauss
1. 20
g 1.10
...... 1.00
o :; 0.90
J 0.80
~ 0 .70 «
0.60
8 , = 2.3 gauss
-i--L --1-
40 60 80
8 , = 2. 1 gauss
ti it
40
I I I I
\ I \ I : ' ~/ 1
60
8e (G auss I
8 , =0.8 ga uss
\ ,f \ I
\i
40 60
Staticfield Gradient (gauss) llH
150 5
117 5
117 5
8 ,=0.21 ga uss
\ I \ I \ I \ I \ I
\1/ II
Fig. 3. Neutron anisotropy for different strengths of rf rotating field.
87
Polarization Pzz Pzz
- I
+ 1
_2 0 3 ' 1
+3. - 1
1 -3' - 1
which was varied from 0.21 to 2.3 gauss at 380 MHz. As shown in Fig. 3, remarkable increase
in the asymmetry was not observed.
The polarization values are smaller than the theoretically expected maximum values. This
suggests that there is a possibility of improving our apparatus. Perhaps the simplest way is to
decrease the partial pressure of the deuterium gas in the ionizing region.
Also the most important problem is to increase the ion beam intensity. For the present
ionizer of the source,l) a gridded electrode used to focus and accelerate the ion beam is a mesh
made of stainless steel wire of 0.15 mm in diameter and 0.55 mm in pitch. Although the
present transparency of the ion beam through the gridded electrode is 47 %, the increase of the
transparency can easily be achieved. Another improvement is to put the ionizer as near to the
exit of sextupole magnet as possible. By making these improvements, the ion beam of 2 fJ.A or
more could be expected.

88
References
1) S. Motonaga, M. Hemmi, T. Fujisawa, and Y. Yamazaki: IPCR Cyclotron Progr. Rep.,
4, 100 (1970); S. Motonaga, T. Fujisawa, K. Ikegami, H. Takebe, and M. Hemmi: ibid,
6, 12 (1972).
2) A. Abragam and J. M. Winter: Phys. Rev. Lett., 1, 374 (1958).
3) A. Galonski, H. B. Willard, and T. A. Welton: ibid.,~, 349 (1959).

89
6-2. Investigation of Residual Gases in the Ionizer
of Polarized Ion Source
K. Ikegami and H. Takebe
Polarized atoms are ionized by electron bombardment in the ionizer of a polarized ion
source which is being assembled.!) The ionization process of atomic hydrogen (or deuterium)
by electron bombardment is
Possible processes in which unpolarized background ions are produced from molecular hydrogen
remaining in the ionizer are
H2 + e --+ H2 + + 2e - ,
H2 + e --+ H+ + H + 2e - .
The first process producing a molecular ion beam is important only in a case that acceleration
of ion is made without analyzing the atomic mass. The unpolarized ions which are produced in
the second process cannot be removed in the accelerator.
One of the other constituents of the residual gas is water vapor. Keller2) has shown that
the effective cross section for producing protons from water vapor by 80 e V electrons is 40
times as large as that from molecular hydrogen. However , the vapor pressure of water at
-100° C is about 10-5 Torr and decreases by a factor of about ten per 10° C decrease of
temperature~) Therefore use of the liquid nitrogen traps will be very effective to suppress this
source of the background.
( I ) Analysis of the residual gases
The amount of the residual gases such as the molecular hydrogen (H2) and water vapor
Ion P ump (125 f/sec )
~ / So leno id Co il
Ion P um p (500 f/sec)
Oi l D ifus ion Pump (SOO r/see )
a nd Liquid N2 Trap
Fig. 1. Block diagram of experimental arrangement.

90
(H2 0) in the ionizer was measured using a quadrupole mass filter. A block diagram of the
arrangement for measurement is shown in Fig. 1. Evacuation of the vacuum chamber was
made by two diode sputter ion pumps of 125 and 500 t/s for N2 • An oil diffusion pump
with liquid N2 trap was also used to evacuate inert gases in the ionizer. The amount of
outgassing and leakage rate of the vacuum chamber was measured to be less than 2 X 10⁻⁶
Torr. tis.
(2) Structure of the ionizer
A tantalum filament was placed at one end of the ionizer and heated to about 2300°C by
direct current. Electrons were drawn off the filament by the electrode E I . Electrons travel
guided by the magnetic field produced by a solenoid coil along E I , E2 , and are reflected at
the other end by negative potentials of E3 and E4 . All of these electrodes were washed with
acetone and deionized water in an ultrasonic bath several times and dried in an oven at
80 - 150° C to clean their surface. A typical set of operating parameters of the ionizer were
'::, 6.0
'>(
'" -; 5.0
~ ~ 4.0
/. 3.0 t
'"'
2 .0 ·
I I I
1.0 ' I I
o [ Ii
-- Befort' the operation '
total pn'ssure : 1.8 X IO- ' T o J"r. '
------ - IJlIring the operation
total pr"sslIre: 9.0 X lO- ' T orr,
Operating paramt'tf'r
t \ 81 J hO I -
F il : 30.-\ '< 4.1\' r: 1 : O. 88k\' 87m.\ J':~ : 0 .62k\· 6Im ;\
: 28 :\ '} and CO t -
t C1 1.j 116 : : It
Ii 32 0 , 40\, ~ ~ - -~: --'-''--
44 C()~ t
:'Ilass s p..,ct rum
Fig. 2. Mass spectrum of residual gases.
as follows: Magnetic field of solenoid coil: 1200 gauss, Filament current: 30 A, Extractor
(E I ): 0.88 kV, 87 rnA, Ionization column (E2 ): 0.62 kV, 61 rnA.
(3) Results of observation of the residual gases during operation of the ionizer
Figure 2 shows the variation of mass spectrum of the residual gases in the ionizer before
and during operation. The total pressure increased suddenly to 9 X 10⁻⁷ Torr from 1.7 X 10⁻⁷
Torr when we started the operation of the ionizer. Each peaks of the residual gases was
identified with the cracking pattern coefficient4) and the partial pressure was given with relative
sensitivity to that of the nitrogen gas. s) The observed residual gases were hydrogen, water vapor,
nitrogen, carbon monoxide, oxygen, carbon dioxide, and argon before the operation of the
ionizer. Under these conditions, each partial pressure was less than 10-8 Torr.
On the other hand, the partial pressure for H2 was greatly enhanced when the ionizer was
operated. The partial pressure of H2 was 7 X 10⁻⁷ Torr. 76 % of the total pressure.

°
I '" ,,,,'"
Tot a l pr essure '-'-----0 --0 ____ 0
N2 a nd CO - -0- - - ___ -0- ______ 0
",,,,,,,,,,0- ______ ..()- __
J'" 0 ,
0- ______ -0-- -- _---0 d
'" '" '"
p'-'
'"
----H20
",,,,,,, "'/ - ______ ~-------..()--------o / 0 '" ",/'" C02
'" '" '" '" o---~(..--~'" /// f "
0 '" I"" I p_ "" ....
I I ---~ I I '--0-___ Ar ____ 0 1;/ " o ____ ===:~ __ ------O----
/' 02 --___ -0_-------0 I
I~ II
II II
cf/ , 7 .2X l 0- 10 /' Sta rting t ime
° o 15 30 45 60
Opera ting t ime ( min )
Fig. 3. Change of the partial pressure with operating time of
ionizer.
91
Figure 3 shows the change of the partial pressure of residual gases with the operation time
of the ionizer. The partial pressures of H2 and N2 decreased slightly during the operation. It
seems that the partial pressure of H2 0 increases slowly during the operation because of the
gradual rise of temperature of wall of the ionization region and the electrodes.
(4) Future improvement
If an atomic beam with an intensity of the order of 1015 atoms/cm2 s at a velocity of
2.5 X 10⁵ cmls (at T = 400 K) enters the ionizer, the equivalent beam pressure is about 10-7
Torr. Therefore it is desirable to reduce the partial pressure of residual gas to less than ar (cross
section for residual gas) laa (cross section for atoms) times the equivalent atomic beam pressure.
The required improvements are given below
a) A liquid nitrogen trap has to be placed near the ionization region.
b) The wall of vacuum envelope adjacent to the ionization region must be cooled by
a suitable coolant.
c) The inner wall of the steel vacuum envelope of the ionizer should be polished and
electroplated with tin.

92
After making these improvements one can expect that the partial pressures of hydrogen
molecule and water vapor in the ionization vacuum chamber are suppressed considerably.
References
1) S. Motonaga, T. Fujisawa, M. Hemmi, H. Takebe, K. Ikegami, and Y. Yamazaki: IPCR
Cyclotron Progr. Rep., ~, 84 (1974).
2) R. Keller, L. Dick, and M. Fiedecaro: Report CERN 60 - 2 (1960).
3) H. Kumagai, G. Tominaga, Y. Tsuji, and G. Honkoshi: "Vacuum Science and Engineering",
Shokabo, Tokyo, p.299 (1970).
4) T. Hayashi and S. Komiya: "Ultrahigh Vacuum", Vol. 6, Vacuum Technology, Nikkankogyo,
Tokyo, p. 92 (1964).
5) G. Tominaga: J. Vacuum Soc. Japan, ~, 19 (1955); 1, 27 (1955).

93
6-3. Meehan ical Design of a Polarized Ion Source
for the INS eye lotron
I. Takeshita
Details of the mechanical design of a polarized ion source , which is to be installed in the
cyclotron, are described in the present article. The fabrication of the source is now under way.
A simplified layout of the source is shown in Fig. 1. The height of the source was limited to be
less than 2 m, because of the available vertical space.
Figure 2 shows a schematic drawing of the IPCR polarized ion source. Basic design of the
source followed that of TEXAS A & M University , which is characterized in the dissociation at
high pressure of 2 Torr. The source consists of four vacuum chambers of stainless steel , three of
.......
. r').
. l'!I ,,'
• (j •• '
, I
' 0 o
, ,0
10 r~
I I
I I I
I
I ~
2C1: D F L.
' . '. c:. '. ~
~ CYCLOTRON VAU LT
CYCLOTROK
1ST F I ..
"
L'G FI~ , ,, 0 ' "~\'~' ' '
.... c " (;,
Fig. 1. Simplified layout of the ion source.

94
DISSOCIATOR ( WATER COOLED )
OIL DI F FUSION PUM P (2500 f'/ S ) ·2
SEXTUPOLE MAG:-.JET
OI L DI FFUS ION PUMP 12000f'/ S ) ·2
RF T RANSITIO\" UNIT
STRONG F IELD IONI ZER
ORRITRON 101\ PUMP
LI QUID NITROGEN THAP
FOCUS LENS UN IT
ION PUMP-- - -+- - -t-- 9="-
I ~ I
Fig. 2. Schematic drawing of the IPCR polarized ion
source.
which are evacuated with five 2400 P/s oil diffusion pumps and the other is pumped with a
orbitron ion pump of 1000 Pis. In the vacuum system, the pressure varies from 2 Torr in the
dissociation chamber to 3 X 10- 7 Torr in the ionization vacuum chamber.
Some notable designs were done in the mechanical design of the ionizer in order to fulfill
the following specifications. A sectional view of the strong field ionizer is shown in Fig. 3.
The strong field ionizer is placed in the ionization vacuum chamber, which is a cubiform of 36 cm
in width, 40 cm in length and 48 cm in height. A solenoid produces a magnetic field parallel
to the atomic beam. An electron gun is placed at one end of the ionization area and extraction
electrodes which have negative potential are placed at the other end. The electrons make
circulating motion in the ionization area before collision.

,-
I
LIQUID NITROGEN TRAP
THE LID IS DESI G:-lED TO BE LEMOVED
/~/ THE LEADTHROUGH /
'- THE SOLE:\OIDE COIL CASING
THE SIDE LID OF THE \· ACUU~I C HA~IBEH
95
1. Filament (Ta);
2. Grid, El (Ta);
3. Ionization column, E2 (Ta) ,
4. } 5.
Extraction electrodes, E3 , E4 (eu);
6. Grided electrode, Es (stainless steel
wire).
Rig. 3. A sectional view of the strong field
ionizer.
Fig. 4. A drawing of one of the electric
lead throughs.

96
The solenoid casing and all of the leadthroughs are mounted on the side lid of the vacuum
chamber. The lid was designed to be removed easily for exchange of the filament or for
re-alignmen t of the electrodes and magnetic field.
In order to inject an ion beam to the injection system with maximum energy of 20 keY,
the solenoid coil, the filament, and all of the electrodes are biased at a positive potential of
20 ke V to the ground. The ionizer vacuum chamber is at the ground potential. Therefore,
the solenoid coil casing and all of the electric and cooling leadthroughs must be insulated
electrically from the vacuum chamber. The solenoid casing is mounted on the side lid of the
vacuum chamber with four glass insulators. A drawing of one of the electric leadthroughs is
shown in Fig. 4. This leadthrough is used to supply an electric current of 150 A to the solenoid
and feed Freon coolant simultaneously under 20 keY electric potential to the ground. An epoxy
glass insulator is used because it can be manufactured easily. Before attaching the lead through to
the vacuum chamber the insulation of the lead through was tested under vacuum up to 20 keY
without any trouble.
As shown in Fig. 3 or 4 a compact helical solenoid coil was made by stacking annular
plates of copper of 1 mm in thickness, 130 mm in outer diameter, and 66 mm in inner diameter.
Electric current density is 4.7 A/mm2 at 150 A maximum current and the maximum heat
dissipation of 1.2 kW is removed with Freon coolant.
A particular attention was paid for keeping high vacuum in the ionization chamber. Thus
the surface of the solenoid coil casing, which is exposed in the vacuum, was polished by
electrolysis, and the inner surface of the vacuum chamber was polished by using high pressur;..
blast of glass beads.

97
7. A TOMIC AND SOLID-STATE PHYSICS
7-1. Inner-Shell Excitation by Nitrogen Ions and A Ipha Particles (3)
Y. Awaya, K. 1zumo, T. Hamada, M. Okano,
A. Hashizume, T. Takahashi, Y. Tendow, and T. Katou
Recently, some experimental studies have shown the deviation from the Z l 2 - dependence
in the K-shell ionization cross sectionl) - 5) where Zl is the atomic number of the incident particle.
The plane wave Born approximation predicts that R2K == [o2K (Z.')/Zt'2 ] /[02K (ZI)/Z I2] equals
unity, where the o2K (Zl) is the K-shell ionization cross section of the target atom of atomic
number Z2. The cause of this deviation would be twofold, i.e. increased binding energy of target
electrons (prevailing for VI < V2K) and the polarization of them (prevailing for VI :< v2K)'
where, v I and v2K (== Z2e2/h) are the velocity of projectile and that of K-electron of target
atom, respectively. These two processes have Zl 3 -dependence and their contributions to the
cross section are in the opposite direction. They cancel each other at V1/V2K = ()K/2, that is,
R2K = I, where ()K == 21 2K /Z22, and 12K (in a.u.) is the ionization energy of K-sheU.t)
We measured the X-rays from the target atoms induced by 5 MeV/amu N-ions and
a-particles. The target atoms ranged from Cr to Bi and the preliminary results of the work were
reported previously .6) , 7) We reanalyzed the ratio of the K X-ray yields of N-ion and a-particle
bombardment to study the deviation from the Z l 2 -dependence.
1.5
0
~ (0)
ct: 1.0 0
I • Present data 4cr(N)
0 (0) 49cr(He)
(0) o Ref .2 At target cr( He)
f ~4 4cr(H)
cr(U 1 0.5 0 (0) Ref.2 Ni target
9cr(D )
• Ref. 2 AC target cr( Li ) 9cr(D)
0 0.5 1.0 1.5 2.0
t;K
Fig. l. Ratios R2K of K-shell ionization cross sections as a function of ~K·
I
I
• i

98
In order to obtain a universal curve, values of R2K were plotted as a function of ~K'
where ~K == vl/(()Kv2K/2), since R2K becomes unity at ~K = 1 as described above. In our
experiment VI is constant whereas Z2'S take values of 24 to 83; on the other hand, single
element was bombarded with projectiles of different velocities in the literature cited. l)- 4)
The result is shown in Fig. 1 together with the data obtained by Basbas et a1.2); the tendency
of the deviation from the Z l2 dependence is similar. The amount of the deviation depends on
the projectile and target combination. It seems that some universality holds between R2K and
~K and this result shows that the main mechanism for K-shell ionization under the present
experimental conditions is the direct Coulomb excitation.
References
1) G. Basbas, W. Brandt, and R. Laubert: Phys. Lett., 34A, 277 (1971).
2) G. Basbas, W. Brandt, R. Laubert A. Ratkowski , and A. Schwarzschild: Phys. Rev. Lett.
27 , 171 (1971).
3) C. W. Lewis, 1. B. Natowitz, and R. L. Watson: ibid. , 26, 481 (1971); Phys. Rev., A, 5,
1773 (1972).
4) G. Basbas, W. Brandt, and R. Laubert: ibid., ,] , 983 (1973).
5) N. Cue, V. Dutkeiwicz, P. Sen, and H. Bakhu: Phys. Rev. Lett. , 32, 1155 (1974).
6) Y. Awaya, T. Hamada, M. Okano, A. Hashizume, T. Takahashi, K. Izumo, Y. Tendow,
and K. Katou: IPCR Cyclotron Progr. Rep. , 2, 87 (1973).
7) K. Izumo, Y. Tendow, Y. Awaya, T. Katou , M. Okano, A. Hashizume, T. Takahashi, and
T. Hamada: ibid. , p. 93.

99
7-2. Positron Annihilation In V and Nb
N. Shiotani, T. Okada, and H. Sekizawa
Systematic studies of the electronic structures of transition metals by measuring the angular
distribution of the positron annihilation radiation are in progress.
After completion of the experimental studies on V and Nb , a detailed theoretical calculation
employing APW method has been made by Wakoh et al. l) The (100) experimental angular
distribution curve for Nb is shown in Fig. I together with the theoretical curve as an example.
The agreement is fairly good and the fine structures in the experimental curve are identified as
the corresponding ones on the theoretical curve. Anisotropies of the experimental angular
distribution curves, i.e ., the differences between the curves along three major crystallographic
directions, are shown in Fig. 2 together with the theoretical ones calculated by Wakoh et al.
CI. c
o
T heo r'eti ca l angulnr di str ihu t i on h,\' \\' akoh f'i (//.
:\' b ( 100 )
----Total
---,- 1s t ha nd
------ - 2nd hand
- - - - - - - - - - 3 r rl ha nrl
- -- Core
- --, ----- I<\p,
0,5 1,0 1.5 2,0
l' )oIllPn tu lll i n .-\. l ' ,
Fig. 1. Experimental angular distribution in Nb
together with the theoretical ones with
individual contributions from the core states,
the first , second, and the third bands taken
from Ref. 1.
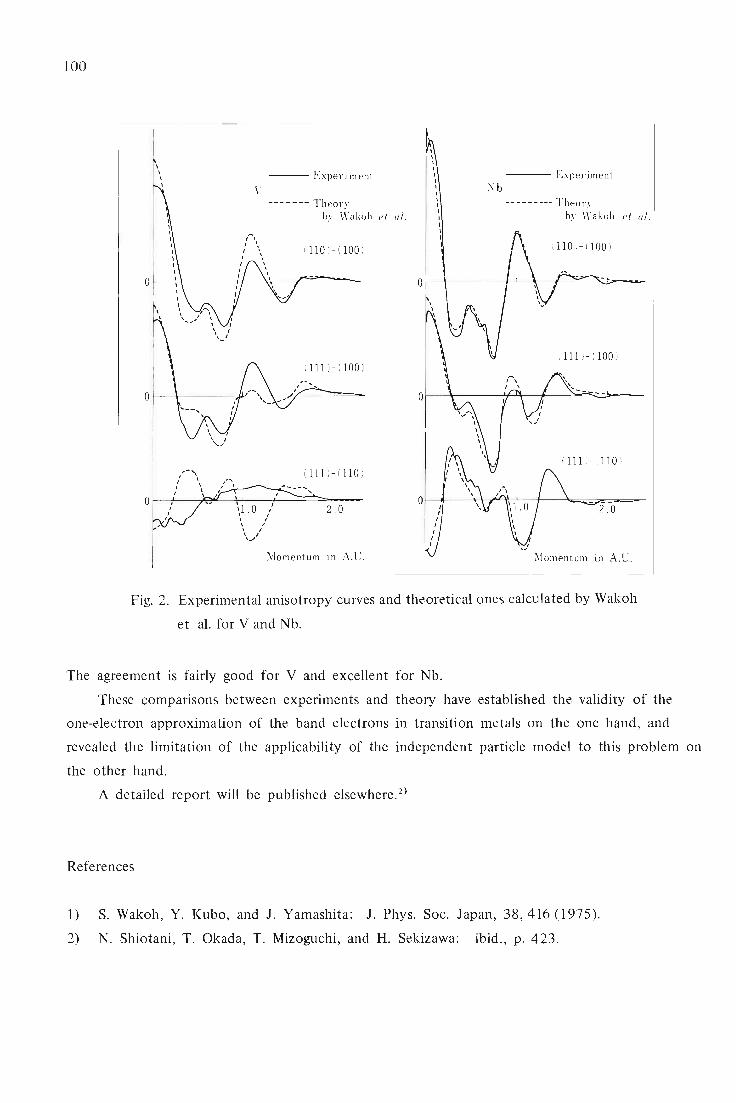
100
--- Experiment
V --- - - -- Theory
by Wakoh e l al.
( 110 )- (100 )
(111 )- (100 )
(111 )- ( 110 )
Momentum in A.U.
--- Exper im e nt Nb
--------- T heo r y by Wakoh el al.
(1 10 ) - ( 100 )
o ~+-------~--~~~--~~---
(111 )- ( 110 )
in A.U.
Fig. 2. Experimental anisotropy curves and theoretical ones calculated by Wakoh
et al. for V and Nb.
The agreement is fairly good for V and excellent for Nb.
These comparisons between experiments and theory have established the validity of the
one-electron approximation of the band electrons in transition metals on the one hand, and
revealed the limitation of the applicability of the independent particle model to this problem on
the other hand.
A detailed report will be published elsewhere. 2)
References
1) S. Wakoh, Y. Kubo, and J. Yamashita: J. Phys. Soc. Japan, 38,416 (1975).
2) N. Shiotani, T. Okada, T. Mizoguchi, and H. Sekizawa: ibid., p. 423.
101
7-3. A Damage Function Based on the Focused
Replacement Collision Model
H. Sakairi, E. Yagi, A. Koyama, and R. R. Hasigu ti
A damage function v (Ep) represents the average number of displaced atoms created by
a collision cascade initiated by a primary knocked-on atom with an energy Ep. A simple
expression of it was given by Kinchin and Pease l) and the refined one by Snyder and Neufeld. 2
)
Results of calculation with these expressions, however, give a larger number of displaced atoms
than the experimental values by a factor of 4 - 5. 3),4) The discrepancy is probably due to the
focused replacement collision sequences being neglected in the basic assumption. It is an effect
of the periodicity of crystal structure, which was predicted theoreticallys) and revealed by
a computer simulation. 6)
As reported previously, 7) the defect production rate in Cu and ordered alloy CU3Au
irradiated below 10K with charged particles from the cyclotron shows that the number of
atomic replacements is in proportion to the number of atomic displacements, suggesting that
almost all displacements occur as a result of replacements. Therefore the damage function was
reconsidered according to the focused replacement model as follows.
The basic equation is the same as used by Snyder and Neufeld, that is,
\ Ep dE 2 \ Ep- Ed dE 2 lI(Ep) = J~(E2) Ep + JlIo(Ep-E2 - Ep ) Ep (1)
The first integral in the right-hand side is the average number of displaced atoms in the
collision cascade initiated by the primary knocked-on atom whose energy was reduced from Ep
to E2 by the first scattering. The second integral is that created by the secondary knocked-on
atom produced by that scattering. Here Ed is the threshold energy for displacements and dE2/Ep is the probability of finding the scattered atom with energy in dE 2 at E2 , given by the hard
sphere approximation.
Boundary conditions were taken as
for Ep< Ed,
Eds Ep:S:EF' where Ep is the focusing energy.
(2a)
(2b)
Equation I was integrated analytically to v (Ep) = In (Ep/Ep) for Ep between Ep and
Ep + Ed, and numerically above Ep + Ed' An example of the results of calculation is given
in Pig. 1. The tangent of the asymptotic linear line is given by aEp-~, where a and f3 are
functions of Ed as shown in Pig. 2. This expression holds in the energy region where elastic
collisions dominate electronic excitations, above which the expression must be given in such
a modification as proposed by Kinchin and Pease.

102
3 ,0 ,---------- - ------------,
2,0
1. 0
~: I
j
Ed = 30e\ '
o 100 200 300 Ep \ e \ ' )
Fig. 1. An example of vCEp) curve calculated
for EF = 100 eV and Ed = 30 eV.
Snyder and Neufeld took a boundary condition,
1. 0,---------,-----------,--------,
0,5 1-----"<--+-------+---------1
0,2 1-----+-------~-+---------l
0 , 11'-0---- 2.'-:--0-------=5.'-:--0 - - -----:--:100
Fig. 2. a and ~ as functions of Ed·
instead of (2b) and obtained 0.56 Ed-1 as the tangent of the asymptotic line. Thompson
intuitively proposed to replace Ed simply by EF for including the focused replacement sequences
into the mode1. 8) This is shown, however, to be incorrect by the present calculation.
For Ed = 22 eV, which is accepted as the average threshold energy for displacement in
CU,9) a is 0.37 and ~ is 0.83. Then EF must be taken 135 eV to make up the difference
between the theory and experiments on the damage function by the contribution from focused
replacement chains only. If the contribution from electronic excitations, which was neglected
in the present consideration, is assumed to be about 20 %,10) it decreases to about 100 eV.
These values are large compared with the theoretical values of EF for Cu obtained by the
computer simulation C'" 40 e V). 6) Another experiment to estimate the EF values is now in
progress. It is also hoped that theoretical models for the calculation on focused replacement
collision sequences are reexamined.
References
I) G. H. Kinchin and R. S. Pease: Rep. Prog. Phys. , 18, 1 (1955).
2) W. S. Snyder and J . Neufeld: Phys. Rev., 97 , 1636 (1955).
3) H. G. Cooper, J. S. Koehler, and J. W. Marx: ibid., p. 599 .

4) D. K. Holmes: "Interaction of Radiation with Solids", ed. R. Strumane et al., (North
Holland Publishing, 1964) p. 147.
5) R. H. Silsbee: J. Appl. Phys., 28, 1246 (1957).
6) J. B. Gibson, A. N. Goland, M. Milgram, and G. H. Vineyard: Phys. Rev., 120, 1229
( 1960).
103
7) H. Sakairi, E. Yagi, A. Koyama, T. Karasawa, and R. R. Hasiguti: IPCR Cyclotron Progr.
Rep., 5, 101 (1971).
8) M. W. Thompson: "Defects and Radiation Damage in Metals", (Cambridge Univ. Press,
1969) p. 241.
9) J. W. Corbett: "Electron Radiation Damage in Semiconductors and Metals", Solid State
Physics, ed. F. Seitz and D. Turnbull, SUppl. 2, (Academic Press, 1966) p. 240.
10) G. Dearnaley, J. H. Freeman, R. S. Nelson, and J. Stephen: "Ion Implantation", (North
Holland Publishing, 1973) p. 161.

104
7-4. Secondary Electron Emission from AI and Ni
by Fast-proton Bombardment
A. Koyama, E. Yagi, and H. Sakairi
Secondary electron emission ratios 'Y were measured on A 1 and Ni for fast-protons (2 '" 1 0
Me V) from the cyclotron. The specimens were mirror-polished and cleaned in an etanol-acetone
mixture with an ultrasonic cleaner.
T
... Collimated beam
Fig. 1. Target-collector system. T: target, C: collector,
S: secondary electron suppressor.
>--0 .-...... ~ r-.
c 0
r.Il r.Il
E Cl)
c 0 r-. ...... u Cl) ~
Cl)
>-, r-. ~
'"0 c 0 u Cl)
VJ
2.0
l.5
l.0
0.8
0.6
0.4
l.0
Fig. 2.
0--0 Al
6--6. Ni
2.0 4.0 6.0 10.0 14.0 Proton energy ( MeV )
Dependence of secondary-electron emission
ratio on the incident proton energy.

105
Figure 1 shows the target-collector system used for the experiments. Figure 2 shows the
experimental results on 'Y which fit the following formulas: - 0.75
YAI =1.85E1 ,and
- 0.70 YNi =1.62E1 '
where EI (MeV) is the energy of incident protons.
Aarset et al. measured 'Y A I at the lower energies, below 2 Me V, 1) and the results can be
expressed by the next equation,
A theoretical expression for 'Y is generally given as
- (3 y=aE1 '
in which 0: is mainly related to the transport of the inner secondary electrons and the emission
from the metal surface, while ~ is to the mechanism of the direct excitation of metal electrons
by incident particles. Therefore 0: is influenced by the surface conditions while ~ is not for
the high incident energy and the thin surface contaminant layer in these experiments.
According to the theoretical calculation by Ghosh et aI., who improved the one by
Sternglass,2) the energy dependence of 'Y was expressed as follows: 3 }
- 0.90 Y Al ~EI ,and
E -0.80
YNi ~ I
There is an apparent discrepancy between the experimental and theoretical energy dependence.
Improved calculations are now in progress.
References
1) B. Aarset, R. W. Cloud, and 1. G. Trump: 1. Appl. Phys., 25, 1365 (1954).
2) E. 1. Sternglass: ibid., 108, 1 (1957).
3) S. N. Ghosh and S. P. Khare: Phys. Rev., 125, 1254 (1962).
106
8. RADIOCHEMISTRY AND NUCLER CHEMISTRY
8-1. Charged-Particle Activation Analysis
T. Nozaki, M. Iwamoto, Y. Yatsurugi, and N. Akiyama
After our previous report,!) we have applied charged -particle activation analysis to the
following four studies: (1) examination of reliability and accuracy in the calibration curve for
the infrared spectrophotometry of oxygen in semiconductor silicon, (2) search for effects of
impurity carbon on electronic properties of semiconductor silicon, (3) investigation of the
relationship between ambient carbon monoxide concentration and carbon and oxygen contents
of molten silicon in the single-crystal formation of semiconductor silicon, and (4) development of
convenient procedures for the determination of oxygen in various high-purity matrices by
activation with the 160 CHe, p) 18F reaction. In addition, the determination of surface
impurities by charged- particle activation analysis is under planning. Some results for studies (1)
and (2) have already been published. 2),3)
The equilibrium constant for the carbon monoxide concentration ([CO] in atm) and the
carbon and oxygen contents ([C] and [0] in wt ppm) can be calculated from the solubility of
carbon and oxygen1),2) and the free energy for the reaction of SiC + SiO = 2Si + CO. It is
obtained as:
K= [COJ =1.9 X IO- 7
LCJ [OJ
Preparing silicon crystals under various conditions and analyzing them, we examine the validity
of this equation for the equilibrium condition and also deviations from it in non-equilibrium
states which are usually encountered in the practical single-crystal formation.
For reliable and sensitive determination of oxygen by the 160 CHe, p) 18F reaction, a
convenient technique for the chemical separation of the 18F involving sample decomposition
should be developed for each matrix. We tested the usefulness of the following decomposition
methods: (1) dissolution in alkaline solutions, (2) oxidative dissolution in acids in a closed
system, and (3) electrochemical dissolution. The 18F in the resultant solution has proved to be
made radiochemically pure by the following steps: (I) precipitation of PbFCI or coprecipitation
of CaF 2 with CaC03 , (2) steam distillation of fluorine in the precipitate as H2 SiF 6, and (3)
precipitation of benzidine flu oro silicate or LiF from the distillate. Our final aim is to make
a convenient manual for routine determination of oxygen in a variety of matrices.

107
References
1) T. Nozaki, Y. Yatsurugi, and N. Akiyama: IPCR Cyclotron Progr. Rep., §.' 106 (1972).
2) Y. Yatsurugi, N. Akiyama, Y. Endo, and T. Nozaki: J. Electrochem. Soc., 120, 975 (1973).
3) N. Akiyama, Y. Yatsurugi, Y. Endo, Z. Imayoshi, and T. Nozaki: Appl. Phys. Lett.,
22, 630 (1973).

108
8-2. Mossbauer Emission Spectroscopy of 119Sn
after the EC Decay of 119 Sb
F. Ambe and S. Ambe
Mossbauer emission studies of the electronic state in 119Sn after the Ee decay of 119Sb1)-s)
have been extended further to various antimony and tellurium compounds labeled with 119Sb or
119m Te (parent of 119Sb). A new series of experiments has also been started, in which tin
compounds irradiated with charged particles were analyzed as the Mossbauer source.
The data accumulated so far on 119Sn in the Sn-Sb-Te system have led to a systematics of
the isomer shift. As is seen in Table I, the isomer shift of the 119Sn atoms increases with an
increase in the electronegativity of the nearest neighboring atoms independently of the structure
of the matrix. This is also true even if they are tin atoms in a defect state. In case of the
sources labeled with 119mTe, one cannot be certain a priori whether or not the 119Sn atoms
produced by successive Ee decays of 119mTe via 119Sb occupy the original site of 119m Te, since
the recoil energy accompanying the Ee decay of 119mTe to 119Sb is estimated to be of the same
order of magnitude as the displacement energy in solid. However, if the dominant emission
lines observed for Sn 119m Te 9.nd Sb2 119m Te3 are assumed to represent the 119Sn atoms in the
original site of 119mTe, their isomer shifts fit very well the systematics as shown in Table 1.
The systematics derived above was utilized in its tum to determine the lattice position of
the 119Sb atoms produced by proton reactions on tin in SnSb and SnTe. Powder samples of
Table 1. The isomer shifts of defect and normal 119Sn in Sn-Sb-Te system.
Matrix Nearest Neighbor Isomer
Method of 119 Sn Shifta )
Sn119mTe emission S11 2.26b)
Snl19Sb emission S11 2.43
Sb2119mTe3 emission Sb 2.30b)
119Sb metal emission Sb 2.66
SnSb absorption Sb 2.79
119mTe metal emission Te 3.00
119Sb2 Te3 emission Te 3.37
SnTe absorption Te 3.54
a) mm/s v s , BaSn03 at 78 K.
b) The value refers to the dominant line.

100
(a)
90 :>.
<.n c
'" c
'" % > 100 +- 008' 0 0 0°& '"
'" a::: (bl
98
-4 o 4 8
Relative ve locity (mm /sec vs BaSn03 at 78 K)
Fig. 1. Mossbauer (a) emission and (b) absorption spectra of
p-irradiated SnSb at liquid nitrogen te!11perature.
:>. 92 <.n c
'" ...... c:
'" >
'" a:::
96
-4 o 4 8
Relative velocity (mm /sec vS BaSn03 at 78K)
Fig. 2. Mossbauer (a) emission and (b) absorption spectra of
p-irradiated SnTe at liquid nitrogen temperature.
109

110
SnSb and SnTe were irradiated with 16-Me V protons in a helium atmosphere. Since tin metal
enriched in 120Sn e20Sn 98.39 %, 119Sn 0.39 %) was used for preparation of the samples in
order to minimize the resonant self-absorption of the 23.8 keY Mossbauer r-rays in the sources,
the main nuclear reaction leading to 119Sb must have been the 120Sn (p, 2n) 119Sb reaction. The
Mossbauer emission and absorption spectra of the irradiated samples were measured at liquid
nitrogen temperature. The standard absorber and source used in each measurement were BaSn03
and Ba 119m Sn03 respectively.
Typical spectra obtained are shown in Figs. 1 and 2. The emission spectra (1 (a) and 2 (a))
represent the electronic state of 119Sn in the Mossbauer level after the EC decay of 119Sb
produced by the proton reactions, while the absorption spectra (1 (b) and 2 (b)) show the
radiation effect of the protons on the matrices.
As is seen in Fig. 1 (a), the SnSb irradiated with protons gave an emission line with an
isomer shift of 2.4 mm/s. From the systematics shown in Table 1, this line is attributed to
the 119Sn atoms replacing the Sb-site of SnSb. The emission spectra of p-irradiated SnTe were
composed of two lines with isomer shifts of 2.3 and 3.5 mm/s, which can be assigned
similarly to the 119Sn in the Te - and Sn-sites respectively (Fig. 2 (a)). As the recoil energy
associated with the EC decay of 119Sb to 119Sn is not large enough to displace an atom in solid,
the lattice positions of 119Sn determined from the emission spectra are considered to represent '
simultaneously those of the preceding 119Sb recoiled by the proton reactions. Therefore,
the following conclusion can be drawn from the assignment described above: In case of SnSb
all the recoil 119Sb atoms produced by the proton reactions were stabilized in the Sb-site, while
in SnTe the 119Sb atoms were distributed among the Sn- and Te-sites. These observations show
that the final lattice positions of the recoil 119Sb atoms in the matrices are determined in the
repairing process of the disordered lattice near the end of the recoil track. The absorption
spectra of the irradiated SnSb and SnTe (Figs. I (b) and 2 (b)) revealed no significant difference
from those of the unirradiated samples. This means that the radiation effect of protons on the
matrices was less than the detection limit of the measurement.
References
1) F. Ambe, H. Shoji, S. Ambe, M. Takeda, and N. Saito: Chern. Phys. Lett., 14, 522 (1972).
2) S. Ambe, F. Ambe, and N. Saito: Radiochim. Acta, 19, 121 (1973).
3) F. Ambe and S. Ambe: Phys. Lett., 43A, 399 (1973).
4) F. Ambe, S. Ambe, and H. Shoji: Radiochem. Radioanal. Lett., 15, 349 (1973).
5) F. Ambe, S. Ambe, H. Shoji, and N. Saito: J. Chern. Phys., 60, 3773 (1974).
6) F. Ambe and S. Ambe: Bull. Chern. Soc. Japan, 47, 2875 (1974).
7) S. Ambe and F. Ambe: Radiochim. Acta, (in press).
8) S. Ambe and F. Ambe: Inorg. Nucl. Chern. Lett., 11, 139 (1975).

III
8-3. Behavior of Tritium and Hydrogen Atoms on Metal Surface
M. Aratani
The behavior of tritium and hydrogen atoms mainly on titanium surface has been studied
by means of a charge spectrometer, the details of which being previously reported 1),2). Tritium
atoms were fixed on the surface of a titanium plate (10 mm X 15 mm) in the form of titanium
hydride. This was used as a beta-ray source and as an ion source of the spectrometer. The
effective radioactivity was 96 mCi. Counting rates of various ions were measured at pressures
from 6 X 10- 5 to 2 X 10- 7 Torr for 1 H2 and 4 He gases. In the present ex perimen t, 1 H2 and
4He were used instead of 3H2 and 3He, decay product of tritium, for the reason that use of
tritium-containing gases in a metal chamber resulted in a "sticky" adsorption on the inside wall
of the chamber,3),4) and an isotope effect did not affect adsorption and ionization.
As a result of measurement, it was revealed that there appear i) ground-state ions of helium
at above 3 X 10- 6 Torr, ii) metastable ions of helium at above 6 X 10⁻⁶ Torr, iii) ground-state
ions of hydrogen molecules at above 1.8 X 10⁻⁶ Torr, iv) metastable ions of atomic hydrogen
at above 3.6 X 10⁻⁶ Torr, and v) ground-state ions of atomic hydrogen in every run in the
pressure range examined. Pressure dependence of the counting rates of the ions from i) to iv)
is given by a linear expression, which is reasonably interpreted in terms of Henry-type adsorption
and ionization of the adsorbed neutral species on the surface. The discussion will be published
elsewhere. s)
On the other hand, the ions described in v) show entirely different behavior from the
others. Pressure dependence of the ion counting rate is given by a cubic root expression.
Threshold pressure does not appear in the pressure range examined. Extrapolation by the cubic
root expression gives a threshold value of 10-9 Torr. This small value suggests that the ions are
derived from the very "sticky" species on the surface. The cubic root expression implies that
the species contains three atoms of hydrogen, for example, H3, H3C, H30, and so on. Helium,
the decay product of tritium, is not "sticky" at any pressure below 3 X 10⁻⁶ Torr as decribed
in i) and ii).
One of the most practical conclusions to be emphasized here is that hydrogen as well as
tritium should be used in the pressure range below 10-9 Torr or in a solid form in order to
avoid the "sticky" adsorption.
References
1) M. Aratani, M. Inarida, and N. Saito: IPCR Cyclotron Progr. Rep., :!' 117 (1970).
2) Y. Kawana and M. Aratani: In1. J. Mass Spectrometry Ion Phys., 10, 493 (1972/73).
3) A. Shimamura, M. Tonuma, 1. Sakamoto, and 1. Kohno: Reports I.P.C.R., (in Japanese)

1 12
48, 69 (1972).
4) T. Shiokawa: Private communication.
5) M. Suehiro, M. Aratani, and N. Saito: Mass Spectroscopy (in press).

113
8-4. Mass Asymmetry In the Fission of Actinide Nuclei
S. Yamaji, A. Iwamoto,* S. Suekane,** and K. Harada*
For the five isotopes of Th, Pu, em, Fm, and No and eight isotopes of U, the contour
maps of the constant total potential energy were plotted as a function of the center separation
Zo and the fragment deformations O. The calculation was performed based on Strutinsky's
prescription, 1) in which the liquid-drop model of von Groote and Hilf2) and the modified
two-center harmonic oscillator shell model were used for the macroscopic and microscopic parts,
respectively.
The results of these systematic calculations of the actinide nuclei are collected in Table 1,
in which the positions of the ground state, first saddle, second minimum, and the second saddle
are shown.
Also are shown the ground state energy (E Gs ) relative to the spherical liquid-drop model
energy and heights of the first saddle (E BI)' the second minimum (E II) and the second saddle
(E BII) relative to the ground state.
The discussion about these results by comparing with those of Moller and Nix4) will be
given elsewhere and the present discussion is restricted to the mass asymmetry.
(1) Mass asymmetry and importance of some level pairs
In order to investigate the origin of mass asymmetry, in Fig. 1 the single particle level
diagram at the second saddle is shown as a function of the fragment mass ratio. These are
the neutron levels of 236U because the neutrons are more responsible for the asymmetry than
protons.
From Fig. 1 some pairs of levels with quantum numbers of (N 0 A) and (N + 1 1 A), for
instance, pairs of ([615] 11/2+, [505] 11/2-), ([512] 3/2-, [402] 3/2+), ([512] 5/2-, [402]
5/2+), etc, can be found near the Fermi level. As was already pointed out in Refs. 5 and 6,
these level pairs play an important role in directing the fission to an asymmetric path. The
spacings of these levels are small at the symmetric deformation. The reason is that they begin
to degenerate as Z 0 becomes large in the case of symmetric deformation and that the degeneracy
occurs at an early stage of fission as they have small n z' The level pairs are connected with
the relation,
~N=l, ~nz=l, ~A= 0,
* Japan Atomic Energy Research Institute.
** Osaka City University.

114
118/ 118 ( l. 0 )
631 32 r
743 712 -
752 312
1750+ 761 112
236 U eut r on levels zo= 8.5fm 8 = 0.31
128/ 108 ( l. 185 )
138/ 98 (1. 408 )
MH / ML
148/ 88 0. 682 )
158/ 78 (2. 026 )
Fig. 1. The neutron single-particle level diagram of 236 U calculated
at the second saddle point (Zo = 8.5 fm and D = 0.31) for
symmetric fragmentation as a function of the mass ratio
of the fragments. Each energy level is labelled by the
asymptotic quantum number of Nilsson (Nnz 1\)[2 1T which
is defined here as that of the main component of the wave
function at the second saddle point for the symmetric
fragmentation.
so that they have a large matrix element for the octupole deformation. Therefore they repel
each other when the potential deforms asymmetrically and then level spacings between them
become large.
The most apparent example of this phenomenon can be seen in the pair ([ 615] 11/2+,
[505] 11/2-). As a result, there occurs a rather large energy gap between neutron number 142
and 144 at MH/ ML ;.::: 144/92. This energy gap causes the asymmetric fragmentation.
It should be noted that the single particle levels as a function of mass ratio based on the

115
Table 1. The calculated locations and energies of the ground state, first saddle, second
minimum, and second saddle. All energies are in unit of Me V and Zo are in unit of fm. At
the second saddle, the most favorable masses of heavy fragments, M H, and those of light
fragments, M L, are also shown. For the nuclei with asterisk, the contour maps of the collective
potential energies are very irregular and in particular the locations of the second saddle are very
ambiguous. So the mass ratios of these nuclei have little reliance. The locations were determined
by the visual interpolation from the contour maps. The errors due to the procedure are about
± 0.2 fm for center separation Zo and ± 0.02 for deformation {j.
23~ThI42 23&rh l46
~h150 ~h154 24B-rh1S8
~2UI40
234 U 142
236UI44
238U 146
240U 148
242U150
246U154
250UI58
23~142
240pu146
244Pu150
248Pu154
252pU 158
~~CmI42 242Cml46
246Cm150
250Cm154
2S4Cm158
~~CfI42 244Cf146
248Cf150
250Cf152
252Cfl54
256Cf 158
r~Fm142 246Fm146
250Fm150
2S4FmlS4
258Fml58
roiNo 142
248No146
252No150
256No154
~0158
Ground state ,.---A-----,
Zo 8 EGS
0.0 0.18 1.3
0.0 0.20 0.3
0.0 0.20 - 0.5
0.0 0.20 - 0.5
0.0 0.19 0.1
0.0 0.19 1.2
0.0 0.20 0.8
0.0 0.20 0.2
0.0 0 .20 - 0.3
0.0 0.20 -0.7
0.0 0 .20 - 1.0
0.0 0.20 - 1.0
0.0 0.20 - 0.3
0.0 0.21 0.1
0.0 0.20 - 0.9
0.0 0.20 - 1.7
0 .0 0.21 - 1.6
0.0 0 .21 - 0.9
0.0 0.20 - 0.6
0 .0 0.20 - 1.7
0.0 0.20 - 2.3
0.0 0.20 - 2.3
0.0 0.20 - 1.7
0.0 0.21 - 1.3
0.0 0.21 - 2.2
0 .0 0.21 -2.9
0.0 0.20 -2.9
0.0 0.21 -2.9
0.0 0.21 -2.9
0.0 0.21 - 1.9
0.0 0.21 -2.8
0 .0 0.20 -3.4
0.0 0.20 - 3.4
0.0 0.19-2.8
0.0 0.21 - 2.2
0.0 0.20 - 3.1
0.0 0.20 -3.7
0.0 0.20 - 3.7
0.0 0.20 -3.5
First saddle
2.7 0.20 2.3
2.7 0.25 4.2
2.5 0 .27 5.0
2.5 0.28 5.5
2.5 0.29 5.4
3.5 0.23 1.8
3.5 0.20 2.7
3.2 0. 23 3.2
3.5 0 .20 4.8
2.8 0.25 5.2
2.5 0.26 5.8
2.4 0.27 6.0
2.5 0.28 5.4
3.1 0.23 3.4
2.9 0 .24 5.4
2.5 0.26 6 .2
2.5 0 .27 6.1
2.5 0 .28 5.7
3.0 0.24 3.7
2.8 0.24 5.6
2.5 0.26 6 .6
2.4 0 .27 6.9
2.5 0 .27 6.4
3.0 0.24 3.8
2.7 0 .25 5.7
2.5 0.26 6.7
2.5 0.27 6.6
2.4 0 .27 7.0
2.5 0.30 6.8
2.8 0.25 4.2
2.6 0.25 5.8
2.5 0.26 6.8
2.5 0.27 7.1
2.4 0.27 6.6
2.8 0 .25 3.7
2.7 0.25 5.6
2.5 0.27 6.6
0.5 0.37 6.6
2.5 0.27 7.0
Second minimum ~
Zo 8 Ell
4.5 0.30 1.0
4.5 0.30 1.8
5.0 0.30 3.0
5.6 0.23 3.6
5.5 0.56 3.4
4.7 0.29 0.3
4.5 0.30 0.7
4.5 0.30 1.3
4.5 0.30 1.8
4.5 0.30 2.2
5.7 0.21 2.7
5.9 0.21 3.3
5.8 0.26 3.4
4.8 0.30 0 .5
4.7 0.30 1.5
6.0 0.20 2.3
6.2 0.21 3.0
6.0 0 .26 3.0
4.8 0.36 0.5
4.8 0.30 1.4
6.1 0.21 2.0
6.3 0.22 2.7
6.9 0.19 2.6
5.0 0.30 0.1
5.0 0.31 0.9
6.4 0.20 1.6
8.2 0.12 1.5
9.1 0.00 1.6
9.3 0.00 0 .6
5.3 0.31 - 0.4
5.1 0.31 0.3
6.5 0.21 1.1
8.1 0 .12 1.3
5.7 0.33 - 1.6
5.4 0.33 -0.4
6.7 0 .22 0.2
7.3 0.20 0 .2
Second saddle ~--------~------------\
Zo 8 EBII MH ML MH/ML
9.0 0.35 7.3 147 85
9 .0 0.32 7.1 148 88
9.0 0.30 8.4 147 93
9.8 0.21 9.1 146 98
13.0 0.1111.1 129 119*
8.2 0.35 4.3 147 85
8.5 0.35 5.1 148 86
8.5 0.31 5.3 146 90
8.8 0.32 6 .2 148 90
8.9 0.30 6.7 147 93
8.8 0.30 7.3 147 95
9 .0 0.31 7.2 149 97
11.1 0 .08 8.7 130 120*
8.0 0 .35 3A 146 90
8.5 0.30 4.8 145 95
9.0 0.25 6.6 145 99
10.0 0 .15 7.8 136 112*
12 .0 0 .00 6.2 129 123*
7.6 0 .36 2.0 145 93
8.3 0.29 3.8 144 98
8.6 0 .28 5.0 145 101
9 .6 0.16 6 .7 138 112*
9 .2 0.04 3A 127 127*
7.5 0 .35 0.8 144 96
8.3 0.31 2.0 145 99
10.0 0.10 4.3 130 118*
9A 0.05 3.9 132 118*
10.8 0 .00 3A 130 122*
6 .6 0 .41 - 0.3 141 101
6.5 OA3 1.9 146 100
9.5 0.03 2.G 128 122*
9 .5 0 .05 1A 128 126*
6.4 OAO - 2.2 139 105
6.6 OA2 - OA 144 104
8.7 0 .25 1.0 143 109
9 .8 0.09 0.8 131 125*
1.729
1.681
1.580
1.489
1.084
1.729
1.720
1.622
1.644
1.580
1.547
1.536
1.083
1.622
1.526
1.464
1.214
1.048
1.559
1.469
1.435
1.232
1.000
1.500
IA64
1.101
1.118
1.065
1.396
1.460
1.049
1.015
1.323
1.384
1.311
1.048

116
asymmetric two-center shell model can give results very similar to those of Ref. 5 based on the
one-center deformed shell model in which the strength of the Y 3 and Y 5 deformations must
be carefully adjusted to reproduce the mass asymmetry.
(2) Constancy of the mass of the heavy fragments
We tried to understand a very interesting result that the masses of the heavy fragments
are fairly constant (see Table 1). In Fig. 2 is shown the dependence of the shell correction
energies of the neutron and the proton on the nucleon number and the mass ratio at the second
saddle point (Z o = 8.5 fm, 0 = 0.31), respectively.
From Fig. 2(a) , the energy gain in the shell correction energy of the neutron is about 5
MeV in the region of the neutron number 140 - 150, as the mass ratio increases from 1.0 to
2.0 and is most responsible for the mass asymmetry. The large energy gain comes from the
rapid fall of the level [505] 11/2-, as was pointed out in Fig. 1.
\(' u t r-t m
z,. 8.5 fm
J = 0.3 1
4.0
~ 3 o· ;::::
-
~ 2.0 '
" <- 1. 0
~ - 1. 0 ",
} - 2.0
, . ,
,-, ; ' " ... . ",' 'J!
(f)
~. de
'IWh \, ,' ... ..,l , I ''. .,' v-
"I , '" • '
\.;~o 7'~ -"~: 1 ~0 \+ '~~ 1.4 _
" .... : ............ : ,/ 0-~ . .::?
\('utron number
( a )
~ \ / -, , . 1.' 1.2 \ " \ \....... \
~ '\ ... ~
--' 1.0 180
l
- 1 8
3.0
(h)
Fig. 2. The shell correction energy at the second saddle point (Zo = 8.5 fm, 0 = 0.31) as a
function of the mass ratio and the nucleon number. The single particle level of 236 U are
used for the calculation of the shell correction energy.
The neutron number at which the shell correction energy is minimum decreases from 160
to 140 as the mass ratio increases from 1.4 to 1.6 in Fig. 2(a).
This tendency of the shell correction energy of the neutron is consistent with the
constancy of the mass of the heavy fragments through the isotopes.
In Fig. 2(b) , it can be seen that the energy gain in the shell correction energy of the proton
with the proton number 90 is about 2 MeV as the mass ratio increases from 1.0 to 2.0.
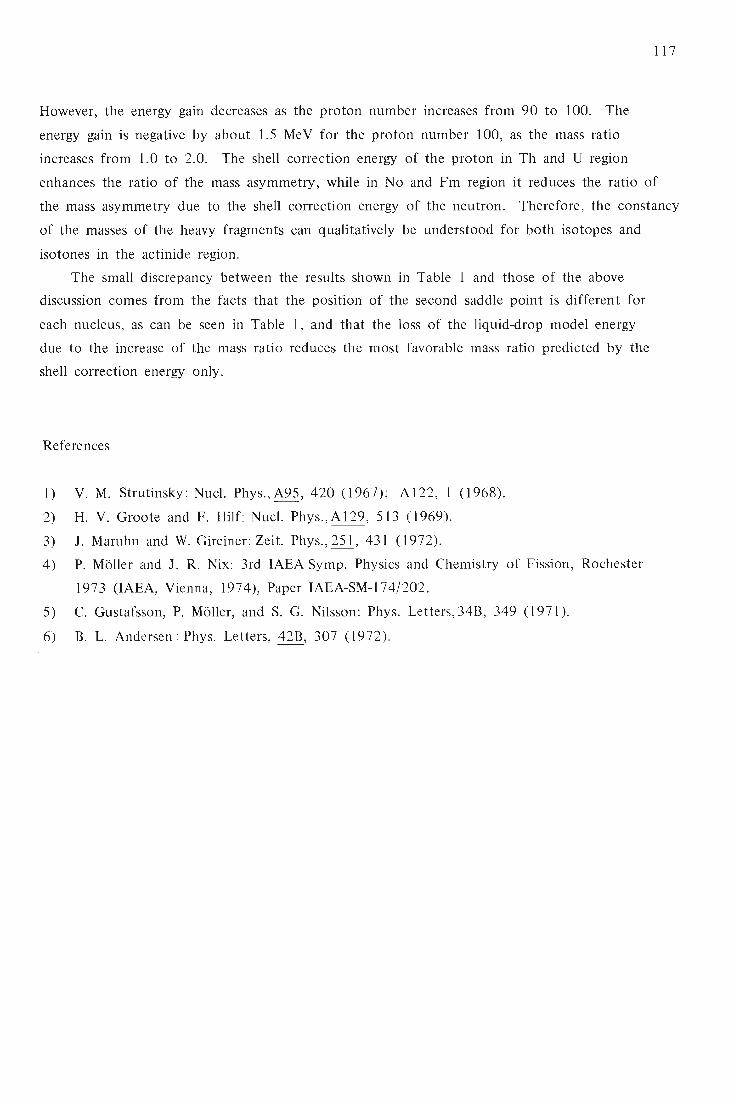
117
However, the energy gain decreases as the proton number increases from 90 to 100. The
energy gain is negative by about 1.5 MeV for the proton number 100, as the mass ratio
increases from 1.0 to 2.0. The shell correction energy of the proton in Th and U region
enhances the ratio of the mass asymmetry, while in No and Fm region it reduces the ratio of
the mass asymmetry due to the shell correction energy of the neutron. Therefore, the constancy
of the masses of the heavy fragments can qualitatively be understood for both isotopes and
isotones in the actinide region.
The small discrepancy between the results shown in Table 1 and those of the above
discussion comes from the facts that the position of the second saddle point is different for
each nucleus, as can be seen in Table 1, and that the loss of the liquid-drop model energy
due to the increase of the mass ratio reduces the most favorable mass ratio predicted by the
shell correction energy only.
References
1) V. M. Strutinsky: Nucl. Phys.,A95, 420 (1967); A122, 1 (1968).
2) H. V. Groote and F. Hilf: Nucl. Phys.,AI29, 513 (1969).
3) 1. Maruhn and W. Gireiner: Zeit. Phys., 251, 431 (1972).
4) P. Moller and 1. R. Nix: 3rd IAEA Symp. Physics and Chemistry of Fission, Rochester
1973 (lAEA, Vienna, 1974), Paper IAEA-SM-174/202.
5) C. Gustafsson, P. Moller, and S. G. Nilsson: Phys. Letters, 34B, 349 (1971).
6) B. L. Andersen: Phys. Letters, 42B, 307 (1972).

118
9. RADIATION CHEMISTRY AND RADIATION BIOLOGY
9-1. Heavy-Ion Radiolysis of Liquid Aldehydes
M. Matsui and M. Imamura
We have reported the significant LET effects observed for liquid aliphatic ketones over a wide
LET range up to 90 eV / A.1), 2) In these studies, the radiolytic yields of the main gaseous products, o
H2 and CO, showed peaks in the range of LET = 50 - 70 eV / A, and the ratios of the two yields,
G(H2 )/G(CO), increased steadily with an increase in LET. These results suggest the thermal
decomposition of free radicals and/or the formation of highly excited states in a confined volume
of the track cores of heavy-ion radiations.
An extensive study has been carried out also for some liquid aliphatic aldehydes; the preliminary
results obtained for propionaldehyde will be described in this report. Emphasis is put on the o
radiolysis results in the relatively high LET region using N ions of 43 - 45 MeV (LET~65 eV/A).
The main gaseous products from aldehyde were H2 and CO, the yields of which were
determined by gas chromatography . Their yields increased steadily with an increase in LET; G(H2 ) o
and G(CO) at LET of 60 eV / A were approximately 5 and 2, respectively. This result is in contrast
with the case of pure ketones and indicates that an excessive energies deposited in the track core
of high-LET particles may easily be transferred to the outside of the core , as in the case of
ketones containing a small amount of H2 O. However, in view of the increase of the ratio,
G(H2 )/G(CO) , with an increase in LET, thermal decomposition of free radicals produced from
excited molecules must be important within high-LET tracks.
Major products other than H2 and CO were C2 -hydrocarbons: C2 H2 , C2 H4 , and C2 H6 , which
were not detected by gaschromatography from samples irradiated at low doses, however. They
were observed to form and increase at a dose above 2 x 10¹⁹ e V. The yields of H2 and CO showed
no dose dependency .
It has been demonstrated 3 ),4) that liquid aldehydes containing olefin hydrocarbons produce
telomers, RCO(CH2 -CH2)nR (R=alkyl radicals) , by 'Y-ray irradiation, and that the degree of
telomerization increases with temperature. In the present study, a considerable amount of liquid
with high boiling point was produced at a dose of around I x 10 19 eV, where no C2 -hydrocarbons
were detected. This product did not contain diethylketone (n=O), and presumably comprises
several kinds of telomers. The production of C2 -hydrocarbons above 2 x 10 19 eV is considered
to be due to the secondary radiolytic decomposition of these telomers. Further studies are in
progress.

1 19
References
1) M. Matsui, M. Imamura, and T. Karasawa: IPCR Cyclotron Progr. Rep., 5, 90 (1971); 7, - -
112 (1973).
2) M. Matsui and M. Imamura: Bull. Chern. Soc. Japan, 47, 1113 (1974).
3) K. Hirota and M. Hatada: ibid. , 33, 1682 (1960); K. Hirota, S. Iizuka, H. Ochi, and M.
Hatada: ibid., 36, 115 (1963).
4) C. E. Stoops and C. L. Furrow: J. Org. Chern., 26, 3264 (1961).

120
9-2. Optical and ESR Studies on Single Crystals of KBr and CdS
Irradiated with Heavy Ions
K. Kimura, M. Matsui, and M. Imamura
Interaction of ionizing radiations with condensed matter produces highly excited states along
their paths. Several short-lived species (excited states, excitons, ions, electrons, and neutral free
radicals) are formed in the next physico-chemical stage. These species are localized in the vicinity
of the radiation paths for a short time, forming spurs or tracks; the spatial distribution of these
species is dependent upon the LET of the radiation.
Several studies have been made on the spatial distribution of these intermediates species in
X- or 'Y-ray irradiated glasses and solids, but quite few in heavy ion-irradiated systems. Heavy
ions having LET much higher than that of X- or 'Y-rays may give higher local concentrations of
the species with different spatial distribution.
We have already reported ESR studies on some organic crystals irradiated with heavy ions. 1),2)
It was found that these studies could provide valuable information on the spatial distribution of
intermediate species, and therefore on the primary processes of radiation chemistry.
This report presents the results of color-center formation in KBr and emission from CdS by
C-ion irradiation.
(1) Color centers produced in KBr single crystals
KBr single crystals were subjected to 85-MeV C-ion irradiation at 77 K, and their optical
absorption and ESR spectra were recorded. 60Co--y irradiation was also carried out for comparison.
0.8
0.6
. ~ u _ 0.4 8 0-
o
0.2
Wove length ( nm )
Fig. 1. Absorption spectra of the C ion-irradiated (a) and
the 'Y-irradiated (b) KBr single crystals recorded at
77 K.

Figure 1 shows the electronic spectra. The species having a peak at 600 nm may be
assigned to the F-center. The V k-center ("'max = 410 nm) was not observed for the C
ion-irradiated sample. In contrast, the V 4 -center, which was not observed for the r-irradiated
sample, appeared at 275 nm. The significant difference in the electronic spectra may be due to
the thermal effect in heavy-ion tracks or an essentially different process between the twC'
systems.
ESR spectra of the F-center are shown in Figs. 2 and 3. These spectra were recorded at
10 0 gauss
Fig. 2. ESR spectrum of the Cion-irradiated KBr
single crystal recorded at 77 K after annealing
at l30K.
Fig. 3. ESR spectrum of the r-irradiated KBr single
crystal recorded at 77 K after annealing at
130 K. Arrows indicate Mn 2+ standard signals.
121

122
77 K after annealing the samples at 130 K; the annealing eliminated the spectra due to species
other than F-centers. The linewidth of the spectrum for the C ion-irradiated sample is only a
quarter of that for the ,),-irradiated one.
The linewidth sharpening may be accounted for in terms of the exchange narrowing between
F-centers trapped closely in the C ion-irradiated sample. In fact, on increasing the temperature
of the C ion-irradiated sample to about 200 K, at which the F -centers become mobile its , linewidth showed broadening to the same extent as that for the ,),-irradiated one. This argument
is also supported by the experimental results on power saturation. A mean separation between
F-centers in the C ion-irradiated sample was estimated to be 4 - 5 lattice units.
(2) Emission from CdS single crystals.
Determination of emission spectra during heavy-ion irradiation is one of the important
experiment which may provide information on the nature of excited states produced by heavy-ion
irradiation. No similar studies have been reported so far.
Preliminary experiments have been carried out to detect emission spectra from CdS single
crystals under 85- MeV C-ion irradiation. Emission could be detected successfully and its
spectrum was recorded by use of a monochromator and a photomultiplier; the spectrum gives
peaks between 480 and 500 nm. However, owing to the weakness of the emission, no detailed
results are available at this time. Improvement of the apparatus is now going on.
References
1) K. Kimura, M. Kikuchi, M. Matsui, T. Karasawa, M. Imamura, Y. Tabata, and K. Oshima:
IPCR Cyclotron Progr. Rep., ~, 110 (1972).
2) K. Kimura, M. Matsui, T. Karasawa, and M. Imamura: ibid., 2, 114 (1973).

123
9-3. LET Effect on the Radiation-Induced
Polymerization of Styrene
T. Yasukawa, T. Takahashi, M. Matsui, and M. Imamura
Radiation-induced polymerization in bulk and solutions is not a homogeneous reaction,
because primary radicals or ions produced by irradiation are distributed inhomogeneously in spurs
or tracks. Fair portions of active species are deactivated by neutralization or recombination in
spurs without participation in polymerization, and only those active species which escape spurs
initiate polymerization reactions. Under ordinary conditions, radiation-induced polymerization of
styrene proceeds following the radical mechanism and polystyryl radicals are mostly deactivated
by the recombination between them. The coupling between polymeric radicals is diffusion-controlled
and consequently considered sensitive to the degree of polymerization of polymeric radicals. For
the time being, however, the chain-length effects on the coupling process of polymeric radicals
have not been elucidated sufficiently.
The chain-length distribution of polymer reflects accordingly the initial distribution of
primary active species and the coupling processes of polymeric radicals. Hence, it would afford
valuable information to investigate the LET effects on the molecular weight distribution of
polystyrene obtained by various kinds of radiation.
Table 1. The G-values of gaseous products and polystyrene in the Cion-induced
polymerization reaction of styrene. At room temperature and the total
dose of 4.1 x 10¹⁸ eV in vacuo.
Product Polymer
G-value 1.34 0.21 0.03 0.87 0.04
Purified styrene sealed in vacuo in an irradiation vessel equipped with a thin Al window was
irradiated with 83 MeV C ions to a dose of 4.1 X 10¹⁸ eV. Irradiated solutions were degassed by
freeze-thaw cycles, and gaseous products were analyzed by gaschromatography. Polymer was
separated from styrene monomer by vacuum distillation. Table 1 shows the G-values of gaseous
products and polymer. The composition and the G-values of gaseous products are similar to
those of ordinary compounds whereas the G-value of polymer chains is considerably small. The
molecular weight distribution of polystyrene is shown in Fig. 1. Fair portions of polymer have a
molecular weight larger than 1 x 10⁶; this fact shows that some polymeric radicals have
lifetimes as long as lOs. Different from ordinary polystyrenes obtained by radical initiators or

124
c o .::; 1 u
~
O+---~~--~~--~--~~--~-----.--------~
o 10
l\loi ec ui a r II"e ig ht X lO -5
Fig. 1. Molecular weight distribution of polystyrene
obtained by C-ion irradiation at room
temperature. Energy of incident C-ions was
17.0 MeV and a total dose was 4.1 x 10¹⁸ eV.
Mo lec ular we ight X 10 -5
Fig. 2. Molecular weight distribution of
polystyrene obtained by electron
irradiation at 30 °C. Total dose was
6 x 10¹⁸ eV/g.
photo-polymerization, the polystyrene obtained by C-ion irradiation has a considerably large value
of Mw/Mn = 4.48. (Mw and Mn stand for the weight-average and number-average molecular
weights, respectively.) These results suggest that growing radicals are not distributed homogeneously
in solution. After all , we may well consider that in the C ion-induced polymerization of styrene,
only a small portion of primary radicals « 1 %) escapes the tracks to initiate polymerization
reaction effectively , and that spatial distribution of growing radicals is considerably inhomogeneous.
In order to avoid secondary reactions, electron irradiation of styrene was carried out by means
of a flow method. Styrene flowing in a stainless-steel pipe of 4 mm ¢ was irradiated with 1.5 MeV

electrons through a slit 5 mm wide. Styrene monomer was circulated by using a gear pump at a
rate of 10 m£/s at 30°C; the dose rate was ca. 3 X 10 18 eV/g. s.
125
Figure 2 shows the molecular weight distribution of polymer obtained under these conditions.
Different from Fig. I, the distribution is fairly sharp and Mn is small. Although experimental
conditions were considerably different from those for the C-ion irradiation, these results suggest
that growing radicals are distributed homogeneously in respective volume elements of styrene
flowing in the pipe.
Details of the experiments and discussion will be published elsewhere.
126
9-4. Inactivation of a Radioresistant Vegetative Bacterium Micrococcus
radiodurans by Charged Partie les
A. Matsuyama, T. Takahashi, and F. Yatagai
Since the repair capacity for radiation damages in DNA is expected to affect the LET effect
upon bacterial inactivation, it is interesting to investigate the inactivation of repair-proficient
bacteria by charged particles of different LET's. Micrococcus radiodurans has been found to have
an efficient DNA repair capacity which may be responsible for its extraordinary resistance to
"(- and X-rays. 1)- 4) Thus, in a series of our studies on bacterial inactivation by cyclotron beams,
the LET dependence of the cellular radiosensitivity of M. radiodurans was determined under the
same experimental condition as~. coli, and the results obtained were compared with those
reported by Dewey.S)
Since the parameters of the survival curve of M. radiodurans considerably varied according
to conditions, care was taken for the preparation of cell suspensions to be irradiated. M.
radiodurans was grown overnight in a TGY broth (0.5 % Difco tryptone, 0.1 % glucose, and 0.3 %
yeast extract; pH 7.0) at 37° C in a shaker culture under an aerobic condition. A 0.5 mt portion
of the first culture was transferred into a lOme fresh TGY broth, and after 4 h of the second
incubation at the same temperature, log-phase cells were centrifuged and washed twice with a
0.067 M phosphate buffer. The cell pellet obtained was maintained in an ice bath until use.
Immediately before irradiation, cells were suspended in the 0.067 M phosphate buffer at a
concentration of about 1 x 10- 8 cells/mf. Preparation of the monolayer of bacterial cells on
membrane filters and irradiation were performed as previously described.6) Survivors were
determined by plating appropriate dilutions on a TGY agar.
Some examples of survival curves determined for a-particles, carbon, and nitrogen ions as well
as 60Co "(-rays are shown in Fig. 1. M. radiodurans gave the non-exponential survival curve
consisting of a shoulder, followed by an exponential slope not only for 60Co "(-rays but also for
all charged particles used in this study. This observation is compatible with the results obtained
by Dewey (the same bacterium)S) and by Mortimer et al. (yeasts).7) However, Todd8 ) reported
that the survival curve of cultured mammalian cells becomes exponential in the LET region higher
than about 220 keY/11m and the shoulder disappears from the curve. LET dependence of the
length of the shoulder and the inactivation constant (k) calculated from the exponential slope
are shown in Figs. 2 and 3, respectively. The results can be tentatively summarized as follows:
(I) the length of the shoulder on the survival curve increases with increasing LET, especially in
the LET region for heavy ions, (2) the inactivation constant k appears to decrease without any
distinct peak as LET increases, and (3) the effective inactivation cross section (Seff) for the
exponential slope, which represents the relative effectiveness per particle, is remarkably dependent
upon LET in the region for a-particles, but little dependence is observed for heavy ions (Fig. 4).

" 10
-1
.~
u '"
-2
..t 1
0 go .-
-3
.~ 10
(f)
10-4
10-5
15
::0- ~
10
:a ;:::::,
1000
20
00
3000
D
ose
(kra
d)
Ell 6
0Co
Y -
ray
s
o a
-pa
rtic
les
6 C
-io
ns
o N
-io
ns
o
6 o
4000
Fig
. 1.
Su
rviv
al c
urve
s o
f M
. ra
diod
uran
s.
o
o 60
Co
Y -
ray
s o
a-
par·
ticI
es
6 C
-io
ns
o N
-io
ns
50
o 00
o 100 o
0 o
200
LE
T.
(keV
/j.l
m)
6 o 0
J.!
) ~
o o 0 6
o 0
6 6
6 0~
o
500
1000
20
00
Fig
. 3.
L
ET
dep
end
ence
of
inac
tiva
tion
con
stan
t (k
)
for
the
exp
onen
tial
slo
pe
of
surv
ival
cur
ves
of
M.
radi
odur
ans.
(T
he i
nac
tiva
tion
con
stan
t k
is
the
reci
proc
al o
f D
37
fo
r th
e ex
pon
enti
al s
lop
e.)
-0
~
2 :;E
'" if) o -
0 ~ -
0
:;
~
(f)
o
o
~
o 60
Co
Y
-ra
ys
o a-
part
icle
s 6
C -
ions
o
;\1
-io
ns
o 0
0 o
0
o o
~0
60
o
@~~
6
50
100
200
500
1000
L
ET
. (k
eV/j
.lm)
2000
Fig
. 2.
L
ET
dep
end
ence
of
the
len
gth
of
the
shou
lder
on s
urvi
val
curv
es o
f M
. ra
diod
uran
s.
0.1
0
~ 0
.05
E
:::t.
(f)
0.0
2
0.0
1
o 50
o o
o 8
o
100
200
LE
T.
(keV
/j.lm
)
~
00
0
~(!f
<
!h0
0
00
6
6
6
o o
o a-p
art
icle
s 6
C -
ions
o
)J -
ions
500
1000
20
00
Fig
. 4.
L
ET
dep
end
ence
of
effe
ctiv
e in
acti
vati
on c
ross
sect
ion
(Se
ff)
for
M.
radi
odur
ans.
N
-....)

128
The result concerning LET dependence of the shoulder length is consistent with that obtained
by DeweyS) as mentioned above, whereas changes in the inactivation constant appear somewhat
different. Further determination and analysis of the data are now under way. (The results
described here are also slightly different from those reported in previous notes6),9) of this series.
The difference might be partly due to different experimental conditions, which will be discussed
in the future study.)
References
I) B. E. B. Mosely and H. Laser: Nature, 206, 373 (1965).
2) C. J. Dean, P. Feldschreiber, and J. T. Lett: ibid., 209,49 (1966).
3) S. Kitayama and A. Matsuyama: Biochem. Biophys. Res. Commun., 33, 418 (1968).
4) A. D. Burrell, P. Fe1dschreiber, and C. 1. Dean: Biochim. Biophys. Acta, 247, 38 (1971).
5) D. L. Dewey: Int. J. Radiat. BioI., 16, 583 (1969).
6) A. Matsuyama, T. Karasawa, S. Kitayama, and R. Takeshita: IPCR Cyclotron Progr. Rep.,
~, 101 (1969).
7) R. Mortimer, T. Brustad, and D. V. Cormack: Radiat. Res., 26, 465 (1965).
8) P. Todd: Radiat. Res. Suppl.,2, 196 (1967).
9) A. Matsuyama, T. Karasawa, T. Takahashi, Y. Asano, K. Igarashi, H. Kano, E. Fukuda, and
Y. Ando: IPCR Cyclotron Progr. Rep., :!> 132 (1970).

129
9-5. LET Effects on Production of DNA Single-Strand Breaks and Their
Repair in £. coli B/r
K. Igarashi, F. Yatagai, T. Takahashi, and A. Matsuyama
In a previous paper,l) it was reported that the efficiency of production of DNA single-strand
breaks in E. coli Bs- 1 decreases proportionally with increasing LET 00 above 90 keY Ipm. Since
there are pieces of evidence that DNA is a target molecule for bacterial inactivation, the LET
effect on DNA-strand breakage in bacterial cells endowed with different DNA-repair capacities has
been investigated. In this report, the production and repair of DNA single-strand breaks in E.
coli Blr cells irradiated with a-particles and nitrogen ions accelerated in the cyclotron are described.
For comparison, irradiation with 60Co 'Y-rays was also carried out. Procedures of irradiation and
determination of DNA single-strand breaks in log-phase cells of E. coli Blr labeled with
3H-thymidine were the same as previously reported. 1) - 3)
Survival curves of E. coli Blr determined for 60Co ,),-rays, a-particles, and nitrogen ions were
all exponential. Figure I shows the sedimentation profiles in alkaline sucrose gradients of
3H-DNA from E. coli Blr cells irradiated with these three kinds of radiation. For all types of ---
radiation used here, irradiation was performed with three different doses giving surviving
fractions of 1 x 10- 2, 1 x 10- 4, and 1 x 10- 6 in order to confirm the linear relationship
between the number of DNA-strand breaks and dose. Using values of the number-average
molecular weight of DNA calculated from the sedimentation profiles, one can obtain the
dose-response curves for DNA-strand breakage produced by radiations and then values of the
efficiency of DNA single-strand break production, Esb (eV Ibreak). As can be seen in Fig. 2, Esb
increases with increasing LEToo. Although the number of data obtained with E. coli Blr is still - --insufficient, it appears that Esb can be regarded as a linear function of LET 00 and the LET 00 -Esb
curve for nitrogen ions shifts to the higher LET side as compared with that for a-particles.
These results obtained with strain Blr are consistent with those reported with strain BS
-1
.
However, Esb values of strain Blr were larger than those of strain BS
- 1 at the same LET. This
difference in Esb values between these two strains will be examined in further determinations.
In order to compare the rates of DNA repair after exposure to 60Co ')'-rays and nitrogen
ions, cells were reincubated at 37°C for 40 min after irradiation. Fi~ure 3 shows examples of
sedimentation profiles of 3H-DNA during the course of post-,irradiation- incubation. Both doses
indicated in Fig. 3 gave a surviving fraction of 1 x 10- 4. Relationships between the time of
post-irradiation incubation and the number of DNA single-strand breaks calculated from
sedimentation profiles during post-irradiation incubation are illustrated in Fig. 4. The results
indicate that DNA single-strand breaks are hardly repaired after the exposure to nitrogen ions,
while they are appreciably rejoined after ')'-ray irradiation, and that nitrogen ions produce a
smaller number of single breaks than ')'-rays at the same cell survival lebel (Fig. 4).

130
10 ( a ) Q' - par'ticl e s
11.44 MeV / a mu }
( h ) :\-ion s 14,75 i\! e \ ' / am u 1
10 -
40
I e ) Co- 60 Y- ru ys
10
Sed im en ta tion distance I mm )
2000
1000
c::o U)
500 ........ >
Il!
~ ~
200
100
100 200
Dose:
(a) 0 ,38.6 krad; -,57.4 krad; 6,77.6 krad
(b) o , 42.8 krad; -,80.2 krad; 6, 140 krad
(c) 0, 28.0 krad; -, 56.0 krad; 6 , 112 krad
Surviving fraction:
(a) and (b) 0 , 1 x 10- 2 ; -,Ix 10- 4; 6, 1 x 10- 6
(c) o , 1 x 10- 1 ;_, 1 x 10- 2; 0,1 x 10- 4
Fig. 1. Sedimentation profiles of 3H-DNA
from E. coli B/r immediately after
irradiation.
/
500 1000 2000 LET , ( k e V / Jl m )
Fig. 2. LET dependence of the efficiency of DNA single-strand break production (Esb )
in §.. coli B/r. 6, a-particles ; 0 , nitrogen ions.

I
'" .s ':;
:);
~ c :);
u
;t
10 ~ - io ns
10
4, 75 l\l e \ ' / a mu \ 80, 2 k ,'a d )
Cu-60 Y - r a ~' s
( 112 krad )
40
<D'.<I? I ,
, ft.' i B :\' l'\ '8' ,. I II , \ " , . " t '
~' I tI... " ,/ . ~ . ,e ':S '-I , " '(\ \
: : • II ~ " , ell.. I
'/ ~ . I
" ;, " ; #.1
II •
ft·-' 20
• \I I , 'A I , tJjBe I,
, I I
'tr{ \ \ l:u. El'
·'T'.\~ \l)1'
\ I
Me n isc us
Sedim e ntati o n di s ta nc e ( mm )
0 , Unirradiated;., Irradiated, no reincubation ;
8 , CD , and @ , Irradiated, reincubated for 5, 15 ,
and 40 min, respectively.
Fig. 3. Sedimentation profiles of 3H-DNA from §..
coli Blr after post-irradiation incubation.
131
g IOJ7~ ~ ~ ~o 0
Fig. 4. Changes in number of radiation-produced
DNA single-strand breaks in §.. coli Blr
during post-irradiation incubation. A and
B: 112 krad and 56 krad of 60Co :y-rays,
respectively ; C and D: 80.2 krad and
42.4 krad of nitrogen ions, respectively.
Surviving fraction : A and C, 1 x 10- 4 ;
.t .----_:©l~ C - -=tg-----=e-------il-----_.
o Z
@--- p---IOJ ---- - --- ---@------If-----_e
l ! Ii ~ o 10 15 1/ 40
M in, of pos t i l'rad ia ti on in c uba tion a t 37" B an d D, 1 x 1 0 - 2.

132
References
1) K. Igarashi, F. Yatagai, T. Takahashi, and A. Matsuyama: 1. Radiat. Res., 15, 148 (1974).
2) A. Matsuyama, T. Karasawa, S. Kitayama, and R. Takeshita: IPCR Cyclotron Progr. Rep.,
3, 101 (1969).
3) K. Igarashi, F. Yatagai, T. Takahashi, and A. Matsuyama: ibid., 7, 122 (1973).

133
1 o. PREPARATION OF RADIOISOTOPES AND LABELED COMPOUNDS
10-1. Production of Radio'isotopes and Preparation of
labeled Compounds for Medical Use
T. Nozaki, S. Ambe, M. Iwamoto, A. Tahara, T. Ohsawa,
T. Karasawa, M. Okano, T. Ido, K. Fukushi, K. Suzuki,
L. Iwata, T. Hara, and K. Taki
We have continued our work on the preparation of 18F-organic compounds and the
measurement of their in vivo distributions. The production of 28Mg and 13NH3 and the preparation
of seleno-methionine labeled with nSe and 73Se have also been studied. Further, our production
techniques for 43K and 1231 recently have been notably improved.
By the reaction of Ag 18F with 6-chloro-9-benzylpurine in toluene, 6-fluoro-9-benzylpurine-18F
was prepared. This compound was found to have a marked tendency of being concentrated in
brain. The 18F-labeling of some physiologically active steroids has aroused our interests for medical
use. Introduction of ISF-atom into the steroid molecule was completed by cleavage of epoxide
ring with B1S F3· Et2 0. The utilization of other fluorinating reagents (e.g., CF30 18F) is now under
study.
The yields of 28Mg for triton-induced reactions were already reported. I) Possible ex-particle
reactions for the production of 2SMg were also examined, and a convenient process for the
carrier-free separation of 2SMg from an aluminum target was devised. A paper describing details
of these studies is in press.2)
The proton bombardment of water has been used for the production of 13N. The excitation
curve for the reaction of 16 0 (p, ex) 13N was measured; a 13N activity sufficient for diagnostic use
is shown to be obtained by this bombardment even for an incident energy of 9 MeV. A major
portion of the 13N thus produced in water was found to be usually in anionic states. The 13N
was converted into carrier- and salt-free 13NH3 by a reductive distillation, and its distribution in
mice was measured. The 13NH3 has proved to be useful in heart scanning.
Now in Japan, two medical-use cyclotrons are under trial operation and a so-called Baby
Cyclotron capable of producing only llC, 13N, lSO,and lSF is under construction. Most of our
present experiments are so designed as to give good empirical bases for _satisfactory uses of each
of the new machines.
References
1) T. Nozaki, M. Furukawa, S. Kume, and R. Seki: IPCR Cyclotron Progr. Rep., ~, 83 (1971).
2) T. Nozaki, M. Furukawa, S. Kume, and R. Seki: Int. J. Appl. Radiat. Isotopes, ( in press. )

13,1
11. RADIATION MONITORING
11 -1. Routine Mon itoring
K. Koda, 1. Sakamoto, and I. Usuba
Results of routine monitoring on the cyclotron obtained from January to December 1973
are described.
No remarkable change in leakage radiation and residual activities was observed during this
period.
(1) Surface contamination
The surface contamination of the floor of the cyclotron room , where the highest level of
contamination had usually been detected in the cyclotron building, has been kept to be about
10- 6 - 10- 7 J1Ci/ cm 2 as a result of wiping-off of the floor twice a year.
(2) Drainage
The concentrations of radioactive nuclides in drain water and sediments in the drainage tank
of the cyclotron building were measured and found to be of the order of 10- 7 J1Ci/ cm3 and
10- 4 J1 Ci/ cm3 , respectively. This difference would have been caused by the nbsorption of
radioactive nuclides dissolved in drain water by the sediment.
(3) Personnel monitoring
Owing to the revision of the regulation of the work in the cyclotron vault as described in a
previous report,1) the exposure of workers decreased remarkably as shown in Table 1.
It was shown that no one received a dose above lOOO mrem and the average value of dose
per person in this period was cut down to less than one-half of that in the previous year.

135
Table 1. Annual exposure dose distribution of the workers and average dose from
1969 to 1973.
(Dose accumulated from April to next March.)
Total number Dose distribution (mrem) Average dose A
Year of workers Unde: 10 101 301 >1000 per person
tectable 100 300 1000 (mrem)
1969 46 11 17 16 2 318
1970 49 19 12 15 3 299
1971 50 7 15 15 12 261
1972 47 10 17 12 7 199
1973 48 14 22 11 1 0 79
Reference
1) K. Koda, I. Sakamoto, and I. Usuba: IPCR Cyclotron Progr. Rep., 2, 134 (1973).

136
12. A NEW MACHINE
12-1. The Variable-Frequency Linac Project
Status at Autumn 1974
M.Odera
It was admitted by the Government to start the construction of a linac cavity in the 1974
fiscal year. A team for detailed engineering design was organized and investigations including
experimentation with cavity models and manufacturing of prototype drift tubes and modulated
light signal transmitting, receiving, and decoding circuits to be used in an injector system are in
progress. Discussions on fabrication techniques are being made with several firms.
Owing to inflation at a rocketing rate from the fall of the last year, we have met difficulties
to procure things with the expenses estimated in the budget proposed at the beginning of 1973.
Some alterations in specifications of several components were inevitable. Fortunately, for the
vacuum system, a development of new type pumps seems to warrant the spesifications without
much degrading its performance. To change the design of the radiofrequency resonator is more
difficult and its possibility is still being investigated .
.. :'\
Air core (3-ray spectrograph
Fig. 1. Site of the planned linac building near the cyclotron facilities.

Our building schedule is lengthened by one year because of delay of installation of air
conditioning equipment and pushing up of the cost.
A design study of cavity using models has almost completed. A continuous operation for
the range of frequency from 18 to 43 MHz seems to be assured and on a reduced duty factor a
much wider range is usable if an obround shape for the cavity cross section is chosen. The
cavity models will be discussed in the following reports. The site of construction under plan is
indicated in Fig. 1. It is on a slope slanting down westward from just outside of the shielding
wall of the cyclotron experimental area. Excavation of the ground will begin next summer.
137

138
12-2. Design Study Using Cavity Models
M. Odera, Y. Chiba, Y. Miyazawa, and M. Hemmi
We studied following subjects using cavity models at atmospheric pressure.
(1) Determination of details of cavity parameters: Since field patterns around the drift tubes
are difficult to estimate accurately by calculation owing to smallness of symmetry of the structure
of the cavity, the pattern and the highest frequency have to be determined by experiment.
(2) Estimation of power loss: For the same reason stated above, the power loss at higher
frequencies has to be estimated by the models.
(3) Field distribution along the acceleration axis: This is necessary for the determination
of drift tube length.
(4) Search of parasitic resonances. Though the fundamental resonant frequency is
determined by the length of center stem and the capacity of drift tube and so only a simple
spectrum for higher resonant frequencies is expected, particular construction of the cavity might
induce odd resonances unexpected. It is desirable to know whether or not those unwanted
resonances exist and interfere with the fundamental mode.
Table 1. Summary of results obtained by studying models.
Type of cavity II ill IV
Resonant frequency (MHz) 18 - 50 15 - 40 17.5 - 56
Frequency range for uniform voltage
distribu tion (MHz) 18 - 49 15 - 38 17.5 - 45
Frequency range within power limit (MHz) 18 - 45 15 - 40 17.5 - 43
Four models were tested and the results were used for the design of real cavities. Table 1
shows a brief summary of the test. Model I is omitted there since its role was mainly exploratory.
In Table 1, the range of frequency is given for 2,000 mm stroke for the shorting plane, the
criterion of uniformity for voltage is ± 10 % and the power loss limit means an electrical shunt
impedance larger than 200 kn. The last value gives a power dissipation within 230 kW for peak
voltage 300 kV across the tube gap.

139
12-3. Summary of Measurements on Electrical Characteristics of
Model Cavities I and II
M. Odera and Y. Chiba
Since a new configuration of a resonator is planned as an accelerating structure of the linac,
detailed investigation of the characteristics of the resonator has been made for these years.
Figures 1 and 2 show dimensions of two real scale models of cavities II) and II. They
differ in the method of frequency change and in the material of fabrication. The model II has a
single shorting plane movable along the center stem and is made of plywoods lined with thin
copper plates, whereas the model I has two moving panels and two large capacity compensators
and is fully made of aluminum.
Model I, which is the first model constructed, was used to survey the working principle of
the quarter wave resonator having a large width compared with the length and loaded heavily
with drift tubes at the voltage loop. 1) It was made to be able to change volume of various parts
separately and freely to find out any odd resonances and the effect of asymmetry of the structure.
No significant odd mode was found, but degradation of quality factors was clearly observed when
a right-left asymmetry was introduced about a plane including the acceleration axis and the center
stem. In studying the performance of this model by use of a perturbation technique we proved
the validity of the principle of the cavity; namely, the voltage distribution along the acceleration
axis is fairly uniform for a wide frequency range,2) which permits acceleration of ions with
different mass to charge ratios at different frequencies, and the frequency spectra of higher modes
®
-11001-500 1400
-I
o Lr)
o o ..-<
o 0>
1_· ____ !/-=-:25"--"--"0o'-------_~1 I 1~----------_1!~2~7=00~---------
Fig. 1. Modell: CD center stem; ® drift tubes at ground potential, the outer
diameter being 130 mm; ® drift tubes at radiofrequency high voltage,
the outer diameter being 60 mm; @ capacity compensators; ®
movable panels; and ® outer conductors.

140
, __________ ~11~2=8=00~------~
~® @~ t1 f---
@)
CD
I~ 1200
o U")
"<:!' o ........ o M ........
1 18001/_~1 _ -------------'-30'-'-0-"---0 , 1/ ____________ _
Fig. 2. Model II; CD center stem; ® drift tubes at ground potential, the outer
diameter being 160 mm; ® drift tubes at radiofrequency high voltage ,
the outer diameter being 130 mm; and @) movable shorting plane.
<Jl Q.I
20.000
18 .000
16 .000
°""'"'1 F eede r =
I - x- t = 23 mm
~ 14.000 ---e--- t = 13mm
12 . 000
10. 000
x
8. 000 \
20 30 40 50 60
I""."equency l\ IH z
Fig. 3. An example of the effect of coupling
strength of a detector or a feeder with a
cavity on measured quality factors. The
values are for the model II with drift
tubes removed.

141
are simple2) and discrimination of them presents no problem in operation.
Model II was constructed as a full-sized model in which a shorting plane was used as a device
for frequency change. It was mainly used to estimate power dissipation especially at higher
frequencies. The method of measurements is shown in Fig. 1 in an article 12-12 in this Progress
Report,3) and is the same as that used in the design work of the cyclotron,4) except a PIN diode
bridge was used instead of a vacuum tube as a switching element. Power feeding and signal
pick-up were made by capacitive probes attached to one side of the cav ity .
Figure 3 shows the effect of coupling strength on the measured Q values suggesting larger
true values for a cavity when loading by a generator or a detector was able to be eliminated.
Figure 4 shows the Q values and electrical shunt impedances obtained by this method. The
latter is defined here as (peak voltage across drift tube gaps)2/(2X power loss). This curve is of
service to estimate the radiofrequency power required for this type of cavity.
Mode l IJ 800
15.000
700
600
C 500 10.000 8' -'" -
J>
0: 400
Rs
300
5.000
200
100
0 20 30 40 50
i\ IH z
Fig. 4. Quality factors Q and electrical shunt impedance Rs
as a function of resonant frequency.
References
1) M. Odera: IPCR Cyclotron Progr. Rep ., 6, 16 (1972).
2) M. Odera, T. Tonuma, M. Hemmi, and Y. Chiba: ibid., Z, 143 (1973).
3) S. Takeda: ibid., §., 157 (1974).
4) M. Odera, Y. Chiba, T. Fujisawa, Y. Miyazawa, and O. Terajima: Sci. Papers I.P.C.R., 67,
99 (1973).

142
12-4. Voltage Distribution at the Gap of Model II
with the Drift Tubes Removed
Y. Chiba and M. Odera
Voltage distributions along the axis of acceleration of various models show several
characteristic features in common: distinct change of distribution according to harmonic numbers;
voltage drop at both extreme gaps which becomes more distinct at higher frequencies; and variation
of voltage more remarkable than the corresponding error of gap length.
In order to study the nature of these characteristics, the drift tubes were removed and
spacers made of copper plates were inserted to give a capacity equivalent to that of drift tubes.
Figure 1 shows one of the settings and Fig. 2 an example of corresponding field distributions.
The curves show high sensitivity for small undulation on the surface of copper plates and the
distinct change of voltage distribution according to the harmonic number is also clearly observed
here. These patterns can be easily explained and the corresponding frequencies be estimated
approximately by postulating resonances in the parallelepiped volume which is formed by
cutting half the cavity through the center symmetry plane induding the acceleration axis. There
are other resonances at very high frequencies which resemble an H-type mode of cylindrical cavities.
Next, a part of the gap was made narrow to see the effect of local deviation of capacity
distribution. Figure 3 shows its geometry and voltage distribution thereof. A gradual elevation
of field strength towards the part having high capacity was seen. This effect of nonuniform
distribution of capacity or other parameters upon field deviation also present in the Alvarez and
E E E E E
c.. E E "': "': E
<Il M :;; "., If")
~ lJ "'"' "'"' "'"' 81 j j I I II
WILt ! ~l L 01 F T
s ~ M
\\
Fig. 1. Model II with drift tubes replaced with spacers.
S, center stem; D, detector probe; F, power
feeder; B, metal bead ; M, motor to drive a
string for translation of bead through gap;
W, weight to give tension to the string; h,
distance of shorting plane from the
accelera tion axis.

143
f o = 54 .26 MHz h = 38 cm
C 100mm 20mm
'<~1L ~ 25mm
Posit ion of bead
wit h C f o = 37. 27 MHz
h = 58 em
without C fo = 43.06 MHz
h = 58 ern
Fig. 2. Field patterns expressed by frequency Fig. 3. Effect of local deviation of capacity along the
distribution. Numbers following a letter acceleration axis. Reversal of slope of
f denote order of harmonics. distribution shall be noted.
Inter-digital H-type resonators. The sloping of field strength may be expressed in another way
that the field strength is larger around the part where local resonant frequency is lower than in
other parts of the cavity. Such an effect explains the phenomenon mentioned in the first part,
namely, the field strength in the narrow gap is elevated more than the value given by the value
of gap length. It would be possible to describe this phenomenon quantitatively by considering
local deviation of high frequency current. However we were satisfied using the knowledge for
improvement of the characteristics of the cavity which proved to be very useful.
The lowering of field strength at the extreme gaps when the open end of the cavity is loaded
with drift tubes may be accounted for by adding the tank-end effect similar to that of H-type
resonator to the above effect of local parameters deviation which is inevitable for the extreme
gaps.

144
12-5. Results of Measurements on Model III of Linac Cavity
having a Stem of Circular-Shape
M.Odera
Model II , which has a stem of a rectangular shape, has excellent electrical characteristics 1)
such as a wide frequency range, ease of discrimination of higher modes, good Q factors, and
uniformity of voltage distribution along the acceleration axis. However, its mechanical construction
is not very advantageous for actual fabrication, especially when a single shell structure is adopted,2)
and the outer conductor has to support the atmospheric pressure as well as high frequency currents.
If a circular shape can be used, most of the mechanical difficulties of a single shell structure
would be eliminated. Model III was manufactured to investigate this possibility. It was made of
plywoods and lined with copper plates. It has a polygonal cross section instead of circular on
account of prompt fabrication. Figure 1 shows the structure of model ill.
o r ~ g ~ ...... <D
I L I \- d
-'---
T o ~
I o o t-
I
I
i
t15D-t-200-J....- --650----
1000---- ----1
Fig. 1. Model ill: 1, center stem; 2, drift tubes at ground potential; 3, drift
tubes at radiofrequency high voltage; 4, shorting plane; 5, liners which
bound a volume around each drift tube.

145
As expected, voltage distribution is not very favorable Hnd various improvements were tried
by shaping volume around drift tubes. Figure 2 gives an example showing the effect of shaping.
Although the method was very effective, the distribution comparable to those obtained for the
rectangular one at 50 MHz was unable to be realized above 40 MHz. On the other hand, the quality
factors were superior to model IT reflecting more uniform current density around the stem of
model Ill.
l.0
c -~
'" " <ll
-0
~ ~
0.5 50
References
3 4 5 6 7 8 9 10
Gap numbe r
Fig. 2. Variation of field pattern along the acceleration axis
by change of the shape of volume around the drift
tube.
Curve A: d = 170 w = 330
Curve B: d = 170 w = 490
Curve C: d = 0 w = 1220
Voltage distribution is given by square-root of the
ratio of frequency deviation.
I) M. Odera and Y. Chiba: IPCR Cyclotron Progr. Rep., 8,139 (1974).
2) LinacDesigngroup: ibid.,p. 148.
~
o
'" 0::

146
12-6. Results of Measurements on the Model IV of the Linac Cavity
Y. Miyazawa, M. Hemmi, and M. Odera
The model IV is a scaled model by 1/2.5 of a configuration chosen as a structure of the first
cavity. Figure 1 shows its construction. It is made of plywoods lined with copper plates as was
done in the model ill. The characteristic impedance of transmission line is 32 ohm. Figure 2
gives its resonant frequencies as a function of position of the shorting plane . Overall property of
this model is similar to that of the model n but by shaping the volume around the drift tubes as
was done in the model ill , a wider frequency change was found possible . As is seen in Fig. 2,
it can resonate from 17.5 to 55 MHz and the frequency range is more than enough for the present
project.
Quality factor of 11,900 for 42 MHz is also satisfactory and is a little better than that of
model n.I)
The voltage distributions along the axis of acceleration show somewhat less quality than in
model n and this cavity can be used up to 45 MHz with ± 10 % uniformity criterion. Further
improvement in this respect is planned.
600
( '\ 00) :~ ,
\oct ___ -_ _ --'-_ _ --"'-~ ~
Cross sect ion A-A' (mm)
® 320
@~ ~~~~~~~~~'-r-~
0 1 <..0+ o 91
A
1200
o q-
290
600
Fig. 1. Model IV; 1, outer conductor ; 2, center stem; 3,
shorting plane ; 4, drift tube supporting arm ; 5, drift
tubes at ground potential, quadrupoles will be
installed; 6, drift tubes at radiofrequency high
voltage and no quadrupoles.
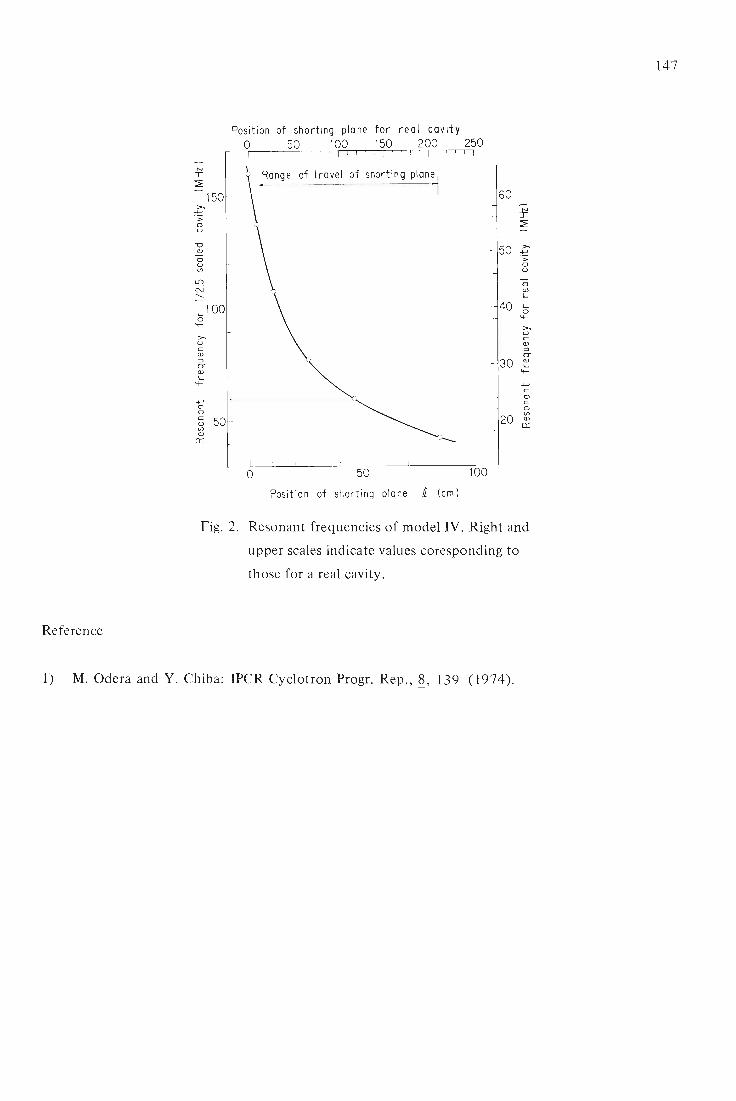
Reference
I ~
"0 (l)
o u V'l
I.D N .......
150
• ...100 o 'r-
~ o g 50 V'l (l)
0:::
Position of shorting plane for real cavity o 50 100 150 200 250 I I I I I I I I I I I I I I I I I I I I I I I I I I
I Range of travel of shorting plane I
o 50 100
Position of shorting pia ne i (cm)
60
I ~
50 >-+' ":; 0 u
0 Q)
L-
40 L-0 'r-
>-U C (l)
~ rr
30 (l) .... 'r-
.4-J C 0 C 0
20 V'l Q)
0:::
Fig. 2. Resonant frequencies of model IV. Right and
upper scales indicate values coresponding to
those for a real cavity.
1) M. Odera and Y. Chiba: IPCR Cyclotron Progr. Rep., ~, 139 (1974).
147
148
12-7. Design of the Linae Cavity
General
M. Odera, Y. Chiba, M. Hemmi, T. Inoue,
Y. Miyazawa, T. Tonuma, and F. Yoshida
The cavity is the most crucial element for success of the present project, and also is the most
expensive part. As described in other reports,OI- 4) several choices in designing the cavity are
possible. Weighing ease of operation, maintainance, future improvement , cost of fabrication etc.,
we have to decide a final design.
At present, because of a vacuum problem, we have abandoned a double-shell structure which
consists of a vacuum vessel and a radiofrequency resonator. If a single shell scheme is to be used,
mechanical strength necessary for supporting atmospheric pressure is unpractically large for a
rectangular shape as in the model II , so other structures must be adopted. A circular shape is
most favorable in this respect but its electrical characteristics measured with the model m3) are
not very attractive. However, it might be the best one when acceleration of ions was limited to
those having mass-to-charge ratios larger than 6. Then, the highest frequency needed would be
below 35 MHz, and at such a low frequency there is no problem of non-uniform field distribution .
Moreover, mechanical construction is simple and fabrication is not difficult.
On the other hand, the shape of the model IV consisting of two semi-circular and straight
parts has characteristics between those of oblong and circular cross sections. Electrically, it has
a range enough for resonant frequency and good quality factors . Mechanically, though it is
necessary in the designing against excessive deformation the precaution is not so much required as
in the oblong case. Therefore, we have decided to go on with this type until some necessity for
alteration is found . Figure I in Ref. 4 shows a sketch of the obround- shaped cavity.
Due attention to vacuum and radio-frequency requirements must be paid in the design. As
for the vacuum, clean and high vacuum is most desirable. Exclusion of organic contamination
and water from the surface of the vacuum vessel is necessary and efforts to keep the surface area
as small as possible is imperative. The single-shell structure satisfies the last requirement better
than the double-shell cavity.
Fine adjustment of frequency must be possible. One or two capacity compensators must be
provided per cavity in addition to a movable shorting plane which can be positioned in steps of
less than I mm. Such a small step of the plane permits setting of frequency within 100 kHz and
finer tuning may be made by the compensators.
Close tolerances in mechanical fabrication are not required in this type of cavity except for
those concerning the alignment of drift tube axes. Especially, misalignment of the quadrupole
focusing elements induces directly loss of beam or broadening of beam profile. Therefore, the
drift tubes which contain quadrupoles must be carefully manufactured so that the axis of tube
aperture should rigorously coincide with that of quadrupole; this is necessary to make it possible

to align the focussing quadrupoles by use of tube apertures.
Beam dynamIcs demands higher field gradients for shorter drift tubes where the velocity of
particle is small. That means that larger ampere - turns are required for coils packed in narrower
spaces. Methods for fabrication and cooling of the coils are being studied and tried at present. 5)
A final design will be decided within several months .
References
149
1) M. Odera, Y. Chiba, Y . Miyazawa, and M. Hernrni: IPCR Cyclotron Progr. Rep.,~,p. 138 (1974) .
2) M. Odera and Y. Chiba: ibid., p . 139
3) M. Odera: ibid., p. 144.
4) Y. Miyazawa, M. Hernrni, and M. Odera: ibid., p. 146.
5) T. Inoue: ibid. , p. 159 .
150
12-8. Design of the Linae Cavity
Mechanical Problems
Y. Miyazawa and M. Odera
The cavity must not deform and disturb the alignment of the drift tubes when the cavity is
evacuated. Parts of the vacuum tank which have the largest effect on the drift tube alignment are
the bottom and upper lids. The center stem is fixed on the bottom lid and a small warping of
the latter will induce a large displacement of the drift tubes attached on the top of the long stem.
It is not determined yet how to support the earth-side drift tubes, but if the upper lid is used for
the support, a reinforcement of the lid must be made sufficiently, because the earth-side drift
tubes contain focusing quadrupole magnets in them and an effect of misalignment of the axes of
the magnets on the beam quality is much larger than that of drift tubes on the center stem which
do not have quadrupoles installed.
The side wall of the vacuum tank of which the inner surface is an outer conductor of the
co-axial resonator shall be well reinforced. Equations for calculation of the deformation which
proved effective in the design of the cavity of the cyclotron having a similar shape to that of the
present linac were applied to estimate a necessary reinforcement. A deformation of the outer
shell is expected to be smaller than 0.5 mm and the displacement of the drift tubes should be
within 0.2 mm.
The movable shorting plane has a traveling distance of 2000 mm in high vacuum. The
position of the plane must be adjustable in steps of I mm or less from the control room. Shorting
contacts should provide a resistanceless path for large high-frequency currents. It is planned to
press contacts made of silver wire to the wall of the cavity with a force of around 4 kg/cm along
the wire. Bellows pressurized by air and a lever mechanism can be used for this purpose. Shorting
contacts of the cyclotron to which a pressure of 2 kg/cm is applied show no sign of excessive
heating by high-frequency currents up to 50 A/cm2 in the period of 7 years of operation. Of
course, different frequencies are used for the cyclotron so that the difference in the skin depth
must be taken into account. However, thin flexible copper tapes connecting those contacts with
parts where cooling pipes are soldered can be made shorter for the linac, since there is no need
to make the stem movable like the cyclotron where the position of the dee electrode has to be
readjusted at times. Shortening a heat conducting path is effective to suppress the temperature
rise of the contactor leads.

151
12-9. Design of the L inac Cavity
Cooling
Y. Miyazawa and M. Odera
The cavity walls must be well cooled, otherwise rising temperature might bring about some
trouble. In particular non-uniform local heating must be avoided carefully.
Figure 1 shows current densities at shorting contacts as a function of drift tube voltage.
The inset illustrates the parts of contact where the currents i l , i2 , and i3 flow. Figure 2 shows
the maximum ohmic loss density at each part of the cavity made of copper. The cooling problem
is most serious for the highest frequency, because it is at this frequency that the skin depth is
smallest and the current density is largest. Therefore, cooling channels must be provided as many
as possible to avoid heating at the highest frequency. The largest heat generation per unit area
is expected at the rounded part of the center stem as can be seen from Fig. 2. The flow rate of
cooling water or the number of cooling channels should be determined, corresponding to the
distribution of radio-frequency loss.
60
g 50 '---<C
.- 40
~ 30 (1)
~
~ 20 .... .... :::l
U 10
13
100
Accelerating voltage Vd ( kV )
f ( MHz ) 50
30
50 45 40 50 45 40
Fig. 1. Surface current density at shorting
contacts as a function of voltage across
drift tube gaps. i l , i2 , and i3 correspond
to the currents at the places indicated in
the inset above.
Frequency is a parameter.

152
4
0.3
3 1.0
'" E ~ u 0.2 -........ E E
~ u u -........ -........
2 ~ :s: u N M
0.5 u u
0.1
°OL~~~~=-~--~~L-~~~~O 100 200 300 400
o
Accelerating voltage Vd ( kV )
Fig. 2. Power dissipation per unit area of the cavity at shorting
contacts. Cj represents the loss at the place i of Fig. 1.

153
12-10. Design of the Linae Cay ity
Vacuum Consideration
Y. Miyazawa and M. Odera
The design of the vacuum system should be made according to the following requirements:
firstly, to minimize beam intensity attenuation or beam quality degradation due to collision of
heavy ions with residual gases in acceleration; secondly, to avoid as far as possible adsorption of
organic substances and water vapor onto the surface of the vacuum vessel, since such a
contamination is known to reduce the threshold value for sparking in vacuum by high-frequency
voltage.
The first requirement is necessary for acceleration of very heavy ions with a mass of about
200. Charge exchange cross sections are in the neighborhood of 10- 14 cm2 for such ions and loss
of the beam intensity by the process is by no means negligible even at a low pressure like 10-7
Torr.
The second is a general requirement every linac except for a case where the particle velocity
has reached nearely the velocity of light already. Usually, a velocity profile is pre-determined for
each geometry and a corresponding acceleration voltage must be exactly maintained. Although
these conditions are somewhat relaxed in our !inac by an adoption of a variable frequency scheme,
the largest voltage sustainable determines the maximum energy obtainable by the linac. The higher
voltage holding capacity is obviously desirable .
In order to attain a good vacuum the following precautions are necessary: exposuring of
surfaces of organic materials such as O-ring seals must be minimized; the inner surface area of the
vacuum vessel should be kept as small as possible; the material of the inner surface should be
chosen to keep the out-gassing rate very low; the method of fabrication ought not to induce
occlusion of organic substances such as oil and grease under the surface nor to leave voids with
small openings to vacuum ; only such a pump which has little possibility of introducing oil, water
or other undesirable substances should be used.
We intend to use cryo-pumps and turbo-molecular pumps in parallel to reach a pressure as
low as 10- 7 Torr with least condensation of undesirable substances on the surface of the vessel.
Roughing-pumps such as rotary or Roots blower pumps are to be operated only above 10- 1 or
I Torr to prevent backstreaming of oils. A cryo-pump having pumping speed of 5,000 £/sec for
N2 gas (for example, Philips K-20) will be installed next spring and be evaluated whether it is
suited for our purpose or not.
A major portion of the inner surface is covered with copper for conduction of radio-frequency
current. Fortunately , the out-gassing rate of copper is not bad and is in the range of 10- 10 Torr.
£/(sec.cm2) after several tens of hour of pumping. For other parts, stainless steel is mainly used
and, when use of iron is inevitable, electroplating with copper or nickel is planned to prevent

154
rusting of iron. As noted in another place,1) a single-shell structure adopted has much smaller
surface area than a double-shell structure and it makes attainment of high vacuum easier.
In introducing mechanical movements into the vacuum system, a predominant use of metal
bellows is planned and a linear motion through an O-ring seal should be avoided as far as possible.
Reference
1) Linac design group: IPCR Cyclotron Progr. Rep., 8, 148 (1974).
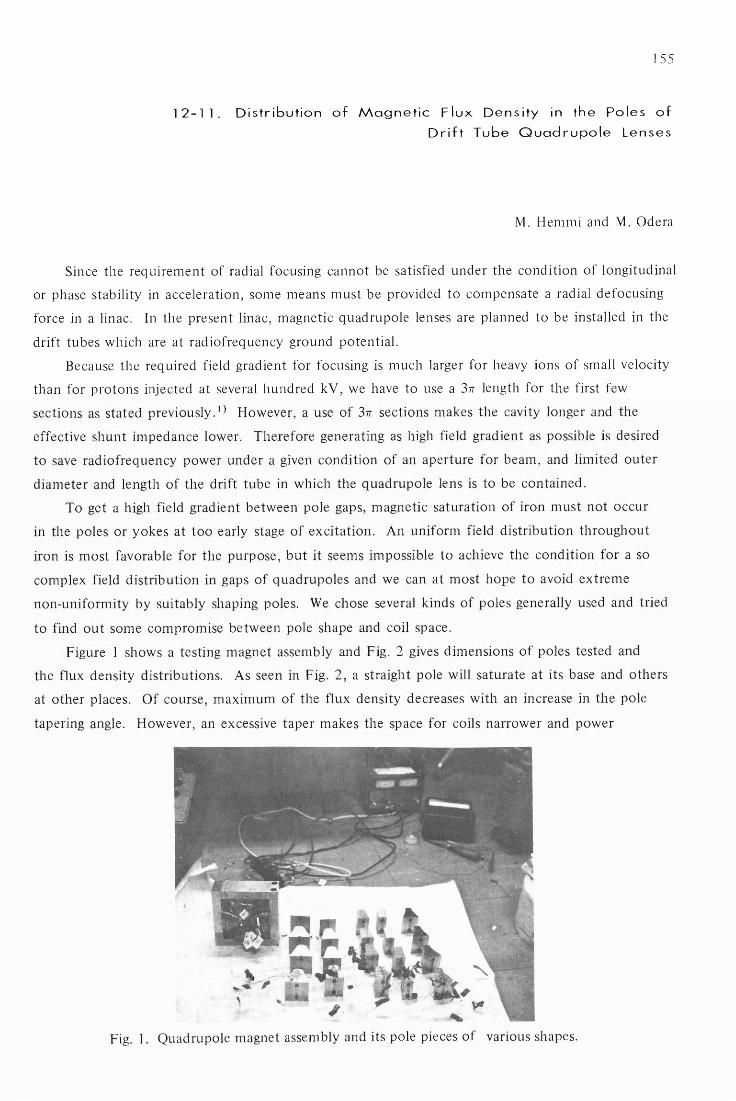
155
12-11. Distribution of Magnetic F lux Dens ity in the Poles of
Drift Tube Quadrupole Lenses
M. Hemmi and M. Odera
Since the requirement of radial focusing cannot be satisfied under the condition of longitudinal
or phase stability in acceleration, some means must be provided to compensate a radial defocusing
force in a linac. In the present linac, magnetic quadrupole lenses are planned to be installed in the
drift tubes which are at radiofrequency ground potential.
Because the required field gradient for focusing is much larger for heavy ions of small velocity
than for protons injected at several hundred kV, we have to use a 31T length for the first few
sections as stated previously. I) However, a use of 31T sections makes the cavity longer and the
effective shunt impedance lower. Therefore generating as high field gradient as possible is desired
to save radiofrequency power under a given condition of an aperture for beam, and limited outer
diameter and length of the drift tube in which the quadrupole lens is to be contained.
To get a high field gradient between pole gaps, magnetic saturation of iron must not occur
in the poles or yokes at too early stage of excitation. An uniform field distribution throughout
iron is most favorable for the purpose, but it seems impossible to achieve the condition for a so
complex field distribution in gaps of quadrupoles and we can at most hope to avoid extreme
non-uniformity by suitably shaping poles. We chose several kinds of poles generally used and tried
to find out some compromise between pole shape and coil space.
Figure I shows a testing magnet assembly and Fig. 2 gives dimensions of poles tested and
the flux density distributions. As seen in Fig. 2, a straight pole will saturate at its base and others
at other places. Of course, maximum of the flux density decreases with an increase in the pole
tapering angle. However, an excessive taper makes the space for coils narrower and power
Fig. 1. Quadrupole magnet assembly and its pole pieces of various shapes.

156
Relative flux density Relative flux density
1.0 1.2 1.4 1.6 1.8 2.0 1.0 1.2 1.4 1.6 1.8 2.0
~ Ll)
Ll)
Ll)
I I I I I I I I I I I 1----... 2 " 3 "
I I I I I I I I I I I
1--.............. /------4- 2 " /----+- 3 .
o No.1 M
o;t
Ll)
0 L()
L(')
4 • 5 '. 6 \
/----~4 \ /-----+- 5 1 No. 2 /-------4- 6 !
No.3
No.5
v L(')
L()
It)
7 ~ 8 !
Iii
20 Flux(8) = 1.80 Flux (1)
Relative flux density
1.0 1.2 1.4 1.6 1.8 2.0 I I I I I I I I I I I 1---....,.
/-------\--- 2 " 1-------+-3 • 1----------1:-- 4 ! /---------+-- 5 I
t-----__\_ ~ ./
/----------__+_ S .I
40 Flux (8) = 2 .07Flu:d I )
20 Relative flux density
0.8 1.0 1.2 1.4 1.6
,-----r------+---- I /------t-- 2 /-------\---- 3 /-----------+--- 4
5 f----------+- 6 -
- ----'>---- 7 f------------\--- 8
40 Flux(8)=1.83Flux(1 )
00 N
/---------1-7 / /--------+- 8 ./
30 Flux(S) =1.92 Flux(l)
Relative flux density
O.S 1.0 1.2 1.4 1.6
I .-....... 2 3 \
J 4 I 5 Ii 6
7 S ./
Flux(S)=2.19 Flu:dl)
16
I .~ 2 ') 3 4 /
- - 5 ./.
6 ./ 7 ./ - S
40 Flux(S)=1.87Flux(1 )
Fig. 2. Shapes of pole pieces and distribution of magnetic flux density. Below each
figure , total flux at search coil No.8 is given by a ratio to those at No.1.
No.4
No.6
consumption for given ampere-turns would increase. Quantity of flux also increases as is written
below each figure. However, a rapid growth of flux was seen only for the part above No.3 coil
and flux leakage between poles was not large at the lower part. Decrease of flux bridging at the
upper portion was tried by cutting the pole top as shown in Nos.5 and 6. Measurements showed
that the maximum density in No.5 was nearly the same with that of No.4, whereas the quantity
of flux at the base is smaller. The smaller flux allows use of thinner yokes, so that quadrupole
diameter hence drift tube diameter can be made smaller. The smaller the tube diameter, the better
is the cavity quality factor.
Reference
1) T. Tonuma, F. Yoshida, and M. Odera: IPCR Cyclotron Progr. Rep.,.§" 18 (1972).

157
12-12. A Circuit Using a PIN Diode Switch for Measurements of the
Q-values of a Cavity at High Resonant Frequencies
s. Takeda
A method which enables measurements of the large Q-values of a cavity was used for the
design and conditioning work of the radiofrequency system of the cyclotron. I) The same method
can be applied to the design of the linac cavity by taking care of much higher frequency used.
Figure I shows a block diagram of measurement and Fig. 2 shows a new circuit using a PIN
diode bridge as a switching element instead of a vacuum hard tube used previously. The latter
cannot work at 50 MHz or higher frequencies necessary for study of the linac models.2) The
circuit contains a self-running multi-vibrator which determines the time cycle of switching,
generating exponentially decaying curve, and triggering signal for other circuits. The length of
the gate and the time constant of decay are adjustable by helical ohms. Large change of these
can be made by replacement of resistors or capacitors.
The output impedance of the switching circuit is not very high and a due precaution is
necessary to get correct Q-values of a cavity. An example of measurements was given in Ref.3.
Signal gen. Diode 10-400MHz f---------l switch
I F req uency counter
Gate signa I
Cho nne! 2
Feeder
Pick up Cavity r--
Exp. decay curve Channe I 1
r---'----'I'-----, ,..-----L...-I ~ Gate and decay curve generator
I o Trigger CRT
Fig. 1. A block diagram of measurement of quality factors.
The diode switch can be attached directly to the
power feeder.
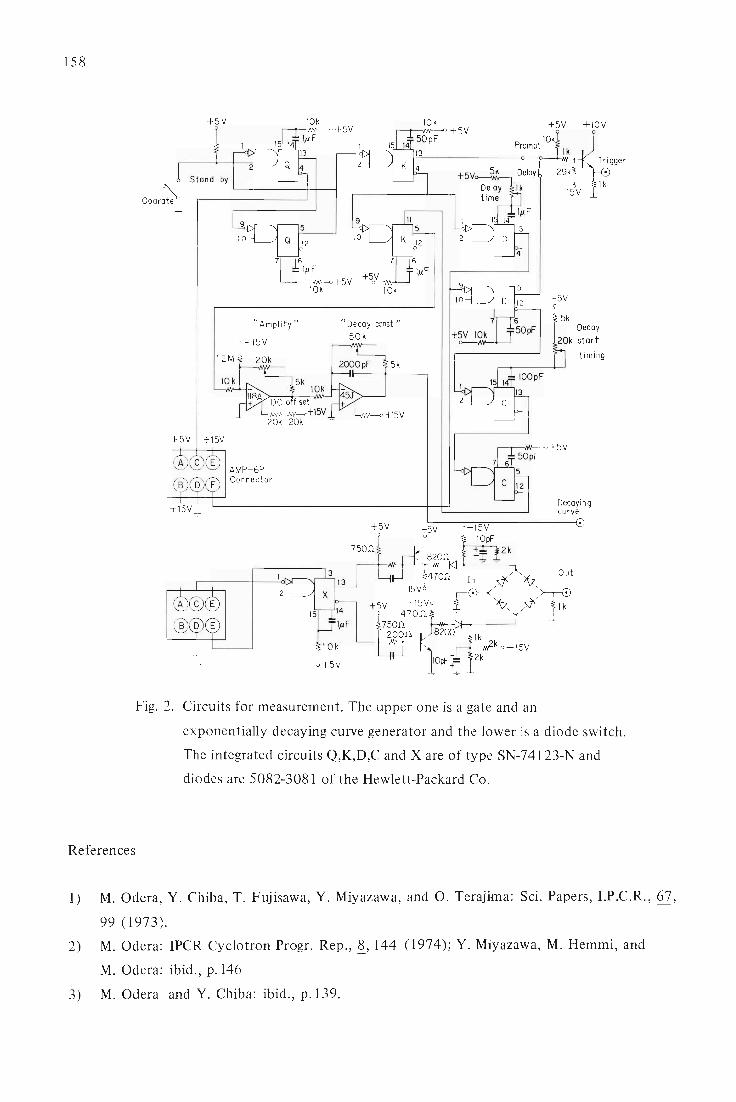
158
References
+5V
+5V +15V
"Amplify"
-15V
AMP-6P Connector
10k
10k 10k
"Decoy canst"
50k
+5V +5V
+5V +1OV
Prompt 10k
timing
Decoying curve
Fig. 2. Circuits for measurement. The upper one is a gate and an
exponentially decaying curve generator and the lower is a diode switch.
The integrated circuits Q,K,D,C and X are of type SN-74123-N and
diodes are 5082-3081 of the Hewlett-Packard Co.
1) M. Odera, Y. Chiba, T. Fujisawa, Y. Miyazawa, and O. Terajima: Sci. Papers, I.P.C.R., 67,
99 (1973).
2) M. Odera: IPCR Cyclotron Progr. Rep., §., 144 (1974); Y. Miyazawa, M. Hemmi, and
M. Odera: ibid., p. 146
3) M. Odera and Y. Chiba: ibid., p.139.

159
12-13. Trial Fabrication of Coils for
Drift Tube Quadrupoles
T. Inoue and M. Odera
Strong field gradients are required for drift tube quadrupoles to focus low velocity heavy ions
with a large mass-to-charge ratio. However, only a small volume is available for coils because of
c
1 Dimensions
No. A B C D 1 72 62 52 42 3
2 72 60 52 40 3 0
2 -~~ - 'ff ~~~
L M2 A
£D 3 72 58 52 38 3
j 4 72 56 52 36 3
5 72 54 52 34 3
6 72 52 52 32 3
7 72 50 52 30 3
8 72 48 52 28 3
-.l ------------------------,1 ~ t
Fig. 1. Dimensions of copper frames which form together a 7-turn coil of a pole
of the shortest drift tube quadrupole magnet.
I Magnificat ion of point of connection
Plan view
t=3Cu
/ f(.,'
/ -v 11a::=
I " --, r :- II
I
I
I
~/f i
Insulator t= 0.5
Side view 1 Side view 2
Fig. 2. A rectangular coil made from the frames. Details of construction can be seen
in the upper right magnified figure in a circle.

160
Fig. 3. A container made of acrylite to investigate
coolant flow.
the short length of the low-energy drift tubes in which they are to be installed. In order to
produce the ampere-turns required to get the strong field gradient without an excessive heat
generation in the small space, coils having a good packing factor must be used. The structure of
the coils should be designed so as to make removal of the heat generated feasible. The tape coil
method devised at Super HILAC laboratory 1) is an excellent example to do so .
We have manufactured coils by stacking thick rectangular copper frames cut as shown in
Fig. 1. By suitably changing the position of cutting and hard-soldering them together, a seven-turn
coil was formed as shown in Fig. 2. It is to be sealed in a drift tube and cooled with Freon-II3
or deionized water flowing around it. Since a current as large as 500 A is estimated to be
necessary to obtain a maximum field gradient of 7 kG/cm for the 24 mm-pole gap, efficient
cooling of the coils is necessary. A current density in the conductor amounts to 17 A/mm 2•
Figure 3 is a photograph of a container simulating a drift tube shell to investigate visually the
coolant flow in a drift tube .
Reference
1) R. M. Main , K. Halbach, P. Kennedy , R. Yourd , A. Watanabe, and D. Kolody: UCRL-I8240
(1968).
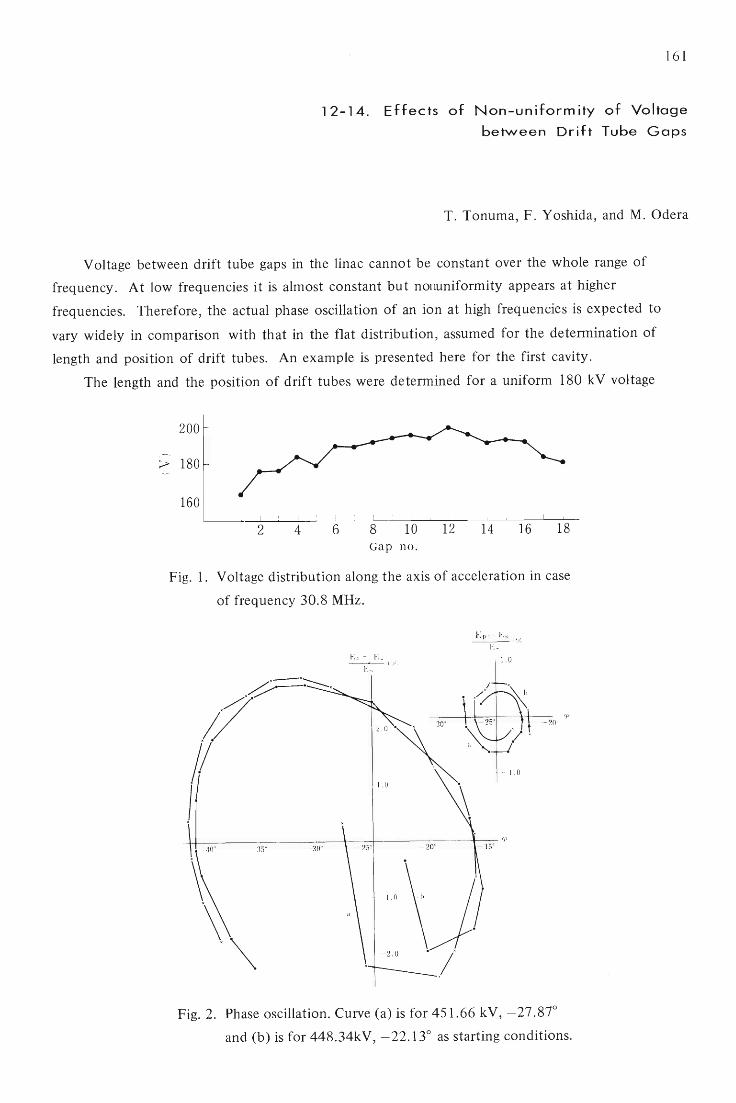
161
1 2 - 1 4. E f fee ts 0 f Non - u n i fo r m i ty 0 f Yo I ta 9 e
between Drift Tube Gaps
T. Tonuma, F. Yoshida, and M. Odera
Voltage between drift tube gaps in the linac cannot be constant over the whole range of
frequency. At low frequencies it is almost constant but nonuniformity appears at higher
frequencies. Therefore, the actual phase oscillation of an ion at high frequencies is expected to
vary widely in comparison with that in the flat distribution , assumed for the determination of
length and position of drift tubes. An example is presented here for the first cavity.
The length and the position of drift tubes were determined for a uniform 180 kV voltage
200
> 180
160 I I I I I I I
2 4 6 8 10 12 14 16 18 Gap no.
Fig. 1. Voltage distribution along the axis of acceleration in case
of frequency 30.8 MHz.
~-:::--x ~x ./'
;/ 1/ jf
1.0
1.0
1 0
~--------------~--+---r-----------~-- ~ - 3W - 20 0
Fig. 2. Phase oscillation. Curve (a) is for 451.66 kV, -27.87°
and (b) is for 448.34kV, - 22.13° as starting conditions.
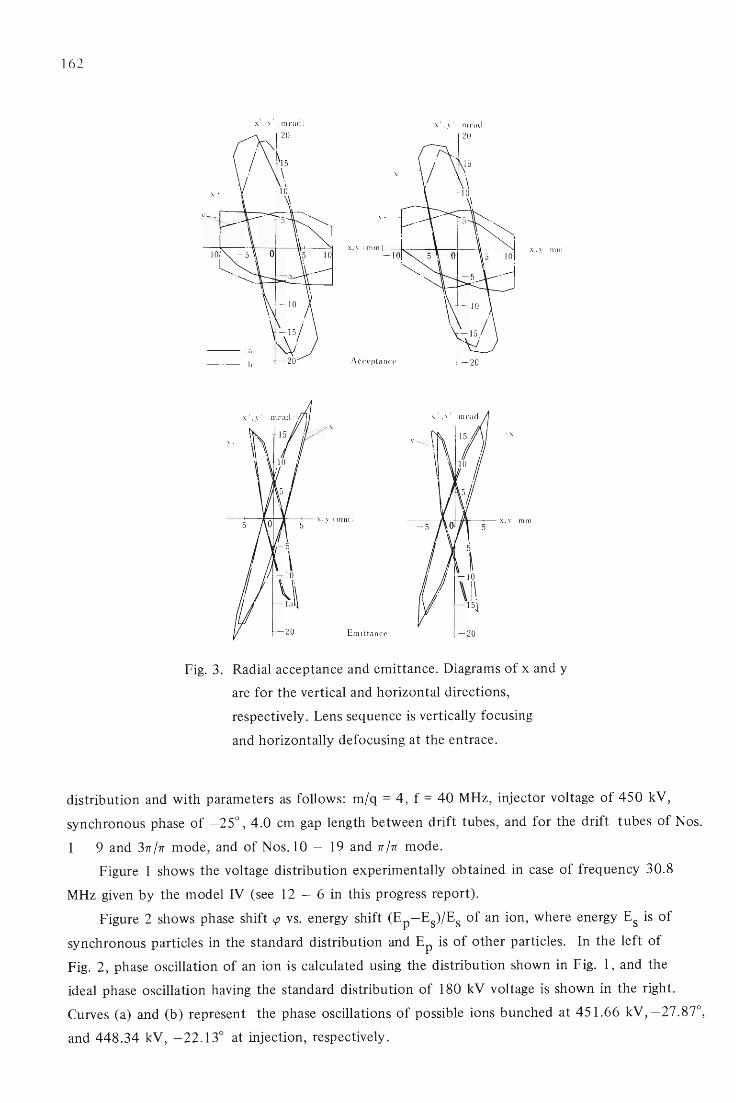
162
x ' __ 1-' ( m '-acl )
20
-- ( a )
--- ( b ) Acce pta nce - 20
- x
---A-I--lA-----+- x. y ( m m )
- 5
. . ~ H I - 10
7 · \ 1\ - 1 5~
- 20
Fig. 3. Radial acceptance and emittance. Diagrams of x and y
are for the vertical and horizontal directions,
respectively. Lens sequence is vertically focusing
and horizontally defocusing at the entrace.
distribution and with parameters as follows: m/q = 4 , f = 40 MHz, injector voltage of 450 kV,
synchronous phase of - 25° , 4.0 cm gap length between drift tubes , and for the drift tubes of Nos.
1 - 9 and 31T/rr mode, and of Nos. 10 - 19 and rr/rr mode.
Figure 1 shows the voltage distribution experimentally obtained in case of frequency 30.8
MHz given by the model IV (see 12 - 6 in this progress report).
Figure 2 shows phase shift r.p vs. energy shift (Ep-Es)/Es of an ion, where energy Es is of
synchronous particles in the standard distribution and Ep is of other particles. In the left of
Fig. 2, phase oscillation of an ion is calculated using the distribution shown in Fig. 1, and the
ideal phase oscillation having the standard distribution of 180 kV voltage is shown in the right.
Curves (a) and (b) represent the phase oscillations of possible ions bunched at 451.66 kV,-27.87°,
and 448.34 kV, -22.13° at injection, respectively.

163
Figure 3 shows radial acceptance and emittance diagrams of an ion passing through a 20 mm</>
aperture of drift tubes under the focusing condition cos jJ. being equal to 0.7 and with phase
oscillations given in Fig. 2. Diagrams on the left and right correspond to the phase oscillations
shown on the left and right of Fig. 2, respectively.
It has been found that non-uniform voltage distribution in this degree gives large phase
oscillations; nevertheless, results in little effects on the radial acceptance and emittance compared
with that given by the standard distribution.
164
12-15. Computer Codes for Orbit Dynam ics In the Heavy Ion Linac
F. Yoshida, T. Tonuma, and M. Odera
For the investigation on ion orbit dynamics of linac, programs consisting of three codes have
been developed and prepared using the Honeywell DDP-124 computer in this laboratory.
The first code calculates the following parameters: the length of each drift tube in an
accelerating tank; the magnetic field gradients of a quadrupole magnet contained in the drift tube
which satisfy focusing conditions of ion trajectories; the necessary voltage of an injector; and the
accelerating field between drift tubes needed for a given synchronous phase. These parameters
are calculated under a given objective for the energy to be gained. Transit time factors are
determined by an electric field distribution in a gap between two drift tubes measured using a
perturbation technique. In addition, this code can print or plot phase oscillation vs. energy shift
by giving numerically a voltage distribution which is non-uniform along the axis of acceleration
and is different from a standard distribution used for determination of the length of drift tubes.
The second code describes an ion trajectory in a tank , which is calculated taking into account
radial defocusing of an ion beam by the accelerating rf field, and motion in the focusing magnetic
field gradients of quadrupole magnets and field-free regions. This code, also, gives radial acceptance
and emittance of ion beam at one time by the inputs of apertures of drift tubes and the possible
deviations of quadrupole magnets from the axis of acceleration caused by alignment errors.
As the emitted beam of the first tank has to be accepted by the next tank, matching of the
emittance of the former with the acceptance of the latter is necessary. Therefore, the third code
calculates an ion trajectory between two tanks by giving the distance of two tanks and the
position and the field gradient of doublet or triplet quadrupole magnets.

13. LIST OF PUBLICATIONS
1) 1. Kohno: "Elastic and Inelastic Scatterings of 14N and l2C Projectiles by 12C, 27AI, 28Si,
and SBNi", Sci. Papers 1.P.C.R., ~ 38 (1974).
2) T. Wada and S. Yamaji: "Automatic Search Code for Coupled-Channel Calculation", Sci.
Papers 1.P.C.R., 68, 65 (1974).
165
3) F. Yatagai, T. Takahashi, Y. Kitajima, and A. Matsuyama: "Inactivation of Bacterial Spores
by Charged Particles" , J. Rad. Res., ~ 90 (1974).
4) K. Igarashi, F. Yatagai, T. Takahashi, and A. Matsuyama: "LET Dependence of DNA
Single-Strand Scission in~ coli BS- 1 by Charged Particles", J. Rad. Res. , 15, 148 (1974).
5) A. Iwamoto, S. Suekane, S. Yamaji, and K. Harada: "Asymmetric Fission of 236U", Progr.
TheoL Phys.,~ 1617 (1974).
6) M. Matsui and M. Imamura: "Radiation Chemical Studies with Cyclotron Beams. III. The
Heavy-Ion Radiolysis of Liquid Aliphatic Ketones", Bull. Chern. Soc. Japan, 47, 1113
(1974 ).
7) T. Nozaki , Y. Yatsurugi, N. Akiyama, Y. Endo, and Y. Makide: "Behaviour of Light
Impurity Elements in the Production of Semiconductor Silicon", J. Radioanal. Chern., 19,
109 (1974).
8) K. Matsumoto, T. Kataoka, H. Kamei, M. Terasawa, T. Karasawa, J. Sakairi, and E. Yagi:
"Embritt1ement of Austenitic Stainless Steels Irradiated with a-Particles", Trans. Iron and
Steel Inst. Japan,Jiz. 118 (1974).
9) A. Hashizume, H. Kumagai, Y. Tendow, and T. Katou: "A Mechanical Beam Chopper
System for the Measurement of Half-Lives in the Millisecond Region" Nucl. Instr. Meth., 119,
209 (1974).
10) T. Inamura, F. Kearns, and J.C. Lisle: "Doppler Broadened r-Ray Lineshape Analysis in
Multiple Coulomb Excitation", Nucl. Instr. and Meth., 123, 529 (1973).
11) T. Suzuki: "New Giant Resonances", Nuc!. Phys., A217, 182 (1973).
12) O. Hashimoto, A. Sumi, T. Nomura, S. Nagamiya, K. Nakai, T. Yamazaki, and K. Miyano:
"Measurement of the g-Factor of the 0.57 ms 7+ State in 202Tl", Nucl. Phys., A218, 180
(1974).
13) T. Takemasa: " Finite-Range Calculation of Two-Neutron Transfer Reactions on Rate-Earth Nuclei",
Nucl. Phys., A220, 31 (1974).
14) T. Suzuki : "Sum Rule Approach for Nuclear Vibrations and Effects of Core Polarization",
Nucl. Phys., A220, 569 (1974).
15) T. Suzuki: "Momentum Transfer Dependence of the Effective Charge for Electroexcitation",
Phys. Rev., C8, 2111 (1973).
16) T. Suzuki and C. Hinohara: "Sum Rules and Nonexchange Force", Phys. Rev., C9, 1186
(1974).
17) T. Nomura, K. Hiruta, M. Yoshie, and O. Hashimoto: "Alpha-Decay of 21s Fr", Phys. Rev.,

166
C9, 1168 (1974).
18) F. Kearns, G.D. Dracoulis, T. Inamura, J.C. Lisle, and J.C. Willmott: "Lifetimes of High
Spin Rotational States", J. Phys. A: Math., Nucl. Gen., 7, Lll (1974).
19) S. Yamaji, T. Fujisawa, H. Kamitsubo, K. Matsuda, S. Motonaga, F. Yoshida, H. Sakaguchi,
and K. Masui: "The Multi-Step Process in the 12CCHe, a)IIC Reaction". J, Phys. Soc.
Japan, 37, 1191 (1974).
20) N. Shiotani, T. Okada, T. Mizoguchi, and H. Sekizawa: "Angular Distribution of Positron
Annihilation Radiation in Vanadium and Niobium - Experiment", J. Phys. Soc. Japan, 38,
423 (1975).
21) I. Kohno: "Elastic and Inelastic Scattering of 14N and 12C Projectiles by 12C and 28Si", J.
Phys. Soc. Japan, (in press).
22) M. Suehiro, M. Aratani, and N. Saito: "Ionization Caused by Beta Emitters", Mass
Spectroscopy, 22,183 (1974).
23) T. Takemasa: "Full Finite-Range Calculation for Heavy Ion Two Nucleon Transfer
Reactions", Phys. Lett. (in press).
24) N. Nakanishi and H. Sakaguchi: "CHe, d) Reactions on Cr and Ni Isotopes", Rep. of the
Symp. on Nuclear Reaction, RCNP-P-l, p. 45 (1974).
25) T. Nozaki, M. Iwamoto, and T. Ido: "Yield of 18F for Various Reactions from Oxygen and
Neon", Int. 1. Appl. Radiat. Isotopes, (in press).
26) T. Nozaki, M. Furukawa, S. Kume, and R. Seki: "Production of 28Mg by Triton and
a-Particle Induced Reactions", Int. J. Appl. Radiat. Isotopes, (in press).
27) F. Ambe and S. Ambe: "Chemical Effects of Neutron-Induced Nuclear Reactions in Halates
and Related Compounds IV. The (n, r) and (n, 2n) Reactions in ChI orates" , Radiochim.
Acta, 19, 42 (1973).
28) S. Ambe, F. Ambe, and N. Saito: "The Oxidation States of 119Sb after the EC Decay of
119m Te in Te02 and H6 Te06", Radiochim. Acta, p. 121.
29) F. Ambe, S. Ambe, H. Shoji, and N. Saito: "Mossbauer Emission Spectra of 119 Sn after the
EC Decay of 119Sb in Metals, Oxides and Chalcogenides of Antimony and Tellurium", J.
Chern. Phys., 60, 3773 (1974).
30) S. Ambe and F. Ambe: "A Mossbauer Study of the Oxidation State of 119Sn after the
Successive EC Decays of 119m Te in Telluric Acid", Radiochim-. Acta (in press).
31) F. Ambe and S. Ambe: "A Mossbauer Study of the Valence States of 119Sn after the EC
Decay of 119Sb in Antimony and Tellurium Iodides", Bull. Chem-. Soc. Japan, 47, 2875
(1974).
32) S. Ambe and F. Ambe: "Mossbauer Emission Spectrum of 119 Sn in 119Sb (OH) (C20 4)",
Inorg. Nuc!. Chern. Lett., jl, 139 (1975).

167
(Papers presented at international meetings)
1) T. Mikumo, I. Kohno, K. Katori, T. Motobayashi, S. Nakajima, M. Yoshie, and H.
Kamitsubo: "Optimum Q-values in Multi-nucleon Transfer Reactions sufficiently high above
the Coulomb Barrier", Intern. Conf. Reactions between Complex Nuclei,
Held at Vanderbilt University, Nashville, Tennessee, June 10-14 (1974).
2) M. Yoshie, K. Katori, I. Kohno, T. Mikumo, T. Motobayashi, S. Nakajima, and H.
Kamitsubo: "Single-nucleon Transfer on 92Mo Induced by 14 Nand 12C ions", Intern.
Conf. Reactions between Complex Nuclei, Held at Vanderbilt University, Nashville,
Tennessee, June 10-14 (1974).
3) M. Matsui and M. Imamura: "Heavy-Ion Radiolysis of Liquid Aliphatic Ketones", 5th
Intern. Congr. Rad. Res., Seattle, Washington, U.S.A., July (1974).
4) A. Matsuyama, T. Takahashi, K. Igarashi, and P. Yatagai: "Studies on bacterial inactivation
and DNA-strand break formation by the cyclotron beam", 5th Intern. Congr. Rad. Res.,
Seattle, Washington, U.S.A., July (1974).
5) T. N ozaki: "Cyclotron Production of Medical-use Radioisotopes in Japan", The 1 st World
Congr. Nuclear Medicine, Tokyo, Oct. (1974).
6) T. Ido: "Synthesis and In Vivo Distribution Patterns of 18P-Organic Compounds", The 1st
World Congr. Nuclear Medicine, Tokyo, Oct. (1974).
7) T. Higasi, M. Kanno, K. Tomura, and T. Nozaki: "Accumulation of Europium in Tumor",
The 1st World Congr. Nuclear Medicine, Tokyo, Oct. (1974).
L

168
14. LIST OF PERSONNEL
Members of the Board
HAGIHARA Hitosi f iii }}fi 1= (Chairman)
1= if 7.i ill KAMITSUBO Hiromichi NOZAKI Tadashi ~ Uffij if
Users Committee
HAMADA Tatsuji ~ EB ~ = (Chairman) KAMITSUBO Hiromichi L :l5f 7R :@
MA TSUY AMA Akira fl W ~
ODERA Masatoshi IJ\ ~ iE ~
SEKIZA W A Hisashi ~ iR. I6J
Operation and Machine Maintenance Group
FUJITA Shin KAGEY AMA Tadashi KOHNO Isao (oJ ff
OGIWARA Kiyoshi
New Machine Group
~ ill iE J})
~ /ffi m
CHIBA Yoshiaki INOUE Toshihiko
T ~ iff Sf]
#L~~
Ij] KOHNO Isao ~IiJ n ODERA Masatoshi TONUMA Tadao
+ 9= IE 1~
pi IE iE 14f
Scientific and Engineering Personnel
Cyclotron Laboratory
CHIBA Y oshiaki -T ~ H lUi
FU JIT A J iro iii B3 = ftl5
INAMURA Takashi fia tt $
KAMITSUBO Hiromichi KOHNO Isao ~IiJ IJ!f
MOTONAGA Shoshichi NAKANISHI N oriyoshi
Ij)
JL: IK ftl~ l qJ f§ ~ :§-
ODERA Masatoshi + -'r Il ~ r~
SUZUKI Toshio i'ri * iIlx. lj}
WADA Takeshi jf1J B3 m YOSHIDA F usako i3 B3 m T
HAMADA Tatsuji NAKANE Ryohei ODERA Masatoshi
lfl~ rn it = ~H~Nif
1]\ 1f iE {5Z
IMAMURA Masashi ~ ;ft
KOHNO Isao ~1iJ Jf Ij]
NOZAKI Tadashi ff ~ IE SAKAIRI Hideo :t,& A !Ii:. :a
IKEGAMI Kumio KOHARA Shigeo NAKAJIMA Hisao T AKEBE Hideki
tfu L 1L-=-~ IJ\ }* £ ~
¢ ~~ r'61 14f IEt$~fM
HEMMI Masatake ~ ~ i& JR:
E3 E3
KAMITSUBO Hiromichi L if * i~ MIY AZA WAY oshi toshi -fd; "if( it ffJJ.
SHIMAMURA Akira g tot ~
YOSHIDA Fusako -aEBm -{-
FU JISA W A Takashi Wi iR r~j ,o HEMMI Masatake ~ §! ~ ilt INOUE Toshihiko if J: 1IiX f5 KARASAWA Takashi rttt {J\ -"'t MIY AZA WAY oshitoshi '§ iR. tE ~ NAKAJIMA Shunji ¢ !i0 §!ji: = NOMURA Toru my;ft ~
SHIMAMURA Akira ~ ;ft * TONUMA Tadao
Y AMAJ I Sh uhei
J-i {{~ iE it IJ I~i~ -f

(Visitors)
ICHIMURA Munetake $ H * lit (Univ. of Tokyo) FUJINO Takeo Hi !f ~ 72. (lnst. Nuc1. Study , Univ. of Tokyo) HANAZONO Sakae 1£ ~ %: (lnst. Nucl. Study, Univ. of Tokyo) HIRUTA Kotaro ~ EB ¥ :fd!~ ('Tokyo Inst. Tech.) IMANISHI Bunryu A, ~ X ~ (Nihon Univ.) KAMMURI Tetsuo ~ fg- :k (Univ. of Osaka) KA TORI Kenji ft ~ ~ = (Tokyo Univ. of Educ.) KAWAI Mitsuji ~ilJ -g- 1t n (Tokyo Inst. Tech.) KOIKE Masahiro IJ\ @ 1£ '1l. (lnst. Nucl. Study, Univ. of Tokyo) KOYAMA Katsuji /J ~ LU g~ = (lnst. Nucl. Study, Univ. of Tokyo) KUTCHERA Walter (Technische Universitat Munchen) MIKUMO Takashi = ~ ~ (Tokyo Univ. of Educ.) NAKAI Koji ~ it- i* = (Dept. Phys. , Univ. of Tokyo) NAKAMURA Masanobu $ tt iE it (Dept. Phys. , Kyoto Univ.) OHNUMA Hajirne *- lB ffi (lnst. Nucl. Study, Univ. of Tokyo) SAKAGUCHI Harutaka ~ 0 13 ~ (Dept. Phys. , Kyoto Univ.) SEKIGUCHI Masayuki M 0 n IT (lnst. Nucl. Study , Univ. of Tokyo) SPROUSE, Gene (State Univ. of New York at Stony Brook) TAKEDA Shigeru rr EB ~ (Nat. Lab. High Energy Phys.) TAKEMASA Tadashi lit i&: ;t:t ± (Univ. of Osaka) WAKAI Masarnichi ;g- * iE ~ (Univ. of Osaka) YAMADA Satoru w EB !{~ (Tokyo Inst. Tech.) YOKOMIZO Hideaki fl iA ~ Sf! (lnst . Nucl. Study Univ. Tokyo) YOSHIDA Hiroshi 5' 83 ~L (Univ. of Osaka)
(Students)
FUKUDA Tornokazu m EB :# f D (Univ. of Tokyo) IKEZOE Hiroshi ~lli?~ tt (Univ. of Tokyo) KANAI Tatsuaki ~ 1f Ji Sf! (Tokyo Univ. of Educ.) MOTOBA YASHI Tohru "* t* ~ (Univ. of Tokyo) 001 Takao *- * q: Mf (Tokyo Univ. of Educ.) YAMAZAKI Yoshishige w Ilffi'f .N. JJJZ (Univ. of Tokyo) YOSHIE Morio 2f 1I ~:'15 (Tokyo Univ. of Educ.)
Radiation Laboratory
AWAYA Yohko ~ ~ ?g -rHASHIZUME Akira m Jl\
KA TOU Takeo 1m Hi ~ 14f KUMAGAI Hidekazu !f~ .fr '* fa
TAKAHASHI Tan ~ m Q
(Visitors)
DOKE Tadayoshi @: ~ ,'i!;, ~ (Waseda Univ.)
HAMADA Tatsuji IZUMO Koichi KONNO Satoshi OKANO Masaharu TENDOW Y oshihiko
no Masahiro ~ ~ iE * (Tokyo Metropol. Jeriatric Hosp.) NAGAHARA Teruaki 7k ~ Jffi It!j (Rikkyo Univ.) SUZUKI Kazuaki ~ * - f!!j (Japan Anal. Chern. Res. Inst.) HA Y ASHIBE Shogo :.f'* {tIl Bt3 g (Tohoku Univ.) FUJIOKA Manabu H~ I1GJ =-i (Tohoku Univ.)
169

170
Nuclear Analytical Chemistry Laboratory
AMBE Fumitoshi ARA T ANI Michi NOZAKI Tadashi
(Visitors)
~ $X~
m~~~
ff~ if
AMBE Shizuko .~ $ f¥ T IWAMOTO Masako ~ /$: iE ~
SAITO Nobufusa JJii Hi {§' .m
AKIYAMA Nobuyuki ~x w f§" z (Komatsu Electronic Metals Co., Ltd.) FUKUSHI Kiyoshi tlii ± ~ (Nat. Inst. of Radiological Sciences) HARA Toshihiko !Jji BifJ. fJ; (Nat. Nakano Chest Hosp.) TAKI Koh i~ ~ (Kitazato Univ. Dept. of Hygiene) IDO Tatsuo :# .F Jl 1$ (Nat. Inst. of Radiological Sciences) KASIDA Yoshihiko ~ ffi ~ fJ; (Nat. Inst. of Radiological Sciences) YATSURUGI Yoshifumi J\ ~Ij Ef X (Komatsu Electronic Metals Co. , Ltd.)
Synthetic Organic Chemistry Laboratory
OHTSUKA Yasuo
Radiobiology Laboratory
IGARASHI Kazui Ii + ii - EX
(Student)
TAHARA Akira
MA TSUY AMA Akira tl!1J ~
Y A T AGAI Fumio ~ B3 ~x;t;;: (Graduate Course of Sci. Engg., Waseda Univ.)
Radiation Chemistry Laboratory
IMAMURA Masashi A, tt MA TSUI Masao tl it iE ~
(Visitors)
El EI
YASUKAWA Tamio TAKAHASHI Tohru
1; JII 1X ~ (Tohoku Univ.)
~ rg *- (Tohoku Univ.)
Metal Physics Laboratory
HASIGUTI R. Ryukiti m 0 ~ Ef SAKAIRI Hideo Jjj A 3i:. tit YAGI Eiichi ;\ * ~ -
(Visitors)
ISHINO Shiori :&!f ~ (Univ. of Tokyo)
KIMURA Kazuie
KOY AMA Akio IJ\ Lli BB tit SHIOTANI Nobuhiro :I][ ~ ][ SA
MISHIMA Yoshitsugu = .~.& *l (Univ. of Tokyo) SHIRAISHI Haruki B:& # fM (Nat. Res. Inst. for Metals)
Magnetic Materials Laboratory
OKADA Takuya RGl EE .$. iQ SEKIZA W A Hisashi ~ 'R r6'J
(Vistor)
MIZOGUCHI Tadashi tit 0 iE (Gakushuin Univ.)
Work Shop
T AKESHIT A Isao 11r T ~ :;k
Radiation Monitoring and Safety Office
KODA Kugao
USUBA Isao SAKAMOTO Ichiro

171
15. LIST OF OUTSIDE USERS AND THEIR THEMES
Description is in the order of themes, energies of particles used, and names of persons and
institutions responsible for the themes are added. Numbers in parentheses are total beam times
and frequency of irradiation between Jan. and Dec. 1974. The outside users' publications are
listed at the end of this chapter.
1) "Production of 18F for Bone Scanning"
3He - 18,25 MeV
H. Kakehi, Chiba Univ. Hospital
A. Tsuya, National Cancer Res. Inst.
2) "Production of 43 K for Heart Scanning"
a - 27 MeV
M. Nakamura
Med. Dept., Kyushu Univ.
3) "Study of the Production of 61CO, 61CU, 13SLa, and 123 1"
3He - 40 MeV, a - 40 MeV
Y. Homma
Chern. Dept., Tokyo Metropolitan Univ.
4) "Production of 123 1 for Diagnostic Use"
3He - 38, 39 MeV
N. Nakazawa
First Radioisotopes Co.
5) "Studies on S3 Mn"
d - 15 MeV, 3He - 20 MeV
S. Shibata
Chern. Dept., Kyushu Univ.
6) "Measurement of the Cross Section of the IS1,lS2Eu (p, n) R~action"
p - 15 MeV
K. Komura
Inst. for Nucl. Study, Univ. of Tokyo
7) "Determination of the Half-life of S9 Ni"
p - 17 MeV
H. Mabuchi
Inst. for Solid State Physics, Univ. of Tokyo.
8) "Simulation of Swelling of Stainless Steel with Cyclotron Irradiation"
a - 30, 35.
(20 h, 5)
(23 h, 5)
(18 h, 6)
(11 h, '2)
(22 h, 2)
(3 h, I)
(5 h, 1)

172
M. Terasawa
Toshiba R. and D. Center
9) "Radiation Damage of Stainless Steel"
a - 36
K. Shiraishi
(12 h, 3)
Japan Atomic Energy Research Inst. (12 h, 1)
10) "Study of Effect of Helium Bubbles on the Mechanical Behavior of Stainless Steel
SUS 32 and 316 and Zirca10y Cladding"
a - 36 MeV
S. Kawasaki, T. Furuta, and T. Katou
Japan Atomic Energy Research Inst.
11) "Levels of 136Ba from the Decay of 136CS"
d - 23 MeV
S. Hayashibe and M. Oshima
Faculty of Science, Tohoku Univ.
12) "Levels of 119Sb from the Decay of 119mTe"
a - 44 MeV
M. Fujioka, M. Yanbe, and M. Hirasawa
Faculty of Science, Tohoku Univ.
13) "The Electric Monopole Transition in lS4Gd Feeded by 154Tb"
a - 38 MeV
H. Yamada
Nagoya Univ.
H. Kawakami, K. Komura, and M. Koike
Inst. for Nuclear Study
(83 h, 7)
(3 h, 1)
(3 h, 1)
(6 h, 1)
14) "Production of 1 30 1 for Study of Angular Correlation of the Gamma-Rays of 1 30 Xe"
P - 15 MeV
S. Furusawa
Dept. Phys., Niigata Univ. (3 h, 2)
15) "Production of 206 Bi for Study of Angular Correlation of the Gamma-Ray of 206 Po"
p - 9, a - 40
S. Furusawa
Dept. Phys., Niigata Univ.
16) "Study of the Decay Chain of 1 5 6 Er"
C - 65 MeV
S. Iwata and T. Tamura
Research Reactor Institute, Kyoto Univ.
J. O. Rasmussen
Univ. of California
(5 h, 1)
(10 h, 2)

173
Publica tions
1. T. Furuta and S. Kawasaki: "The Influence of Helium Distribution and Grain Size on
High-Temperature Embrittlement of Stainless Steel", 1. Nucl. Mat.,.i<L 275 (1974).
2. T. Furuta and S. Kawasaki : "Stress-Rupture Properties of Helium-Injected Zircaloy-4",
J. Nucl. Sci. Tech., Jl..z 268 ( 1 (74).
3. K. Matsumoto, T. Kataoka, H. Kamei, M. Terasawa, T. Karasawa, H. Sakairi, and E.
Vagi: "Embrittlement of Austenitic Stainless Steels Irradiated with Q - particles",
Trans. Iron and Steel Inst. Japan, 14, 118 (1974).


175
AUTHOR INDEX
AKIYAMA Nobuyuki f* III i,i iT 106
AMBE Fumitoshi tJ.i. m5 )Z 1W. 10S
AMBE Shizuko tJi m5 D -r lOS, 133
ARA T ANI Michi j{£ B- ~ ~ 111
AWAYA Yohko ;rt: ~ :g -T 97
CHIBA Yoshiaki {- m !H H)j 138, 139, 142, 148
FUJISAWA Takashi 34,84
FUJIT A Shin ]l 8:1 ~)r 2
FUKUDA Tomokazu ~ HI :# fO 30, 32,
FUKUSHI Kiyoshi t& ± iF] 133
HAMADA Tatsuji i!{ EB ii = 97
HARA Toshihiko IQ /ij~ #. 133
HARADA Kichinosuke [$: EB 5" ZJ!1J 113
HASHIMOTO Osamu ~ * tEl 30
HASHIZUME Akira t~ Jl\ WJ 76 , 79 , 97
HASIGUTI R. Ryukiti m D ~ 5" 101
HIRUT A Kotaro ~f EB ¥ *~I)
HEMMI Masatake ~}~ 1& lit
IDO Tatsuo if F :li tl 133
IGARASHI Kazui 1i + Jil-F-x
IKEGAMI Kumio tili L 1L -=-~
IKEZOE Hiroshi ~lli i;f~ tiE-"<1-
IMAMURA Masashi 4't-t
IMANISHI Bunryu
B El
30, 32
84 , 138, 146, 148,
155
129
2,84,89
30, 73
118, 120, 123
24
INOUE Toshihiko it L 1W. It 148, 159
IWAMOTO Akira !fi -;$: 8(:5 113
IWAMOTO Masako ;E; ;$: iE + 106,133
IW AT A Len !fi ~H ~* 133
IZUMO Koichi tb ~ Jlt - 97
KAGEY AMA Tadashi ~~ LU JI 2
KAMITSUBO Hiromichi 6,12,15,
19,34
KAMMURI Tetsuo 7a: fFj-:ft: 58,64
KAN AI Ta tsuaki -& -tt 31 1I}j 34
KATORI Kenji J1[ 11£ ~! _. 6,12,15,19
KA TOU Takeo 110 iii iB: ME 76, 79,97
KARASAWA Takashi fi!f J~ q: 133
KIMURA Kazuie * t-t - ~ 120
KODA Kugao Ej3 EB ~i!J5 134
KOIKE Masahiro IJ\ tt±!. 1£ '* 34
KOHNO Isao 1PJ ff J)] 4,6,12,15,19,27
KOY AMA Akio IJ\ LiJ /Vel 14 101,104
KOYAMA Katsuji + III Jm = 40,48
KUMAGAI Hidekazu ~~ :& -Jfj til 76, 79
KUTSCHERA, Walter 32,73
MATSUI Masao f'~ it 1£ * lIS , 120, 123
MA TSUY AMA Akira f'~ LiJ ~ 126, 129
MIKUMO Takashi -=- 1i.:
MIYAZAWA Yoshitoshi
El r[1 6,12,15 , 19
138, 146, 148, 150, 151,153,

176
MOTOBAYASHI Tohru * ;ft 6,12, 15, TAGISHI Yoshihiro 83 [f¢ ~ * 34 19,24
MOTONAGA Shoshichi :7C 71<- 821 --t 84
NAKAJIMA Hisao rp 1Il.~ jpJ fit 2, 12
NAKAJIMA Shunji rp ~ ~ = 6, 15, 19,27
NAKAMURA Masakatsu $ H IE ij~ 44, 48
NAKANISHI N oriyoshi ~ j§ ~ ~ 40,44,48
NOMURA Toru ff tt ¥ 30,32, 73
NOZAKI Tadashi '¥t ~ .if. 106, 133
ODERA Masatoshi
136, 138, 139, 142,
144, 146, 148, 150, IJ \ ~ .if. ~ 151 , 153, 155, 159,
161 , 164
OGIWARA Kiyoshi ~ @: m 2
OHNUMA Hajime *- 113 ffi 40,48
OKADA Takuya ~ EE ~ iE. 99
OKANO Masaharu ~ ff ~ m 97, 133
OSAWA Tomihiko *-?R '& j'J;. 133
SAKAGUCHI Harutaka tfj 0 m ~ 44,48
SAKAIRI Hideo jjj A !If fit 101, 104
SAKAMOTO Ichiro jjj * - ~B 134
SANO Mitsuo {~n (H rmJ) -'it ~ 61
SEKIZA W A Hisashi ~ ~ fa] 99
SHIMAMURA Akira ~ tt ~ 4
SHIOTANI Nobuhiro jj[ ~ .§. 5l 99
SPROUSE, G.D. 73
SUEKANE Shota * @ I§ j( 113
SUZUKI Kazutoshi i ii * fD $ 133
SUZUKI Toshio iii * lit ~ 82
T AHARA Akira 83 '* 821 133
TAKAHASHI Tan ~ m .§. 97, 126,129
TAKAHASHI Toru ~ m *- 123
T AKEBE Hideki ff:t tf~ ~ m 2, 84, 89
TAKEDA Shigeru rr IE ~ 44,48, 157
TAKEMASA Tadashi ff:t ~ jl" ± 52, 55,61
TAKESHITA Isao rr r ~ ~ 93
TAKEUCHI Suehiro 44,48
TAKI Ko 133
TENDOW Y oshihiko J(. ~ 1:f ~ 76, 79,97
TONUMA Tadao p ill .if. fit 148, 161 , 164
USUBA Isao fW. ~ l4 134
WADA Takeshi fa EE fit 34,64
W AKAI M asamichi * 1+ IE J]: 61
Y AGI Eiichi J\ * * - 101, 104
YAMADA Satoru LIJ 83 112- 40,48
YAMAJI Shuhei t.lJ ~ 11l ¥ 61,113
YAMAZAKI Y oshishige t.lJ ~ ~ JJX 73, 84
YASUKAWA Tamio ':tc } Ii R: ~ 123
Y AT AGAI Fumio ~ IE ~)(J;;: 126, 129
Y ATSURUGI Yoshifumi J\ ~IJ a x. 106
YOKOMIZO Hideaki t~ i14 ~ 13,Ej 148, 161 , 164
YOSHIDA Fusako 5" Ell m -f- 68
YOSHIDA Hiroshi a EB ~.L. 6,12, 15,19,27
YOSHIE Morio 5" II ~ ~ 30


IPeR Cyclotron Progress Report
111t~if~Pfi~{ 7 0 ~ 0 /~~ila ~8~( 1974 )
~ p hiltl 8E5f0 50~ (1 975 ) 3 J=J 25 13
§€ fj- HE5f050~ (1 975 ) 3 J=J 30 13
9Hr~ If ft :¥= :PH ?)f. fitf {-t*~ £ Jf
"F 351 t~EE!JHO:J'tmr.t~R 2 * 1 * ~~~ (0484 ) 62- 1 1 1 1
*iJ,t~ fff t :¥=1iH?)f.fitf-+J-1 70 r- 0 /' j]l!-g~ ~ ~
~~* ~ rn ~ ~P hil tl pJT J.L £ ~p XiJIJ fi ~\ -it t±
"FIOI **~T{-t EB[R1$EB1$i*PlnT§ 42*±t!!
~fiffi 3,000P1

埼玉県 和光市 広沢
理化学研究所


![kwf.gov.ph...at IPCR ang mga nagawa (accomplishment]output) sa 100b ng anim na buwan. Ibig sabihin, dalawang beses magsusumite ng IPCR ang mga kawani at ng DPCR ang mga punò ng sangay.](https://static.fdocuments.net/doc/165x107/608ee51cb0cee9423f1fc85a/kwfgovph-at-ipcr-ang-mga-nagawa-accomplishmentoutput-sa-100b-ng-anim-na.jpg)

