
IOSH FOOD AND DRINK GROUP IN PARTNERSHIP …...This report summarises the results of a benchmarking...
20
Doc: H&S KPI’s in the Food Industry Date: May 12 Rev: 01 Page 1 of 20 IOSH FOOD AND DRINK GROUP IN PARTNERSHIP WITH THE FOOD AND DRINK FEDERATION (FDF) AND DAIRY UK SHARING HEALTH & SAFETY KEY PERFORMANCE INDICATORS WITHIN THE FOOD INDUSTRY Supported by the FDF and Dairy UK, this health and safety benchmarking survey was distributed to all IOSH Food and Drink Group, all Dairy UK and all FDF members. 45 companies responded to the survey employing almost 70,000 staff between them. 1.0 SUMMARY This report summarises the results of a benchmarking survey undertaken in October 2011 by the IOSH Food and Drink Group (IOSH F&D Group), the Food and Drink Federation (FDF) and Dairy UK. The need for accurate food industry performance data was recognised by all parties and a joint project was agreed, to add credibility to the survey and to encourage as many participants as possible. This is the first year that this survey has been undertaken in this format (the FDF have run similar projects in the past) and the intention is to work with the FDF and other industry bodies representing the food sector, on an annual basis, to complete the survey. The results of the survey will be made freely available to all, on a collective basis.
Transcript of IOSH FOOD AND DRINK GROUP IN PARTNERSHIP …...This report summarises the results of a benchmarking...

Doc: H&S KPI’s in the Food Industry Date: May 12 Rev: 01 Page 1 of 20
IOSH FOOD AND DRINK GROUP IN PARTNERSHIP WITH THE FOOD AND DRINK FEDERATION (FDF) AND DAIRY UK
SHARING HEALTH & SAFETY KEY PERFORMANCE INDICATORS WITHIN THE FOOD INDUSTRY
Supported by the FDF and Dairy UK, this health and safety benchmarking survey was distributed to all IOSH Food and Drink Group, all Dairy UK and all FDF
members. 45 companies responded to the survey employing almost 70,000 staff between them.
1.0 SUMMARY
This report summarises the results of a benchmarking survey undertaken in October 2011 by the IOSH Food and Drink Group (IOSH F&D Group), the Food and
Drink Federation (FDF) and Dairy UK. The need for accurate food industry performance data was recognised by all parties and a joint project was agreed, to add
credibility to the survey and to encourage as many participants as possible.
This is the first year that this survey has been undertaken in this format (the FDF have run similar projects in the past) and the intention is to work with the FDF
and other industry bodies representing the food sector, on an annual basis, to complete the survey. The results of the survey will be made freely available to all,
on a collective basis.
Doc: H&S KPI’s in the Food Industry Date: May 12 Rev: 01 Page 2 of 20
CONTENTS .............................................................................................................................................................................. PAGE
1.0 SUMMARY .............................................................................................................................................................................. 1
2.0 BACKGROUND ......................................................................................................................................................................... 4
3.0 METHOD ................................................................................................................................................................................. 4
4.0 RESULTS .................................................................................................................................................................................. 5
4.1 FATALITIES ................................................................................................................................................................................................................ 5
4.2 MAJOR INJURIES ....................................................................................................................................................................................................... 5
4.3 OVER 3 DAY INJURIES ................................................................................................................................................................................................ 7
4.4 LOST TIME ACCIDENTS (including major and over three day injuries) .......................................................................................................................... 8
4.5 FIRE & ILL HEALTH DATA ........................................................................................................................................................................................... 9
4.6 ANALYSIS OF KEY MEASURES PER INDUSTRY CATEGORY .......................................................................................................................................... 10
5.0 DISCUSSION………………………………………………………………………………………………………………………………………………………………………….11
Appendix 1: Questionnaire instructions ...................................................................................................................................... 12
Appendix 2: Key to acronyms ...................................................................................................................................................... 18
Appendix 3: Accident incident rate per year in the Food & Drink industry ................................................................................... 19
Appendix 4: Bibliography……………………………………………………………………………………………………………………………………………………………20
Doc: H&S KPI’s in the Food Industry Date: May 12 Rev: 01 Page 3 of 20
TABLE OF FIGURES PAGE
Figure 1: Major injuries as classified by RIDDOR by cause ................................................................................................................................................ 6
Figure 2: Over three day reportable injuries by cause ...................................................................................................................................................... 7
Figure 3: Lost time accidents by cause ............................................................................................................................................................................. 8
Figure 4: Fire & ill health data ......................................................................................................................................................................................... 9
Table 1: Incident frequency rates per category………………………………………………………………………………………………………………………………………………………………… 8

Doc: H&S KPI’s in the Food Industry Date: May 12 Rev: 01 Page 4 of 20
2.0 BACKGROUND
Anecdotal evidence suggests that performance information in all industries is typically difficult to obtain, can be inaccurate and may not measure performance
on a consistent basis. For this reason the IOSH F&D Group and the FDF decided to run a joint survey of its members to elicit accurate information which could be
shared. In future, surveys will be repeated on an annual basis so that trends can be identified and the project may develop to benchmark performance in other
areas. Key management information which will be calculated from the information submitted in the survey includes major injuries per 100,000 hours worked,
over three day injuries per 100,000 hours worked and over three day injuries per 100,000 hours worked in specific food industry sectors. Further information is
given in Appendix 1.
3.0 METHOD
A questionnaire was developed and agreed with the committee members of each group and the survey was sent out electronically using a SNAP tool. Members
were encouraged to complete the on line assessment and instructions were provided on how to complete the questions consistently and accurately (see
appendix 1). The survey was then analysed and the graphical and tabular information given in the results section of this report was produced. All information
was treated confidentially and the SNAP survey was anonymous. All results were used to calculate the overall figures. However frequency rates for food
industry sectors e.g. dairy, bread & cakes etc., were only calculated and published on a collective basis where the sample size was three or more companies. This
was in order to protect anonymity and to ensure that the results were representative. All figures cover a 12 month period roughly relating to 2010-11. The
precise period cannot be specified as each company recorded incidents on a different basis e.g. calendar year, financial year etc. and sites were asked to submit
data as per their current collection regime. The survey was completed in October 11 and therefore figures relate to 2010-11 dependent upon the individual
company’s reporting period.
Government SIC 92 categories were generally used to classify the type of industry although there were additional sectors included for some areas including
Frozen Food, Distribution, Snacks & Nuts and Ready Meals.
An outline of the instructions given to participants in the survey is included as Appendix 1.
Doc: H&S KPI’s in the Food Industry Date: May 12 Rev: 01 Page 5 of 20
4.0 RESULTS
The results were checked and analysed. Where data on the survey was not properly completed the result was excluded. In total 45 companies completed the
survey representing around 70,000 employees or approximately 14% of the food manufacturing workforce in the UK in 2007 1. Respondents were asked to
report on the no. of fires, cases of work related upper limb disorder (WRULD) and cases of occupational asthma. On occasions respondents did not complete
their sections and the data was therefore excluded from the survey.
4.1 FATALITIES
Out of the 45 respondents 2 companies reported fatalities. These were due to a fall from height and a slip, trip or fall on the same level.
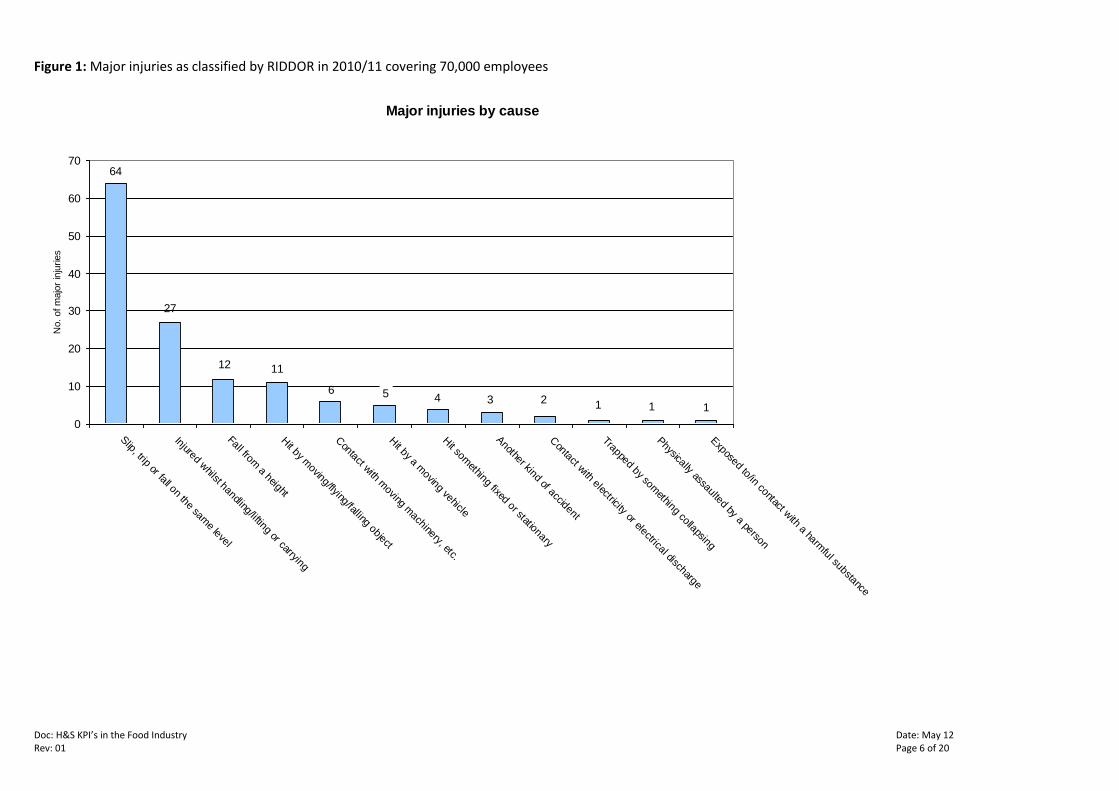
4.2 MAJOR INJURIES
Respondents were asked how many major injuries they experienced in the various RIDDOR categories. There were 137 major injuries reported across the food industry sample
in total. 64 of these resulted from slips, trips and falls on the same level making it the most prevalent cause of major injuries accounting for 47% of the total. Other significant
causes of major injuries included 27 (20%) injured whilst handling, lifting or carrying, 12 (9%) falls from height and 6 (4%) hit by an object.
Doc: H&S KPI’s in the Food Industry Date: May 12 Rev: 01 Page 6 of 20
Figure 1: Major injuries as classified by RIDDOR in 2010/11 covering 70,000 employees
Major injuries by cause
64
27
12 11
64 3 2 1 1 1
0
10
20
30
40
50
60
70
Slip, trip or fall on the sam
e level
Injured whilst handling/lifting or carrying
Fall from a height
Hit by m
oving/flying/falling object
Contact w
ith moving m
achinery, etc.
Hit by a m
oving vehicle
Hit som
ething fixed or stationary
Another kind of accident
Contact w
ith electricity or electrical discharge
Trapped by something collapsing
Physically assaulted by a person
Exposed to/in contact w
ith a harmful substance
No. of m
ajo
r in
juries
5

Doc: H&S KPI’s in the Food Industry Date: May 12 Rev: 01 Page 7 of 20
4.3 OVER 3 DAY INJURIES
Respondents were asked to detail how many reportable over 3-days injuries they had had in the various RIDDOR categories as listed above.
808 were reported in total. Slips, trips & falls on the same level (313 or 39%) and injured whilst handling, lifting or carrying (224 or 28%) were
the most prevalent cause of over 3 day injuries accounting for two thirds of the total.
Figure 2: Over three day injuries as classified by RIDDOR in 2010/11 covering 70,000 employees
Over 3 day injuries by cause
011123101226
49495166
313
224
0
50
100
150
200
250
300
350
Slip, trip or fall on the sam
e level
Injured whilst handling/lifting or carrying
Hit by m
oving/flying/falling object
Hit som
ething fixed or stationary
Another kind of accident
Fall from a height
Contact w
ith moving m
achinery, etc.
Hit by a m
oving vehicle
Exposed to/in contact w
ith a harmful substance
Exposed to fire
Trapped by something collapsing
Injured by an animal
Contact w
ith electricity or electrical discharge
Physically assaulted by a person
Exposed to an explosion
No. of over
3 d
ay in
juries

Doc: H&S KPI’s in the Food Industry Date: May 12 Rev: 01 Page 8 of 20
4.4 LOST TIME ACCIDENTS (including major and over three day injuries)
Respondents were asked to detail how many lost time accidents they had had in the various categories. In total 1730 lost time accidents were
reported. Again slips, trips & falls on the same level (597 or 35%) and injured whilst handling, lifting & carrying (460 or 27%) were the most
prevalent cause of lost tome accidents accounting for 62% of the total.
Figure 3: All lost time accidents as classified by RIDDOR in 2010/11 covering 70,000 employees
All lost time accidents by cause
597
460
170 155
100 107
46 4621 12 4 5 4 2 1
0
100
200
300
400
500
600
700
Slip, trip or fall on the sam
e level
Injured whilst handling/lifting or carrying
Hit by m
oving/flying/falling object
Another kind of accident
Fall from height
Hit som
ething fixed or stationary
Contact w
ith moving m
achinery, etc.
Hit by a m
oving vehicle
Exposed to/in contact w
ith a harmful substance
Exposed to fire
Contact w
ith electricity or electrical discharge
Physically assaulted by a person
Trapped by something collapsing
Exposed to an explosion
Injured by an animal
No. of lo
st tim
e a
ccid
ents
(all)

Doc: H&S KPI’s in the Food Industry Date: May 12 Rev: 01 Page 9 of 20
4.5 FIRE & ILL HEALTH DATA
Respondents were asked to report on some other miscellaneous data (see below). It is generally acknowledged that this type of data is
typically either not reported accurately or seriously under reported so no conclusions can be drawn from these results. This data has been
collected as a baseline for future years and in order to encourage companies to collect this data so that more accurate reporting can be
achieved. This data related to incidents such as fires, back injuries, occupational asthma and hearing loss etc.
Figure 4: Incidents of fires and ill health reported in 2010/11 covering 70,000 employees
27
32
24
32 31 31 31
0
5
10
15
20
25
30
35
Number of fires
Reported back injuries
Reported mental ill
health
Number of WRULD
Incidents of occupational
asthma
Incidents of occupational
dermatitis
Incidents of occupational hearing loss

Doc: H&S KPI’s in the Food Industry Date: May 12 Rev: 01 Page 10 of 20
4.6 ANALYSIS OF KEY MEASURES PER INDUSTRY CATEGORY
Table 1: Incident frequency rates per category
Various incident frequency rates were calculated from the data submitted. The overall over three day accident frequency rate (AFR) of the food industry
was 0.62 which means that 62% of workers in the food industry will suffer an over 3 day accident during their working lifetime. Various accident frequency
rates were calculated for the various industry categories so that this data can be used for comparative purposes. Due to the very low number of fires,
WRULD and occupational asthma reported no incidence rate has been calculated. All figures are the number of incidents per 100,000 hours.
Category1. Food
industry
Dairy Fish Bread &
Cakes
Fruit & Veg Biscuits Frozen Miscellaneous
Food
Manufacture
No. employees 2. 68,650 18,105 837 4,016 1,500 5,571 1,174 12,149
Major injury AFR 0.11 0.11 0.46 0.15 0.00 0.13 0.10 0.10
Over 3 day AFR 3. 0.62 0.64 1.26 0.59 2.11 1.83 1.04 0.71
LTA AFR (inc. major & over
3 day injuries)
1.33 1.14 2.29 1.41 4.52 4.56 2.39 1.32
Slips & trips AFR 0.29 0.34 0.69 0.28 1.78 0.50 0.21 0.33
Manual Handling AFR 0.19 0.19 0.46 0.20 0.20 0.58 0.42 0.21
Over 3 day incident rate
(per 100,000 employees)
1177 1121 1314 1245 4200 2800 1704 1383
Major incident rate (per
100,000 employees)
200 199 478 274 0 197 170 189
1. Not all categories were reported upon due to the low number of returns – hence the figures reported for the specific categories above will not add up to the grand total of 68,650 employees.
2. No. of employees reported upon to give an indication of sample size
3. As the survey was undertaken prior to the amendment to the RIDDOR Regulations in April 12, this survey includes ‘over 3 day’ accidents not just ‘over 7 day’ accidents

Doc: H&S KPI’s in the Food Industry Date: May 12 Rev: 01 Page 11 of 20
5.0 DISCUSSION
This is the first time that a joint IOSH F&D and FDF survey has been undertaken. The response rate achieved was 45 respondents covering
almost 70,000 employees, giving a reasonable sample size of approximately 14% of the workforce. This will be built upon in future surveys.
The over three day accident frequency rate was 0.62 per 100,000 hours worked and data for other food industry categories were also
calculated to enable industry categories to compare their performance.
The causes of major and over 3 day injuries were not unexpected and compared favourably with information previously reported by HSE.
Slips, trips and falls on the same level were the top cause of major, over 3 day and lost time accidents with injured whilst handling lifting or
carrying a close second. Falls from height accounted for a significant number of major, over three day and lost time accidents. No data was
excluded from the reported figures. Some of the industry specific data has a smaller sample size (see Table 1) and this data may not be as
accurate as the overall figures for the food industry.
The reported accident incident rate for the IOSH/FDF Food & Drink Survey is slightly lower than the HSE reported figure for 2010/11 (1177
compared to 1354). This may be because the HSE figures include all company sizes whereas the larger companies (which should have better
safety performance) are more likely to have participated in this voluntary survey.
This survey will be repeated in a similar format for 2011-12 which will allow more accurate data to be collected and appropriate comparisons
to be made.
Doc: H&S KPI’s in the Food Industry Date: May 11 Rev 01 Page 12 of 20
Appendix 1: Questionnaire instructions
SHARING HEALTH & SAFETY KEY PERFORMANCE
INDICATORS WITHIN THE FOOD INDUSTRY
SUPPORTED BY IOSH FOOD & DRINK GROUP/FDF/DAIRY UK
Background
Health & Safety key performance indicators for the food industry can be inaccurate and of
dubious value for benchmarking due to:
(a) acknowledged under reporting by companies nationally;
(b) defective population data used by HSE;
(c) historical nature of published figures; and
(d) the lack information relating to fire incidents, frequency rates and occupational health
incidents
Because of the above, food companies could benefit from more accurate and varied
information in a simple format.
Ground Rules
1. Food companies are invited to participate and submit a return annually.
2. The information will be treated as confidential and not circulated except as outlined below.
3. All food industry companies who are interested will have access to the collated
information. If they have not previously participated in the benchmarking exercise they
will be encouraged to participate after utilising the information.

Doc: H&S KPI’s in the Food Industry Date: May 11 Rev 01 Page 13 of 20
4. A collated report will be circulated once per annum and will be published on the IOSH Food
& Drink Group and FDF websites.
5. Figures to be submitted for the HSE year of April to March or for the nearest year if used by
a company i.e. a calendar year or the company’s reporting year.
e.g. HSE year = 04/09 to 03/10
or Calendar year = 2009
or Company year (example) = 05/09 to 04/10
6. Figures to be submitted under the food sector headings detailed on the survey form.
7. Select the food industry category nearest to your product makeup. Where there is more
than one site in a group of companies submitting a return please submit a separate return
for each category. This will provide valuable information about differences in accident
rates between different industry sectors.
8. When deciding the category for an individual business, it is the ‘principal function’ of that
business which should be taken into account.
9. Lost time accidents are those where a full shift or more has been lost up to three days.
10. Numbers of personnel/ hours worked recorded in calculations will exclude short-term
external contractors (e.g. a repair company who are only called in intermittently when
needed), but should include ‘long term’ contractors/agency staff on routine duties.
Doc: H&S KPI’s in the Food Industry Date: May 11 Rev 01 Page 14 of 20
11. Employee figures are the average total no. of all employees at all sites during the year
within a company e.g. Bloggs Ltd, Dairy Products = 465, made up from HQ Building -52
employees, Factory- 303, Four Depots - 110 (inc. Drivers). Part-time employees are to be
included as one person.
12. Where hours worked are not available estimate the no. of hours worked to enable a
frequency rate to be calculated. One employee will be assumed to work 40 hours per
week for these purposes. No account will be taken of part time workers or overtime
worked.
13. For the purposes of the return a fire includes any fire whether it results in loss or not.
14. Initially some simple occupational ill health data will be collected such as the number of
cases of WRULD’s and occupational asthma.
15. The following information will be calculated from the collated data submitted and
circulated as agreed above:
Major injuries per 100,000 hours (MI Frequency rate)
Major injuries per 100,000 employees (MI Incidence rate)
Over three day injuries per 100,000 hours (accident frequency rate)
Over three day injuries per 100,000 employees (Accident incidence rate)
Over three day slips & trips injuries per 100,000 hours
Over three day manual handling injuries per 100,000 hours
No. of fires
No. of fires per 100,000 hours
No of WRULD per 100,000 hours
No of occupational asthma per 100,000 hours
No. of back injuries
Doc: H&S KPI’s in the Food Industry Date: May 11 Rev 01 Page 15 of 20
No. of cases of mental ill health
No. of cases of occupational dermatitis
No. of cases of occupational hearing loss
Over three day injuries per 100,000 hours per product category

Doc: H&S KPI’s in the Food Industry Date: May 11 Rev 01 Page 16 of 20
FOOD INDUSTRY CATEGORIES
CATEGORY HSE RE (SICR 92)
INCLUDES
Biscuits 15.82 Preserved Pastry & Cakes
Bread and Cakes 15.81 Roll, Fresh Pastry & Cakes, Pies
Cocoa, Chocolate 15.84 Sugar, Confectionary
Crude Oils & Fats 15.41 Olive Oil, Soya Oil
Dairy Products 15.51 Milk Butter, Cheese, Yoghurt
Fish Processing 15.20
Fruit & Vegetables 15.33 Processing, Preserving, Canning, Jams, Marmalades, Jellies
Grain Milling 15.61 Flour, Meal Breakfast Cereals, Rice Vegetables
Ice Cream 15.52 Includes sorbet
Margarine 15.43 Cooking fats
Meat Processing 15.13
Pastas 15.85 Noodles
Poultry 15.12 Slaughter, Prepared Dishes
Slaughtering 15.11 (not Poultry)
Soft Drinks 15.98 Mineral Water (not Fruit Juice)
Soups 15.89
Starch 15.62 Gluten, Tapioca
Sugar 15.83 (not Glucose)
Tea & Coffee 15.86
Animal Feeds 15.71 (not Oil Seed)
Other Food Manufacture 15.89/9 e.g. Colourings, Seasonings, Spices and other ingredients (e.g. bakery ingredients)
Other ref
Frozen Foods Frozen
Distribution Distribution inc transport

Doc: H&S KPI’s in the Food Industry Date: May 11 Rev 01 Page 17 of 20
Snacks, Nuts and Crisps Snacks
Ready meals Ready meals All types
Note: Where categorising several companies within a group consider the ‘principal function’ of each company.

Doc: H&S KPI’s in the Food Industry Date: May 11 Rev 01 Page 18 of 20
Appendix 2: Key to acronyms
1. RIDDOR - Reporting of Injuries, Diseases and Dangerous Occurrences Regulations 1995 (as Amended)
2. WRULD – Work related upper limb disorder (also sometime referred to as RSI (repetitive strain injury)
3. HSE – Health & Safety Executive
4. Reportable – this refers to an over three day injury in the context of this report. (Please note this survey was conducted prior to the
amendment to the RIDDOR Regulations introduced on 6th April 2012)
5. Major injury – this is an injury reportable under Regulation 3 Schedule 1 of the RIDDOR Regulations
6. AFR – is an accident frequency rate which for the purposes of this report is reported per 100,000 hours
= No. of over 3 day accidents x 100,000/No of man hours worked
e.g. for a firm with 1000 employees who have worked a total of 2.4 million hours, with 7 over three day accidents the accident frequency rate
would be:
7 x 100,000/2400000 = 0.29 per 100,000 hours
7. Incident rate – is an accident rate which is calculated per 100,000 employees
= No. of over 3 day accidents x 100,000 employees/No. of employees
e.g. for a firm with 1000 employees with 7 over three day accidents the accident incident rate would be
7 x 100000/1000 = 700

Doc: H&S KPI’s in the Food Industry Date: May 11 Rev 01 Page 19 of 20
Appendix 3: Accident incident rate per year in the Food & Drink industry
Graph showing a 55% reduction in injuries in food and drink manufacture since 1990 with an incident rate per 100,000 workers of 1354 in
2010/11
Source: Health & Safety Executive
1200
1600
2000
2400
2800
rep
ort
ed
in
juri
es/1
00
,00
0 w
ork
ers

Doc: H&S KPI’s in the Food Industry Date: May 11 Rev 01 Page 20 of 20
Appendix 4: Bibliography
1. Research into UK Food & Drink Manufacturing – Final Report (Desk Research) David Boothby, Suzanne Clark, Stuart Attwood, Bingül Augustin (Aug 2007)


