Ion-Driven Permeation of Deuterium through Tungsten Motivation Permeation experiment Results Next...
16
Ion-Driven Permeation of Deuterium through Tungsten • Motivation • Permeation experiment • Results • Next steps A. V. Golubeva, M. Mayer, J. Roth
-
Upload
barrie-stuart-gilbert -
Category
Documents
-
view
231 -
download
0
Transcript of Ion-Driven Permeation of Deuterium through Tungsten Motivation Permeation experiment Results Next...
Ion-Driven Permeation of Deuteriumthrough Tungsten
• Motivation
• Permeation experiment
• Results
• Next steps
A. V. Golubeva, M. Mayer, J. Roth
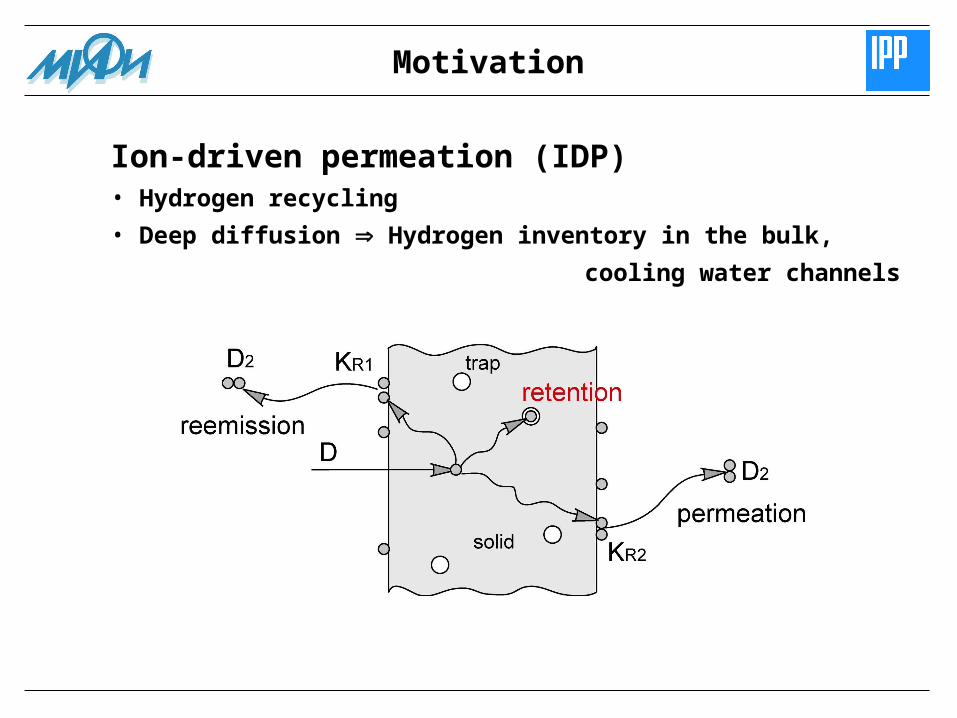
Ion-driven permeation (IDP)• Hydrogen recycling
• Deep diffusion Hydrogen inventory in the bulk,
cooling water channels
Motivation
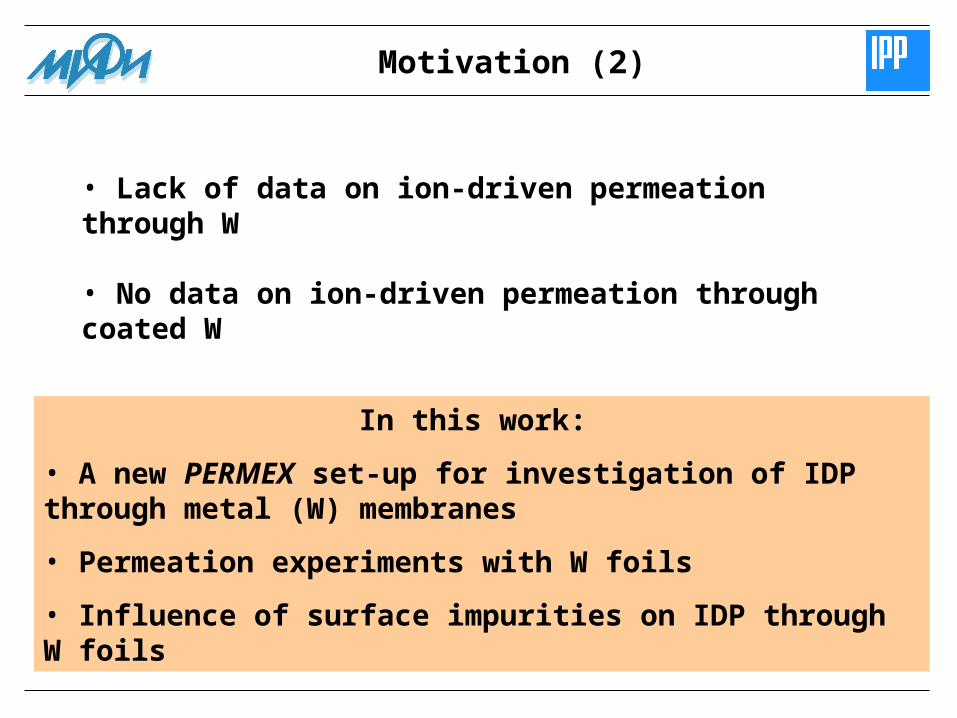
Motivation (2)
In this work:
• A new PERMEX set-up for investigation of IDP through metal (W) membranes
• Permeation experiments with W foils
• Influence of surface impurities on IDP through W foils
• Lack of data on ion-driven permeation through W
• No data on ion-driven permeation through coated W
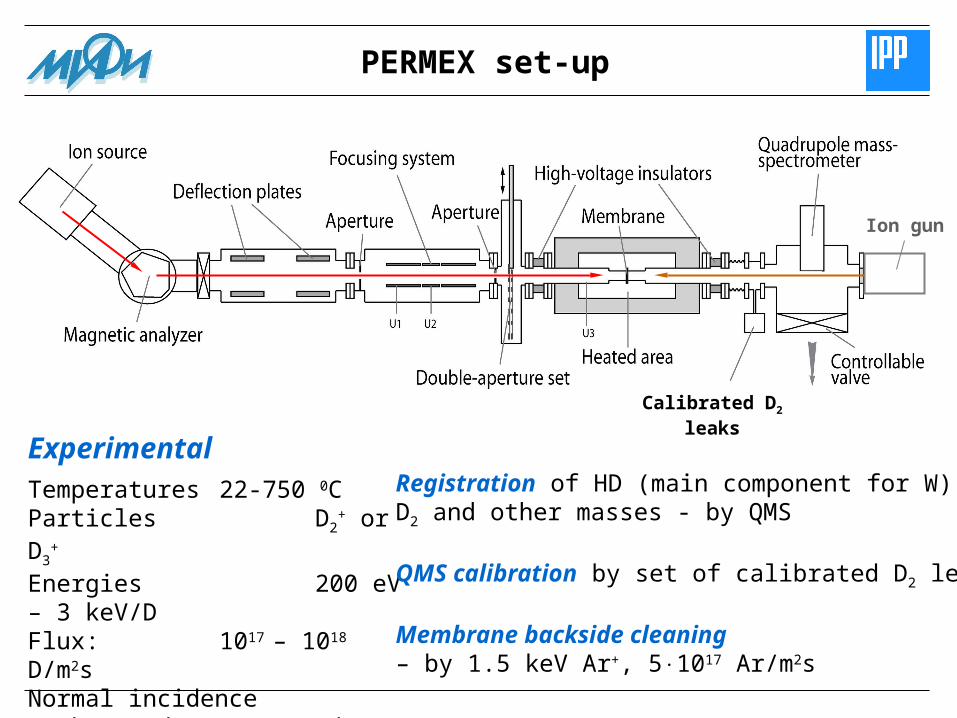
Experimental Temperatures 22-750 0CParticles D2
+ or D3+
Energies 200 eV – 3 keV/DFlux: 1017 – 1018 D/m2sNormal incidenceBackground <510-9 mbar
Ion gun
PERMEX set-up
Registration of HD (main component for W)D2 and other masses - by QMS
QMS calibration by set of calibrated D2 leaks
Membrane backside cleaning– by 1.5 keV Ar+, 51017 Ar/m2s
Calibrated D2
leaks
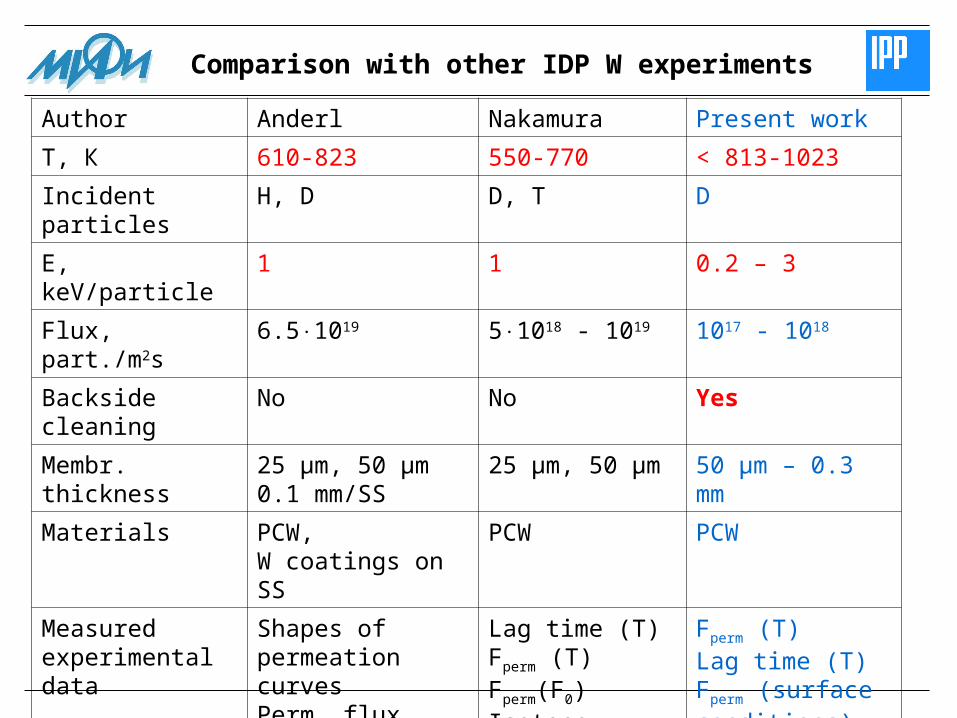
Author Anderl Nakamura Present work
Т, К 610-823 550-770 < 813-1023
Incident particles H, D D, T D
E, keV/particle 1 1 0.2 – 3
Flux, part./m2s 6.51019 51018 - 1019 1017 - 1018
Backside cleaning No No Yes
Membr. thickness 25 µm, 50 µm0.1 mm/SS
25 µm, 50 µm 50 µm – 0.3 mm
Materials PCW, W coatings on SS
PCW PCW
Measured experimental data
Shapes of permeation curvesPerm. flux (Fperm ) via material of membrane
Lag time (Т)Fperm (Т)Fperm(F0)Isotope effect
Fperm (Т)Lag time (Т)Fperm (surface conditions)
Modelling Energy & Concentr. of traps
Trapping energy Recombination coefficients
Comparison with other IDP W experiments
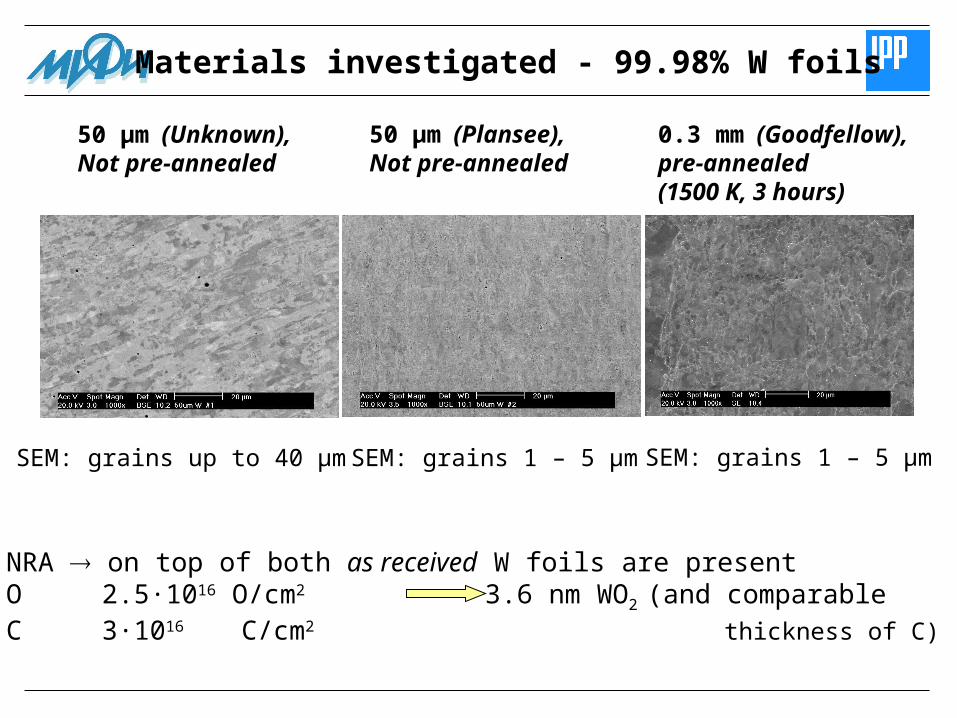
Materials investigated - 99.98% W foils
NRA on top of both as received W foils are presentO 2.5∙1016 O/cm2 3.6 nm WO2 (and comparableC 3∙1016 C/cm2 thickness of C)
50 µm (Unknown),Not pre-annealed
SEM: grains up to 40 µm SEM: grains 1 – 5 µm SEM: grains 1 – 5 µm
50 µm (Plansee),Not pre-annealed
0.3 mm (Goodfellow),pre-annealed (1500 K, 3 hours)
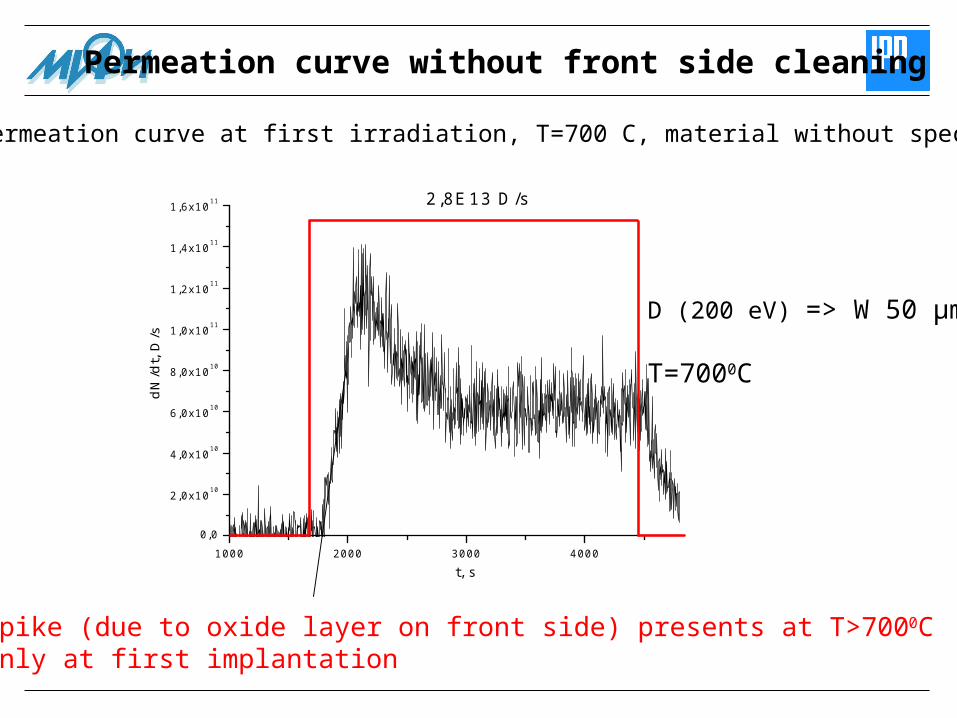
Permeation curve without front side cleaning
1000 2000 3000 4000
0,0
2,0x10¹⁰
4,0x10¹⁰
6,0x10¹⁰
8,0x10¹⁰
1,0x10¹¹
1,2x10¹¹
1,4x10¹¹
1,6x10¹¹
dN
/dt,
D/s
t, s
2,8E13 D/s
Typical permeation curve at first irradiation, T=700 C, material without specification
Spike (due to oxide layer on front side) presents at T>7000Conly at first implantation
D (200 eV) => W 50 µm
T=7000C
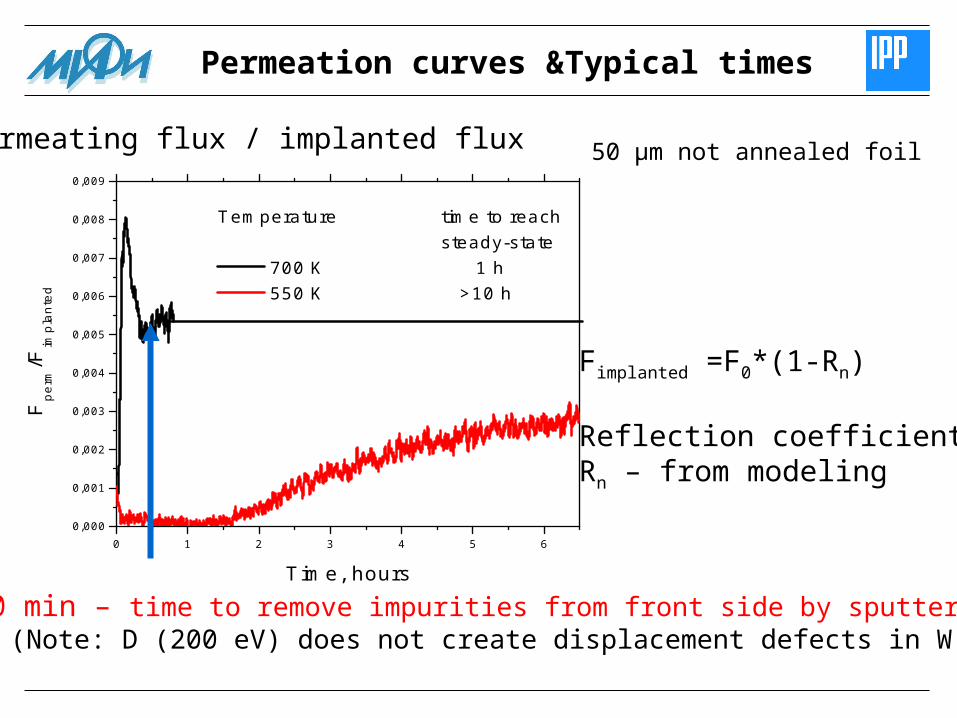
Permeation curves &Typical times
0 1 2 3 4 5 60,000
0,001
0,002
0,003
0,004
0,005
0,006
0,007
0,008
0,009
Fpe
rm/F
impl
ante
d
Time, hours
Temperature time to reachsteady-state
700 K 1 h 550 K >10 h
20 min – time to remove impurities from front side by sputtering(Note: D (200 eV) does not create displacement defects in W)
Fimplanted =F0*(1-Rn)
Reflection coefficient Rn – from modeling
Permeating flux / implanted flux 50 µm not annealed foil
820 840 860 880 900 920 940 960 9800.000
0.001
0.002
0.003
0.004
0.005
0.006
Dirty 1 hour cleaning of backside
I perm
/I 0
T, K
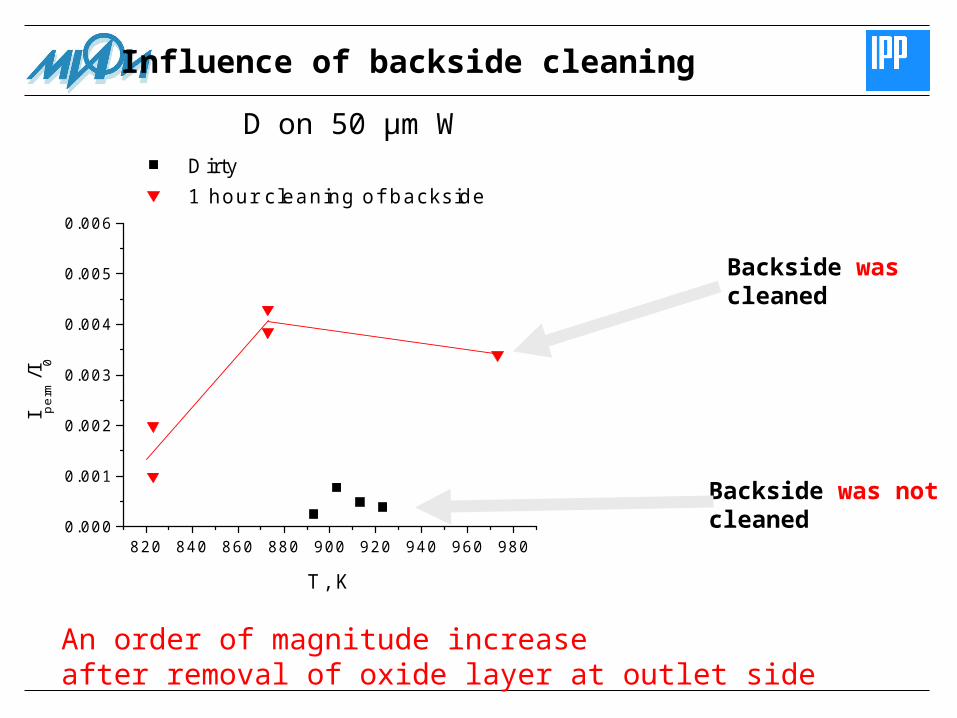
Influence of backside cleaning
Backside was notcleaned
Backside was cleaned
An order of magnitude increase after removal of oxide layer at outlet side
D on 50 µm W
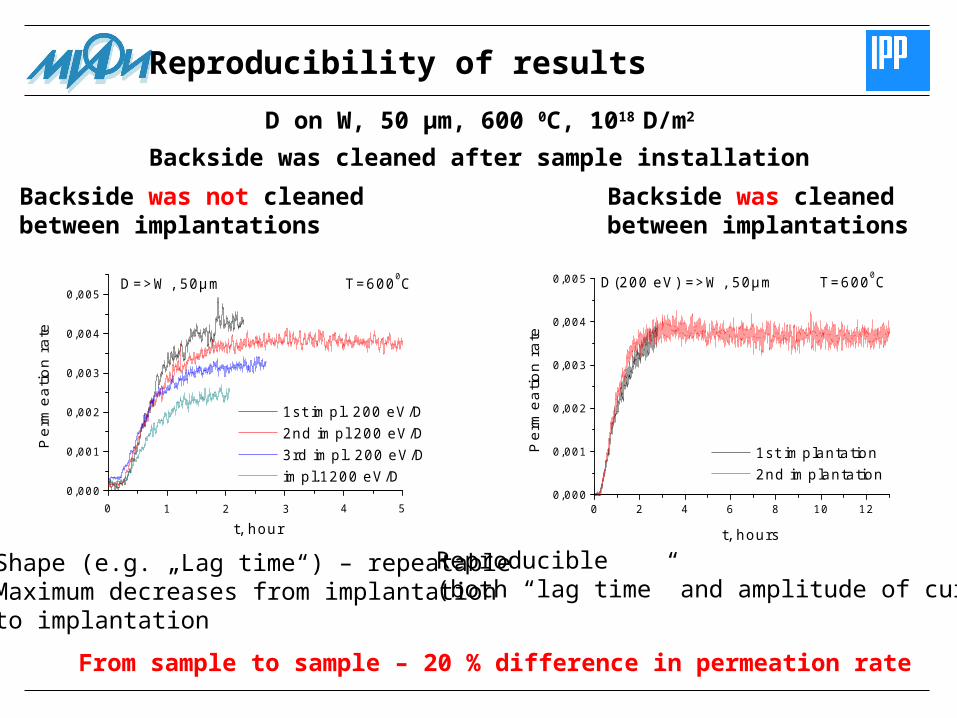
Reproducibility of results
Backside was not cleanedbetween implantations
Backside was cleanedbetween implantations
0 2 4 6 8 10 120,000
0,001
0,002
0,003
0,004
0,005
Pe
rme
atio
n r
ate
t, hours
1st implantation 2nd implantation
D(200 eV) =>W, 50µm T=6000C
0,000
0,001
0,002
0,003
0,004
0,005D=>W, 50µm T=6000C
54320 1
Pe
rme
atio
n r
ate
t, hour
1st impl. 200 eV/D 2nd impl 200 eV/D 3rd impl. 200 eV/D impl.1200 eV/D
•Shape (e.g. „Lag time“) – repeatable•Maximum decreases from implantation to implantation
Reproducible (both “lag time” and amplitude of curve)
D on W, 50 µm, 600 0C, 1018 D/m2
Backside was cleaned after sample installation
From sample to sample – 20 % difference in permeation rate

750 800 850 900 950 10000.0000
0.0005
0.0010
0.0015
0.0020
0.0025
as received backside
cleaned
Per
mea
ting
flux
/ In
cide
nt f
lux
Temperature, K
a
b1
b2
b3
Oxide influence: Backside cleaning
Plansee 50 m W, 200 eV/D, 21017 D/m2s Backside cleaning 5 times increase of permeation flux
b3 Surface conditions do not change during at least 2 days
Permeation dependsstrongly on surfaceconditions
2E-3
4E-4
Repeatability from sample to sample – 30 %
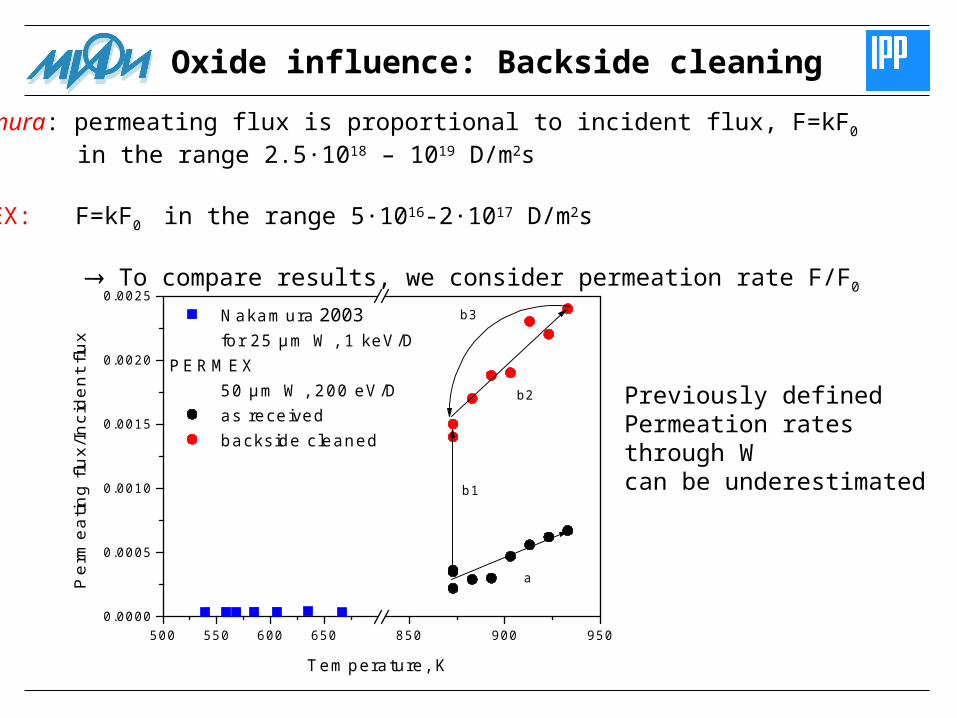
Nakamura: permeating flux is proportional to incident flux, F=kF0
in the range 2.5∙1018 – 1019 D/m2s
PERMEX: F=kF0 in the range 5∙1016-2∙1017 D/m2s
To compare results, we consider permeation rate F/F0
500 550 600 650 850 900 9500.0000
0.0005
0.0010
0.0015
0.0020
0.0025
Nakamura for 25 µm W, 1 keV/DPERMEX 50 µm W, 200 eV/D
as received backside cleaned
Pe
rme
atin
g f
lux/
Inci
de
nt
flux
Temperature, K
a
b1
b2
b3
Previously defined Permeation rates through Wcan be underestimated
Oxide influence: Backside cleaning
2003
Database
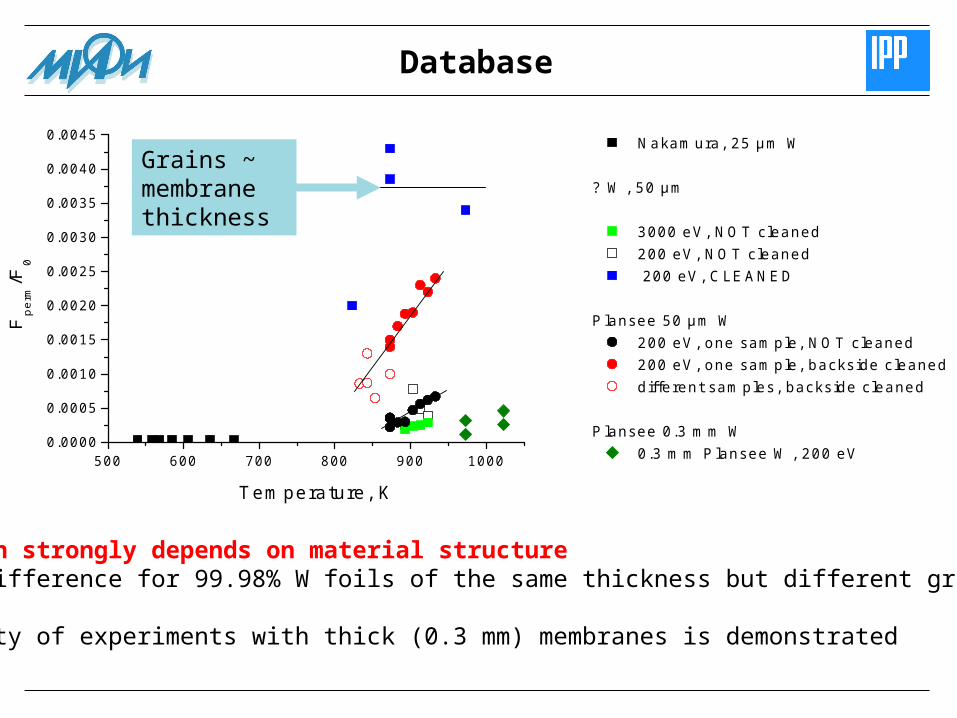
500 600 700 800 900 10000.0000
0.0005
0.0010
0.0015
0.0020
0.0025
0.0030
0.0035
0.0040
0.0045 Nakamura, 25 µm W
? W, 50 µm
3000 eV, NOT cleaned 200 eV, NOT cleaned 200 eV, CLEANED
Plansee 50 µm W 200 eV, one sample, NOT cleaned 200 eV, one sample, backside cleaned different samples, backside cleaned
Plansee 0.3 mm W 0.3 mm Plansee W, 200 eV
Fpe
rm/F
0
Temperature, K
Permeation strongly depends on material structure (2 times difference for 99.98% W foils of the same thickness but different grain sizes)
Possibility of experiments with thick (0.3 mm) membranes is demonstrated
Grains ~ membrane thickness
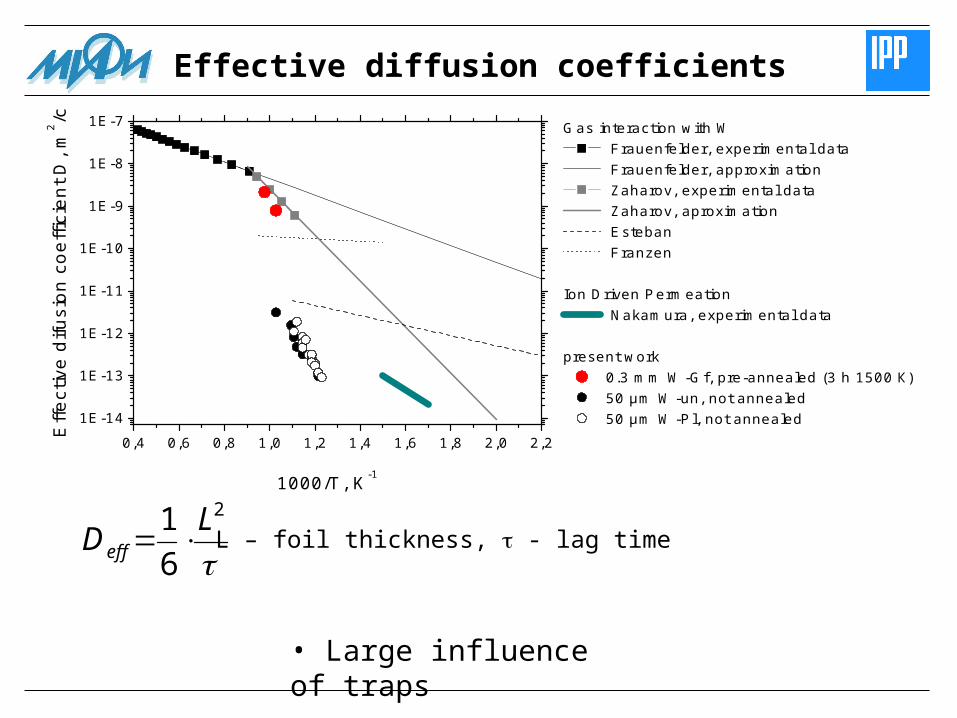
Effective diffusion coefficients
• Large influence of traps
0,4 0,6 0,8 1,0 1,2 1,4 1,6 1,8 2,0 2,2
1E-14
1E-13
1E-12
1E-11
1E-10
1E-9
1E-8
1E-7
Effe
ctiv
e di
fusi
on c
oeffi
cien
t D, m
2 /с
1000/T, K-1
Gas interaction with W Frauenfelder, experimental data Frauenfelder, approximation Zaharov, experimental data Zaharov, aproximation Esteban Franzen
Ion Driven Permeation Nakamura, experimental data
present work 0.3 mm W-Gf, pre-annealed (3 h 1500 К) 50 µm W-un, not annealed 50 µm W-Pl, not annealed
2
6
1 LDeff L – foil thickness, - lag time
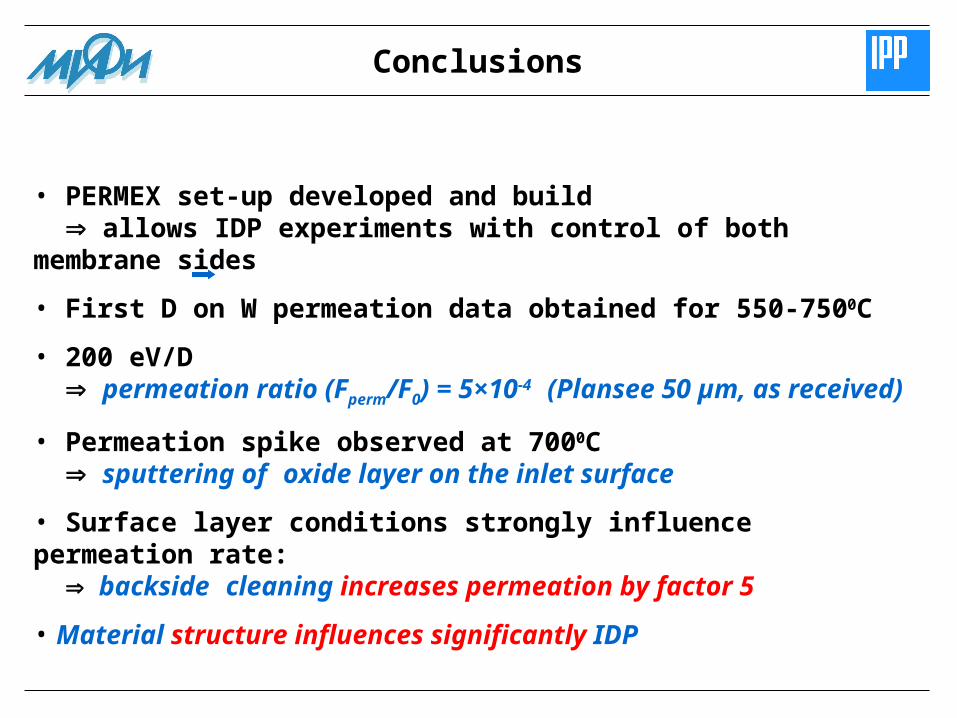
Conclusions
• PERMEX set-up developed and build allows IDP experiments with control of both membrane sides
• First D on W permeation data obtained for 550-7500C
• 200 eV/D permeation ratio (Fperm/F0) = 5×10⁻⁴ (Plansee 50 µm, as received)
• Permeation spike observed at 7000C sputtering of oxide layer on the inlet surface
• Surface layer conditions strongly influence permeation rate: backside cleaning increases permeation by factor 5
• Material structure influences significantly IDP

Future plans
• Permeation through W with different coatings on front side (oxide, carbide)
PhD thesis in collaboration with MEPhI (A. Pisarev)
• Modeling of IDP to obtain recombination coefficients