
INVESTOR ROADSHOW 2010 - Cision presentation includes statements regarding future results, which are...
38
PRESENTATION BAKKAFROST KØBENHAVN 10 JANUAR 2017
Transcript of INVESTOR ROADSHOW 2010 - Cision presentation includes statements regarding future results, which are...

PRESENTATION BAKKAFROST KØBENHAVN 10 JANUAR 2017

Page 2BAKKAFROST / SEB København 10 January 2017
DISCLAIMER
This presentation includes statements regarding future
results, which are subject to risks and uncertainties.
Consequently, actual results may differ significantly from
the results indicated or implied in these statements.
No representation or warranty (expressed or implied) is
made as to, and no reliance should be placed on, the
fairness, accuracy or completeness of the information
contained herein. Accordingly, none of the Company,
or any of its principal shareholders or subsidiary
undertakings or any of such person’s officers or
employees or advisors accept any liability whatsoever
arising directly or indirectly from the use of this
document.

HIGHLIGHTS Q3 2016
OUTLOOK AND GUIDANCE 2017
BAKKAFROST VALUE CHAIN AND
STRATEGY
INVESTMENT PROGRAM 2016 – 2020
FAROESE VETERINARY MODEL
MARKET DIVERSIFICATION

Page 4BAKKAFROST / SEB København 10 January 2017
HIGHLIGHTS Q3 2016
~110km
Acquisition of Faroe Farming and strong result
Harvested 10,664 tgw in Q3 2016 (12,982 tgw in Q3 2015)
Feed sales of 28,850 tonnes in Q3 2016* (27,011 tonnes in Q3
2015*)
Raw material purchase of 11,003 tonnes in Q3 2016 (10,417
tonnes in Q3 2015)
Revenues of DKK 640 million in Q3 2016 (DKK 677 million in Q3
2015)
Operational EBIT** of DKK 255 million in Q3 2016 (DKK 206 million
in Q3 2015)
Faroe Farming part of Bakkafrost from 1 July 2016
Positive results in Farming and FOF segments, while loss in VAP
segment
*) Including internal sale of 27,344 tonnes in Q3 2016 (24,071 tonnes in Q3 2015)
**) EBIT before fair value on biomass, onerous contracts, income from associates and revenue tax

Page 5BAKKAFROST / SEB København 10 January 2017
Strongest quarterly result from combined
Farming/VAP per kg, although VAP segment
is still struggling. FOF segment has good
result
Farming/VAP division increased margin
from 18.10 NOK/kg in Q3 2015 to 28.97
NOK/kg in Q3 2016
VAP segment delivered a margin of -14.15
NOK/kg in Q3 2016, compared with 2.95
NOK/kg in Q3 2015
Farming margin was 34.44 NOK/kg in Q3
2016, compared with 17.25 NOK/kg in Q3
2015.
FOF delivered a margin of 19.5% in Q3
2016, compared with 13.0% in Q3 2015
Group Operational EBIT was DKK 255
million in Q3 2016, compared with DKK
206 million in Q3 2015
SUMMARY OF THE QUARTER
(DKK million)
Q3
2016
Q3
2015
M9
2016
M9
2015
Operating revenues 640 677 2,334 2,091
Operational EBITDA 287 232 905 823
Operational EBIT 255 206 815 744
Profit for the period 346 168 783 492
Operational EBITDA margin 44.8% 34.3% 38.8% 39.4%
Operational EBIT margin 39.8% 30.4% 34.9% 35.6%
Operational EBIT/Kg (Farming) (NOK) 34.44 17.25 33.22 20.03
Operational EBIT/Kg (Farming and VAP) (NOK) 28.97 18.10 28.13 22.03
Operational EBIT/Kg (VAP) (NOK) -14.15 2.95 -14.75 5.52
EBITDA margin (Fishmeal, -oil and feed) 19.5% 13.0% 21.4% 19.5%

Page 6BAKKAFROST / SEB København 10 January 2017
DEVELOPMENT PER QUARTER Q1 2013 – Q3 2016
Turnover (mDKK)
Turnover for the Bakkafrost Group has
increased from 820 mDKK in 2010 to
2.9 bDKK in 2015.
Operational EBIT (mDKK)
Operational EBIT for the Bakkafrost Group
has increased from 247 mDKK in 2010 to
1.0 bDKK in 2015.
Farming margin Op. EBIT (NOK/kg)
The margin in Farming was NOK 19.63
per kg in 2015 – the highest ever.
(mDKK)
Q3
2016
Q2
2016
Q1
2016
Q4
2015
Q3
2015
Q2
2015
Q1
2015
Q4
2014
Q3
2014
Q2
2014
Q1
2014
Q4
2013
Q3
2013
Q2
2013
Q1
2013
Revenue 640 790 905 760 677 800 613 757 584 711 631 667 741 610 473
Operational EBIT 255 307 254 257 206 303 235 227 209 212 186 125 187 169 105
Profit/Loss 347 224 213 319 168 191 132 222 211 126 87 138 200 184 67
Harvest (tgw) 10,664 13,004 10,934 13,675 12,982 14,182 9,726 12,651 10,881 11,212 9,269 11,097 11,335 10,540 8,296
Op. EBIT Farming & VAP (NOK/kg) 28.97 27.88 27.55 21.83 18.10 22.62 26.12 19.48 19.73 17.66 21.37 12.44 15.76 15.29 12.16
Equity ratio 63% 61% 66% 66% 63% 61% 61% 60% 57% 53% 57% 54% 52% 49% 48%
NIBD 504 603 218 391 182 302 227 233 357 555 503 641 728 786 775
0
500
1.000
1.500
2.000
2.500
3.000
0
200
400
600
800
1000
1200
0
5
10
15
20
25
VAP margin Op. EBIT (NOK/kg)
The margin in VAP was NOK 5.58 per kg
in 2015 – at the same time as Farming
margin was record high.
-6,00
-4,00
-2,00
0,00
2,00
4,00
6,00
8,00

Page 7BAKKAFROST / SEB København 10 January 2017
OUTLOOK
Market
Global supply in 2017 expected to
increase only around 1%, compared to
2016 (back end loaded).
Farming
Bakkafrost expects to indrease volume
by 18% in 2017 compared with 2016.
Harvest of 56,000 tonnes compared
with 47,500 tonnes in 2016
Expected smolt release
in 2016, 11.5 million pieces (incl.
Faroe Farming)
in 2017 total 11.5 million pieces
VAP
Contracted 50% of the goal for the VAP
production for 2017
Fishmeal, -oil and feed
Forecast 8% increased feed sales
85,000 tonnes in 2017 compared
with 80,000 tonnes in 2016

HIGHLIGHTS Q3 2016
OUTLOOK AND GUIDANCE 2017
BAKKAFROST VALUE CHAIN AND
STRATEGY
INVESTMENT PROGRAM 2016 – 2020
FAROESE VETERINARY MODEL
MARKET DIVERSIFICATION

Page 9BAKKAFROST / SEB København 10 January 2017
SALES & MARKETING - PREMIUM QUALITY IS THE FULCRUM
History with salmon farming – Established in 1968
Involved with aquafarming in the Faroe Islands since the beginning
Rich traditions with salmon farming in the company – Same people
Location - The location of Faroe Islands is crucial for raising Premium
Quality Salmon
Steady temperature between 6-12 degrees Celsius gives a balanced
growth and minimizes the biological risks
Strong currents give a high level of water replacement which
minimizes the biological risks
Short distances between Bakkafrost facilities which reduces the
carbon footprint
Strict national aqua cultural legislation
Completely vertically integrated value chain
From initial ingredients to final delivery to the customer
Maximum control of the quality of each parameter in the production
process

Page 10BAKKAFROST / SEB København 10 January 2017
SALES & MARKETING - PREMIUM QUALITY IS THE FULCRUM
Special high-performance feed
Higher content of marine ingredients compared
with industry standard (Natural diet)
Especially rich in Omega 3 fatty acids
Purified fish oil (Free of toxins)
Produced of fish from sustainable quotas
Produced from off-cuts and fish which is not used
for human consumption
Only use GMO-free ingredients
Total traceability from initial catch to final feed
Locally caught fish used for the feed

Page 11BAKKAFROST / SEB København 10 January 2017
SALES & MARKETING - PREMIUM QUALITY IS THE FULCRUM
Large smolt in new hatcheries minimizes the
biologically risks
No use of antibiotics
Environmentally friendly treatment for sea-
lice on farming sites (Fresh water treatment
for sea-lice)
Healthy salmon give Bakkafrost the
possibility to have the salmon in the ocean
for a longer time
Opportunity for bigger salmon sizes
-
1,00
2,00
3,00
4,00
5,00
6,00
7,00
Norway Chile UK Faroe Islands
Average harvest weight (HOG)
2010G-2013G 2013G

Page 12BAKKAFROST / SEB København 10 January 2017
SALES & MARKETING - PREMIUM QUALITY IS THE FULCRUM
Gentle harvest - Pick up of state-of-the art wellboats
Transportation in salt water tanks
Short distance from farming sites to harvest plant
Minimal stress
Minimal carbon foot-print
Efficient and quick harvest
Chilled for optimal animal-welfare and stress less
Efficient production according
individual requirements
Optimal quality
Complete satisfaction

Page 13BAKKAFROST / SEB København 10 January 2017
SALES & MARKETING - PREMIUM QUALITY IS THE FULCRUM
Customized packaging to individual customer
Flexible delivery
Sea freight (Economical delivery of large quantities)
Air freight (Fast delivery with freshness in mind)
Markets
Strategy – 60/40 split between spot and contract
market
Divide our supply between North America, Europe,
Asia and Eastern Europe (EU=25% US=25%
Asia=25% Other=25%)
Target high-end market (Sushi-market; high-end
retail)
Close long-term relationship with our customers

Page 14BAKKAFROST / SEB København 10 January 2017
THREATS AND OPPORTUNITIES
FOR BAKKAFROST BUSINESS MODEL DUE TO DIGITALIZATION
Treats
Increased dependence on IT systems
Stability (operational performance)
Liability (implementation)
Integrity (increased data increases possible
errors)
IT complexity outgrows competences (i.e. farming
staff)
Opportunities
Converging data for real-time usage (Operational
Intelligence)
Faster decision making
Proactive instead of reactive approach
KPI´s and statistics (Business Intelligence)
Reporting
Using historical data to plan
Optimization
Benchmarking
Increased traceability throughout Bakkafrost’s value
chain (increases value both for Bakkafrost and
customer)

HIGHLIGHTS Q3 2016
OUTLOOK AND GUIDANCE 2017
BAKKAFROST VALUE CHAIN AND
STRATEGY
INVESTMENT PROGRAM 2016 – 2020
FAROESE VETERINARY MODEL
MARKET DIVERSIFICATION

Page 16BAKKAFROST / SEB København 10 January 2017
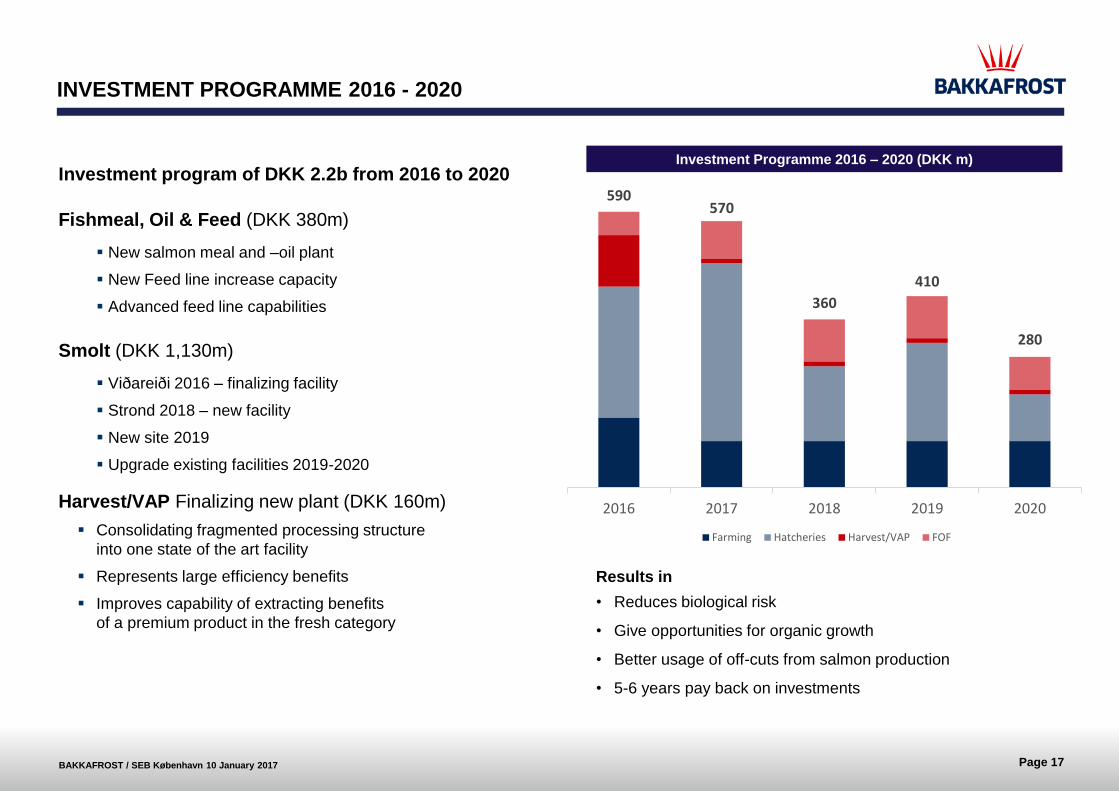
INVESTMENT PROGRAMME 2016 - 2020
Investments will be made step by step in the relevant parts in the value chain to
secure:
Biological risk
Efficiency
Organic growth
Page 17BAKKAFROST / SEB København 10 January 2017
INVESTMENT PROGRAMME 2016 - 2020
Investment program of DKK 2.2b from 2016 to 2020
Fishmeal, Oil & Feed (DKK 380m)
New salmon meal and –oil plant
New Feed line increase capacity
Advanced feed line capabilities
Smolt (DKK 1,130m)
Viðareiði 2016 – finalizing facility
Strond 2018 – new facility
New site 2019
Upgrade existing facilities 2019-2020
Harvest/VAP Finalizing new plant (DKK 160m)
Consolidating fragmented processing structure
into one state of the art facility
Represents large efficiency benefits
Improves capability of extracting benefits
of a premium product in the fresh category
590570
360
410
280
2016 2017 2018 2019 2020
Farming Hatcheries Harvest/VAP FOF
Investment Programme 2016 – 2020 (DKK m)
Results in
• Reduces biological risk
• Give opportunities for organic growth
• Better usage of off-cuts from salmon production
• 5-6 years pay back on investments

Page 18BAKKAFROST / SEB København 10 January 2017
TRANSFER TO SEAWATER TRANFER TO PROCESSING
FRESHWATER STAGE (MONTHS) SEAWATER STAGE (MONTHS) FALLOWING
1 2 3 4 5 6 7 8 9 10 11 12 1 2 3 4 5 6 7 8 9 10 11 12 13 14 15 16 17 18 1 2
6 kg GW
TRANSFER TO SEAWATER TRANFER TO PROCESSING
FRESHWATER STAGE (MONTHS) SEAWATER STAGE (MONTHS) FALLOWING
1 2 3 4 5 6 7 8 9 10 11 12 13 14 15 16 17 18 1 2 3 4 5 6 7 8 9 10 11 12 1 2
6 kg GW
100 g
500 g
DE-BOTTLENECKING: SHORTENING THE SEA-WATER PRODUCTION CYCLE
Allowing for~30% increased production capacity
De-bottlenecking of value chain – cycle in sea reduced by ~5 months (~30%)
Synchronised fallowing
Sites/companies in each area need to implement new cycle simultaneously to achieve full capacity effect
Reducing exposure to biological risks in the sea water environment
Both spring and fall releases exposed to one summer season
30% REDUCTION

Page 19BAKKAFROST / SEB København 10 January 2017
VIÐAREIÐI S-21 EXPANSION 2016
New site expansion 2016
Volume expansion of 8,000 m3
Total tank capacity after expansion:
11,200 m3
Production 2015 – 3.3 million smolts
with a size of 115 gram
Production will increase to 4.5 million
smolts with an average weight of 300
gram
Hatchery Manager: Sigurð Jacobsen
No of employees: 8
Overview S-21

Page 20BAKKAFROST / SEB København 10 January 2017
Building
Ground floor 20,000 m²
Total floor space 26,000 m²
Total tank volume 28,760 m³
Length 290 m – width 80 m
Construction period 2016 to 2018
Number of employees: 12
STROND S-24 PROJECT
Strond S-24 Construction period 2016-2018

Page 21BAKKAFROST / SEB København 10 January 2017
Reduce risk
Time in sea water will be reduced by 6 months
Reduced mortality
Reduced need for treatment against sea-lice
Increase in production
Possible to increase production by 30%
Time in hatchery will be longer than in the sea
Size smolts and growth per day in farms (gram)
Size of smolts and growth time in sea to 6kg HOG (months)
Size of smolts
No of months to 6 kg
Growth (gram per day)
Gro
wth
(gra
m p
er
day)
in s
ea f
arm
LARGER SMOLT

Page 22BAKKAFROST / SEB København 10 January 2017
FRESH WATER DIVISION CAPACITY INCREASE
Capacity increase in order to produce large smolt
The capacity increases in 2016 with the new
Hatchery at Viðareiði 8,000m3
New Hatchery at Strond 29,000m3 in operation
in 2018
Total capacity 4 folded from 2015 to 2018
Capacity development
-
5.000
10.000
15.000
20.000
25.000
30.000
35.000
40.000
45.000
50.000
2015 2016 2017 2018
Capacity
Strond
Viðareiði

Page 23BAKKAFROST / SEB København 10 January 2017
INCREASED VOLUME BASED ON LARGER SMOLT
Larger smolt (PS) will reduce time of cycle in farming
Smolt size will gradually increase to 500 gram by
2020
Smolt release will gradually increase to ~14 million
pcs as production cycle decreases from 24 to ~14
months (incl. fallowing period)
Production volume will gradually increase to ~7
thousand tonnes
8,6
10,7
9,510,4
11,310,4
11 11
12
13
0
2
4
6
8
10
12
14
Smolt release (million pcs)Smolt size on released fish (size gram)
107 122 113 119144 160
200230
430
500
0
100
200
300
400
500
600
Production volume (1,000 tonnes)
0,91,3
1,1 1,21,6 1,7
2,22,5
4,7
6,0
0
1
2
3
4
5
6
7
Farming volume – growth potential with PS (1,000 tonnes)
36,3
44,341,3
44,0
50,648,0
65,0
0
10
20
30
40
50
60
70

Page 24BAKKAFROST / SEB København 10 January 2017
NEW HATCHERY S-24 STROND IN KLAKSVÍK
In operation in H2 2018
Capacity to produce ~7 million smolts á 500 gram
Goal to secure improvements in the following areas:
Efficiency
Biological risk
Organic growth
New Hatchery Strond in Klaksvík

Page 25BAKKAFROST / SEB København 10 January 2017
STRATEGY:
NATURAL TREATMENTS OF SEA-LICE
Increased farming operation requires steps to reduce sea lice
Lump fish
Fresh water SPA
Warm water SPA
M/S Hans á BakkaM/S Martin
Lumpfish

Page 26BAKKAFROST / SEB København 10 January 2017
New plant in operation in H2-2016
Reduced costs in:
Logistics
Operation
Energy
Maintenance
Amounting to DKK 70 – 90 million
per year
SYNERGIES FROM CONSOLIDATION 2005 – 2010

HIGHLIGHTS Q3 2016
OUTLOOK AND GUIDANCE 2017
BAKKAFROST VALUE CHAIN AND
STRATEGY
INVESTMENT PROGRAM 2016 – 2020
FAROESE VETERINARY MODEL
MARKET DIVERSIFICATION

Page 28BAKKAFROST / SEB København 10 January 2017
BIOLOGICAL CONTROL – CRITERIA 1
A GOOD REGULATORY FARMING ENVIRONMENT
During the period 2001-2004 the Faroe Islands were
severely struck by ISA outbreaks
New legislation and regulation was introduced in 2003
known as ”The Faroese Veterinary Model”:
One generation based farming model
Fallowing periods between each generation
Immunisation and vaccination programs
Restricting movement of equipment and fish
Density limits introduced
Brood stock facilities allowed on land only
Fish for harvest not allowed in open waiting cages at
harvest station
Minimum distances between farms and hatcheries
Rules to fight and control sea-lice introduced
The Model has resulted in one of the most predictable fish
production environments in the world with good KPI for
salmon farming, such as FCR, Mortality and Growth rate
The mortality rate with the Faroese Veterinary Model has been between
5 and 10% compared to 20 to 25% before – despite the annual
production has never been higher than now
Source: Bakkafrost, Kontali
0
2
4
6
8
10
12
0
10
20
30
40
50
60
70
80
Num
ber
of
ISA
cases
Harv
est
(thousand t
onnes H
OG
)Number of ISA cases Harvest (thousand tonnes HOG)
Biological meltdown paved way for robust regulatory regime

Page 29BAKKAFROST / SEB København 10 January 2017
BIOLOGICAL CONTROL – CRITERIA 2
FEW PLAYERS IN EACH PRODUCTION REGION
0%
10%
20%
30%
40%
50%
60%
70%
80%
90%
100%
Norway Chile UK NorthAmerica
Faroes
SH
AR
E O
F P
RO
DU
CT
ION
Other;
70 players
Other;
15 players
BA
KK
A
Source: Kontali
A tight regulatory regime is not enough
A large number of decisions will always be left to the
operators
As opposed to most other industries, operators are
directly exposed to each others behaviour
Efficient production requires a high degree of
cooperation in the waters, e.g.
Coordinated fallowing periods
Coordinated lice treatment in direction of current
Hard to get «all the ducks in a row» as coordination will
always carry a cost to some operator, e.g.
Requirement to await next generation to join new
fallowing regime
Self reporting of disease in order to protect
surrounding farms
The “tragedy of the commons” is challenging to avoid in a fragmented industry
Highly fragmented industry, except Faroes

Page 30BAKKAFROST / SEB København 10 January 2017
BIOLOGICAL CONTROL – CRITERIA 3
MINIMISE EXPOSURE TO OTHER COMPANIES IN EACH PRODUCTION AREA
Strong regulatory framework
Few players to agree on coordination of unregulated
matters – avoids “tragedy of the commons”
Limited overlap of players within production zones
Swaps have enforced each players “independence”
Existing licenses are operated on a 12-year rolling
lifespan system
Automatic renewal unless
Failure to fulfill the veterinary conditions
Conflict with governmental or municipalities’
planning areas
Conflict with animal welfare
Conflict with environmental protection
License give right to utilise given area of fjords for
farming fish
No MAB, but strict regulative measures on farming
activity maintaining environmentally sustainability

Page 31BAKKAFROST / SEB København 10 January 2017
EBIT PER KG
0
1
2
3
4
5
6
2009 2010 2011 2012 2013 2014 2015
EU
R
Norway Bakkafrost EUR price
Source: Kontali, Annual reports
Margin diverged since 2010
Compared to a large selection of production in Norway,
EBIT per kg has diverged significantly since 2010
The absolute improvement for Bakkafrost is a function of
Robust farming framework with ability to maintain
biological control
Market recognition of high end product (price
achievement)
Efficiency in the value chain
Price and EBIT per kg

Page 32BAKKAFROST / SEB København 10 January 2017
SIZE AND SURVIVAL MATTERS
Source: Kontali
2,00
2,50
3,00
3,50
4,00
4,50
5,00
5,50
Norway Chile UK Faroe Islands
2012 -
20
14
2015
2012 -
2014
2012 -
2014 2012 -
2014
2015
2015
20
15
2,00
2,50
3,00
3,50
4,00
4,50
5,00
5,50
6,00
6,50
Norway Chile UK Faroe Islands
2012 -
2014
2015
2015
2015
2015
2012 -
2014
2012 -
2014
2012 -
2014
-
5,00
10,00
15,00
20,00
25,00
30,00
Norway Chile UK Faroe Islands2012 -
2014
2015
2015
2015
20152
012 -
2014
2012 -
2014
2012-2
014
Yield per smolt a key KPI
Function of average harvest weight and mortality
Faroe Island performs on both parameters
Yield per smolt (HOG) Average harvest weight (HOG)
Average mortality (%)

Page 33BAKKAFROST / SEB København 10 January 2017
SIZE AND SURVIVAL MATTERS!
Source: Kontali
OPTIMAL HARVEST WEIGHT
OPTIMAL COST CURVE
IMPACT OF LICE, DISEASE ETC.
(Treatment, slow growth, high FCR etc.
FURTHER IMPACT OF MORTALITY/EARLY HARVEST
-14%
-12%
-10%
-8%
-6%
-4%
-2%
0%
2%
4%
6%
2 / 3 kg 6 / 7 kg
Significant benefits of yield per smolt performance
Larger fish generally catches a price premium,
early/accelerated harvest is punisher with discount
Healthy fish keeps costs down
Low mortality
Less treatments, better feed conversion and faster growth
Fixed cost dilution with larger size 1,30
1,35
1,40
1,45
1,50
1,55
1,60
1,65
1,70
Norway Chile UK Faroe Islands
2010G-2013G 2013G
Average price diff. vs. 4/5 kg (2014-2016) Illustration of cost dynamics
Feed used/harvest volume (HOG), EFCR

Page 34BAKKAFROST / SEB København 10 January 2017
THE MARKET IS WILLING TO PAY UP FOR PREMIUM PRODUCTS
Source: Kontali
Consistent large sized fish forms
baseline for price premium
Bakkafrost has further tailored its
product for the premium market
through
Investing in very high inclusion
rates of marine raw materials
Development of a demand driven
value added processing franchise
Including capability of
“upgrading” parts of ~10% of
fish normally sold at discount as
“downgraded” due to skin scars,
deformities etc.
Superior market access as the Faroe
Islands is rarely part of recurring
trade sanctions/embargos/dumping
duties etc.
Export price, Fresh Atlantic Salmon (head on)
-0,50
-0,25
0,00
0,25
0,50
0,75
1,00
0,00
1,00
2,00
3,00
4,00
5,00
6,00
2004 2005 2006 2007 2008 2009 2010 2011 2012 2013 2014 2015
Dif
fere
nce
EU
R /
kg
EUR
/ k
g
Faroe Islands Norway Difference

HIGHLIGHTS Q3 2016
OUTLOOK AND GUIDANCE 2017
BAKKAFROST VALUE CHAIN AND
STRATEGY
INVESTMENT PROGRAM 2016 – 2020
FAROESE VETERINARY MODEL
MARKET DIVERSIFICATION
Page 36BAKKAFROST / SEB København 10 January 2017
Markets Q3 2016E Q3 2015 Volume % YTD 2016E YTD 2015 Volume %
EU 246.400 248.500 -2.100 -1% 696.000 705.200 -9.200 -1%
USA 88.700 91.700 -3.000 -3% 287.000 277.600 9.400 3%
Russia 15.900 29.200 -13.300 -46% 49.200 73.300 -24.100 -33%
Japan 14.000 14.800 -800 -5% 41.300 36.600 4.700 13%
Greater China 22.700 26.000 -3.300 -13% 70.700 73.600 -2.900 -4%
ASEAN 14.000 14.400 -400 -3% 49.500 45.600 3.900 9%
Latin America 31.300 41.000 -9.700 -24% 105.800 118.100 -12.300 -10%
Ukraine 1.800 2.200 -400 -18% 6.000 6.100 -100 -2%
Other markets 61.000 63.600 -2.600 -4% 169.800 174.900 -5.100 -3%
Total all markets 495.800 531.400 -35.600 -6,7 % 1.475.300 1.511.000 -35.700 -2,4 %
Comments:
Greater China = China / Hong Kong / Taiwan (incl. estimated re-export from Vietnam)
ASEAN = Association of Southeast Asian Nations (estimated re-export from Vietnam subtracted)
Latin America (including both Mexico and Caribbean + domestic consumption in Chile)
All figures above are in tonnes hog, and are rounded to the nearest 100 tonnes.
YTD Q3 comparisonEstimated volumes Q3 comparison Estimated volumes
SALMON MARKETS, SOLD QUANTITY (HEAD ON GUTTED – HOG)
Source: Kontali
Reduced supply in Q3 2016 and YTD of Atlantic Salmon (head on gutted - HOG)Supply decreased in Q3 2016
35,600 tonnes lower supply
compared with Q3 2015
Russia and Latin America
affected most, -46% and -24%
respectively
USA market down 3,000
tonnes, corresponding to -3%
Greater China market down
3,300 tonnes, corresponding to
-13%
Supply YTD decreased
1,475,300 tonnes sold YTD
Russia and Latin America
decreased most
Only USA, Japan and
ASEAN increased

Page 37BAKKAFROST / SEB København 10 January 2017
Bakkafrost salmon is a global product sold worldwide
86% of sales came from Continental Europe in 2002
34% of sales came from Continental Europe in first nine
months in 2016. Other main markets are more or less equal.
The market is now diversified on all continents
MARKET DIVERSIFICATION
2002 2007
Source: Bakkafrost
M9 2016
Cont.EU86%
UK5%
USA3%
Asia4%
Cont.EU47%
UK27%
USA8%
Asia8%
Eastern Europe
10%
Cont.EU34%
UK7%
USA23%
Asia19%
Eastern Europe
17%

Page 38BAKKAFROST / SEB København 10 January 2017


