
INVESTOR RELATIONS ROADSHOW DECK
42
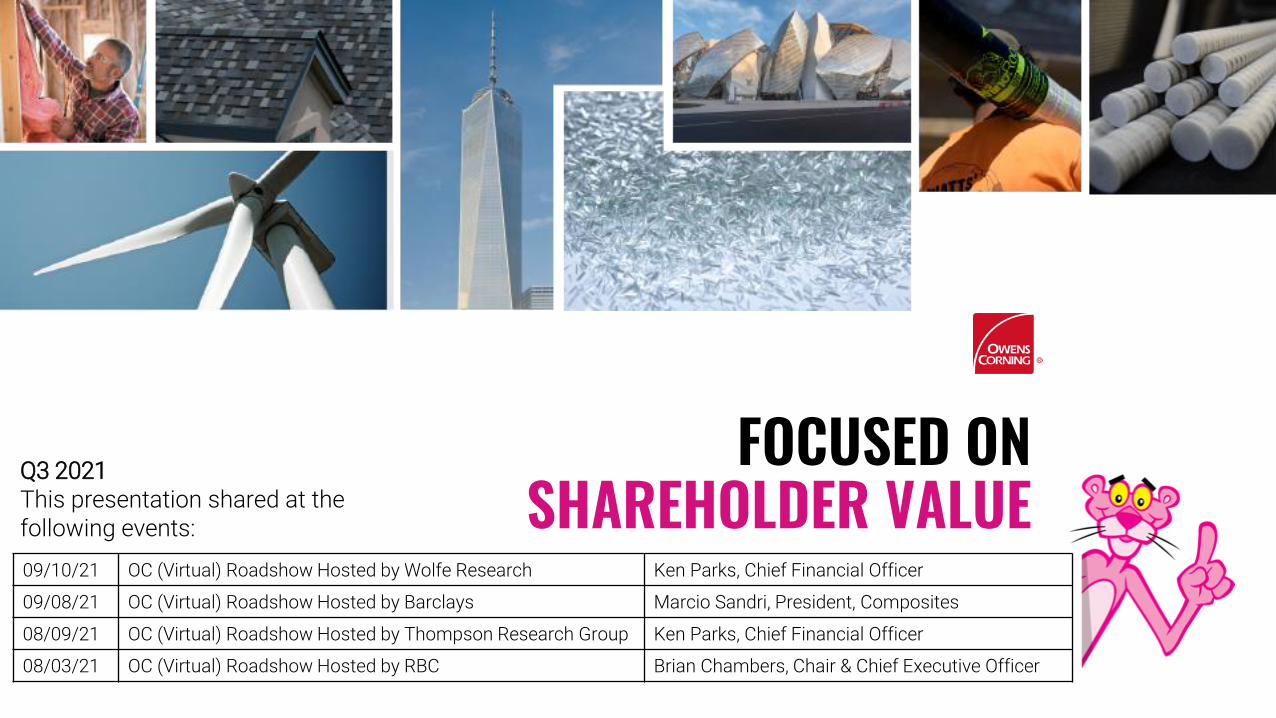
FOCUSED ON SHAREHOLDER VALUE Q3 2021 This presentation shared at the following events: 09/10/21 OC (Virtual) Roadshow Hosted by Wolfe Research Ken Parks, Chief Financial Officer 09/08/21 OC (Virtual) Roadshow Hosted by Barclays Marcio Sandri, President, Composites 08/09/21 OC (Virtual) Roadshow Hosted by Thompson Research Group Ken Parks, Chief Financial Officer 08/03/21 OC (Virtual) Roadshow Hosted by RBC Brian Chambers, Chair & Chief Executive Officer
Transcript of INVESTOR RELATIONS ROADSHOW DECK
FOCUSED ON SHAREHOLDER VALUE
Q3 2021This presentation shared at the following events:
09/10/21 OC (Virtual) Roadshow Hosted by Wolfe Research Ken Parks, Chief Financial Officer
09/08/21 OC (Virtual) Roadshow Hosted by Barclays Marcio Sandri, President, Composites
08/09/21 OC (Virtual) Roadshow Hosted by Thompson Research Group Ken Parks, Chief Financial Officer
08/03/21 OC (Virtual) Roadshow Hosted by RBC Brian Chambers, Chair & Chief Executive Officer
FORWARD-LOOKING STATEMENTS AND NON-GAAP MEASURES
2THE PINK PANTHER™ & © 1964-2021 Metro-Goldwyn-Mayer Studios Inc. All Rights Reserved. © 2021 Owens Corning. All Rights Reserved.
This presentation and the associated remarks contain forward-looking statements. We caution you against relying on these statements as they involve risks and uncertainties that are difficult to predict and the Company’s actual results may differ materially from those projected. Such risks and uncertainties include, without limitation: the severity and duration of the current COVID-19 pandemic on our operations, customers and suppliers, as well as related governmental actions; levels of residential, commercial and industrial construction activity; global industrial production; competitive and pricing factors; demand for our products and relationships with key customers; raw material and other input availability, issues related to acquisitions, divestitures, joint ventures or expansions; industry, economic and political conditions, including new legislation, policies or other governmental actions in the U.S. or elsewhere; climate change, weather and storm activity; changes to tariff, trade or investment policies or law; uninsured losses, including those from natural disasters, pandemics, catastrophe, theft or sabotage; energy, transportation, price volatility and cost issues; legal and regulatory, including environmental, disputes or proceedings; ability to protect our intellectual property and information technology systems; achievement of expected synergies or productivity improvements; the level of fixed costs required to run our business; currency, commodity and interest rate fluctuations; our level of indebtedness, liquidity, and the availability and cost of credit; levels of goodwill or other indefinite-lived intangible assets; price volatility in U.S. wind energy markets; labor disputes or shortages, or loss of key employees; pension obligations; and factors detailed from time to time in the Company’s SEC filings.
The terms “year to date” or last twelve months (“LTM”) refer to the period ended on the last calendar day of the quarter preceding the date of the investor event referenced on the first page above. Otherwise the information in this presentation speaks as of the date of the investor event, and is subject to change. The Company assumes no obligation to update or revise forward-looking statements except as required by law. Any distribution of this presentation after the investor event is not intended and should not be construed as updating or confirming such information.
This presentation contains references to certain "non-GAAP financial measures" as defined by the SEC, which may be referenced in the Appendix or in the tables of our earnings press release. Adjusted EBIT, adjusted EBITDA, adjusted earnings, adjusted EPS and return on capital exclude certain items that management does not allocate to its segment results because it believes they are not representative of the Company’s ongoing operations. When the company provides forward-looking expectations for non-GAAP measures, the most comparable GAAP measures and reconciliations to those GAAP measures are generally not available without unreasonable effort due to the variability, complexity and limited visibility of the adjusting items that would be excluded from the non-GAAP measures in future periods. The variability in timing and amount of adjusting items could have significant and unpredictable effects on future GAAP results.
AGENDA
Investment highlights
ESG at Owens Corning
Three strong businesses
Additional financial information
3
1
2
3
4
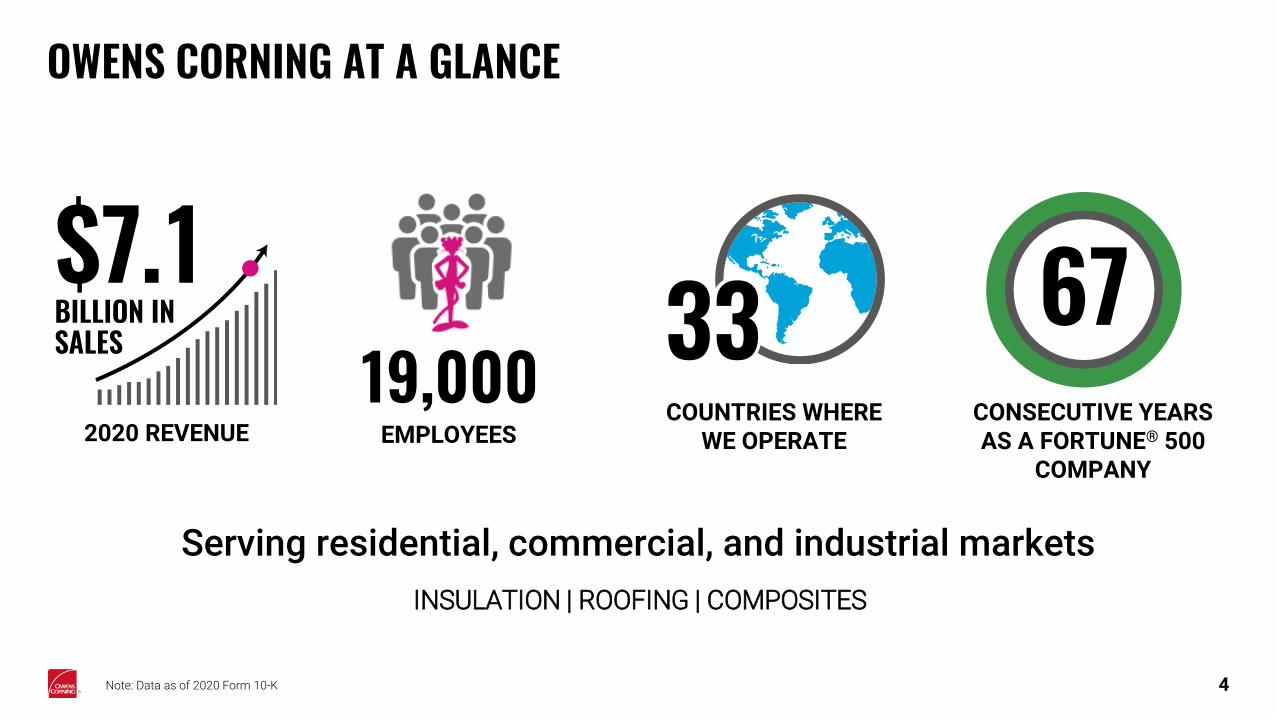
OWENS CORNING AT A GLANCE
4
INSULATION | ROOFING | COMPOSITES
Serving residential, commercial, and industrial markets
Note: Data as of 2020 Form 10-K
2020 REVENUECOUNTRIES WHERE
WE OPERATECONSECUTIVE YEARS AS A FORTUNE® 500
COMPANY
19,000EMPLOYEES
67
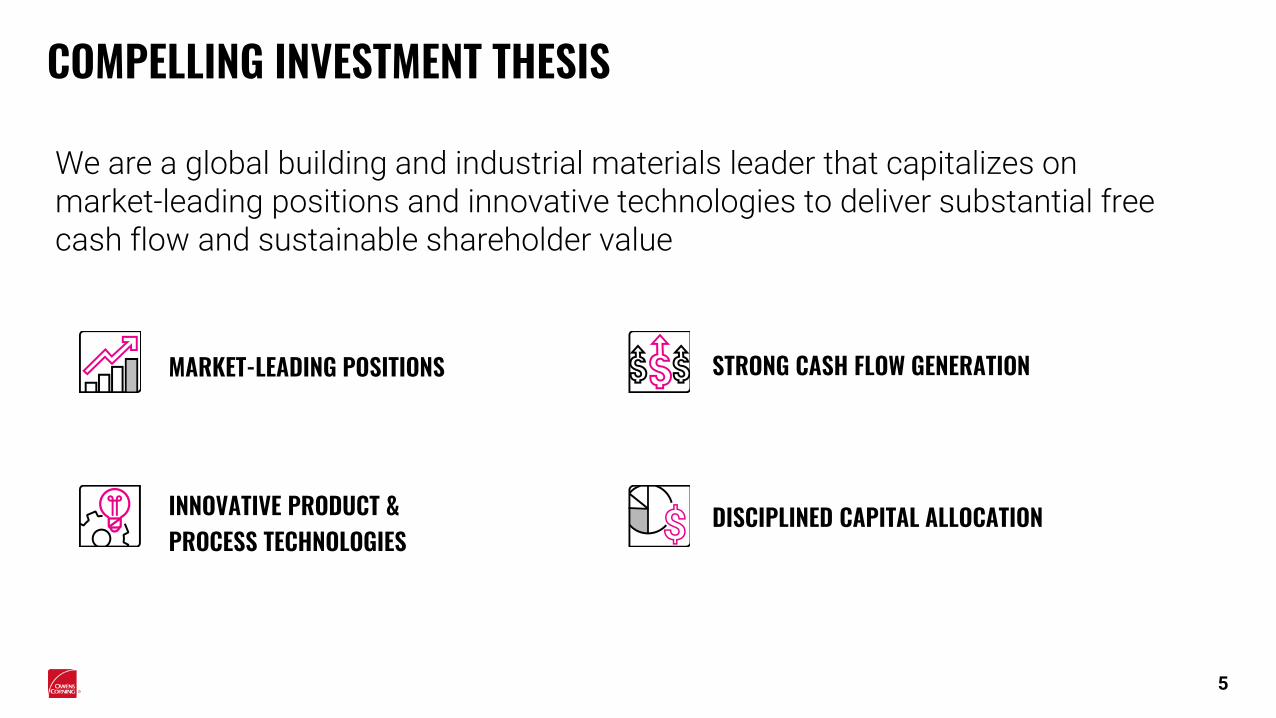
DISCIPLINED CAPITAL ALLOCATION
MARKET-LEADING POSITIONS STRONG CASH FLOW GENERATION
INNOVATIVE PRODUCT &PROCESS TECHNOLOGIES
5
We are a global building and industrial materials leader that capitalizes on market-leading positions and innovative technologies to deliver substantial free cash flow and sustainable shareholder value
COMPELLING INVESTMENT THESIS
33%
13%
33%
36%
17%
18%
17%
33%
2006 2020
7%
84%
5%
4%
26%
10%
23%
41%
2%
12%
27%59%
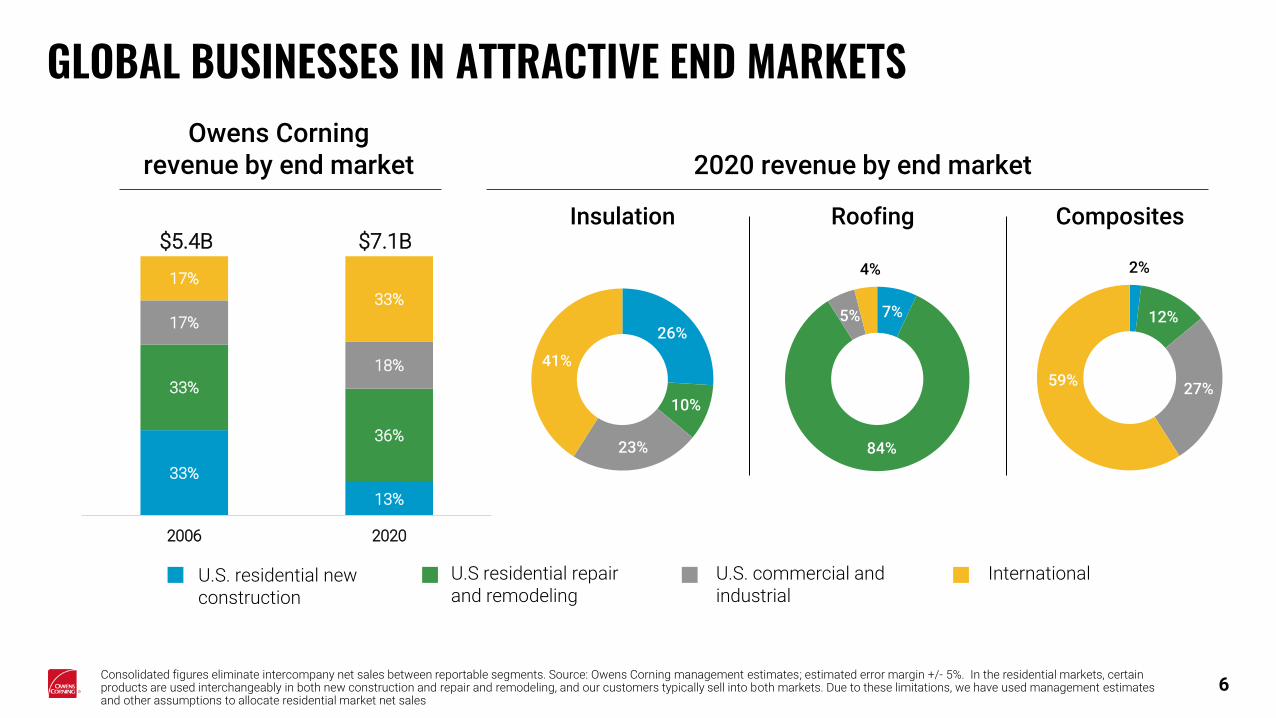
GLOBAL BUSINESSES IN ATTRACTIVE END MARKETSOwens Corning
revenue by end market
U.S. residential new construction
Consolidated figures eliminate intercompany net sales between reportable segments. Source: Owens Corning management estimates; estimated error margin +/- 5%. In the residential markets, certain products are used interchangeably in both new construction and repair and remodeling, and our customers typically sell into both markets. Due to these limitations, we have used management estimates and other assumptions to allocate residential market net sales
InternationalU.S. commercial and industrial
U.S residential repair and remodeling
6
2020 revenue by end market
$5.4B $7.1BRoofing CompositesInsulation
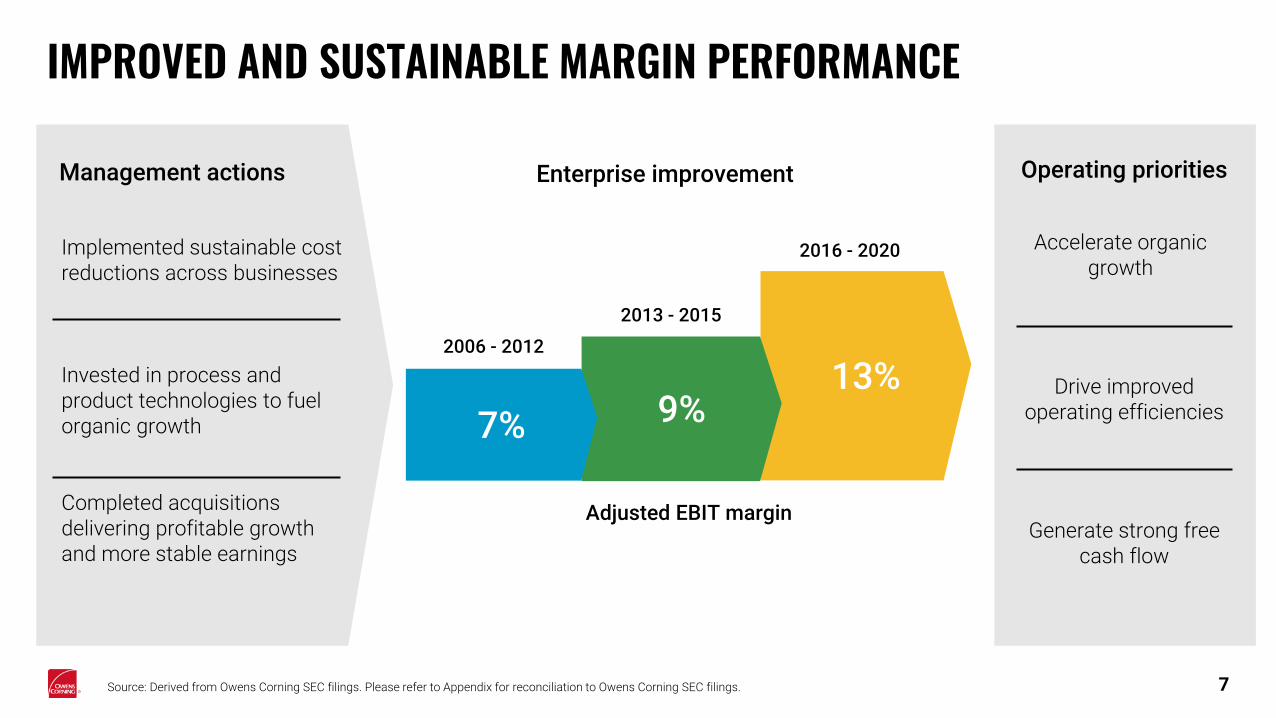
Accelerate organic growth
IMPROVED AND SUSTAINABLE MARGIN PERFORMANCE
Adjusted EBIT margin
2013 - 2015
13%9%7%
2006 - 2012
2016 - 2020
Management actions Enterprise improvement
7
Operating priorities
Implemented sustainable cost reductions across businesses
Invested in process and product technologies to fuel organic growth
Completed acquisitions delivering profitable growth and more stable earnings
Drive improved operating efficiencies
Generate strong freecash flow
Source: Derived from Owens Corning SEC filings. Please refer to Appendix for reconciliation to Owens Corning SEC filings.
INVESTMENT HIGHLIGHTS
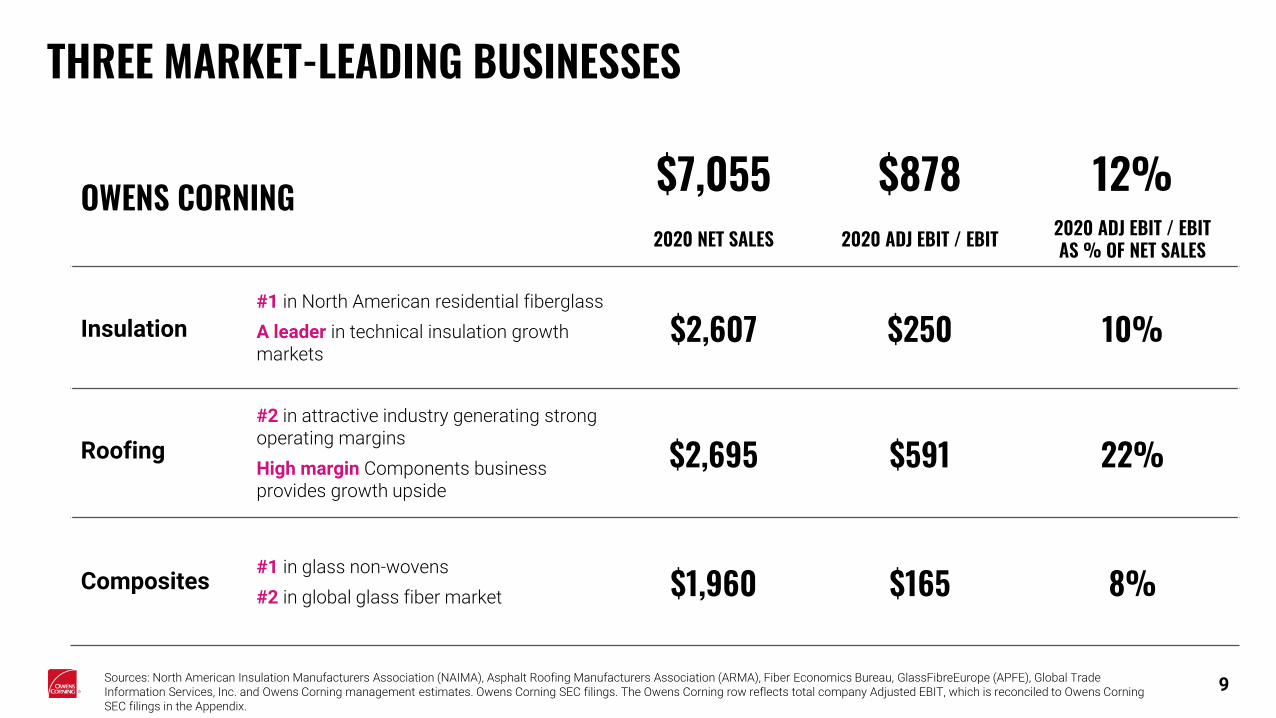
OWENS CORNING $7,055 $878 12%2020 NET SALES 2020 ADJ EBIT / EBIT 2020 ADJ EBIT / EBIT
AS % OF NET SALES
#1 in North American residential fiberglass
A leader in technical insulation growth markets
$2,607 $250 10%
#2 in attractive industry generating strong operating margins
High margin Components business provides growth upside
$2,695 $591 22%
#1 in glass non-wovens
#2 in global glass fiber market $1,960 $165 8%
9
THREE MARKET-LEADING BUSINESSES
Roofing
Insulation
Composites
Sources: North American Insulation Manufacturers Association (NAIMA), Asphalt Roofing Manufacturers Association (ARMA), Fiber Economics Bureau, GlassFibreEurope (APFE), Global Trade Information Services, Inc. and Owens Corning management estimates. Owens Corning SEC filings. The Owens Corning row reflects total company Adjusted EBIT, which is reconciled to Owens Corning SEC filings in the Appendix.
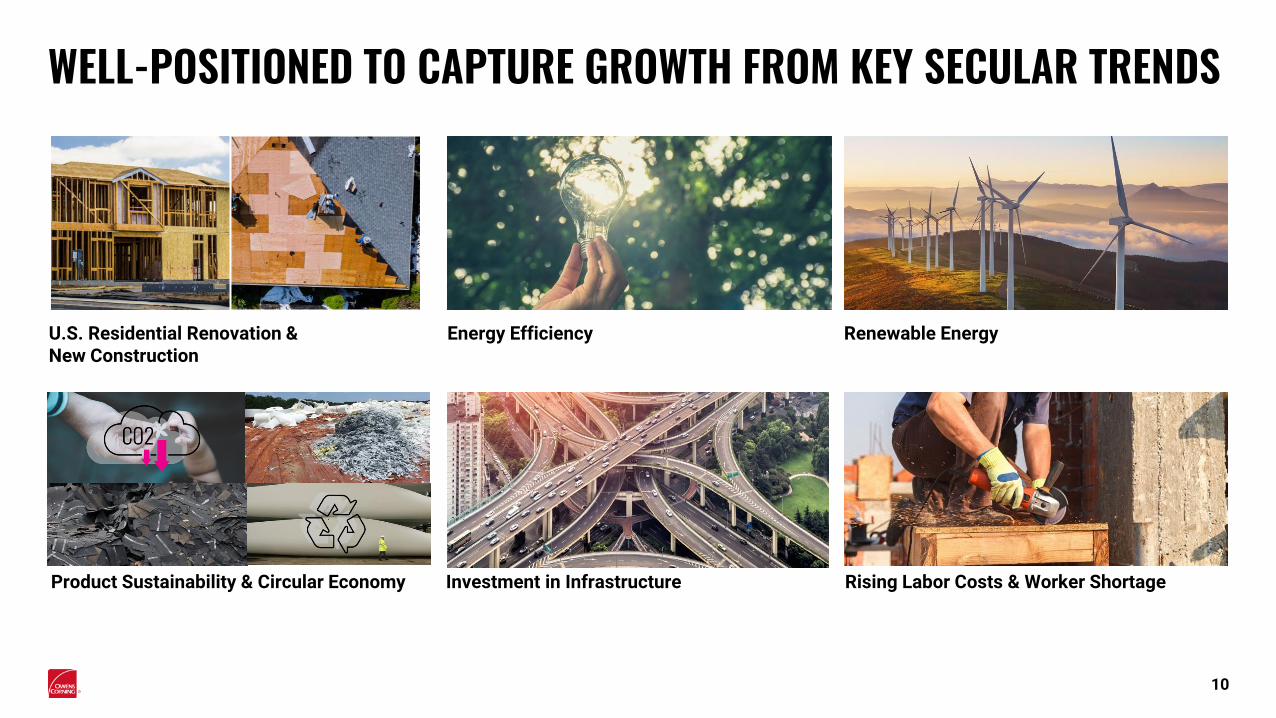
WELL-POSITIONED TO CAPTURE GROWTH FROM KEY SECULAR TRENDS
Energy Efficiency Renewable Energy
Product Sustainability & Circular Economy Investment in Infrastructure Rising Labor Costs & Worker Shortage
10
U.S. Residential Renovation & New Construction
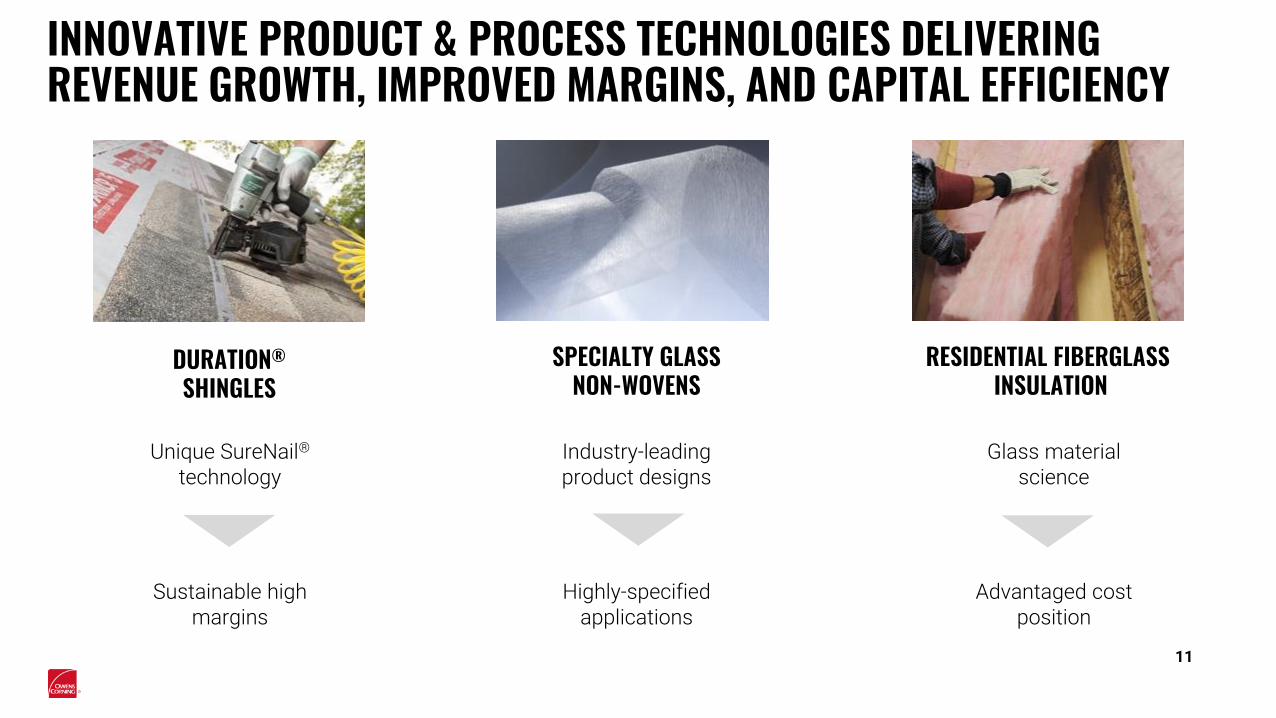
INNOVATIVE PRODUCT & PROCESS TECHNOLOGIES DELIVERING REVENUE GROWTH, IMPROVED MARGINS, AND CAPITAL EFFICIENCY
11
Unique SureNail®
technologyIndustry-leading product designs
Glass material science
Sustainable high margins
Highly-specified applications
Advantaged costposition
DURATION®
SHINGLESSPECIALTY GLASS
NON-WOVENSRESIDENTIAL FIBERGLASS
INSULATION
12
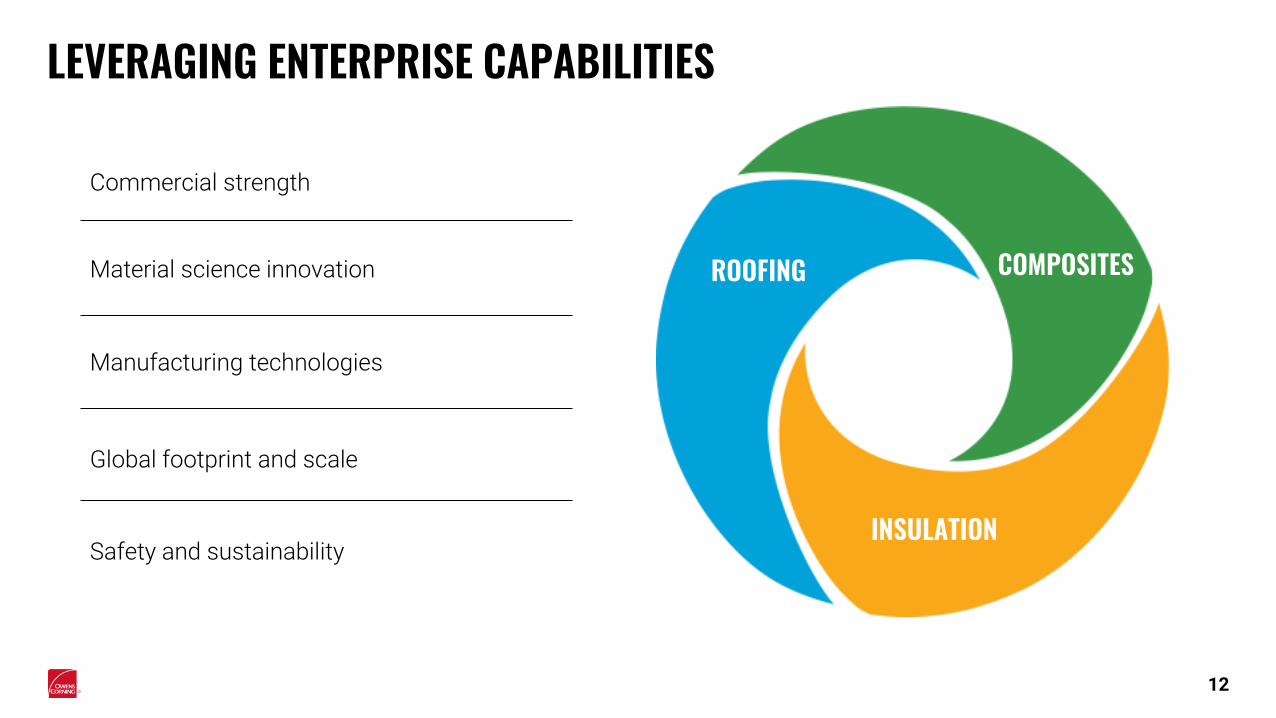
LEVERAGING ENTERPRISE CAPABILITIES
Global footprint and scale
Commercial strength
Material science innovation
Manufacturing technologies
ROOFING
INSULATION
COMPOSITES
Safety and sustainability
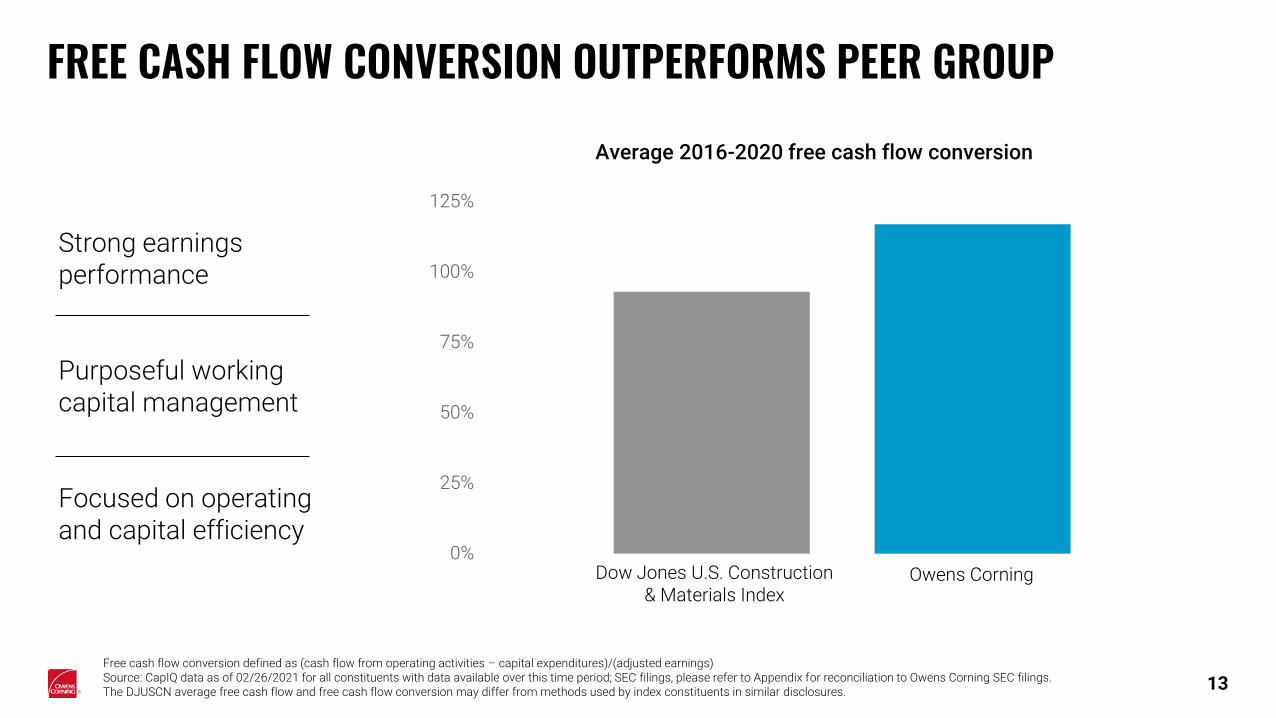
0%
25%
50%
75%
100%
125%
Average 2016-2020 free cash flow conversion
Dow Jones U.S. Construction & Materials Index
FREE CASH FLOW CONVERSION OUTPERFORMS PEER GROUP
Free cash flow conversion defined as (cash flow from operating activities – capital expenditures)/(adjusted earnings)Source: CapIQ data as of 02/26/2021 for all constituents with data available over this time period; SEC filings, please refer to Appendix for reconciliation to Owens Corning SEC filings. The DJUSCN average free cash flow and free cash flow conversion may differ from methods used by index constituents in similar disclosures.
Owens Corning
13
Strong earnings performance
Purposeful working capital management
Focused on operating and capital efficiency
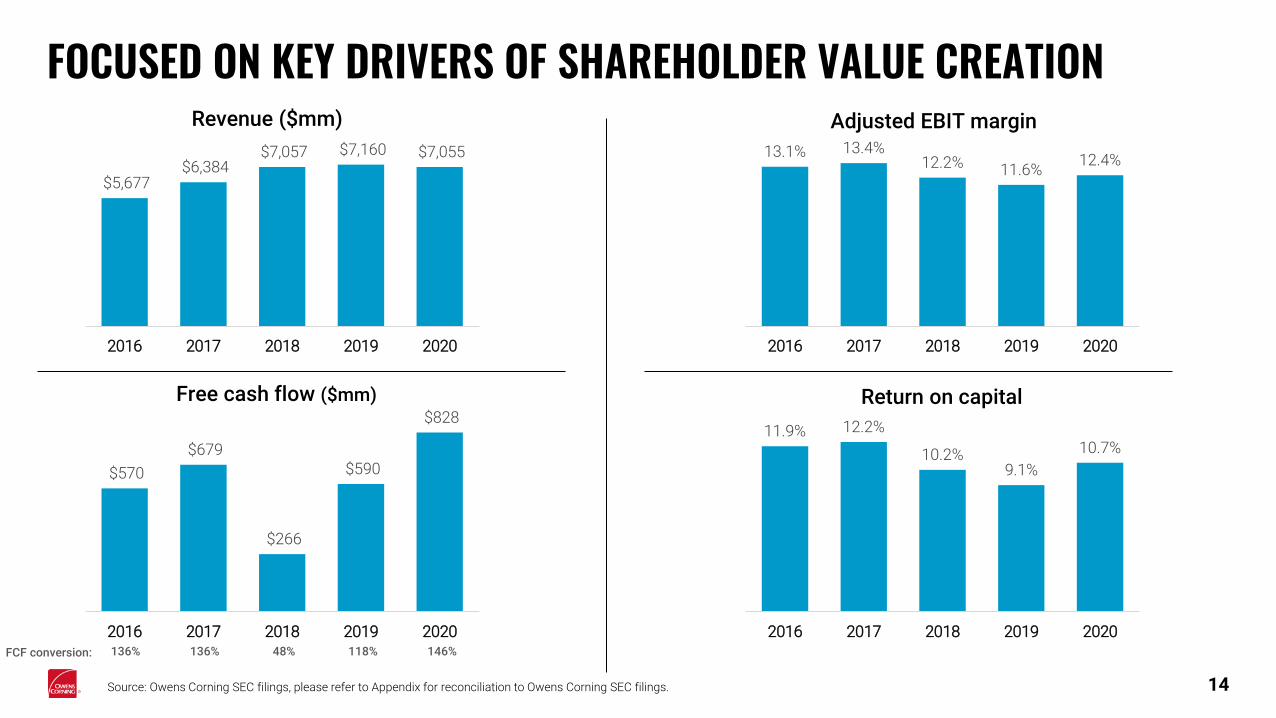
FOCUSED ON KEY DRIVERS OF SHAREHOLDER VALUE CREATION
Source: Owens Corning SEC filings, please refer to Appendix for reconciliation to Owens Corning SEC filings.
Return on capital
Adjusted EBIT marginRevenue ($mm)
14
Free cash flow ($mm)
FCF conversion:
$5,677 $6,384
$7,057 $7,160 $7,055
2016 2017 2018 2019 2020
13.1% 13.4%12.2% 11.6%
12.4%
2016 2017 2018 2019 2020
$570
$679
$266
$590
$828
2016 2017 2018 2019 2020
11.9% 12.2%
10.2%9.1%
10.7%
2016 2017 2018 2019 2020136% 136% 48% 118% 146%
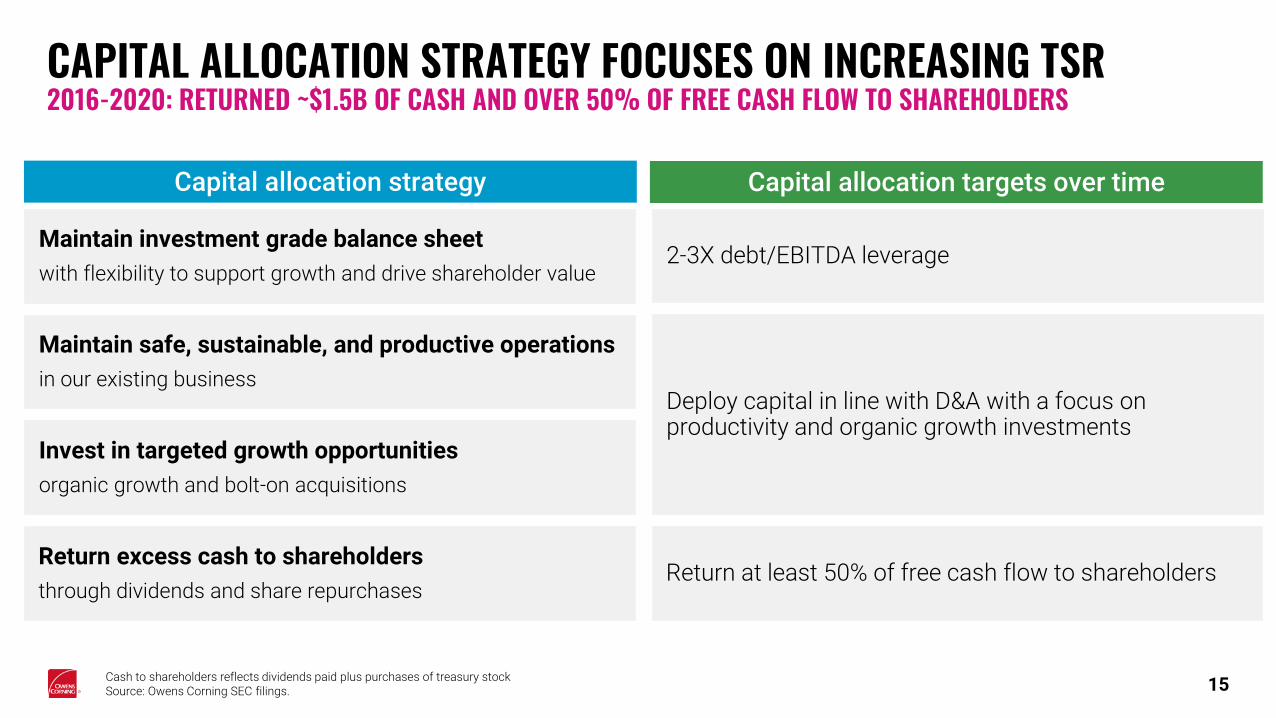
CAPITAL ALLOCATION STRATEGY FOCUSES ON INCREASING TSR2016-2020: RETURNED ~$1.5B OF CASH AND OVER 50% OF FREE CASH FLOW TO SHAREHOLDERS
Cash to shareholders reflects dividends paid plus purchases of treasury stock Source: Owens Corning SEC filings. 15
Maintain investment grade balance sheet
with flexibility to support growth and drive shareholder value
Maintain safe, sustainable, and productive operations
in our existing business
Invest in targeted growth opportunities
organic growth and bolt-on acquisitions
Capital allocation strategy Capital allocation targets over time
Return excess cash to shareholders
through dividends and share repurchases
2-3X debt/EBITDA leverage
Deploy capital in line with D&A with a focus on productivity and organic growth investments
Return at least 50% of free cash flow to shareholders
ESG AT OWENS CORNING
16
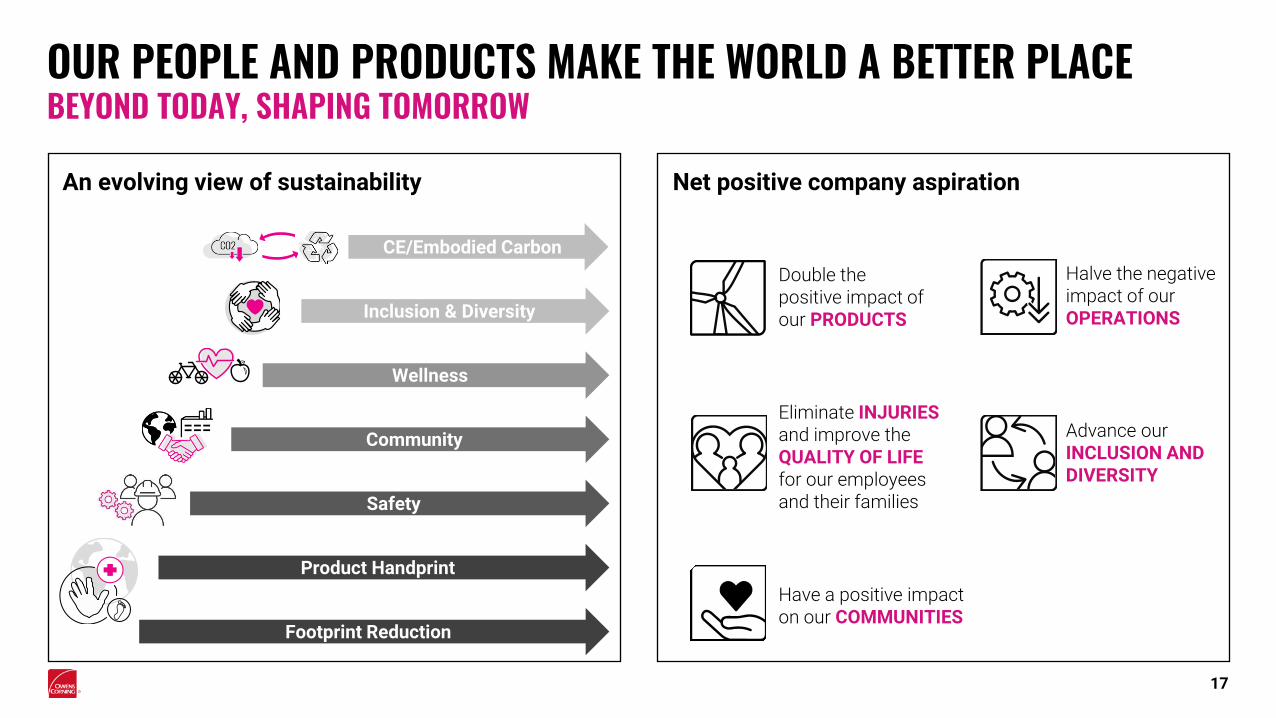
OUR PEOPLE AND PRODUCTS MAKE THE WORLD A BETTER PLACE
17
BEYOND TODAY, SHAPING TOMORROW
An evolving view of sustainability
Footprint Reduction
Product Handprint
Safety
Community
Wellness
Inclusion & Diversity
CE/Embodied Carbon
Double the positive impact of our PRODUCTS
Eliminate INJURIES and improve theQUALITY OF LIFE for our employees and their families
Have a positive impacton our COMMUNITIES
Halve the negativeimpact of our OPERATIONS
Advance our INCLUSION ANDDIVERSITY
Net positive company aspiration
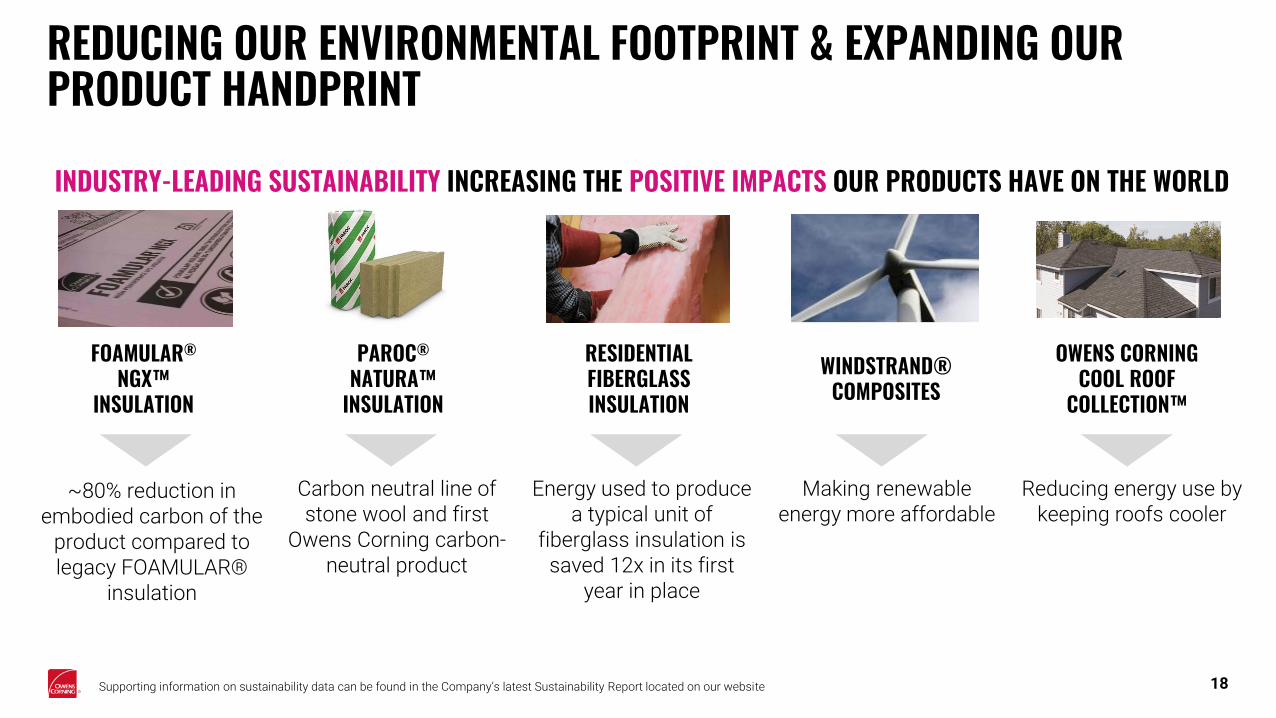
INDUSTRY-LEADING SUSTAINABILITY INCREASING THE POSITIVE IMPACTS OUR PRODUCTS HAVE ON THE WORLD
~80% reduction in embodied carbon of the
product compared to legacy FOAMULAR®
insulation
Carbon neutral line of stone wool and first
Owens Corning carbon-neutral product
Energy used to produce a typical unit of
fiberglass insulation is saved 12x in its first
year in place
Making renewable energy more affordable
Reducing energy use by keeping roofs cooler
REDUCING OUR ENVIRONMENTAL FOOTPRINT & EXPANDING OUR PRODUCT HANDPRINT
18
PAROC®
NATURA™ INSULATION
FOAMULAR®
NGX™ INSULATION
WINDSTRAND® COMPOSITES
RESIDENTIAL FIBERGLASS INSULATION
OWENS CORNING COOL ROOF
COLLECTION™
Supporting information on sustainability data can be found in the Company’s latest Sustainability Report located on our website
(20)
(50)
(15)
(75)
(70)
(35)
(29)
(53)
(39)
(56)
(27)
(43)
(20)
(50)
(80)
(70)
(60)
(50)
(40)
(30)
(20)
(10)
-
PRIMARYENERGY
GREENHOUSEGASES
PARTICULATEMATTER 2.5
TOXIC AIREMMISSIONS
WASTE-TO-LANDFILL WATER
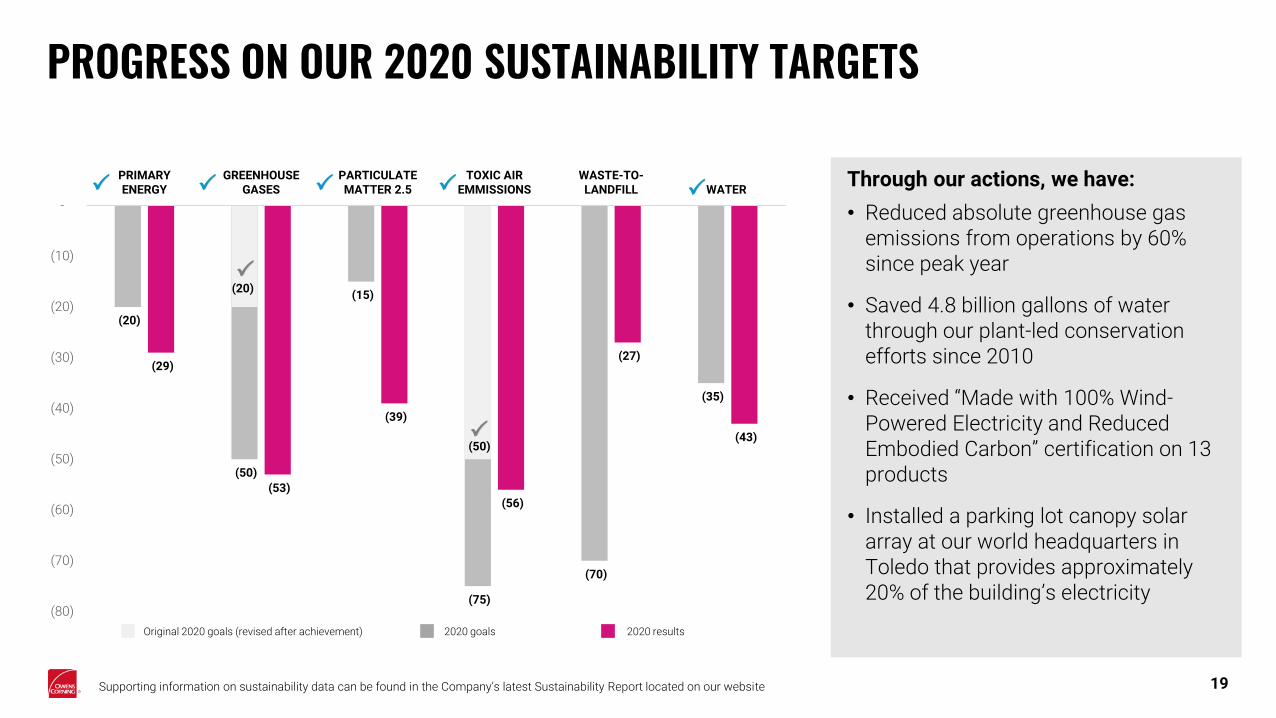
PROGRESS ON OUR 2020 SUSTAINABILITY TARGETS
19
Through our actions, we have:
• Reduced absolute greenhouse gas emissions from operations by 60% since peak year
• Saved 4.8 billion gallons of water through our plant-led conservation efforts since 2010
• Received “Made with 100% Wind-Powered Electricity and Reduced Embodied Carbon” certification on 13 products
• Installed a parking lot canopy solar array at our world headquarters in Toledo that provides approximately 20% of the building’s electricity
Original 2020 goals (revised after achievement) 2020 goals 2020 results
Supporting information on sustainability data can be found in the Company’s latest Sustainability Report located on our website
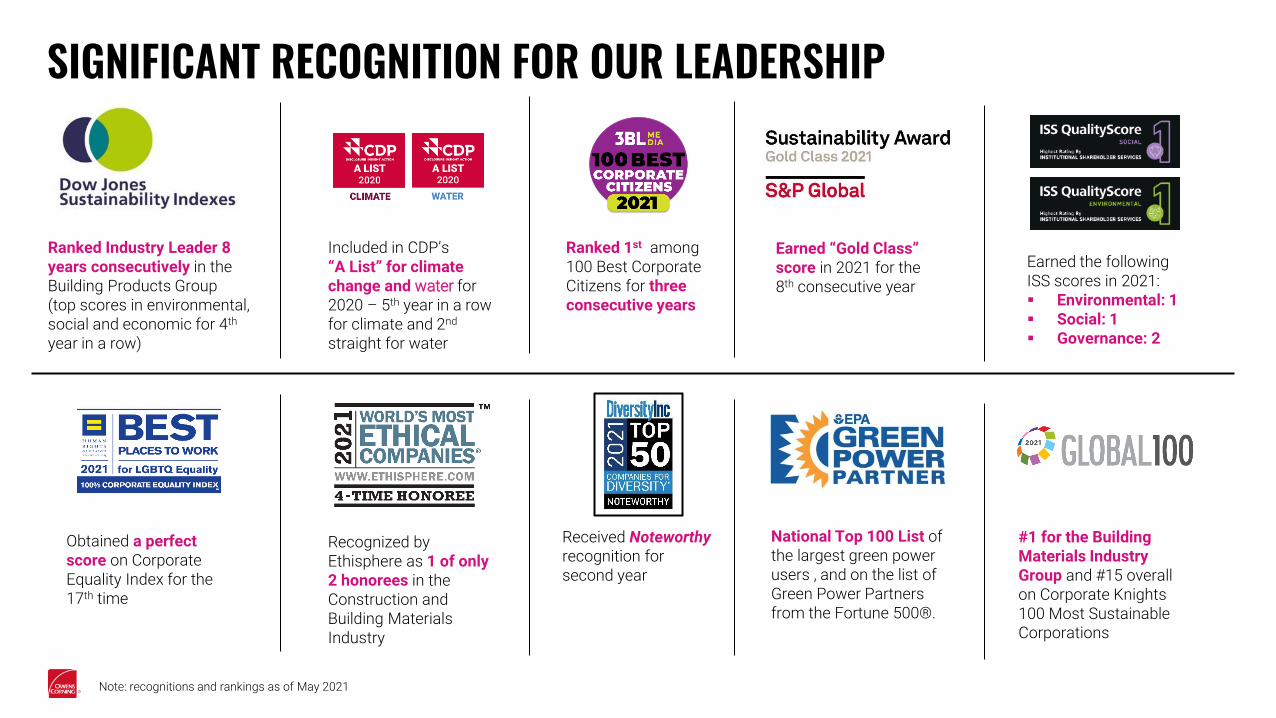
SIGNIFICANT RECOGNITION FOR OUR LEADERSHIP
Ranked Industry Leader 8 years consecutively in the Building Products Group (top scores in environmental, social and economic for 4th
year in a row)
Earned “Gold Class” score in 2021 for the 8th consecutive year
Ranked 1st among 100 Best Corporate Citizens for three consecutive years
Included in CDP’s“A List” for climate change and water for 2020 – 5th year in a row for climate and 2nd
straight for water
Earned the following ISS scores in 2021:▪ Environmental: 1▪ Social: 1 ▪ Governance: 2
Note: recognitions and rankings as of May 2021
Obtained a perfect score on Corporate Equality Index for the 17th time
Recognized by Ethisphere as 1 of only 2 honorees in the Construction and Building Materials Industry
Received Noteworthy recognition for second year
#1 for the Building Materials Industry Group and #15 overall on Corporate Knights 100 Most Sustainable Corporations
National Top 100 List of the largest green power users , and on the list of Green Power Partners from the Fortune 500®.
THREE STRONG BUSINESSES
22
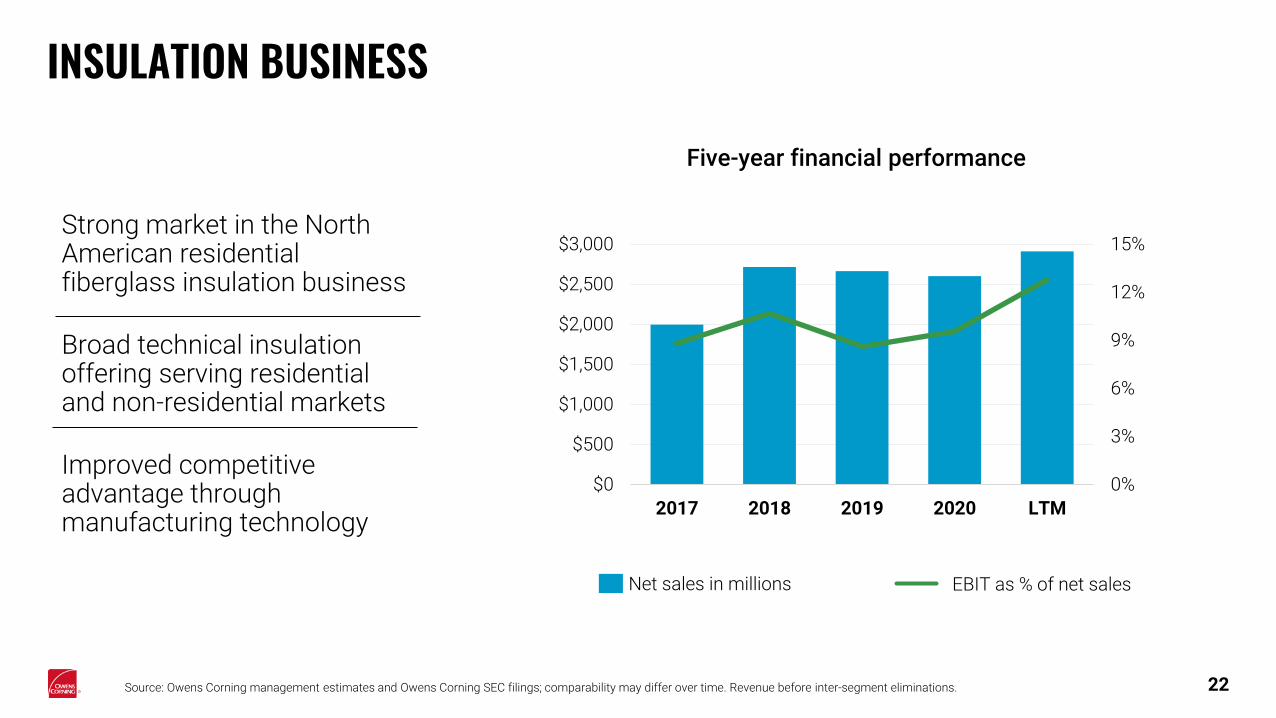
INSULATION BUSINESS
Source: Owens Corning management estimates and Owens Corning SEC filings; comparability may differ over time. Revenue before inter-segment eliminations.
Five-year financial performance
EBIT as % of net salesNet sales in millions
Strong market in the North American residential fiberglass insulation business
Broad technical insulation offering serving residential and non-residential markets
Improved competitive advantage through manufacturing technology
0%
3%
6%
9%
12%
15%
$0
$500
$1,000
$1,500
$2,000
$2,500
$3,000
2017 2018 2019 2020 LTM
(100)
0
100
200
300
400
2006(Peak)
2020
$m
m
North American residential fiberglass insulation
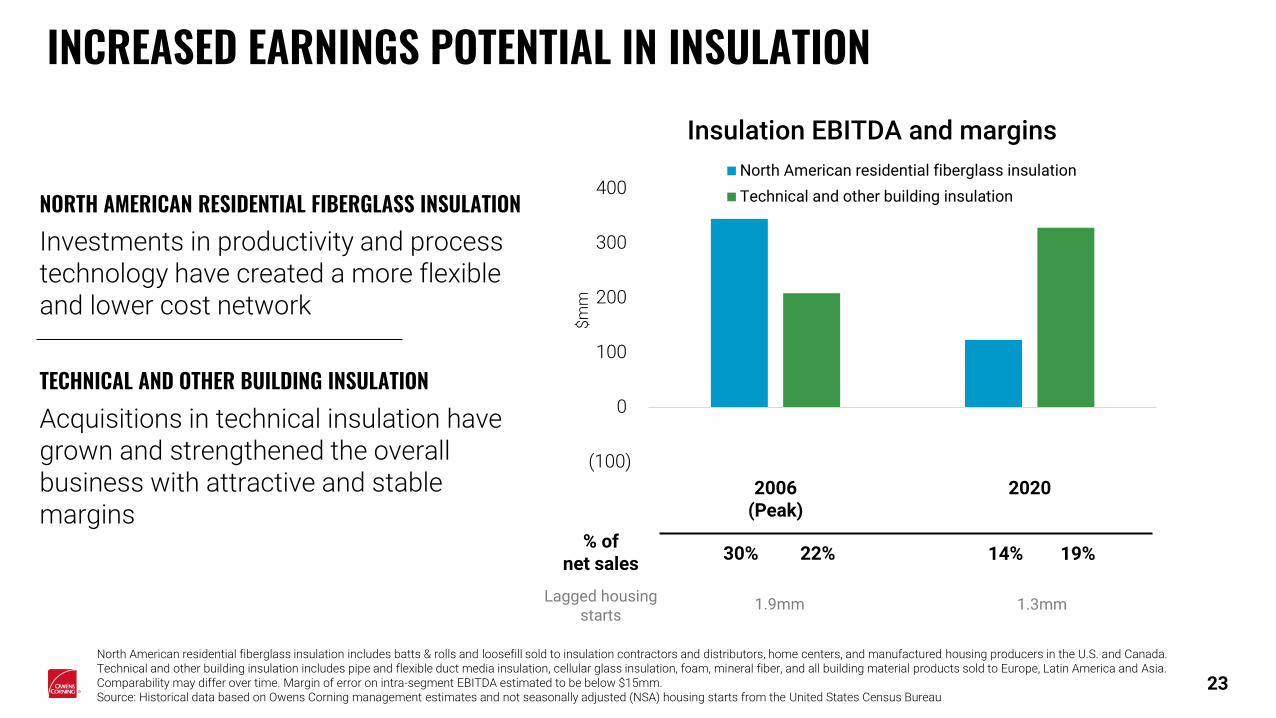
Technical and other building insulationNORTH AMERICAN RESIDENTIAL FIBERGLASS INSULATIONInvestments in productivity and process technology have created a more flexible and lower cost network
TECHNICAL AND OTHER BUILDING INSULATIONAcquisitions in technical insulation have grown and strengthened the overall business with attractive and stable margins
North American residential fiberglass insulation includes batts & rolls and loosefill sold to insulation contractors and distributors, home centers, and manufactured housing producers in the U.S. and Canada. Technical and other building insulation includes pipe and flexible duct media insulation, cellular glass insulation, foam, mineral fiber, and all building material products sold to Europe, Latin America and Asia. Comparability may differ over time. Margin of error on intra-segment EBITDA estimated to be below $15mm. Source: Historical data based on Owens Corning management estimates and not seasonally adjusted (NSA) housing starts from the United States Census Bureau
Insulation EBITDA and margins
% of net sales
30% 22%
23
14% 19%
INCREASED EARNINGS POTENTIAL IN INSULATION
Lagged housing starts
1.9mm 1.3mm
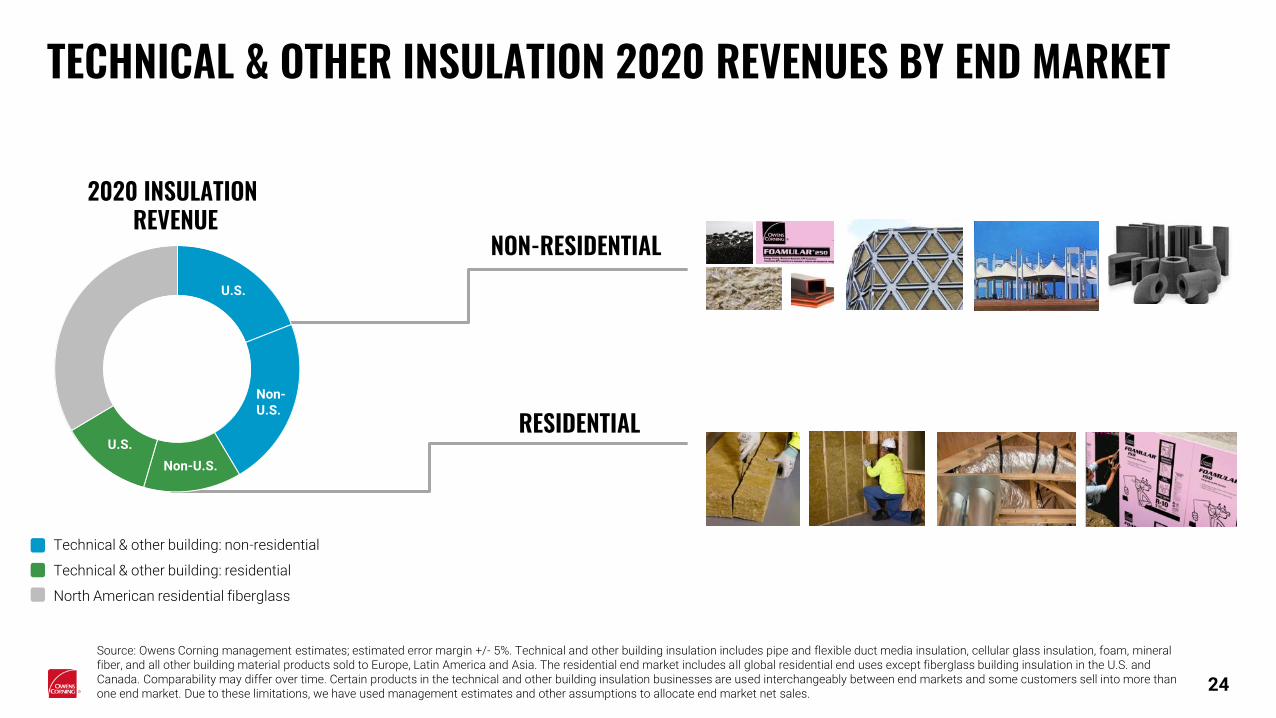
TECHNICAL & OTHER INSULATION 2020 REVENUES BY END MARKET
24
Source: Owens Corning management estimates; estimated error margin +/- 5%. Technical and other building insulation includes pipe and flexible duct media insulation, cellular glass insulation, foam, mineral fiber, and all other building material products sold to Europe, Latin America and Asia. The residential end market includes all global residential end uses except fiberglass building insulation in the U.S. and Canada. Comparability may differ over time. Certain products in the technical and other building insulation businesses are used interchangeably between end markets and some customers sell into more than one end market. Due to these limitations, we have used management estimates and other assumptions to allocate end market net sales.
NON-RESIDENTIAL
RESIDENTIAL
Technical & other building: non-residential
Technical & other building: residential
North American residential fiberglass
2020 INSULATION REVENUE
U.S.
U.S.
Non-U.S.
Non-U.S.
25
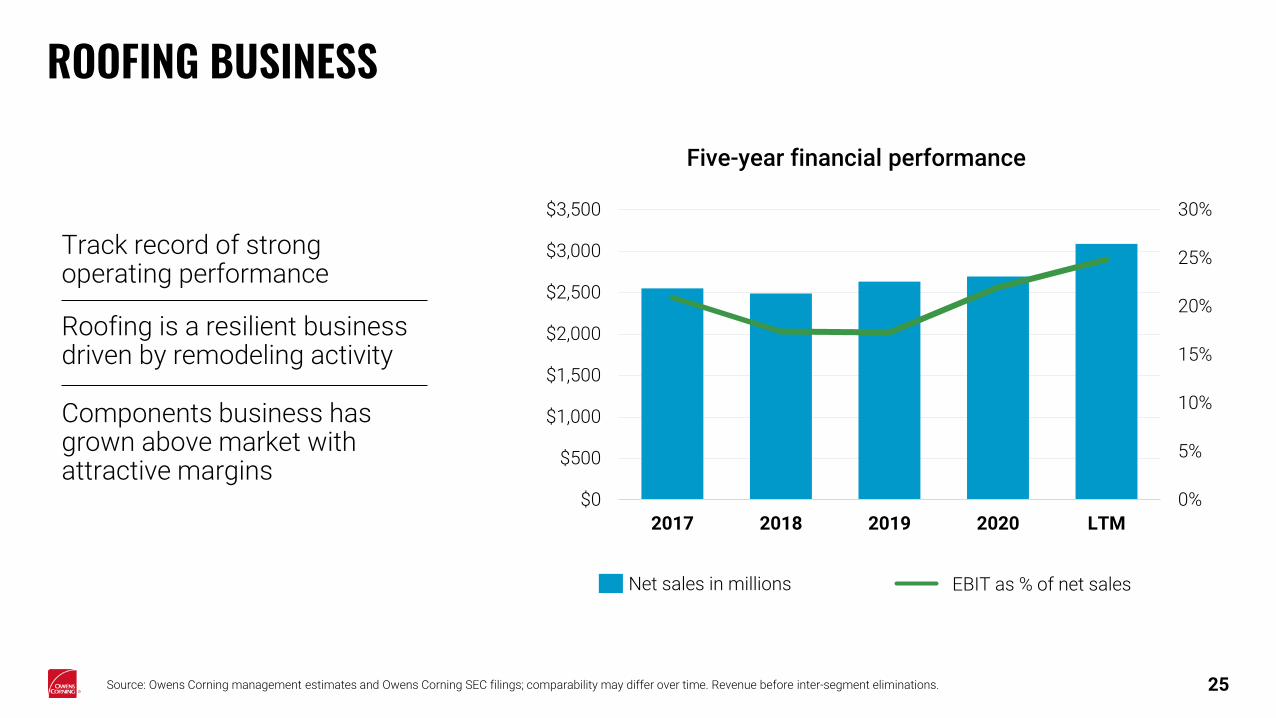
ROOFING BUSINESS
Source: Owens Corning management estimates and Owens Corning SEC filings; comparability may differ over time. Revenue before inter-segment eliminations.
EBIT as % of net salesNet sales in millions
Track record of strong operating performance
Roofing is a resilient business driven by remodeling activity
Components business has grown above market with attractive margins
Five-year financial performance
0%
5%
10%
15%
20%
25%
30%
$0
$500
$1,000
$1,500
$2,000
$2,500
$3,000
$3,500
2017 2018 2019 2020 LTM
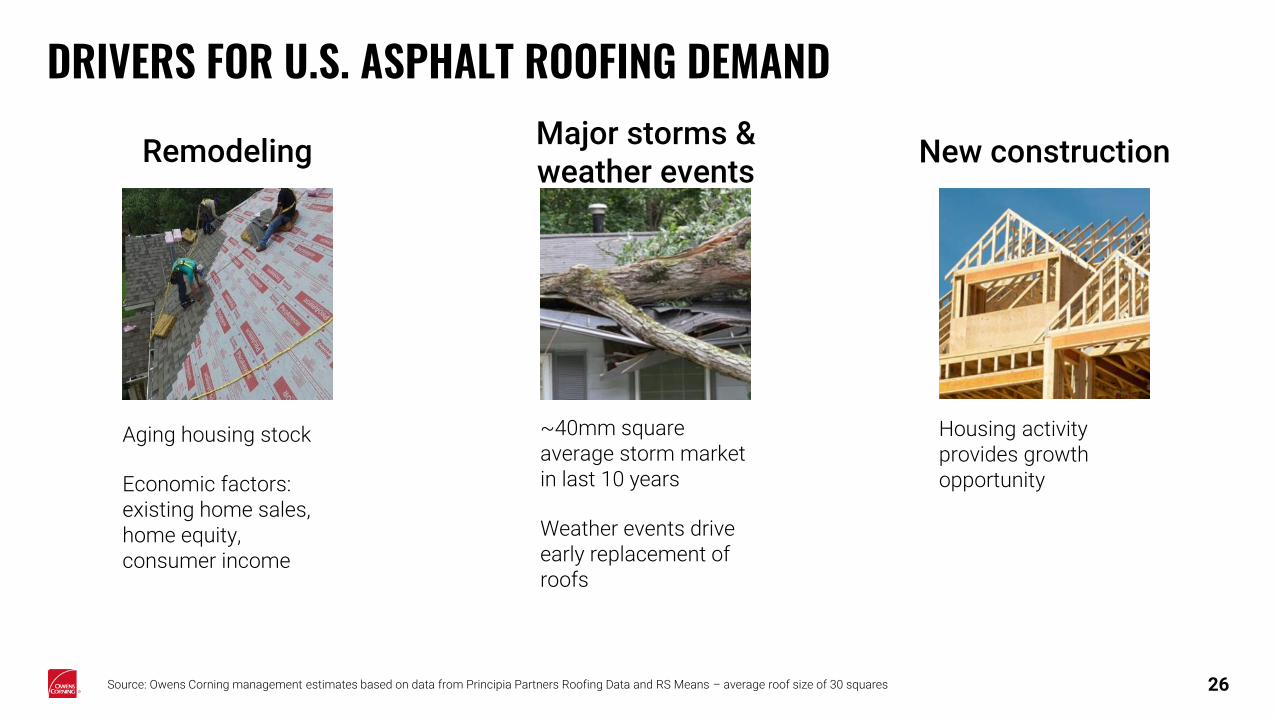
DRIVERS FOR U.S. ASPHALT ROOFING DEMAND
Housing activity provides growth opportunity
Aging housing stock
Economic factors: existing home sales, home equity, consumer income
~40mm square average storm market in last 10 years
Weather events drive early replacement of roofs
Source: Owens Corning management estimates based on data from Principia Partners Roofing Data and RS Means – average roof size of 30 squares 26
Remodeling New constructionMajor storms & weather events
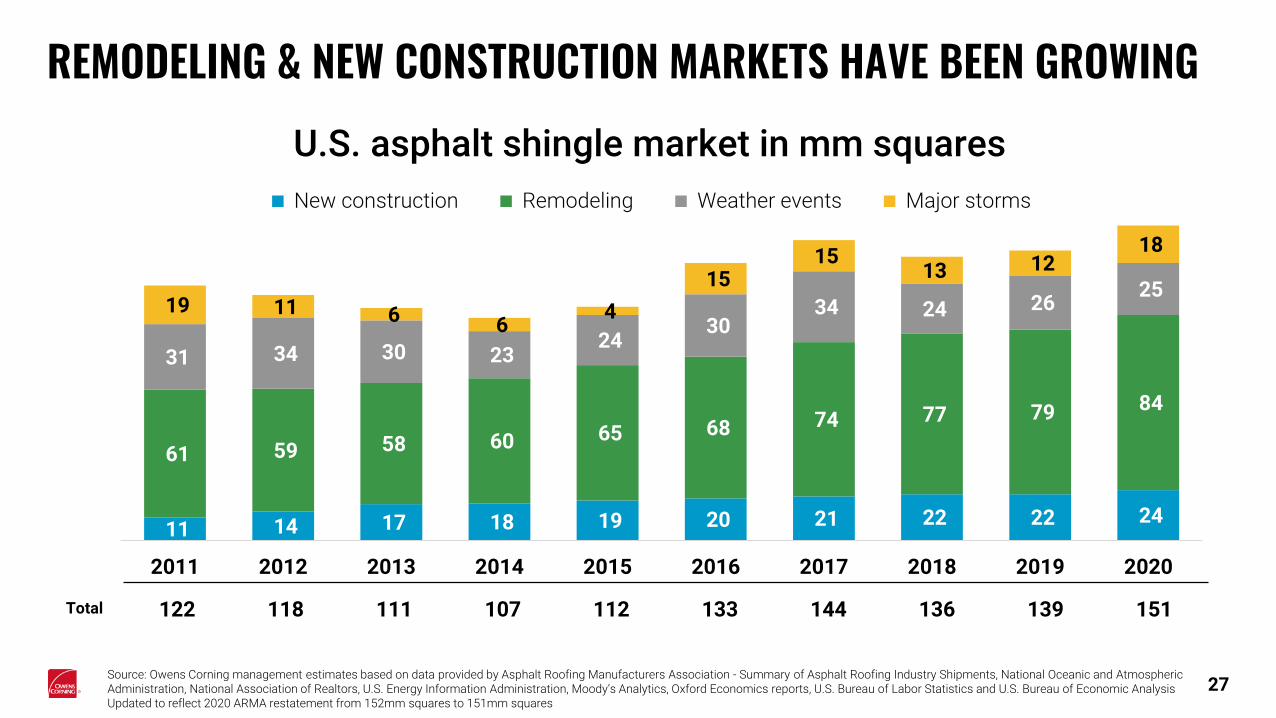
REMODELING & NEW CONSTRUCTION MARKETS HAVE BEEN GROWINGU.S. asphalt shingle market in mm squares
Total 122 118 111 107 112 133 144 136 139 151
Source: Owens Corning management estimates based on data provided by Asphalt Roofing Manufacturers Association - Summary of Asphalt Roofing Industry Shipments, National Oceanic and Atmospheric Administration, National Association of Realtors, U.S. Energy Information Administration, Moody’s Analytics, Oxford Economics reports, U.S. Bureau of Labor Statistics and U.S. Bureau of Economic AnalysisUpdated to reflect 2020 ARMA restatement from 152mm squares to 151mm squares
27
11 14 17 18 19 20 21 22 22 24
61 59 58 60 65 68 74 77 79 84
31 34 30 23 24
30 34 24 26
25 19 11 6 6
4
15 15
13 12 18
2011 2012 2013 2014 2015 2016 2017 2018 2019 2020
New construction Remodeling Weather events Major storms
28
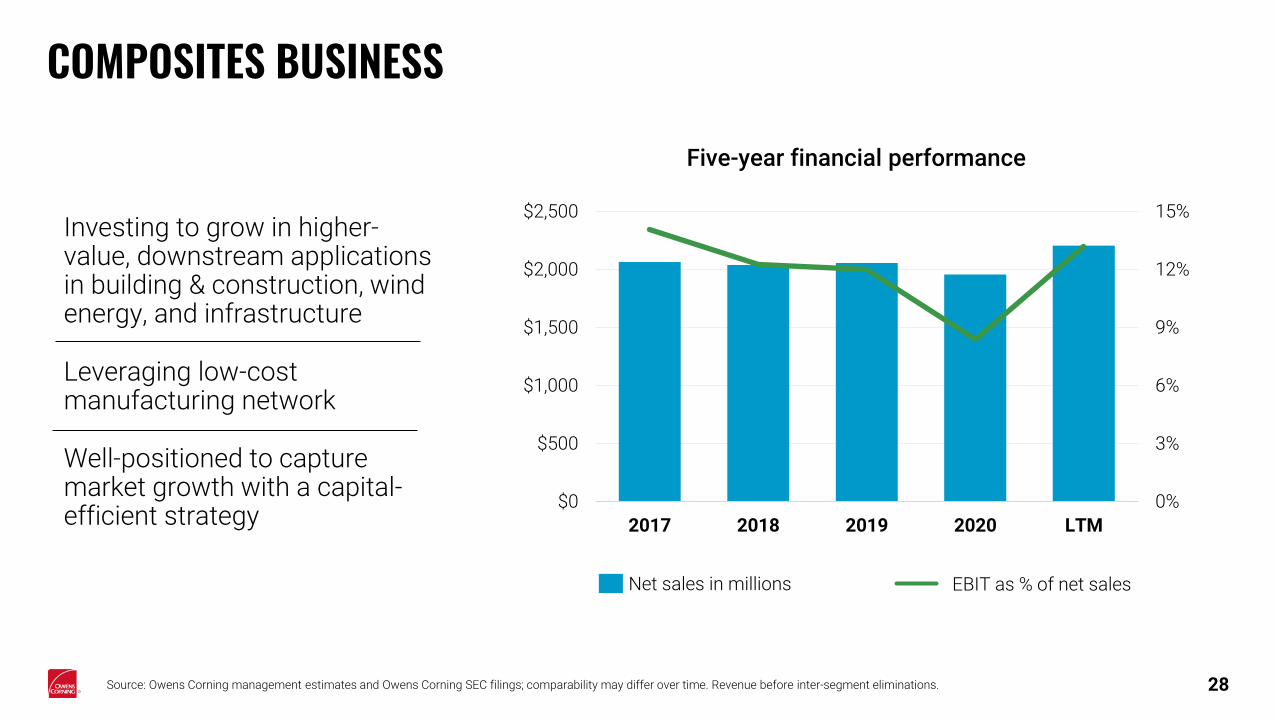
COMPOSITES BUSINESS
EBIT as % of net salesNet sales in millions
Investing to grow in higher-value, downstream applications in building & construction, wind energy, and infrastructure
Leveraging low-cost manufacturing network
Well-positioned to capture market growth with a capital-efficient strategy
Five-year financial performance
0%
3%
6%
9%
12%
15%
$0
$500
$1,000
$1,500
$2,000
$2,500
2017 2018 2019 2020 LTM
Source: Owens Corning management estimates and Owens Corning SEC filings; comparability may differ over time. Revenue before inter-segment eliminations.
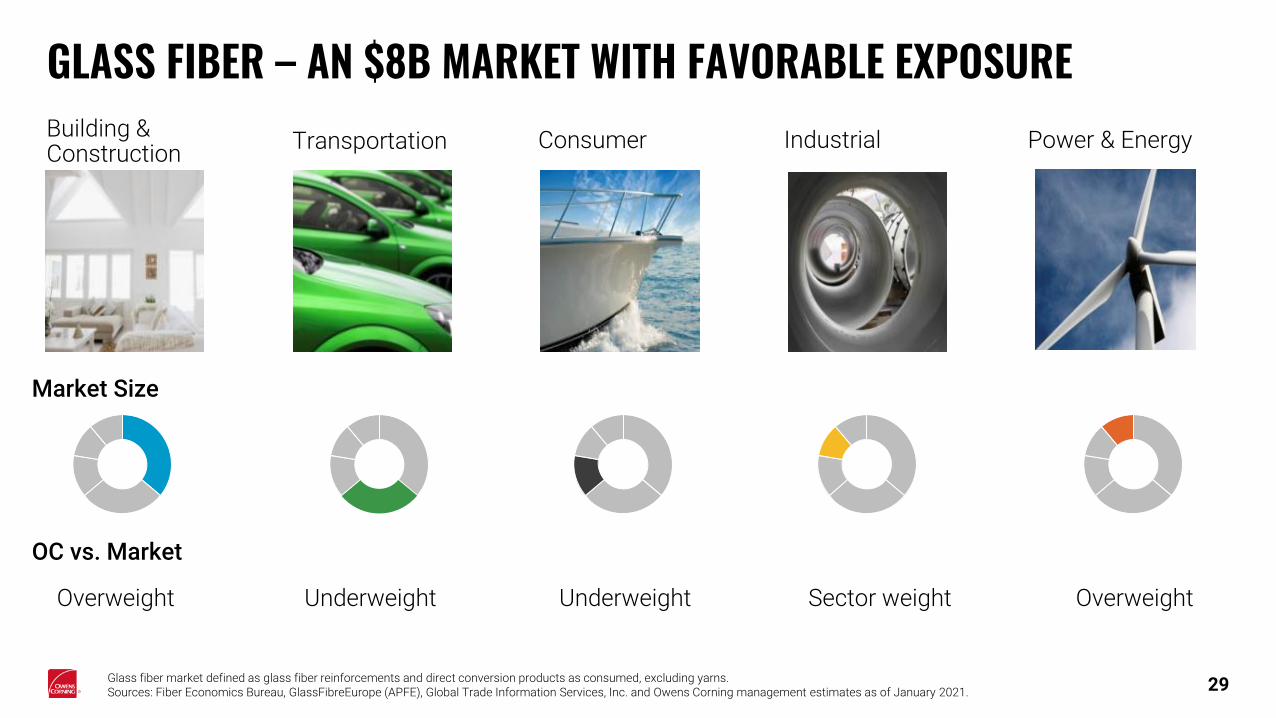
GLASS FIBER – AN $8B MARKET WITH FAVORABLE EXPOSURE
Market Size
Building & Construction
Transportation Consumer Industrial Power & Energy
Glass fiber market defined as glass fiber reinforcements and direct conversion products as consumed, excluding yarns. Sources: Fiber Economics Bureau, GlassFibreEurope (APFE), Global Trade Information Services, Inc. and Owens Corning management estimates as of January 2021. 29
OC vs. Market
Overweight Underweight Underweight Sector weight Overweight
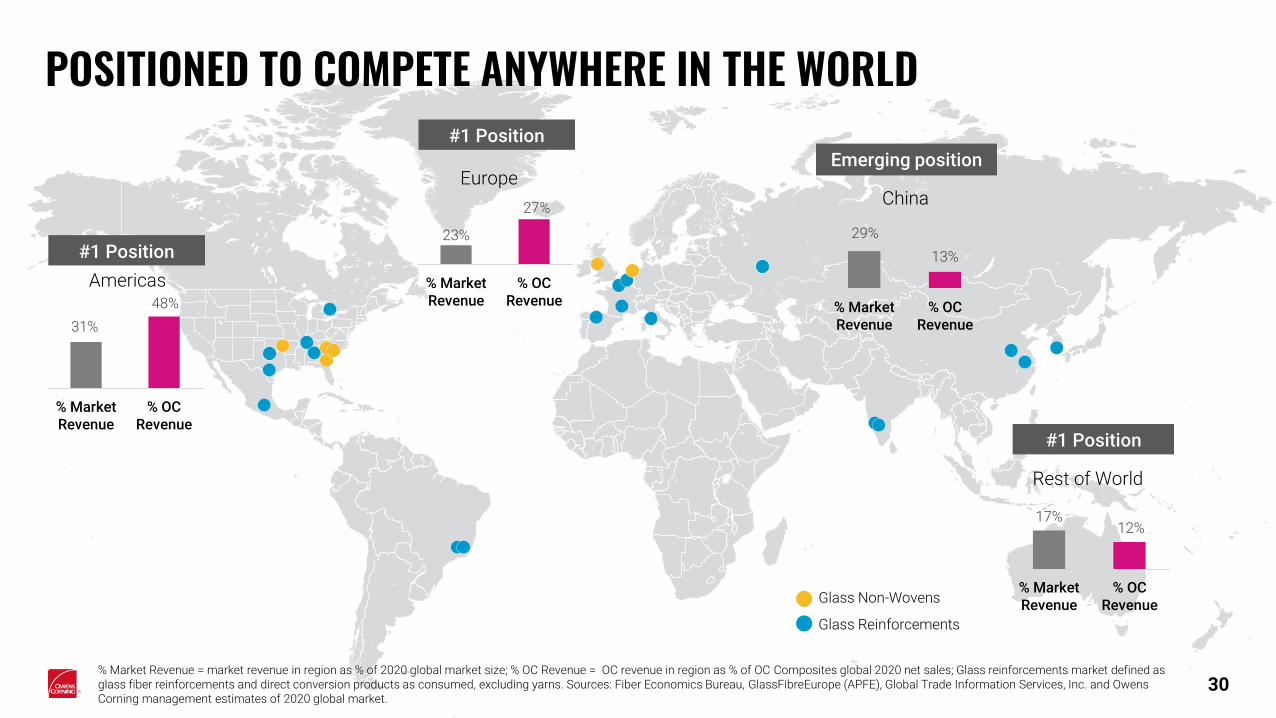
31%
48%
% MarketRevenue
% OCRevenue
Americas
#1 Position
% Market Revenue = market revenue in region as % of 2020 global market size; % OC Revenue = OC revenue in region as % of OC Composites global 2020 net sales; Glass reinforcements market defined as glass fiber reinforcements and direct conversion products as consumed, excluding yarns. Sources: Fiber Economics Bureau, GlassFibreEurope (APFE), Global Trade Information Services, Inc. and Owens Corning management estimates of 2020 global market.
POSITIONED TO COMPETE ANYWHERE IN THE WORLD
Glass Non-Wovens
Glass Reinforcements
30
23%
27%
% MarketRevenue
% OCRevenue
Europe
#1 Position
29%
13%
% MarketRevenue
% OCRevenue
China
Emerging position
17%12%
% MarketRevenue
% OCRevenue
Rest of World
#1 Position

ADDITIONAL FINANCIAL INFORMATION
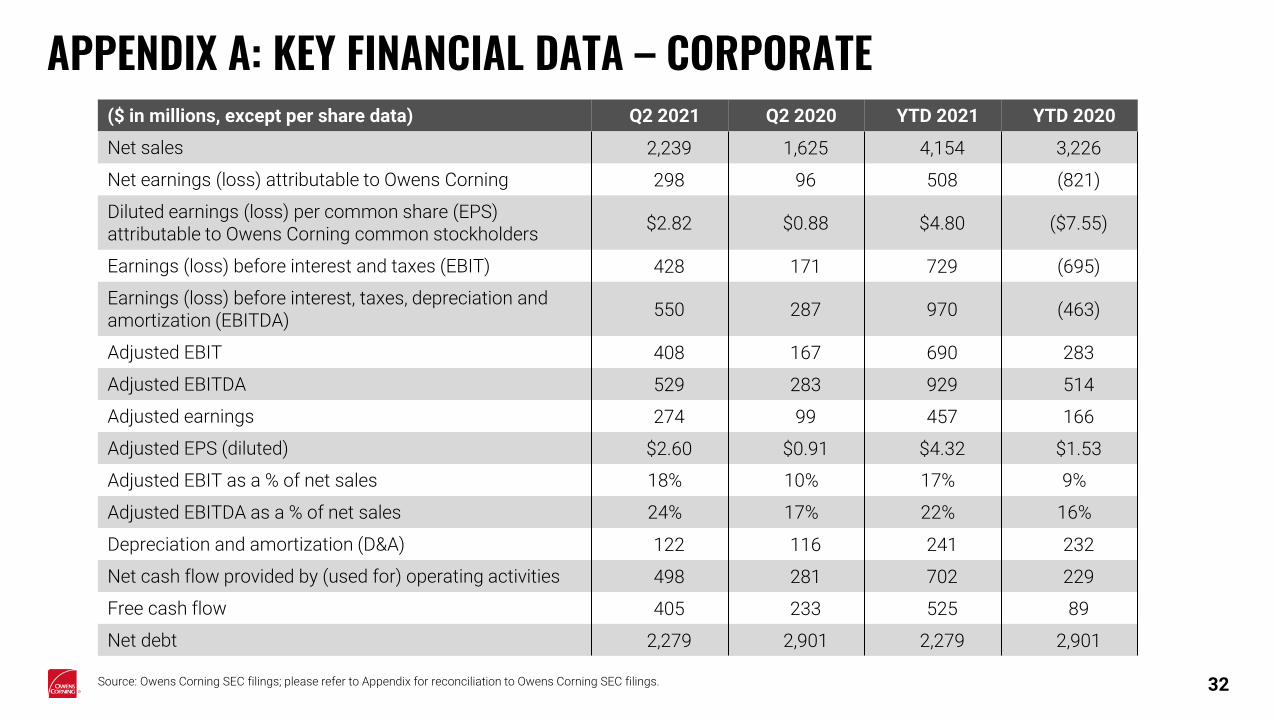
APPENDIX A: KEY FINANCIAL DATA – CORPORATE
Source: Owens Corning SEC filings; please refer to Appendix for reconciliation to Owens Corning SEC filings. 32
($ in millions, except per share data) Q2 2021 Q2 2020 YTD 2021 YTD 2020
Net sales 2,239 1,625 4,154 3,226
Net earnings (loss) attributable to Owens Corning 298 96 508 (821)
Diluted earnings (loss) per common share (EPS) attributable to Owens Corning common stockholders
$2.82 $0.88 $4.80 ($7.55)
Earnings (loss) before interest and taxes (EBIT) 428 171 729 (695)
Earnings (loss) before interest, taxes, depreciation and amortization (EBITDA)
550 287 970 (463)
Adjusted EBIT 408 167 690 283
Adjusted EBITDA 529 283 929 514
Adjusted earnings 274 99 457 166
Adjusted EPS (diluted) $2.60 $0.91 $4.32 $1.53
Adjusted EBIT as a % of net sales 18% 10% 17% 9%
Adjusted EBITDA as a % of net sales 24% 17% 22% 16%
Depreciation and amortization (D&A) 122 116 241 232
Net cash flow provided by (used for) operating activities 498 281 702 229
Free cash flow 405 233 525 89
Net debt 2,279 2,901 2,279 2,901
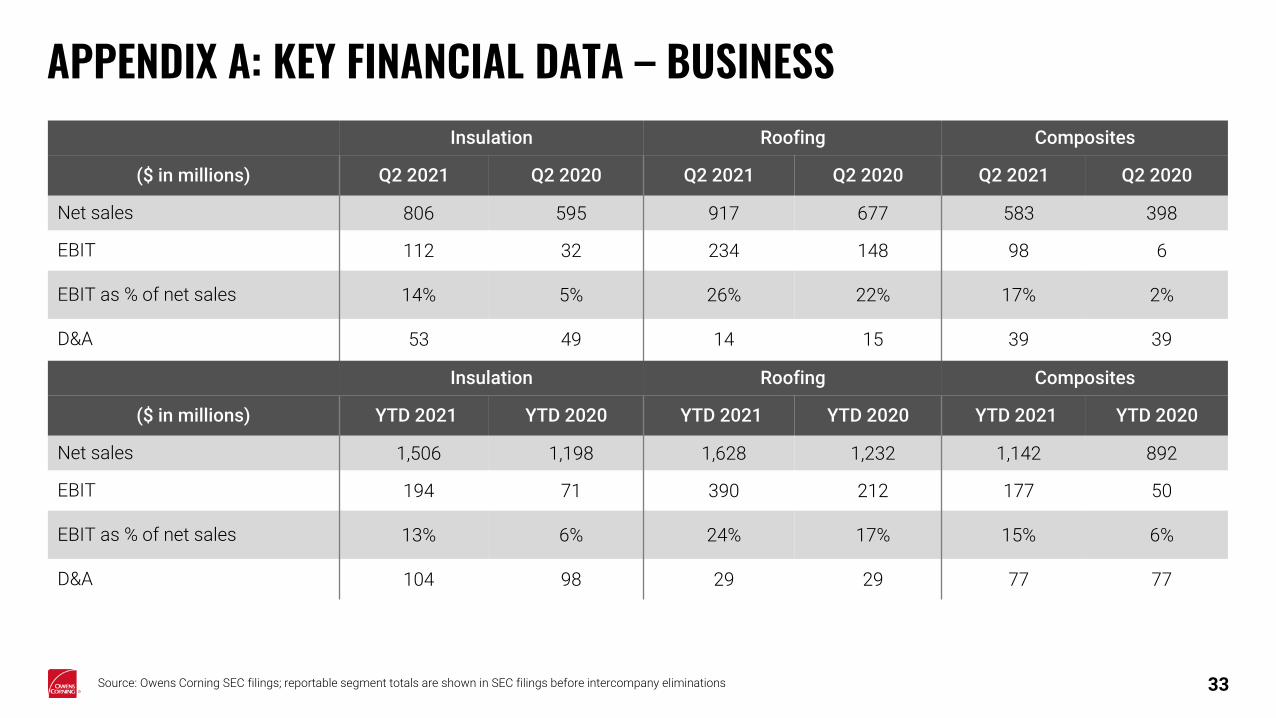
APPENDIX A: KEY FINANCIAL DATA – BUSINESS
Source: Owens Corning SEC filings; reportable segment totals are shown in SEC filings before intercompany eliminations
Insulation Roofing Composites
($ in millions) Q2 2021 Q2 2020 Q2 2021 Q2 2020 Q2 2021 Q2 2020
Net sales 806 595 917 677 583 398
EBIT 112 32 234 148 98 6
EBIT as % of net sales 14% 5% 26% 22% 17% 2%
D&A 53 49 14 15 39 39
33
Insulation Roofing Composites
($ in millions) YTD 2021 YTD 2020 YTD 2021 YTD 2020 YTD 2021 YTD 2020
Net sales 1,506 1,198 1,628 1,232 1,142 892
EBIT 194 71 390 212 177 50
EBIT as % of net sales 13% 6% 24% 17% 15% 6%
D&A 104 98 29 29 77 77
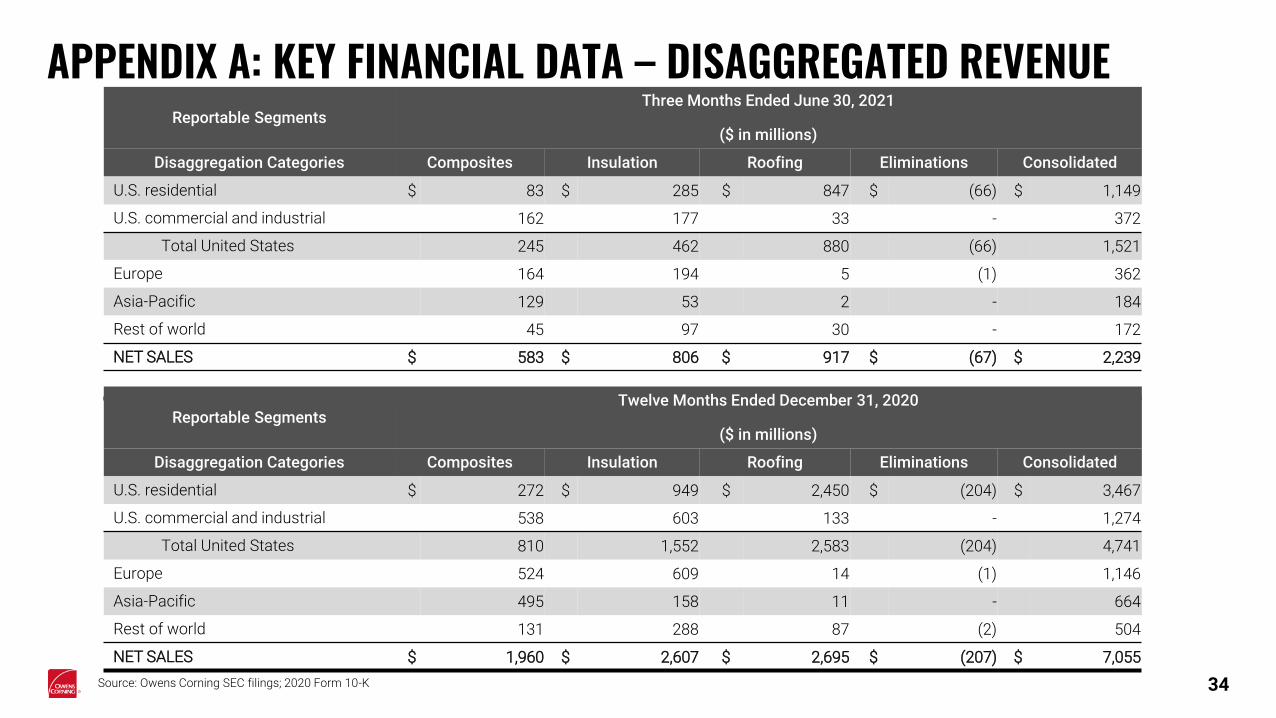
APPENDIX A: KEY FINANCIAL DATA – DISAGGREGATED REVENUE
Source: Owens Corning SEC filings; 2020 Form 10-K
Reportable SegmentsThree Months Ended June 30, 2021
($ in millions)
Disaggregation Categories Composites Insulation Roofing Eliminations Consolidated
U.S. residential $ 83 $ 285 $ 847 $ (66) $ 1,149
U.S. commercial and industrial 162 177 33 - 372
Total United States 245 462 880 (66) 1,521
Europe 164 194 5 (1) 362
Asia-Pacific 129 53 2 - 184
Rest of world 45 97 30 - 172
NET SALES $ 583 $ 806 $ 917 $ (67) $ 2,239
34
Reportable SegmentsTwelve Months Ended December 31, 2020
($ in millions)
Disaggregation Categories Composites Insulation Roofing Eliminations Consolidated
U.S. residential $ 272 $ 949 $ 2,450 $ (204) $ 3,467
U.S. commercial and industrial 538 603 133 - 1,274
Total United States 810 1,552 2,583 (204) 4,741
Europe 524 609 14 (1) 1,146
Asia-Pacific 495 158 11 - 664
Rest of world 131 288 87 (2) 504
NET SALES $ 1,960 $ 2,607 $ 2,695 $ (207) $ 7,055
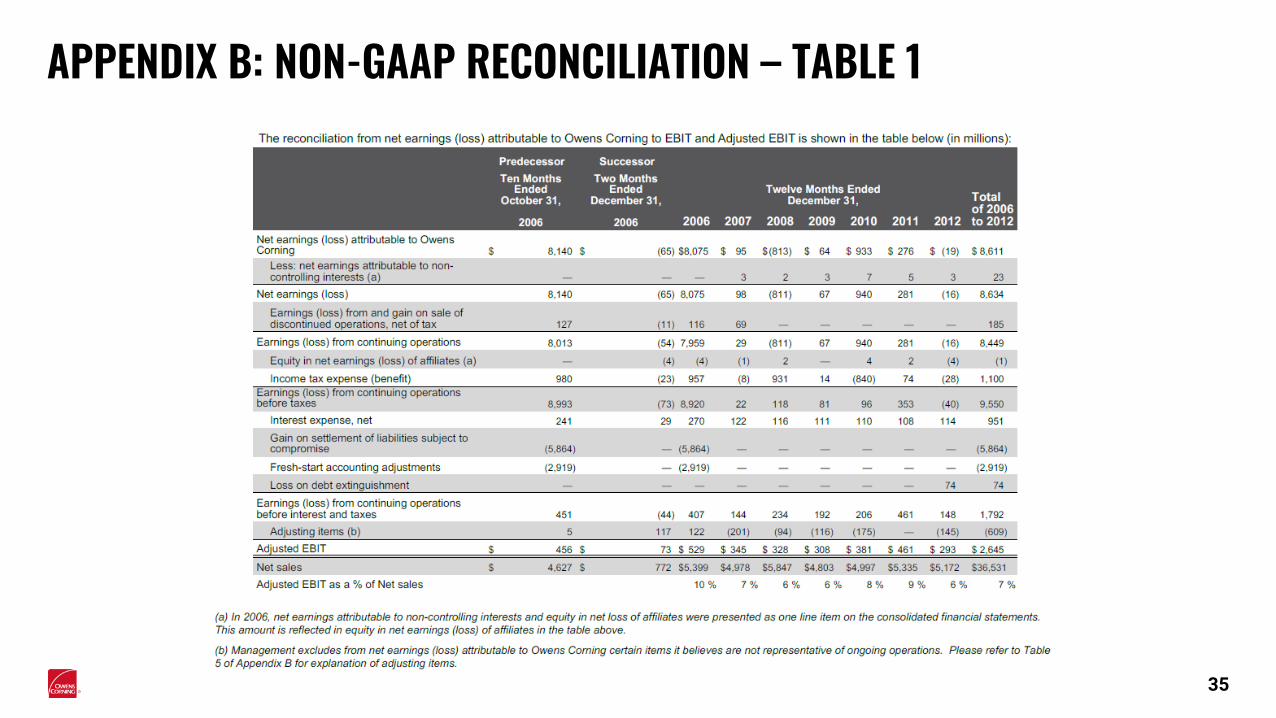
APPENDIX B: NON-GAAP RECONCILIATION – TABLE 1
35

APPENDIX B: NON-GAAP RECONCILIATION – TABLE 2
36
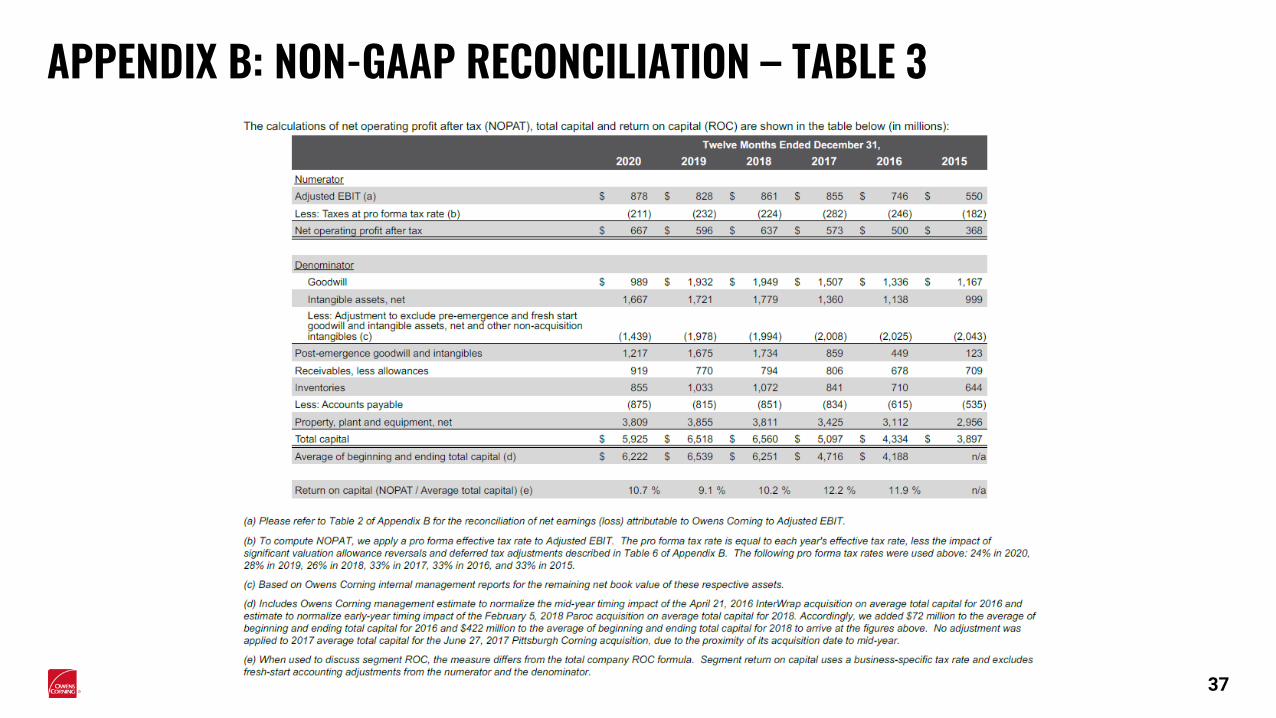
APPENDIX B: NON-GAAP RECONCILIATION – TABLE 3
37
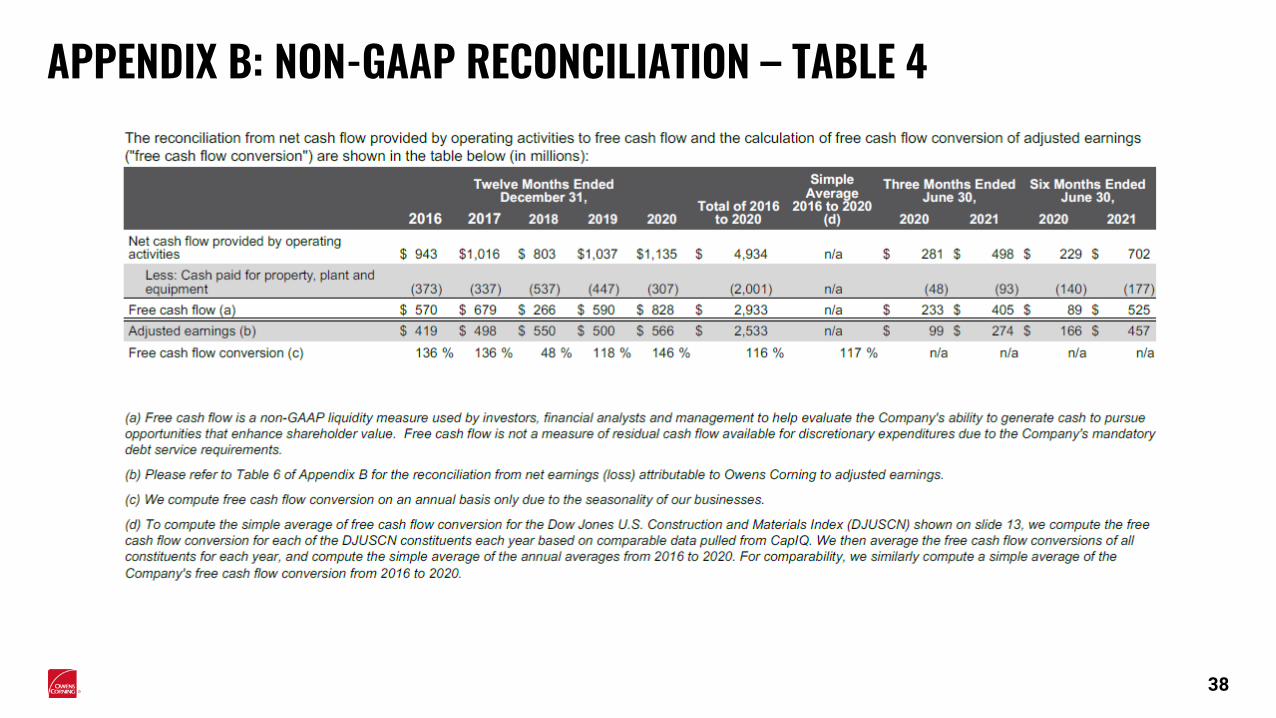
APPENDIX B: NON-GAAP RECONCILIATION – TABLE 4
38
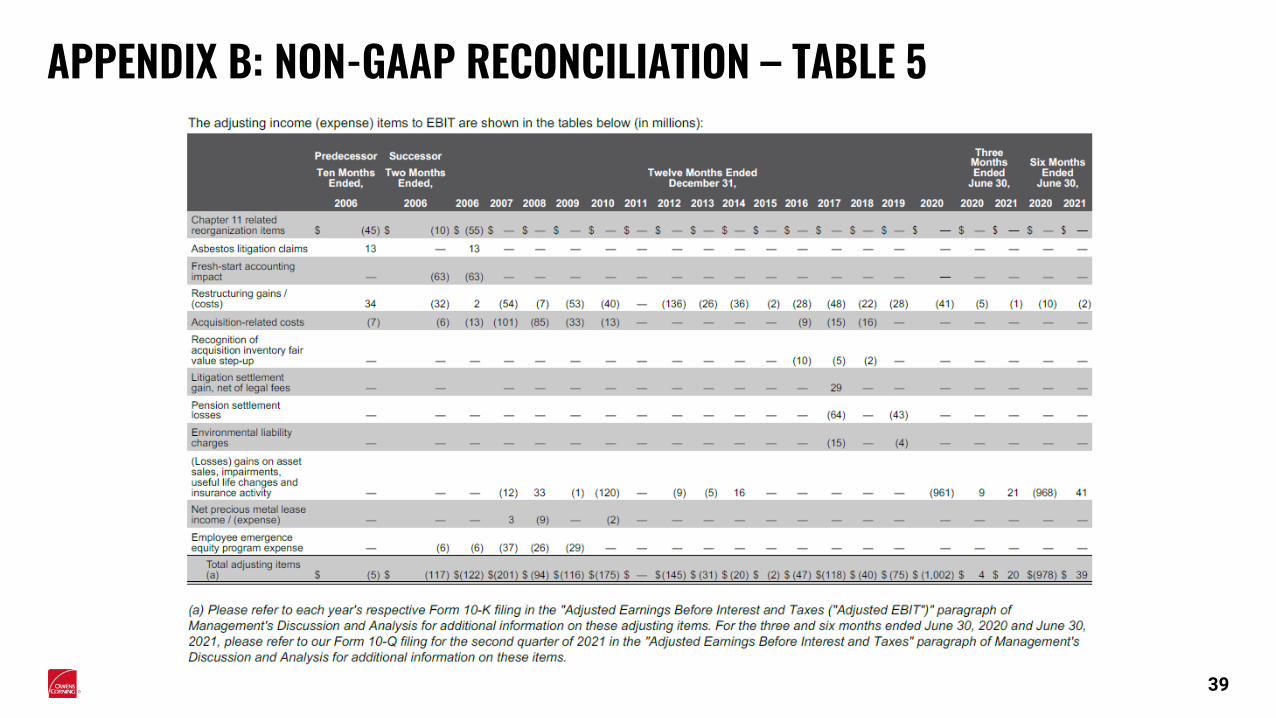
APPENDIX B: NON-GAAP RECONCILIATION – TABLE 5
39
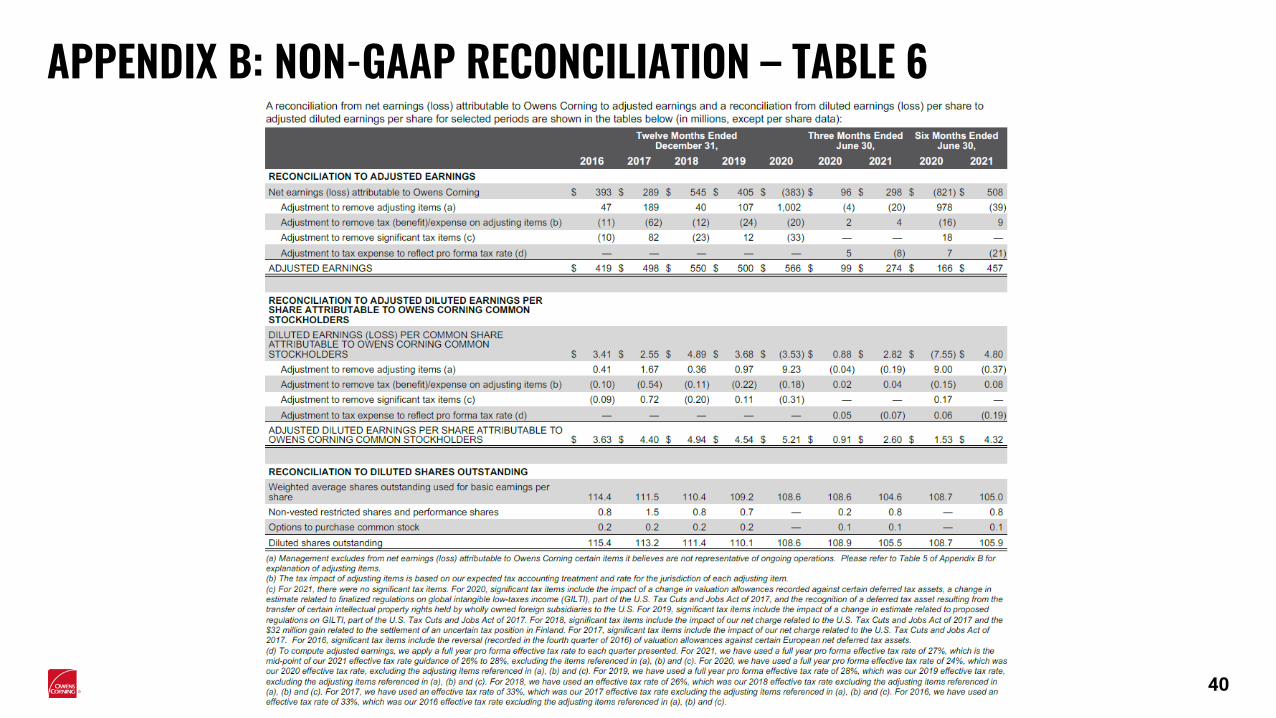
APPENDIX B: NON-GAAP RECONCILIATION – TABLE 6
40
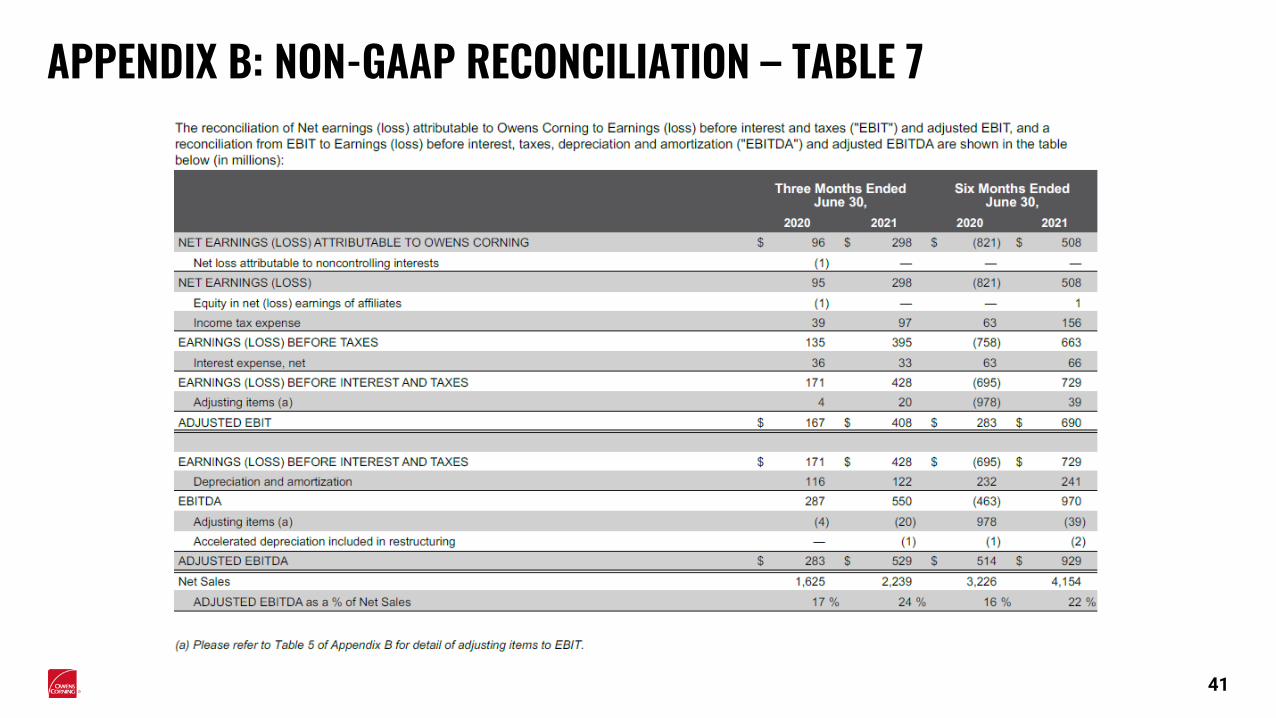
APPENDIX B: NON-GAAP RECONCILIATION – TABLE 7
41
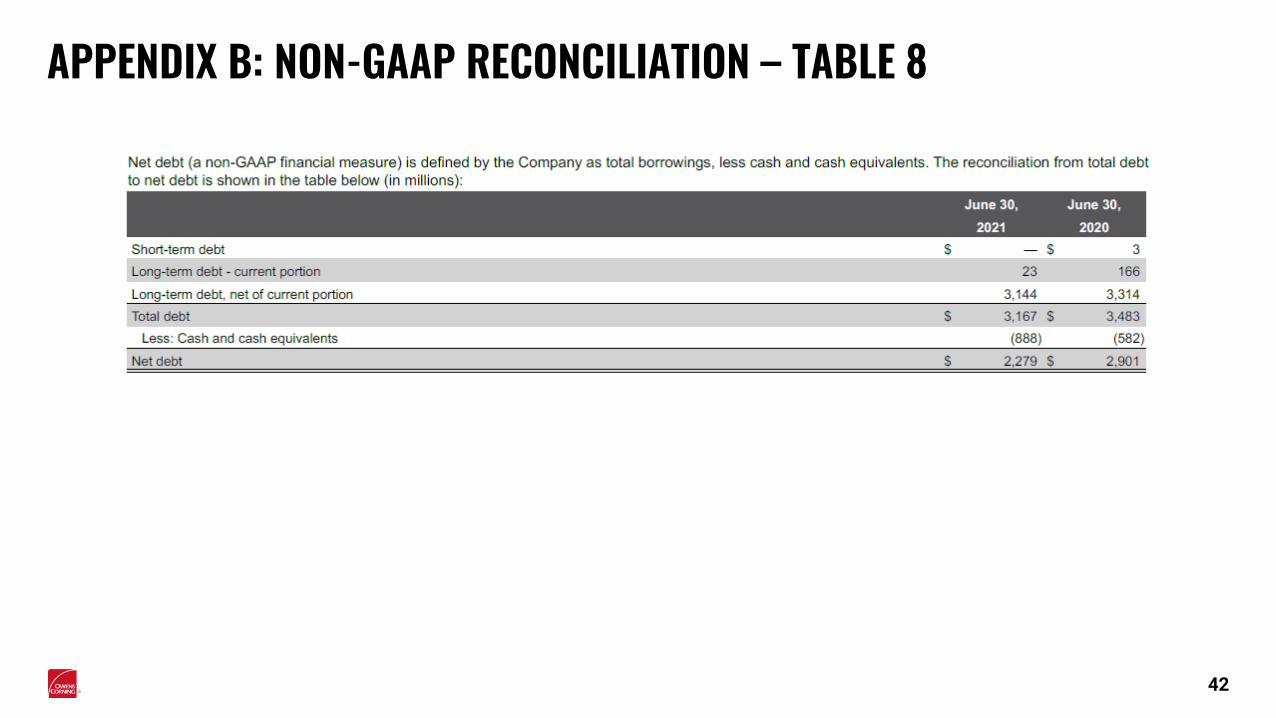
APPENDIX B: NON-GAAP RECONCILIATION – TABLE 8
42