HSBC Dubai Investor Roadshow
34
INVESTOR ROADSHOW The Middle East KEN MATHESON, REGIONAL COO MIKE ARNOLD, REGIONAL CFO 21 APRIL 2008
-
Upload
quarterlyearningsreports2 -
Category
Business
-
view
1.264 -
download
2
Transcript of HSBC Dubai Investor Roadshow

INVESTOR ROADSHOW
The Middle EastKEN MATHESON, REGIONAL COOMIKE ARNOLD, REGIONAL CFO
21 APRIL 2008

2
Forward-looking statements
This presentation and subsequent discussion may contain certain forward-looking statements with respect to the financial condition, results of operations and business of the Group. These forward-looking statements represent the Group’s expectations or beliefs concerning future events and involve known and unknown risks and uncertainty that could cause actual results, performance or events to differ materially from those expressed or implied in such statements. Additional detailed information concerning important factors that could cause actual results to differ materially is available in our Annual Report.

3
Contents
Middle East: OverviewHSBC in the Middle EastThe United Arab Emirates
Section 1
Section 2
Section 3

Middle East: Overview

5
Middle East: Growth in emerging market economies
(1) Percentage change of real Gross Domestic Product in 2007 versus 2006Source: IMF October 2007 report
010,00020,00030,00040,00050,00060,00070,00080,000
Alge
ria
Bahr
ain
Egyp
t
Iran
Iraq
Jord
an
Kuw
ait
Leba
non
Liby
a
Mor
occo
Om
an
Paki
stan
Qat
ar
Saud
i Ara
bia
Syria
Tuni
sia
UAE
Yem
en
GD
P/C
apita
US$
$
0246810121416
GD
P %
Gro
wth
GDP/Capita 07 GDP grow th

6
Economic Conditions in 2008
GDP:
• GDP growth remains strong across HSBC’s core Middle East emerging markets, compared to Economic Intelligence Unit (EIU) projected 3% global growth for 2008
(2) Source: IMF October 2007 Report
02468
101214161820
Bahrain Egypt Pakistan Qatar Saudi Arabia UAE
GD
P %
Gro
wth
2004 2005 2006 2007 2008
7
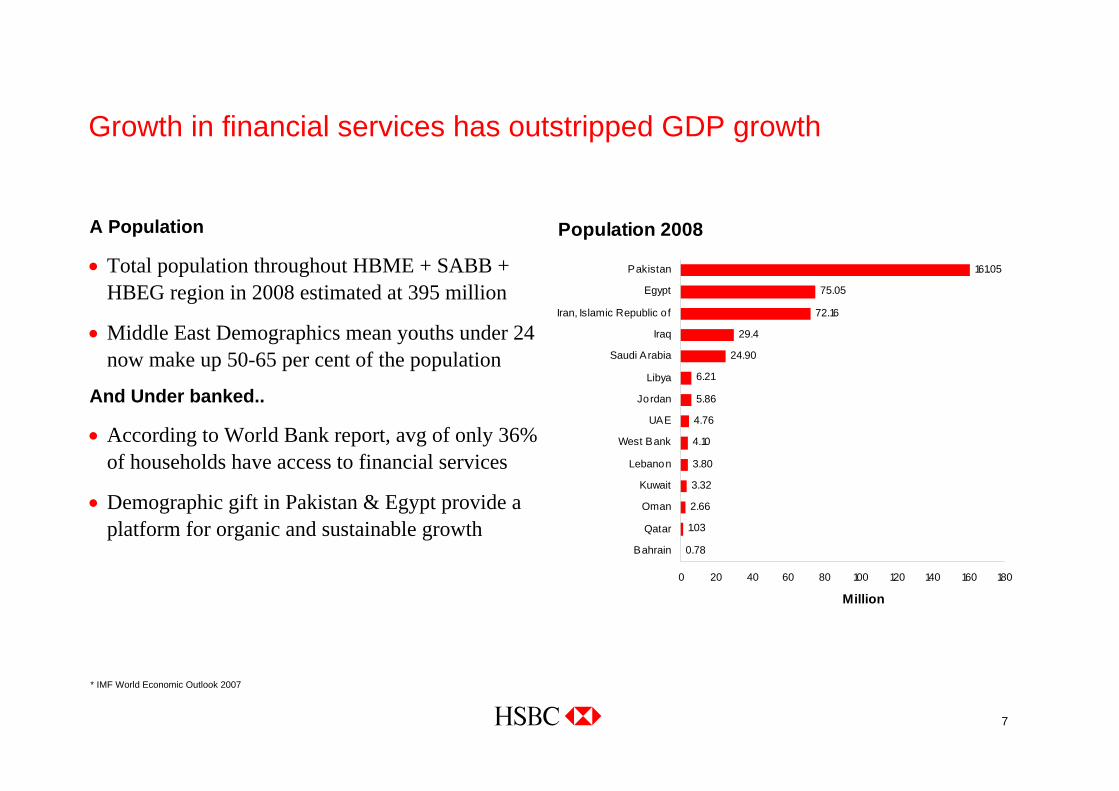
Growth in financial services has outstripped GDP growth
A Population
• Total population throughout HBME + SABB + HBEG region in 2008 estimated at 395 million
• Middle East Demographics mean youths under 24 now make up 50-65 per cent of the population
And Under banked..
• According to World Bank report, avg of only 36% of households have access to financial services
• Demographic gift in Pakistan & Egypt provide a platform for organic and sustainable growth
* IMF World Economic Outlook 2007
Population 2008
0.78
1.03
2.66
3.32
3.80
4.10
4.76
5.86
6.21
24.90
29.4
72.16
75.05
161.05
0 20 40 60 80 100 120 140 160 180
Bahrain
Qatar
Oman
Kuwait
Lebanon
West Bank
UAE
Jordan
Libya
Saudi Arabia
Iraq
Iran, Islamic Republic o f
Egypt
Pakistan
Million

8
Economic Conditions and Population at a glance
Inflation:(1)
• Inflation has reached record levels in 2007 across the Middle East with Qatar and UAE exceeding 13%
• Account surpluses and increased government spending are contributing to rising inflation across the region
• Forecasts predict that trend would ease during 2008 but would still remain well above history
Interest rates:
• Lower interest rates in the region and higher personal disposable income have led to an expansion in consumption, which is contributing to the growing strength of domestic demand
Population:
• Vast geographical area spanning two continents
• Diverse economies and demographics, from Egypt and Pakistan with a combined population of more than 200 million and average GDP per capita US$1,300/-, to Qatar with approximately 1 million and GDP per capita exceeding US$70,000
• Access to financial services remains low – the population with access to financial services in the region averages 36% (ranging from 60% in Saudi Arabia and the GCC countries to only 15% in Iraq and the West Bank)
(1) Source: EIU reports & IMF

9
Percentage of households with an account (deposits or loans) in any financial institution (banks, credit unions, microfinance)
• MENA current low financial services penetration provides HSBC with potential for future growth
Source: Finance for All? Policies and Pitfalls in Expanding Access. Policy Research Report. The World Bank. November 07
Country Per cent with access
Egypt 40
Iran 31
Iraq 17
Jordan 37
Libya 27
Oman 33
Pakistan 12
Saudi Arabia avg. GCC 62
Syria 17
Tunis 42
West Bank & Gaza 14< 20 % 20-40 % 40-60 %

10
Effects of US slowdown and Currency Peg
Unlike other Emerging Markets, currency weakness does not help the Gulf:
• Exports are dominated by dollar-denominated energy commodities
• GCC currencies have weakened by c15% in NEER terms since 2003
• Imports bear the full brunt of currency weakness
• Wage demands are directly linked to currency strength
Middle East response to US slowdown• Declining local interest rates in response to US cut in Fed Rates, leading to increased demand for
alternative investment opportunities across capital markets and real estate projects
• Mixed feelings on the peg of GCC currencies to US dollar (with the exception of Kuwait) – a further delay anticipated on the GCC single currency union
• Low Interest rates and declining value of personal disposable income generates demand for alternative investment mechanisms

HSBC in the Middle East

12
HSBC has over 200 branches and offices throughout 14 countries in MENA
Lebanon: 635696 customers
1 %
Jordan: 539285 customers
2.6% Bahrain: 749233
customers3.3%
Offices in Saudi Arabia relate to associate businesses
UAE: 23301038 customers
Oman: 8 285856.7%
Saudi Arabia: 75 749581 customers
9.6%
Qatar: 749520 customers
3.5%
Iraq: 1427815
customersN/A
Iran: 1HBME Rep Office Pakistan: 11
11171 customers0.57%
Palestinian Autonomous
Area: 1
Libya: 12007 HBME Rep
OfficeEgypt: 63
1509932.6%
Kuwait: 1364 customers
N/A
Percentage presents indicative market share of Assets

13
Full Year 2007Rank Country PBT % total
1 Hong Kong 7,339 30.3%2 United Kingdom 5,792 23.9%3 China 2,361 9.8%4 France 1,033 4.3%5 Canada 983 4.1%6 Mexico 980 4.0%7 Brazil 879 3.6%8 United Arab Emirates 617 2.5%9 Singapore 550 2.3%
10 India 529 2.2%11 Switzerland 475 2.0%12 Turkey 336 1.4%13 Malaysia 330 1.4%14 Germany 295 1.2%15 Saudi Arabia 237 1.0%16 Argentina 201 0.8%17 Bermuda 173 0.7%18 Malta 157 0.6%19 Egypt 153 0.6%20 Australia 124 0.5%
Other 668 2.8%
Total PBT US$m 24,212 100.0%
Figures in US$ m under IFRSSource: HSBC Holdings plc. Annual Report & Accounts
Middle East is an important contributor to Group earnings
• Middle East contributed 5% of HSBC Group PBT in 2007. 4th in importance after Hong Kong, UK and China
• UAE is in the top 10, and Saudi Arabia and Egypt are in the top 20 countries in terms of geographic profit contribution

14
Figures in US$ m under IFRSSource: HSBC Holdings plc. Annual Report & Accounts
Strong profit growth in 2007, 26% higher than 2006
1,035
1,307
821
0
500
1,000
1,500
2,000
2005 2006 2007
+26.2%CAGR
Middle East, profit before tax
Middle East – profit before tax rose to US$1.3bn in 2007

15
Full Year Periods
% Change vs. 2006US$m 2006 2007
Net operating income before loan impairment charges 1,350 1,911 42%
Loan impairment charges (39) (55) 41%
Net operating Income 1,311 1,856 42%
Total operating expenses (563) (801) 42%
Share of profit in associates
Profit before Tax
287
1,035
252
1,307
-12%
26%
Share of HSBC’s profit before tax 4.7% 5.4% 70 bps
Cost efficiency ratio 41.7% 41.9% 20 bps
Figures in US$ m under IFRSSource: Management Accounts
Middle East summary of results

16
-50
0
50
100
Total ME UAE Saudi Arabia Egypt Rest of ME
Revenue growth(%)
-40-20
020406080
100
Total ME UAE Saudi Arabia Egypt Rest of ME
Risk adjusted Revenue growth
(%)
-45
-25
-5
15
35
55
Total ME UAE Saudi Arabia Egypt Rest of ME
Jaws(%)
0
20
40
60
80
100
Total ME UAE Egypt Rest of ME
Total Net Loan Portfolio growth
(%)
Figures in US$ m under IFRSSource: Management Accounts
Middle East Key Indicators 2007 versus 2006 as reported
17
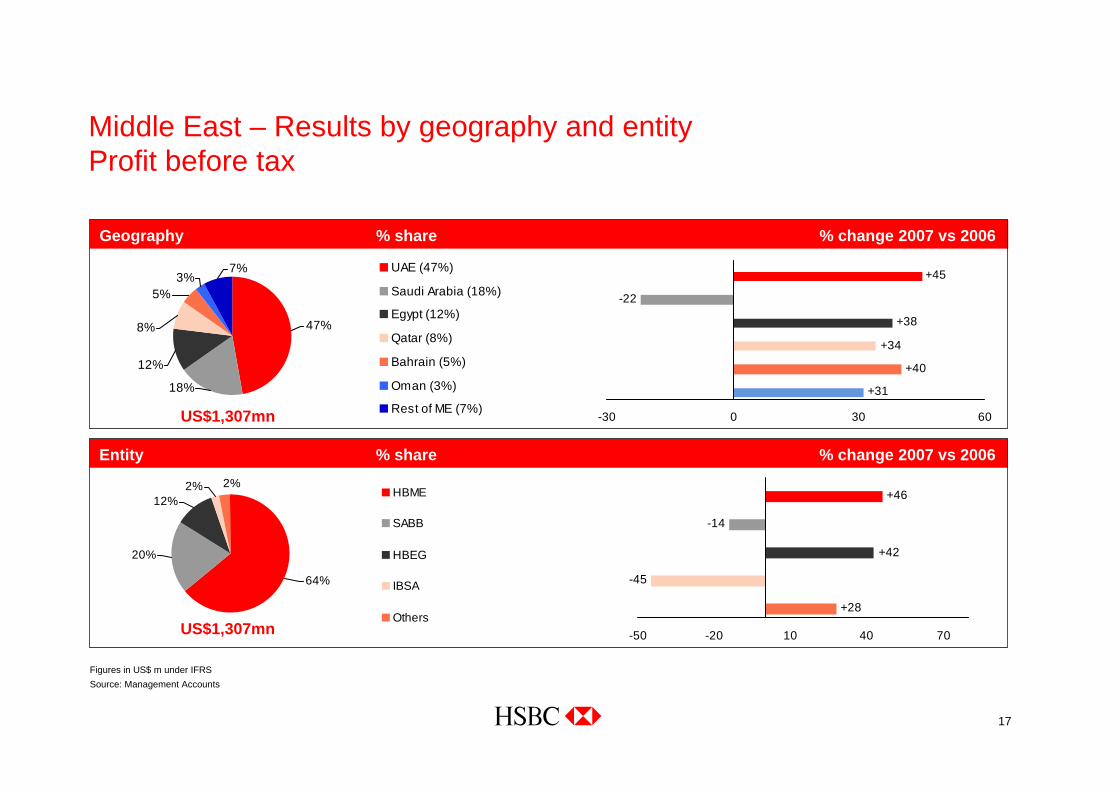
Figures in US$ m under IFRSSource: Management Accounts
Middle East – Results by geography and entityProfit before tax
Geography % share % change 2007 vs 2006
+31
+40
-22
+34
+45
+38
-30 0 30 60
47%
18%
12%
8%
3%7%
5%
UAE (47%)
Saudi Arabia (18%)
Egypt (12%)
Qatar (8%)
Bahrain (5%)
Oman (3%)
Rest of ME (7%)US$1,307mn
Entity % share % change 2007 vs 2006
+28
-45
+46
-14
+42
-50 -20 10 40 70
2%
64%
12%
20%
2%HBME
SABB
HBEG
IBSA
OthersUS$1,307mn

18
Growth in profit before tax (%) 2007 vs 2006
+50
+4
+78
+25
+35
+26
0 20 40 60 80 100
Total MiddleEast
Other
Private Banking
Global Bankingand Markets
CommercialBanking
PersonalFinancialServices
(%)
Figures in US$ m under IFRSSource: Management Accounts
Middle East – Results by customer group
Business mix
5.2 (24%)5.6 (26%)
10.8 (50%)
US$1,307m
US$21.6bn
Customer lending (US$ billions), 31 December 2007
Profit before tax (US$ millions), 2007
3 (0%) - Pvt. Banking495 (38%)
82 (6%)
482 (37%)
245 (19%)

19
• Strong increase in operating profit, mitigated by lower revenue due to continued effects in 2007 of the Saudi stock market correction in 2006
• Strong balance sheet growth continued across core asset & liability lines
• Promotions were instrumental in increasing credit card accounts (+30% to 1.2m) and balances (+62%)
• Similarly mortgages balances doubled
• eSaver garnered 10K accounts and US$0.5bn of balances
• Fee income rose significantly from credit cards, insurance, wealth management and other fee streams
• Loan losses remained low in a benign credit environment
• Expense growth represented investment and platform build-out, including card platform and relaunch of Global Premier
Figures in US$ m under IFRSSource: Management Accounts
Middle East – Personal Financial Services Growth hampered by lower Saudi stock market earnings
(US$m) 2007 chg
Profit before tax 245 +4%
Customer loans (US$bn) 5.2 +54%
Customer deposits (US$bn) 11.1 +44%

20
• Profit before tax growth of 35%, underpinned by strong economic growth and the success of new International Banking Centres and dedicated Business Banking Centres
• New business banking units introduced in Bahrain, Jordan, Lebanon, Oman and Qatar, contributing to a 30% increase in customers
• In the UAE, additional RM’s in the BBU helped to drive a 30% increase in revenues
• Trade Services and Payments & Cash Management revenues grew strongly
• Strong cross sales of investment banking products including sukuk deals
• Trading income rose on due to customer demand for fx and interest rate hedging products
• Voted Best bank for Trade Finance, and Best Bank for Payments & Cash Management in the region
Figures in US$ m under IFRSSource: Management Accounts
Middle East – Commercial BankingThe leading international business bank
(US$m) 2007 chg
Profit before tax 482 +35%
Customer loans (US$bn) 10.8 +41%
Customer deposits (US$bn) 9.6 +44%

21
• Record growth, with the region establishing itself as a major contributor to the Group and its “emerging markets” strategy, adding new skills, new clients and new business at a rapid rate
• Leading advisory role in Borse Dubai-Nasdaq-OMX transaction
• GCC market leader in regional sub-custody
• GCC market leader in Project Finance
• First commercial mortgage-backed security in the region
• First rated sukuk for a corporate in Qatar
• First international bank to gain a regulatory license to trade on UAE stock markets
Figures in US$ m under IFRSSource: Management Accounts
Middle East – Global Banking and Markets Exceptionally strong performance
(US$m) 2007 chg
Profit before tax 495 +25%
Customer loans (US$bn) 5.6 +22%
Customer deposits (US$bn) 8.3 +68%

22
Middle East – Private Banking Building on Group relationships
• Profits booked in the region (US$3m) were +50% on prior year – overall contribution to Group Private Banking is significantly stronger with the joined-up approach of servicing these customers globally
• Strong growth in Assets/Funds Under Management
• Restructured MENA team to facilitate strong advisory capability and powerful regional marketing
• Strong focus on wider Group capabilities to offer clients global wealth solutions
• Developed “troika” approach so that each client is fully served by a dedicated team comprising an RM, an investment advisor and a specialist wealth planner

23
Opportunities in Middle East
• Unprecedented Economic growth where the Middle East has:– Foreign reserves of approximately US$ 2 trillion– Some of the highest GDP per Capita countries in the world– 70% and 46% of the world’s known oil and gas reserves
• Rise of Sovereign Wealth funds with excess of US$ 2.3 trillion of capital for investment
• Government surpluses growing from 1.5% of GDP in 2003 to 14.5% in 2006 increasing spend and diversification across non oil sectors – Qatar: US$ 7.5bn new Airport & US$ 10bn Education city– Kuwait: US$ 85bn City of Silk– Egypt: US$ 9 bn investment in ports
• Ownership structures have begun to alter with increased contribution from the private sectors
• Demographic gifts and Growing bankable population among the mass affluent and High net worth customers
• Integrating HBME operations: regionally and globally

The United Arab Emirates

25
Source: GDP 2004-2008 – IMF world update October 2007 UAE GDP forecast – UAE EIU country report
GDP growth vs. prior year (%)
0
2
4
6
8
10
12
2004 2005 2006 2007 2008 2009 2010 2011 2012
Consumer Headline Inflation (%)
1111.5
1212.5
1313.5
1414.5
2005 2006 2007 2008
United Arab Emirates (UAE): Overview
• One of the highest GDP per capita in the Middle East
• Inflation reached record levels in 2007
• Rapid economic growth with increased government spend on the development of infrastructure, education and real estate sectors
• Abu Dhabi SWF estimated at US$ 875 bn (ADIA)

26
2007 Results – IFRS Basis
US$m 2006 2007 2007 vs 2006
Net operating income before loan impairment charges 1,104 1,589 43.9%
Loan impairment charges (43) (54) 25.6%
Total operating expenses (466) (663) 42.3%
Profit in associates and joint ventures 12 16 33.3%
Profit before tax 607 887 46.1%
Figures in US$ m under IFRSSource: HBME Annual Accounts
HSBC Middle East results ‘HBME’(excluding Egypt and associates)

27
Growth in profit before tax (%) 2007 vs 2006
46
24
67
33
39
0 20 40 60 80
Total HBME
Private Banking
Global Banking and Markets
Commercial Banking
Personal Financial Services
(%)
Business mix
363 (41%)
329 (37%)
3 (0%)191 (22%)
US$887 million
Profit before tax (US$ millions), 2007
Figures in US$ m under IFRSSource: HBME Annual Accounts
HBME – Profit before tax by customer segment 2007

28
0
2
4
6
8
10
2005 2006 2007
Commercial Loans Consumer Loans M ortgage Loans Loans to Government entities
Customer loan portfolio trend 2005-07
Figures in US$ m under IFRSSource: HBME Annual Accounts & Management Accounts
HBME – Loans portfolio
• Total Performing loans portfolio increased 64% from 2005 to 2007 with a CAGR of 28%
• Mortgages and consumer loans have grown strongly – increasing from 21% to 28% of the total portfolio between 2007-2008

29
HBME UAE vs. Competition Profit Before Tax – 2007
435 (44%)
600 (48%)569 (-3%)581 (29%)
651 (27%)697 (19%)
NBAD EBIL HBM E M ashreq ADCB NBD
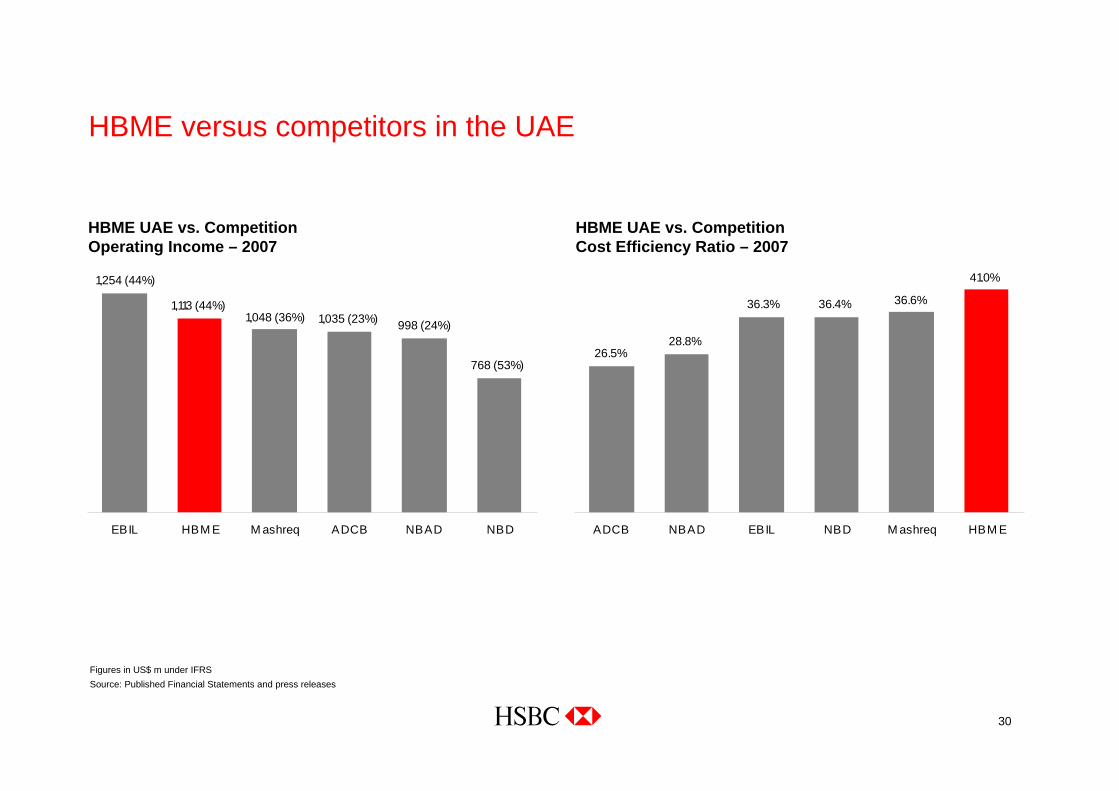
HBME versus competitors in the UAE
Figures in US$ m under IFRSSource: Published Financial Statements and press releases
• HBME UAE ranked no.1 in terms of percentage growth in 2007 PBT
30
HBME UAE vs. Competition Cost Efficiency Ratio – 2007
41.0%
36.3% 36.6%36.4%
28.8%26.5%
ADCB NBAD EBIL NBD M ashreq HBM E
HBME versus competitors in the UAE
Figures in US$ m under IFRSSource: Published Financial Statements and press releases
HBME UAE vs. Competition Operating Income – 2007
768 (53%)
1,048 (36%)998 (24%)1,035 (23%)
1,113 (44%)
1,254 (44%)
EBIL HBM E M ashreq ADCB NBAD NBD

31
HBME UAE vs. Competition Customer deposits – December 2007
13,146 (39%)
17,637 (43%)15,565 (32%)
17,042 (55%)
20,122 (48%)
22,256 (16%)
NBAD EBIL NBD HBM E ADCB M ashreq
HBME versus competitors in the UAE
Figures in US$ m under IFRSSource: Published Financial Statements and press releases
HBME UAE vs. Competition Customer advances – December 2007
10,438 (26%)
20,606 (21%)
13,636 (39%)
17,917 (52%)
21,710 (39%)
27,334 (52%)
EBIL NBAD ADCB NBD HBM E M ashreq

32
HBME: Key points
• HBME has an unrivalled historical presence exceeding 100 years across the region and a strong brand perception
• Sovereign Wealth Funds and GCC oil surpluses pouring into North African and Asian Investments
• UAE, Qatar and Bahrain all competing to become regional financial Hubs through the establishment of strong financial entities – DIFC, QFC. Association with leading financial institutions such as HSBC provide international support and recognition
• Focus on continued strong relationships with Governments, Key Trading Families and the Next Generation
• Rapid economic growth provides a platform of opportunities across all customer and product groups
• Key competitive advantage with our Joined-up approach, able to support the growing corporate expansions meeting their regional and global aspirations
• We are leveraging on our economies of scale, adopting the Group’s state of art technology and standardising our operating platforms across the region, to provide a consistent customer experience and deliver on the brand’s promise (the World’s local bank)
• Focusing on quality rather than quantity to maximise the value of our customers and return on our investments
• Growing demand for credit facilities and mortgage financing
• We are growing our insurance business and are leveraging the launch of HSBC Premier to build out in the mass affluent market
• There is continued potential for middle commercial market growth, with success exceeding expectations with the launch of our regional SME proposition

33
HBME*: Strong potential for growth
Distribution
• 40 branches & offices across the region despite existing local restrictions on branch numbers in some countries
• 383 ATMs and self service machines
• More than 6,000 FTE
• Direct proposition
Strong and growing customer base
• 0.5 million customers with PFS accounting for more than 95% of existing customer base
• More than 27,000 small business customers
• 0.75 million Cards In Force – doubled in 2 years
A multi-line financial services group
• A fully integrated and joined up banking proposition catering to corporate, personal, investment and private banking customers regionally and globally
• Expanding scope of services to cover all market segments with HBME’s Sharia compliant product offerings, Insurance services and unrivalled CNC business platform
* Includes Pakistan

Thank you