Investor Relations Presentation September 2008. Cautionary Statement Regarding Forward-Looking...
28
Investor Relations Presentation September 2008
-
Upload
verity-mcdaniel -
Category
Documents
-
view
218 -
download
0
Transcript of Investor Relations Presentation September 2008. Cautionary Statement Regarding Forward-Looking...

Investor Relations Presentation
September 2008

Cautionary Statement RegardingForward-Looking Statements
This presentation includes forward-looking statements within the meaning of Section 27-A of the Securities Act of 1933, and Section 21-E of the Securities Exchange Act of 1934. Such statements include declarations regarding the intent, belief, or current expectations of the company and its management. Prospective investors are cautioned that any such forward-looking statements are not guarantees of future performance, and involve a number of risks and uncertainties that can materially affect actual results as identified from time to time in the company’s reports and registration statements filed with the Securities and Exchange Commission. Forward-looking statements provided herein as of a specified date are not hereby reaffirmed or updated.

Introduction to Covanta• World’s largest owner/operator of Energy-from-Waste (EfW) facilities
• Business serves two key markets & addresses two key issues:– Waste Disposal
• Superior sustainable alternative to landfills; cleaner & preserves open spaces– Generation of Clean, Renewable Power
• Entire process results in net GhG reductions
• Complementary businesses include– Biomass and other renewable energy generation– Waste procurement and transfer stations

Key Investment Considerations• Largest player in a growing niche (EfW) with high barriers to entry
• Contracted revenues provide predictable base business
• Increasing exposure to electricity pricing provides upside when fossil fuel prices rise
• Strong balance sheet and free cash flow generation support growth initiatives
• Stability and Growth: consistent operating performance coupled with increasing expansion and greenfield opportunities

How does EfW Work?
• Municipalities and others pay us to dispose of waste
• Technologically advanced facilities combust waste, our fuel, at high temperatures
• Resulting steam is either sold directly or used to make electricity for sale
• Metals are retrieved and recycled
• Ash residue is buried or recycled for use in construction and road building applications

Benefits of EfW• Environmentally sustainable waste disposal
– Most attractive solution after recycling– Waste volume reduced by 90%– Reduces landfill usage and long-haul transport
• Generates clean, reliable energy from renewable fuels– U.S. EPA states EfW: “produces electricity with less environmental
impact than almost any other source”– Baseload power 24/7
• Reduces greenhouse gas emissions; combats global warming– 1:1 CO2 offset for each ton of waste processed
• Fewer fossil fuels burned: 1 ton of waste ≈ ¼ ton of coal
– Methane from landfills: global warming capacity 20+ times CO2

Global Drivers for EfW• Increasing waste generation – population growth & urbanization
• Landfill capacity constraints; legislative directives to reduce landfill usage
• Climbing fossil fuel prices; reserves being depleted
• Demand for renewable power generation
• Focus on energy security and diversity
• Growing attention to climate change; desire to reduce greenhouse gas emissions

Global Waste ManagementEfW 0.2 Billion tons Recycling 0.5 Billion tonsRecycling 0.5 Billion tons Landfill 1.2 Billion tons
U.S
.
Den
mar
k
Sw
eden
Net
her
lan
ds
Ger
man
y
Ave
rag
e
Ital
y
U.K
.
Irel
and
Jap
an
Tai
wan
Sin
gap
ore
Ch
ina
U.S.≈90 EfW facilities
Western Europe≈400 EfW facilities
Asia≈300 EfW facilities
Landfill
Recycling/Composting
EfW

Substantial Growth Potential• Waste generation increasing with population
and income growth
• Landfilling still the predominant disposal method– China: approximately 280 million tons– U.S.: approximately 250 million tons– UK and Ireland: approximately 50 million tons
• Reduce. Reuse. Recycle. Then recover waste to watts!
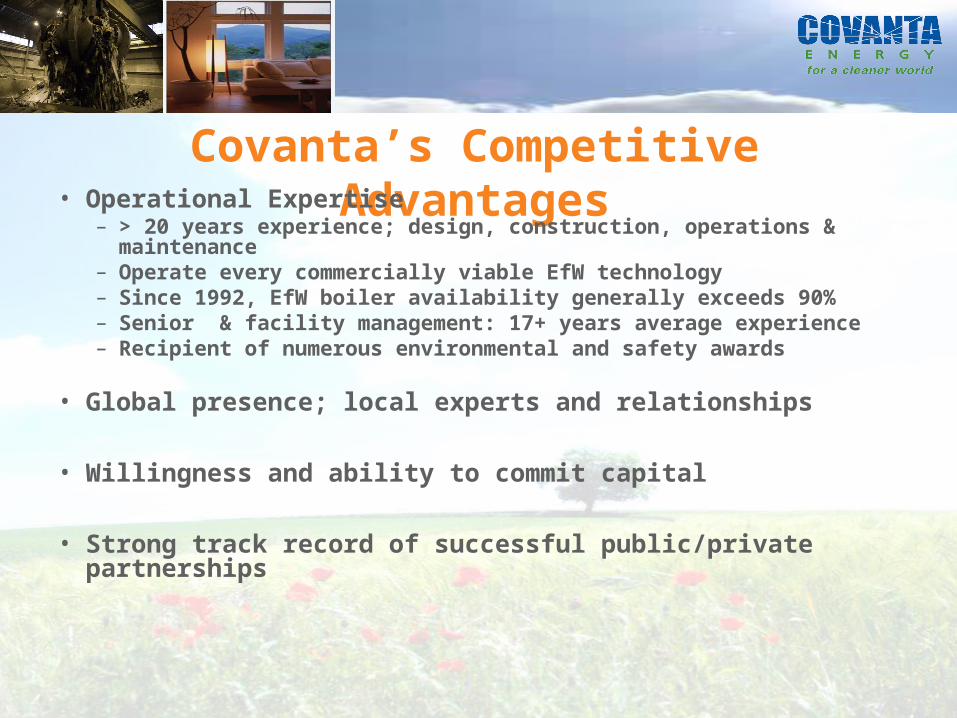
Covanta’s Competitive Advantages• Operational Expertise
– > 20 years experience; design, construction, operations & maintenance
– Operate every commercially viable EfW technology – Since 1992, EfW boiler availability generally exceeds 90%– Senior & facility management: 17+ years average experience– Recipient of numerous environmental and safety awards
• Global presence; local experts and relationships
• Willingness and ability to commit capital
• Strong track record of successful public/private partnerships

Growth Strategy• Maximize long-term value of existing portfolio
– Extend contracts for operation and waste delivery– Implement productivity enhancements– Facility expansions
• Acquisition and greenfield development :– North America – EfW, renewable energy & complementary
businesses– Europe – primarily EfW; focus on UK and Ireland– Asia – primarily EfW; focus on China
• R&D – Invest in new technologies

U.S. – ≈85% of CVA Revenues• Handle over half of U.S. EfW volume (16 of 30 million tons) or 5% of post-recycled
MSW
• Produce almost 10% of America’s non-hydro renewable electricity – enough to power over a million homes
• Operate in 18 states (assumes ME acquistion closes), concentrated in the densely populated Northeast
• 35 EfW; 8 biomass (assumes ME acq. closes), 4 landfill gas facilities & 2 hydro
Covanta EfW Facility Locations by State
FL8%
MA13%
NJ10%
NY18%
VA9%
PA10%
CT8%
MI6%
I N4%
HI4%
MD4%
Other6%
Annual Tons Processed by State
Covanta

U.S. - Strong Fundamentals• Waste Disposal
– Recession resistant, non-cyclical business ; historical long-term growth rate of ≈3% – Rising prices due to capacity constraints & barriers to entry– Higher diesel costs and state landfill tax make long-haul disposal less attractive
• Power Production– Rising prices due to higher demand & higher fossil fuel prices;– Energy security concerns
• Energy-from-Waste - Opportunities for new capacity re-appearing– Growing interest in integrated waste management and renewable energy– Concern with global warming and reducing carbon footprint
Source: EPA
Average PJM Electricity Price TrendsAverage PJM Electricity Price Trends
$0$10$20$30$40$50$60$70$80$90
2002 2003 2004 2005 2006 2007 2008YTD
Dolla
rs p
er
MW
H
Source: EPA Note: PJM (Pennsylvania, New Jersey, Maryland grid) – East Zone (LMP)Source: PJM Day-Ahead Spot Market Price. 2008 YTD data through August.

Service Fee
Operated
Tip Fee Owned
Service Fee
Owned
Typical U.S. EfW Contract Structures• Waste disposal contracts are structured as either
“tip fee” or “service fee”– Service fee facilities can be owned and operated by
Covanta or just operated
– Prefer longer term contracts to ensure “fuel” supply
• Energy revenue traditionally under long-term contract; portfolio shifting to shorter term
• EfW projects generally financed with municipal bonds
– Project debt usually paid over term of waste disposal contract (≈ 20 years)
– Service fee contracts include debt service payments
– Debt free facilities after initial contract period
Facilities by Contract Type

North American Initiatives• Contract roll-overs; potential energy revenue upside
– Indianapolis and Hempstead
• Expansions of existing facilities– Florida and Hawaii
• Pursuing greenfield projects– Vancouver – Toronto– Maryland
• M&A Activities– Tulsa– Maine biomass facilities– Transfer stations

U.S. Energy Policy• Federal and numerous state laws considers EfW a renewable
energy source
• Still no comprehensive U.S. renewable energy or climate change policy– Potential upside if EfW included in Federal renewable energy portfolio
standards– Exemption from carbon caps would provide business advantage over fossil
fuels– Recognition of GhG offsets would offer substantial upside

Growth Drivers - Europe• Widespread acceptance of EfW is creating opportunities
• EU Landfill Directive: supports EfW, disincentives for landfilling– Reduce landfilling of biodegradable MSW by 65% from 1995
disposal levels by 2020
• U.K. and Ireland – Significant efforts needed to meet EU regulations– U.K. environmental agency (DEFRA) estimates EfW will need to
increase from 9% of waste disposal to 27% by 2020
– U.K. market – expect 10 million tons of new EfW capacity to be required
– High market tip fees (>$100 per ton of MSW) and electricity rates
• Additional opportunities in continental Europe

UK/Ireland Initiatives
• Dublin: 1,700 tpd facility – construction expected to begin near end of 2008• UK – Large number of municipalities considering projects
– Currently, short listed on several– Additional opportunities are unfolding each year
• Covanta Infrastructure Preparedness– Office in Birmingham being expanded to meet heightened level of activity – Employing locals with local expertise and valuable relationships
Artist’s Rendering - Dublin
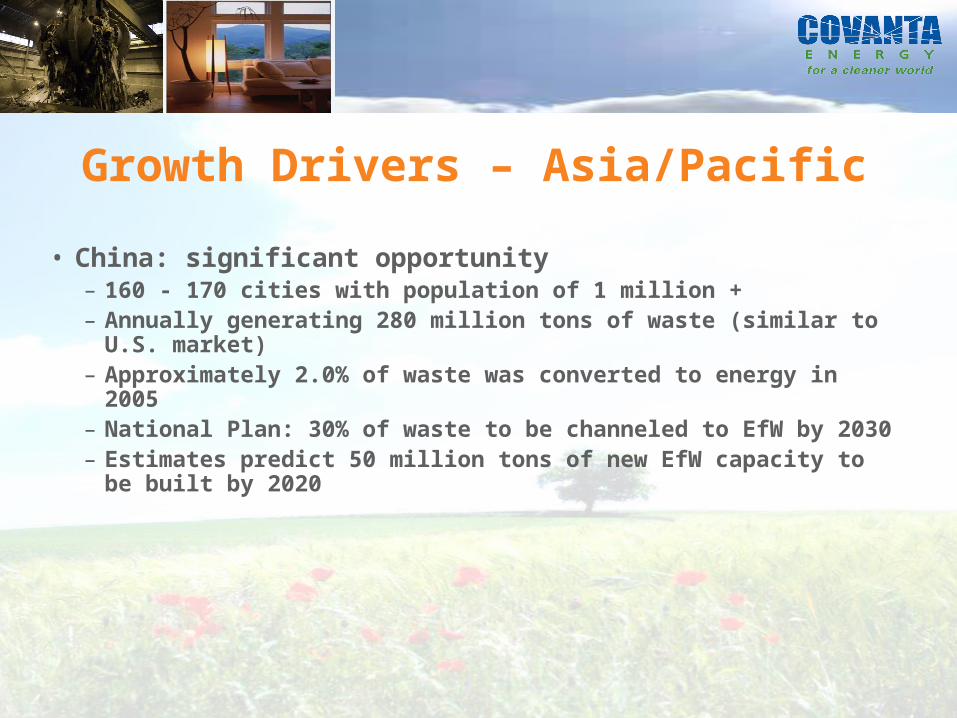
Growth Drivers – Asia/Pacific
• China: significant opportunity– 160 - 170 cities with population of 1 million +– Annually generating 280 million tons of waste (similar to U.S.
market)– Approximately 2.0% of waste was converted to energy in 2005– National Plan: 30% of waste to be channeled to EfW by 2030– Estimates predict 50 million tons of new EfW capacity to be
built by 2020
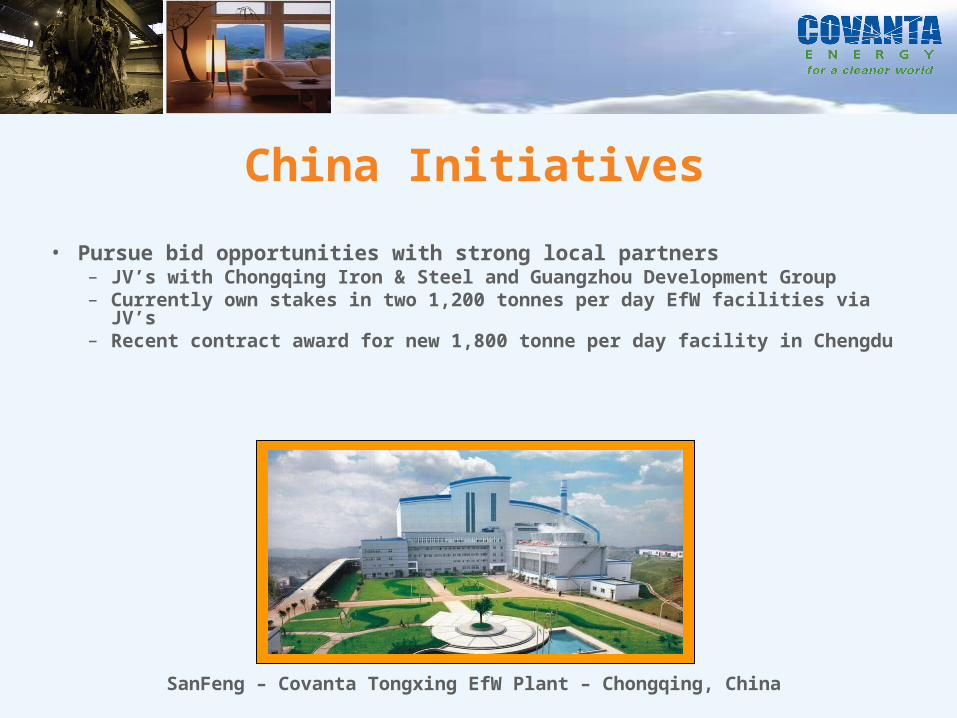
China Initiatives
• Pursue bid opportunities with strong local partners– JV’s with Chongqing Iron & Steel and Guangzhou Development Group– Currently own stakes in two 1,200 tonnes per day EfW facilities via JV’s– Recent contract award for new 1,800 tonne per day facility in Chengdu
SanFeng – Covanta Tongxing EfW Plant – Chongqing, China

Attractive Economics• Stable business model
– Long-term contracted revenue stream– Credit-worthy clients – municipalities and utilities
• High margins and low capital expenditure requirements– Annual maintenance capex: ≈ $60 million (4% of revenue)
• Strong operating cash flow to fund growth (1)
– 2008 operating cash flow guidance: $380 to $420 million– 2008 scheduled project debt amortization of $167 million (with approximately $20 million funded from
restricted cash)
• Strong balance sheet– Borrowing power increasing as facilities become debt-free
(1) As of July 29, 2008. This information is not being reaffirmed or updated as of the current date.

Financial Summary20072007 YTD 6-30-07YTD 6-30-07 YTD 6-30-08YTD 6-30-08
Revenues $1.43 billion $685 million $812 million
Adjusted EBITDA (1) $549 million $245 million $268 million
Operating Cash Flow $358 million $146 million $160 million
Net Income $131 million $19.8 million $59.6 million
Diluted EPS $0.85 $0.13 $0.39
(1) Non-GAAP financial measure – Please see second quarter press release for discussion of use of Non-GAAP financial measures and calculation of Adjusted EBITDA.

Consistent Financial Performance and Growth
Revenues
$1,433
$1,209
$1,269
$1,050
$1,100
$1,150
$1,200
$1,250
$1,300
$1,350
$1,400
$1,450
PF2005 2006 2007
($ i
n m
illi
on
s)

Consistent Financial Performance and GrowthOperating Cash Flow (1)
(1) Operating Cash Flow is defined as the GAAP measure cash flow provided by operating activities.
(2) Includes the results for Covanta ARC Holdings from June 25, 2005 through December 31, 2005.
(3) As of July 29, 2008. This information is not being reaffirmed or updated as of the current date.
$358
$208
$311
$0
$50
$100
$150
$200
$250
$300
$350
$400
2005 (2) 2006 2007
($ i
n m
illi
on
s)
2008 Guidance: $380-$420 million (3)

Consistent Financial Performance and GrowthAdjusted EBITDA (1)
$549
$501
$542
$400
$450
$500
$550
$600
$650
$700
PF2005 (2) 2006 2007
($
in
mil
lio
ns
)
2008 Guidance: $550-$575 million (3)
(1) Please see second quarter press release for discussion of use of Non-GAAP financial measures and calculation of Adjusted EBITDA.
(2) Calculated for Covanta Energy Corporation.(3) As of July 29, 2008. This information is not being reaffirmed or updated as of the current date.

Computation of Adjusted EBITDA
(In millions)(In millions)
Full YearFull Year
20072007
YTD YTD
6-30-086-30-08
Full Year Full Year
Estimated 2008Estimated 2008
Net Income $131 $60 $140 - $155
Depreciation and amortization expense 197 100 206
Debt service 111 50 95 - 92
Income tax expense 31 34 78 - 85
EBITDA 470 $244 $519 - $538
Adjustments for non-cash items 39 20 24 – 30
Loss on extinguishment of debt 32 0 0
Minority interests 9 4 7
Adjusted EBITDA(1) $549 $268 $550 - $575
(1) As of July 29, 2008. This information is not being reaffirmed or updated as of the current date. Please see second quarter press release for discussion of use of Non-GAAP financial measures and calculation of Adjusted EBITDA.

Reconciliation - Cash Flow: Adjusted EBITDA
(In millions)(In millions)Full YearFull Year
20072007YTDYTD
6-30-086-30-08Full Year Estimated Full Year Estimated
20082008
Cash Flow Provided by Operating Activities $358 $160 $380 - $420
Debt service 111 50 95 – 92
Amortization of debt premium and deferred financing costs 11 4 7
Other 69 54 68 - 56
Adjusted EBITDA(1) $549 $268 $550 - $575
(1) As of July 29, 2008. This information is not being reaffirmed or updated as of the current date. Please see second quarter press release for discussion of use of Non-GAAP financial measures and calculation of Adjusted EBITDA.

Key Investment Considerations
• Largest player in a growing niche (EfW) with high barriers to entry
• Contracted revenues provide predictable base business
• Increasing exposure to market electricity pricing provides upside when fossil fuel prices rise
• Strong free cash flow generation and balance sheet support growth initiatives
• Stability and Growth: consistent operating performance coupled with increasing expansion and greenfield opportunities