Investor Presentation - ulusoyelektrik.com.tr Power Engineering and Production Company ... Colombia...
39
Ulusoy Electric Investor Presentation March 2018
Transcript of Investor Presentation - ulusoyelektrik.com.tr Power Engineering and Production Company ... Colombia...

Ulusoy ElectricInvestor Presentation
March 2018

Table of
Contents
Company Snapshot
Business Overview
Growth & Prospects
Financials
3
6
29
32

Company Snapshot

March 2018 Investor Presentation
Ulusoy Electric at a Glance
4
PRODUCTION FACILITIES
Operations in
Turkey│Indonesia│Algeria
Countries3 Production
750 Employees
Above 15%High-Caliber Engineers
Indoor area of 60K m²built on a area of87K m²
‘’0’’ debt Strong financial
CORPORATE STRUCTURE
Domestic
Over the past decadeMarket Leader
PRODUCTION and R&D
Design&Capabilities Structure
Long term sustainableand solid growthstragety
Min. 2 digit growth
Min. 20% EBITDA margin
FINANCIAL STRUCTURE
Turkey’s Leader Switchgear Producer Operating as Electric Power Engineering and Production Company”
Vertically Integrated
Flexible In-House
Exporting to morethan 50 countries
No major CAPEX investment

March 2018 Investor Presentation
Key Milestones
1985
31-year story of Ulusoy Electric started.
The Company founded by
Mr. Sait Ulusoy
1986
•Contracting activities started (Urban Networks, Airport Electrification, 154 kV Power Cables etc.).
•Manufacturing activities started with 36 kV outdoor switch disconnectors.
1995
The Companywas listed in the first 50
companies in Turkey to qualify for ISO-9000 standards
1997
Firstdomestic
Monoblock Substation
Kiosk production
1999
First domestic MV cable
termination production using liquid
silicon injection
2006
First domestic production of overhead line recloser andsectionalizers
2007
The Company was listed in
the TOP 1,000 biggest
industrial companies in
Turkey
2013
Entered into Indonesia market with a new office
Company’sown design cantilever
insulators was developed
2015
New 31,750 m² manufacturing
facility investment for
distribution transformers and concrete
substation kioskwas completed
2014
Launched its IPO and was listed on the
Borsa Istanbul
2008
Algeria office was established
Company’s own design vacuum circuit breaker and
underground substation kiosks was
developed
5

Business Overview

March 2018 Investor Presentation
Our Business Model Overview
7

March 2018 Investor Presentation
What We Produce
8

March 2018 Investor Presentation
Manufacturing Facilities (Switchgear)
Headoffice & Main Production Facility
• Located in Ankara
• Completed in 2004
• 26,000 m² indoor area
Capacity
25,000-45,000* air insulatedswitchgears
15,000 gas insulated switchgears
1,250 metal clad
9
*Varies on type&configuration of the switchgears

March 2018 Investor Presentation
Manufacturing Facilities (Transformer&Substation)
10
New Transformer Facility Ensured
• Enterance into a new business line
• Completion of vertical integration
• Enhancement in competitive edge
• Diversification in revenue stream
• Improvement in sustainability of revenue
• Located in Ankara
• Completed in 2015
• 31,750 m² indoor area
• 5,000 annual transformer capacity
• 4,500 substation kiosk capacity
• US$10.7mn total investment
• US$ 5000 transformer avg. Price*
*Varies on ratings and types
FY 2016 2017 2018EProd. Unit 863 2189 3500Av. Price (USD) 4200 5700 5500Revenues 3.624.600 12.481.240 19.250.000

March 2018 Investor Presentation
Manufacturing Facilities (Indonesia)
Local Indonesia Assembly Facility
• Located in Jakarta
• Opened in 2017
• 4,000 m² indoor area
Capacity
6,000-7,000* air insulatedswitchgears
11
*Varies on type&configuration of the switchgears
Foreign Direct Investment 100% owned by Ulusoy Elektrik A.S

March 2018 Investor Presentation
Manufacturing Facilities (Algeria)
Local Algeria Assembly Facility
• Located in Constantine
• Opened in 2017
• 2,600 m² indoor area
Capacity
7,000 air insulated switchgears
12
• 100% local factory• owned by SARL INTELEC • Former Main Distributor of Ulusoy Elektrik A.S• Technology & License by Ulusoy

March 2018 Investor Presentation
New Manufacturing Facility Investment
New Facility
• Located in Ankara (just 800 meters to existing Trafo Facility)
• Expected Completion date end of 2019
• 24,000 m² indoor area in a land of 26,000 m²
• Investment Amount : TL 2M (Land) + TL 10M (Building) USD 3M in total
Capacity & Plans
To increase capacity in;
Gas insulated switchgears
Epoxy Resin components
Being ready for any market demand (new product or newmarket)
13

March 2018 Investor Presentation
Production Process & Suppliers
TOP-10 Suppliers
• Galvanized & Grain Oriented sheet steel
• Copper & Aluminum
• Epoxy Resin & Silicone
• Electrical part and component manufacturers
82%
12%6%
COGS Breakdown*
2016
82%
10%
8%
Raw materials Personel expenses Others
2015
COGS
Revenue78% 71%
14
71% FX Exposure in COGS
83% FX Exposure in Raw Materials
* Without amortization
Naturally Hedging Itself thru FX-Based Receivables
85%
8%7%
2017
69%
~38 %Of the Revenues are in foreign currency

March 2018 Investor Presentation
Volume & Capacity Development
15
* Avarage 25.000-45.000 Varies on type &configuration of the switchgears
Product
2012 2013 2014 2015 2016 2017
Dom. Exp. Dom. Exp. Dom. Exp. Dom. Exp. Cap. Util. Dom. Exp. Cap. Util. Dom. Exp. Cap. Util.
Air insulated switchgears
10.643 7.154 11.471 30.365 11.556 9.857 11.992 609 36% 13.779 1.051 42% 16.730 769 50%
Capacity* 21.600 35.000 35.000 35.000 35.000 35.000
Gas insulated switchgears
1.001 109 1.344 14 127 80 1.508 185 16% 1.943 304 21% 3.548 328 %37
Capacity* 1.350 2.750 2.750 10.500 10.500 10.500
Substation kiosks
2.539 60 2.693 31 2.494 - 2.540 46 81% 3.058 1 68% 4.183 %93
Capacity 2.400 3.000 3.200 3.200 4.500 3.200
Metal Clad Switchgears
46 107 25 193 7 202 73 150 18% 193 90 23% 91 129 %18
Capacity 400 750 750 1.250 1.250 1.250
Transformers - - - - - - 29 1% 478 385 17% 991 1.166 %43
Capacity - - - 5.000 5.000 5.000
March 2018 Investor Presentation
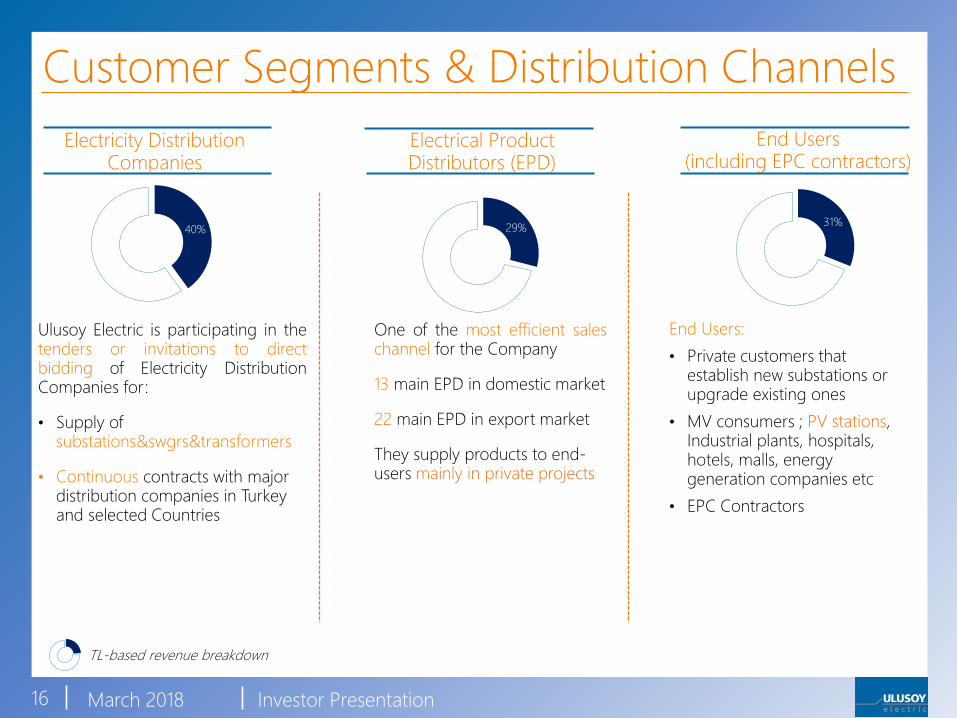
Customer Segments & Distribution Channels
Electricity Distribution Companies
End Users (including EPC contractors)
29%
One of the most efficient saleschannel for the Company
13 main EPD in domestic market
22 main EPD in export market
They supply products to end-users mainly in private projects
Electrical Product Distributors (EPD)
31%
Ulusoy Electric is participating in thetenders or invitations to directbidding of Electricity DistributionCompanies for:
• Supply of substations&swgrs&transformers
• Continuous contracts with major distribution companies in Turkey and selected Countries
40%
End Users:
• Private customers that establish new substations or upgrade existing ones
• MV consumers ; PV stations, Industrial plants, hospitals, hotels, malls, energy generation companies etc
• EPC Contractors
TL-based revenue breakdown
16

March 2018 Investor Presentation
Sector (Domestic)
17
ELECTRICITY DISTRIBUTION COMPANIES
Investment Implementation PeriodInvestmentBudget (TL)
2006-2010 (before privatization) 550 M
2011-2015 3,69 B
2016-2020 18,4 B2016 (official investment result) 3,7 B
2016 Dist.Co. Sales 2017 Dist.Co. Sales
91.9 M TL 155.3 M TL % 69
*2017 realization+ 4 Billion

March 2018 Investor Presentation
Sector (Domestic)
18
ELECTRICAL PRODUCT DISTRIBUTORS (EPD)
2016 EPD Sales 2017 EPD Sales
48.9 M TL 118.8 M TL % 143
• Positive Economic Environment• Residential & Industrial Investments• New Distributors• PV Investments

March 2018 Investor Presentation
Sector (Domestic)
19
DIRECT SALES
2016 Direct Sales 2017 Direct Sales
47.2 M TL 104,2 M TL % 121
• Photo-Voltaic & Wind Electricity Generation Projects • 500 MW Wind Project in the coming 5 years (already been awarded)• 1000MW YEKA tender (generation & turbine production)

March 2018 Investor Presentation
Sector (Domestic)
20
DOMESTIC REVENUE BREAKDOWN BY CUSTOMER SEGMENTS
52%16%
32%
2016
Dist.Co. Retailers
Direct Sales
378.3 M TL 188.0 M TL
% 101
41%
32%
27%
2017
Dist. Co. Retailers
Direct Sales

March 2018 Investor Presentation
International Market
Global Distributor Network
• 22 distributors across the globe
• Easy access to markets via local
partners (distributors)
• Sales offices in Istanbul, Algeria,
Jakarta and Dusseldorf
• 12 seasoned sales professionals dedicated to export sales and marketing
21
ASIA & MIDDLE EAST
AFRICA
IBERIA & LATAM
Russia
Kazakhstan
Palestine
Iraq
Turkmenistan
Jordan
Malaysia
Qatar
UAE
KSA
Algeria
Morocco
Tunisia
Sudan
Peru
Colombia
Uruguay
Spain
Portugal
• Diversified Export Breakdown
• Exposure to expand in Europe going forward
• Sustainable presence in 12 countries
• Indonesia PLN approval completed& USD 3,5M tender awarded
March 2018 Investor Presentation
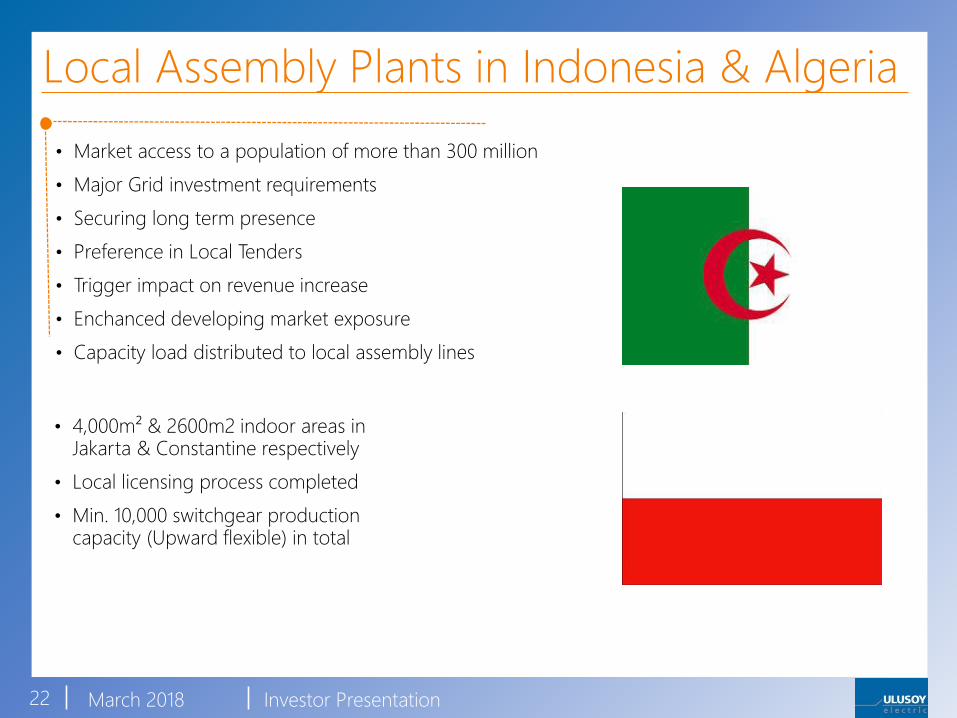
Local Assembly Plants in Indonesia & Algeria
22
• 4,000m² & 2600m2 indoor areas in Jakarta & Constantine respectively
• Local licensing process completed
• Min. 10,000 switchgear productioncapacity (Upward flexible) in total
• Market access to a population of more than 300 million
• Major Grid investment requirements
• Securing long term presence
• Preference in Local Tenders
• Trigger impact on revenue increase
• Enchanced developing market exposure
• Capacity load distributed to local assembly lines

March 2018 Investor Presentation
21%
11%
10%
10%
47%
Ethiopia SpainTunisia IndonesiaOther 29 Countries
87%
4%3%
6%
Algeria Iraq
Turkmenistan Other 26 Countries
65%
11%
5%
18%
Algeria Kirghizstan
Iraq Other 29 Countries
Country Breakdown of Exports (mn TL)2012 (40,8 mn) 2013 (148,8 mn) 2014 (70,2 mn)
2015 (22,6 mn)
23
70%
16%
5%4%
6%
Algeria JordanTurkmenistan IraqOther 16 Countries
20%
17%
9%9%
8%
5%
4%
4%
3%
3%
18%
Iraq Tunusia FinlandPalastine Uruguay AlgeriaLithuania Kazakhstan MoroccoSpain Other 23 Countries
2017 (65,0 mn)2016 (42,4 mn)
26%
9%
6%5%5%4%
4%3%
3%3%
3%
28%
Jordan Iraq Kosovo
Sudan France Albania
Azerbaijan Kazakhistan Morocco
Ethiopia Finland Other 40 Countries

March 2018 Investor Presentation
Sector (Export)
24
EXPORT REVENUES
FY 2017FY 2016
42.4 M 65.0 M%53
A significant jump in export revenues expected in 2018 due to diversified exportmarkets and localization operations.
More than TL 80M order intake as of 27.02.2018

March 2018 Investor Presentation
TOP-10 Clients
TOP-10 Clients in Total Domestic
TOP-10 Clients in Total Export
2016
51%
56%
TOP-10 Clients in Total Domestic
TOP-10 Clients in Total Export
2017
25
2016
2017
CustomerName
Domestic/Type
Amount % of
Export (TL mn) Total Sales
Customer A Domestic Elect. Dist. Comp. 36.5 8%
Customer B Domestic Elect. Dist. Comp. 30.1 7%
Customer C Domestic Distributor 28,9 7%
Customer D Domestic Distributor 22.5 5%
Customer E Domestic Elect. Dist. Comp 17.6 4%
Customer F Export Elect. Dist. Comp. 12.9 3%
Customer G Domestic Distributor 12.1 3%
Customer H Domestic Elect. Dist. Comp. 11.8 3%
Customer I Domestic Elect. Dist. Comp. 11.6 3%
Customer J Domestic Distributor 10.4 2.5%
Total: 194.7 44%
CustomerName
Domestic/Type
Amount % of
Export(TL mn)
Total Sales
Customer A Domestic Elect. Distrib. Comp. 20.1 9%
Customer B Domestic Elect. Distrib. Comp. 16.6 7%
Customer C Domestic Elect. Distrib. Comp. 15.2 6%
Customer D Domestic Distributor 14.9 6%
Customer E Domestic Elect. Distrib. Comp. 11.0 5%
Customer F Domestic Elect. Distrib. Comp. 8.9 4%
Customer G Export Distributor 8.4 4%
Customer H Domestic Distributor 8.2 4%
Customer I Export Elect. Distrib. Comp. 7.4 3%
Customer J Domestic End User 6.4 3%
Total: 117.1 50%
49% 70%

March 2018 Investor Presentation
Competitive-Edge in Production
Efficienct Production
Capable to Compete with Global Players
26
Newly Completed Transformer Facility enables to be one-step ahead of competitiors
via vertical integration
│Switchgear│ │Transformer│ │Substation Kiosk│
Natural Entry Barrierto the sector
market players need to hold & make
│Know-How│ │Licensing│ │Type Test│
In-House Flexible Quality-Oriented Vertically-Integrated
Faster responses & aftersales support
Economies of Scale Attractive Prices

March 2018 Investor Presentation
Local & Int’l Competition
27
ABB,SIEMENS,SCHNEIDER, GE
LUCY (UK),ORMAZABAL(SPAIN),
EFACEC (PORTUGAL)
ULUSOY, ELIMSAN, SAREL, TAMCO, DREISCHER, SEL, ZPUE
BIG FOUR
GLOBAL MULTINATIONALS
+ BILLION EURO/USD
TURNOVER
FOLLOWERS
BECOMING
MULTINATIONAL
300-500M EURO TURNOVER
REGIONAL LEADERS
50-100M EURO TURNOVER

Growth &
Strategy

March 2018 Investor Presentation
Growth Prospects & Strategy
Sustainable & Diversified Revenue Stream
with
Double Digit Growth in Local and Other Developing Markets
Solid and Sustainable Growth in Domestic Market
Dominant market leader positionin a booming market benefiting
from higher margins andsustained revenue stream
New Transformer FacilityNewly-Completed Huge
Transformer Facility Enabiling the Vertical Integration &
Higher Market Share
29
Inorganic GrowthOpportunities
Strategically keeping eyesopen for interesting merger
opportunities potentially for a new product range, increasingthe market share and/or cost
minimization
Vast Opportunities around the Globe
Improved brand awarness, enhanceddistributor network and recently
completed long lasting certificationprocesses has opened door forsustainable & diversified export
revenues

March 2018 Investor Presentation
Global Electricity TrendsPV industry & Electric Vehicles
30
• From today until 2040, USD 11.4tn will be invested in powergeneration. Of that USD 7.8tn will be invested in renewable energy.At least half of this amount is for Solar.
• The World’sCumulative installed PV capacity of 302 GW will reachto 740 GW by 2022 and 5600 GW by 2050
• EV market grew 60% in 2016, Plug in automobiles may reach 30%market penetration by 2030
• the world will need 600 million electric vehicles by 2040, comparedto existing 2,5 million as of 2017.
• We need more Charging Stations, more Grid substations
*Source: International Energy Agency www.iea.org

Financials

March 2018 Investor Presentation
Revenues
Total Revenue in TLmn
2013
32
260
177
144
228
437
2014 2015 2016 2017

March 2018 Investor Presentation
Revenue Development
33
234,2
442,2
+77
+131
0,0
100,0
200,0
300,0
400,0
500,0
600,0
700,0
2016 Revenues Volume change Price change 2017 Revenues
TLm
n

March 2018 Investor Presentation
Revenue BreakdownBreakdown by Product Type (TLmn)
Breakdown by Destination (TLmn)
34
15 16 17 27500,5
13
46
10 11 910
15192
11878
110
22510
13
19
30
44
34
20
21
38
57
2013 2014 2015 2016 2017
Substation kiosks Transformers Metal Clad Air insulated switchgers Gas insulated switchgers Other
112 108 120 188378149 70 23
42
65
0
500
2013 2014 2015 2016 2017
Domestic Export
March 2018 Investor Presentation
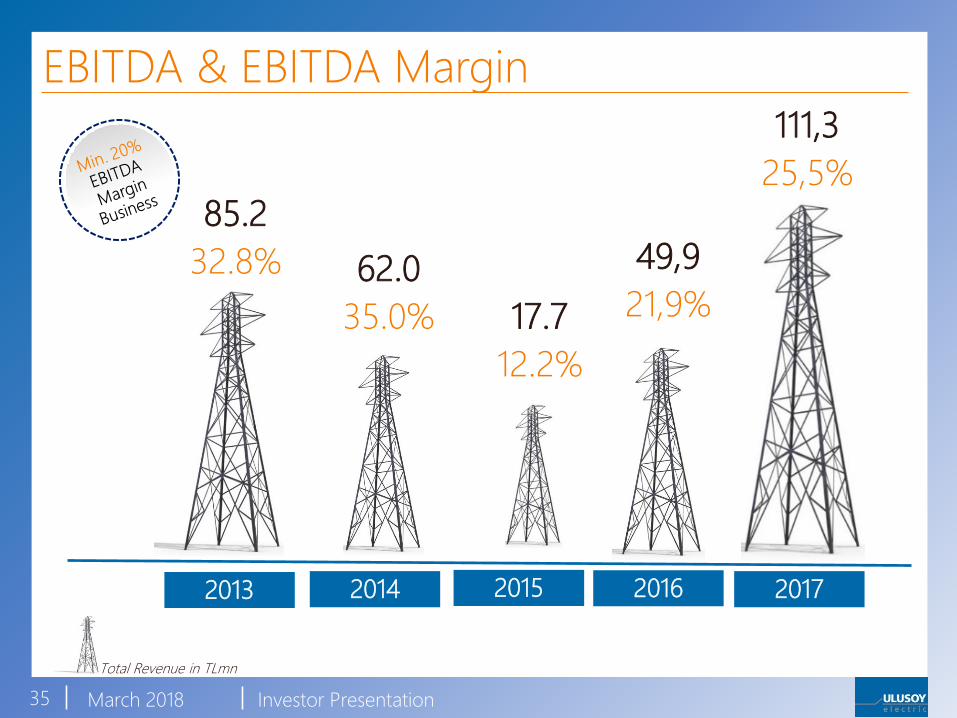
EBITDA & EBITDA Margin
Total Revenue in TLmn
2013
35
85.2
32.8% 62.0
35.0% 17.7
12.2%
49,9
21,9%
111,3
25,5%
2014 2015 2016 2017

March 2018 Investor Presentation
Capital Expenditures Pattern of Progress
36
4.1 3.9
16.6
12.6
17.0
2011 2012 2013 2014 2015
Capex for Maintenance
~TL1mn per annum
5,2
6,2
2016 2017
Heavy investment period for the new transformer facility is
already completed

March 2018 Investor Presentation
Summary of Financial Statements
37
TL mn 2013 2014 2015 2016 2017Revenues 260,0 177,2 144,5 227,8 436,5Domestic 112,5 108,1 120,6 188,0 378,3Export 148,8 70,2 22,6 42,4 65,0Gross Profit 95,5 73,4 29,5 63,1 128,6EBITDA 85,2 62,0 17,7 49,9 111,3Net Income 71,7 45,2 13,6 35,9 87,1
Gross Profit Margin 36,7% 41,4% 20,4% 27,7% 29,5%EBITDA Margin 32,8% 35,0% 12,2% 21,9% 25,5%Net Margin 27,6% 25,5% 9,4% 15,8% 19,9%
Current Assets 114,0 107,4 79,8 117,8 211,6Cash&Cash Equivalents 45,8 17,7 14,0 13,8 30,3Non-Current Assets 25,8 37,6 71,2 72,2 73,0Property,Plant and Equipment 23,4 32,9 66,6 67,7 68,3Total Assets 156,3 145,6 151,0 190,0 284,6Total Liabilities 38,5 28,3 44,2 55,1 80,7S.T.Liabilities 36,0 27,2 42,5 52,6 78,1L.T. Liabilities 2,5 1,1 1,7 2,5 2,6Equity 117,8 116,8 106,8 134,9 203,9ROE 61,1% 38,9% 12,8% 26,6% 42,7%
Depreciation&Amortization 1,6 1,9 3,1 4,6 5,2Net Debt Position -45,2 -17,2 -7,2 -6,2 -25,7CAPEX 16,6 12,6 17,0 5,2 6,3
March 2018 Investor Presentation
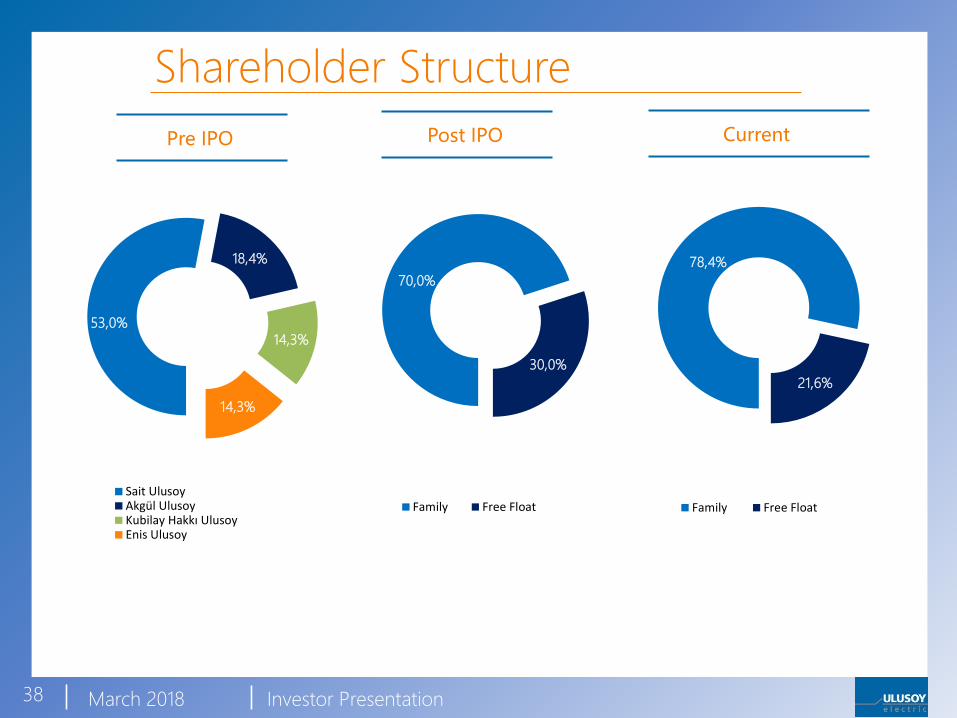
Shareholder Structure
Pre IPO Post IPO Current
38
70,0%
30,0%
Family Free Float
78,4%
21,6%
Family Free Float
53,0%
18,4%
14,3%
14,3%
Sait UlusoyAkgül UlusoyKubilay Hakkı UlusoyEnis Ulusoy
Thank YouFor further information please e-mail
or call Ulusoy Electric Investor Relations
at (+90 312 267 0712)