Investor Presentation November 2012 0 - SK · PDF file2. 4G LTE LTE competitiveness Launched...
15
November 2012 Investor Presentation 0
Transcript of Investor Presentation November 2012 0 - SK · PDF file2. 4G LTE LTE competitiveness Launched...

November 2012
InvestorPresentation
0

2
Disclaimer
This presentation has been prepared by SK Telecom Co., Ltd. (“the Company”). This presentation is being
presented solely for your information and is subject to change without notice. No representation or warranty,
expressed or implied, is made and no reliance should be placed on the accuracy, fairness or completeness of the
information presented. The Company, its affiliates, advisers or representatives accept no liability whatsoever for
any losses arising from any information contained in the presentation.
This presentation does not constitute an offer or invitation to purchase or subscribe for any shares of the
Company, and no part of this presentation shall form the basis of or be relied upon in connection with any contract
or commitment.
The contents of this presentation may not be reproduced, redistributed or passed on, directly or indirectly, to any
other person or published, in whole or in part, for any purpose.
3
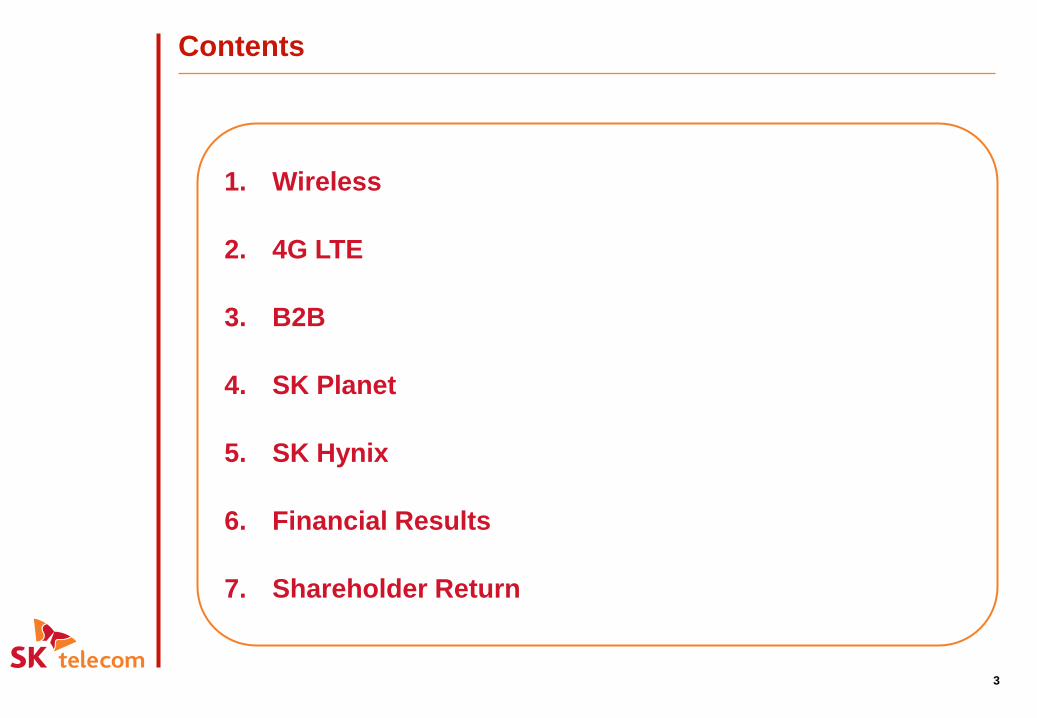
Contents
1. Wireless
2. 4G LTE
3. B2B
4. SK Planet
5. SK Hynix
6. Financial Results
7. Shareholder Return

Percentage of LTE
Wireless market trend
Total subscribers Penetration
(Unit: Mn, %)
Smartphone subscribers
90%94%
98%
104%106% 106%105% 107%
2007 2008 2009 2010 2Q11 4Q11 2Q12 3Q12
4446
4850
52 53 53
Source: Company & KCC data as of September 30, 2012
1
7
15
23
28
53
31
2%
13%
22%
4
Wireless market overview 1. Wireless
Smartphone population continues to grow inline with demand for LTE services
Market structure remains intact despite disruptive competitive dynamics
10%
15%
20%
25%
30%
35%
40%
45%
50%
55%
Wireless market share trend
(Unit: %)
Mar.07: KT first to
complete nationwide
HSDPA rollout
Nov.09: KT first to
release iPhone
Mar.12: LGU+ first to
complete nationwide LTE
network rollout
SKT
50.3
KT
30.9
LGU+
18.8
‘09 ‘10 3Q12 ‘08 ‘11 ‘07 ‘06
5
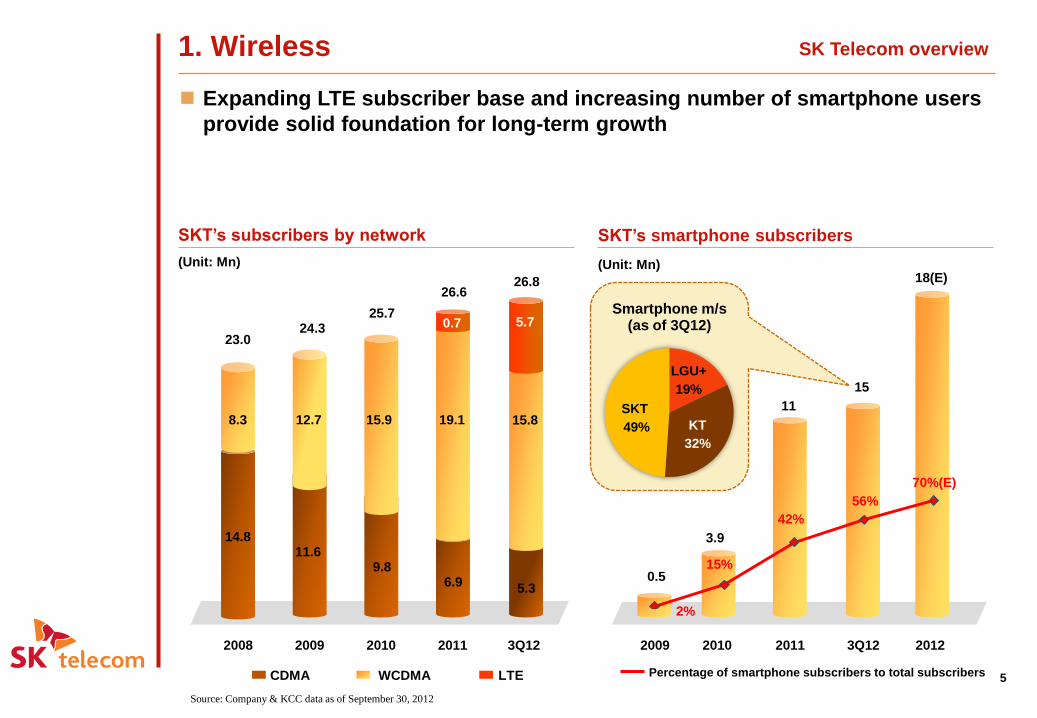
SK Telecom overview1. Wireless
SKT’s subscribers by network
LTEWCDMACDMA
(Unit: Mn)
3Q122009 2010
23.024.3
25.7
26.6
20112008
8.3 12.7 15.9 19.1
14.811.6
9.86.9
0.7
26.8
15.8
5.3
5.7
Expanding LTE subscriber base and increasing number of smartphone users
provide solid foundation for long-term growth
2010
11
0.5
3.9
18(E)
Percentage of smartphone subscribers to total subscribers
SKT’s smartphone subscribers
2011 20122009
15%
42%
2%
(Unit: Mn)
15
3Q12
56%
70%(E)
Smartphone m/s(as of 3Q12)
SKT
49% KT
32%
LGU+
19%
Source: Company & KCC data as of September 30, 2012
6
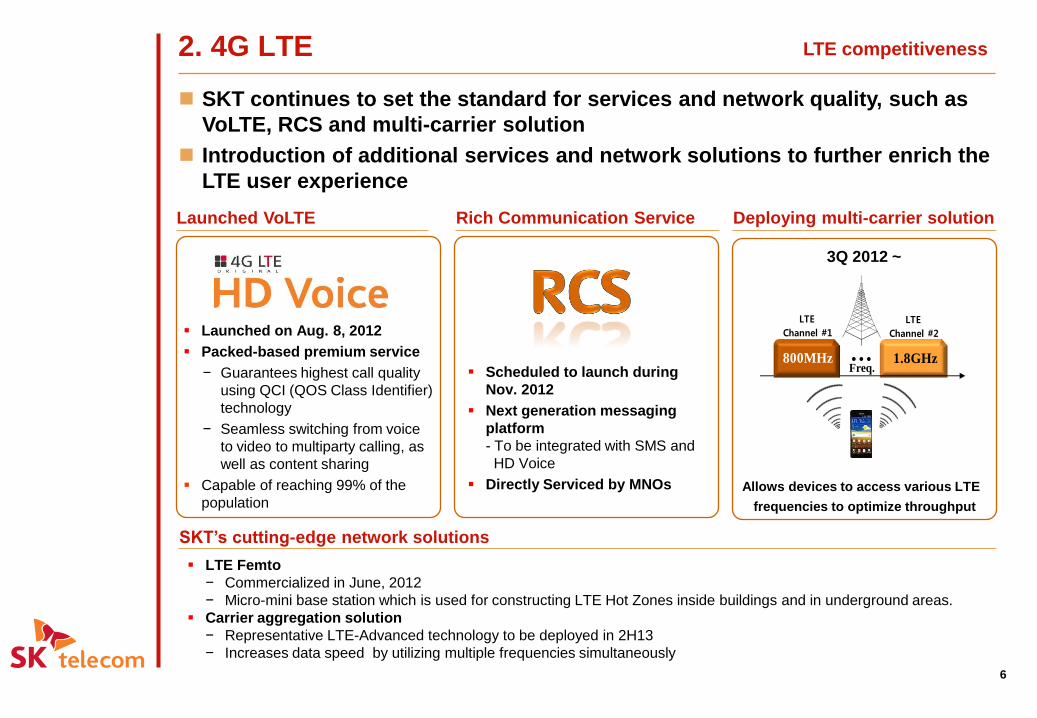
LTE competitiveness2. 4G LTE
Launched VoLTE
SKT continues to set the standard for services and network quality, such as
VoLTE, RCS and multi-carrier solution
Introduction of additional services and network solutions to further enrich the
LTE user experience
Launched on Aug. 8, 2012
Packed-based premium service
− Guarantees highest call quality
using QCI (QOS Class Identifier)
technology
− Seamless switching from voice
to video to multiparty calling, as
well as content sharing
Capable of reaching 99% of the
population
3Q 2012 ~
Deploying multi-carrier solution
Freq.…800MHz 1.8GHz
LTE
Channel #1
LTE
Channel #2
Allows devices to access various LTE
frequencies to optimize throughput
LTE Femto
− Commercialized in June, 2012
− Micro-mini base station which is used for constructing LTE Hot Zones inside buildings and in underground areas.
Carrier aggregation solution
− Representative LTE-Advanced technology to be deployed in 2H13
− Increases data speed by utilizing multiple frequencies simultaneously
SKT’s cutting-edge network solutions
Rich Communication Service
Scheduled to launch during
Nov. 2012
Next generation messaging
platform
- To be integrated with SMS and
HD Voice
Directly Serviced by MNOs

7
LTE subscribers2. 4G LTE
2011 2012 2013 2014
54% CAGR
(2012~2014)
13.5(E)
0.6
7(E)
16.7(E)
2011 1Q12 2Q12 3Q12
630
1,140
LTE subscriber targetsLTE subscriber additions
LTE subscriber growth continues to gain momentum
Targeting at 7mn subscribers by year-end; surpassed 6 mn subscribers in
October
1,570
3%
26%
50%
62%
■
■
■
Percentage of LTE subscribers
(Unit: Mn)(Unit: ‘000)
■
2,330

8
LTE price plan and ARPU2. 4G LTE
Popular tariff plan
Price
(KRW)
Revenue
discount
(KRW)
Net
ARPU
(KRW)
% of
new
subs
≥ LTE-62 62,000 16,000 46,000over
80%
≥ 3G-54 54,000 17,500 36,500over
70%
Diff. +8,000 -1,500 +9,500 -
Popular LTE price plans provide ARPU uplift effect; currently over 80% of new
LTE subscribers on LTE-62 or higher price plans
LTE ARPU is significantly higher than smartphone and blended ARPU
Additional charge of up to KRW 18,000 for incremental
3GB LTE data consumption in excess of allotment
ARPU comparison
(Unit: KRW ‘000)
LTE Smartphones
(3G + LTE)
52.0
41.5
25%
higher
Blended ARPU
33.1
57%
higher
as of 3Q12

9
profitability improvement2. 4G LTE
2Q11 3Q11 4Q11 1Q12 2Q12 3Q12
33.2
32.6
33.6
Note: Includes SK Planet revenues
32.2
2013
Blended ARPU
(Unit: KRW ‘000)
Ta
riff cu
t
LT
E u
plift
ARPU to continue its upward trajectory; expect 4Q12 ARPU to show healthy
growth
Market competition cooling initiatives to have positive profit impact
33.1
Rational market competition
− Subsidies for new and renewing
subscribers reduced by 70-100K Won
in 2Q12
− Penalties for premature contract
termination on Nov. 1, 2012
; terminating subscribers subject to a fee
for discount benefits received
Cost control initiatives
32.9
10
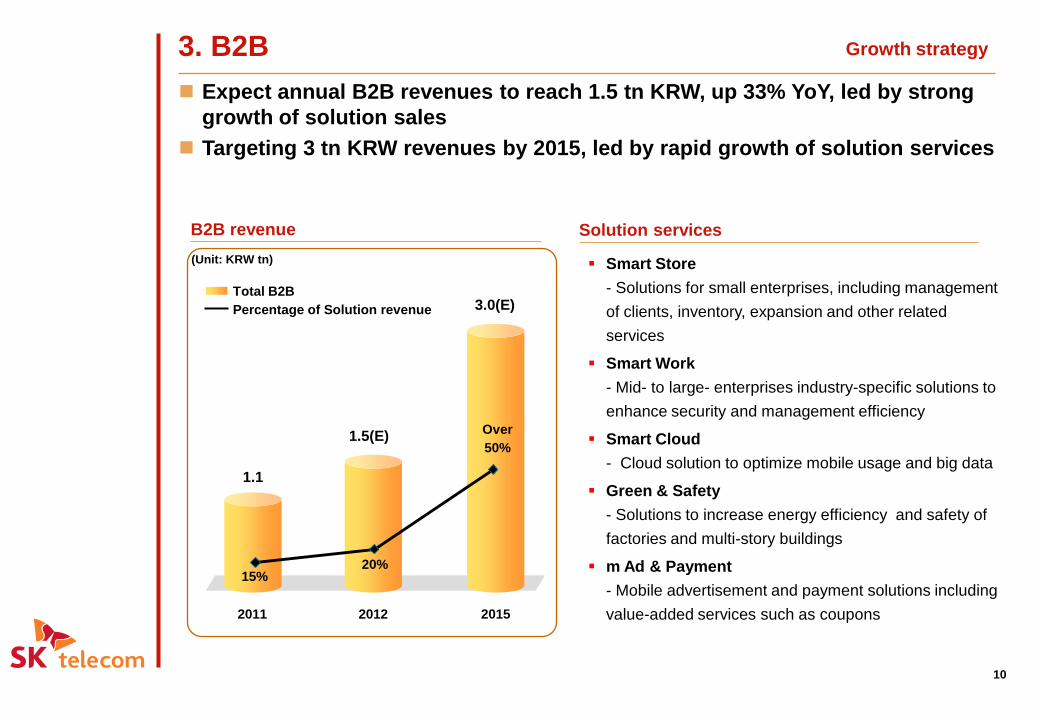
Growth strategy3. B2B
Solution servicesB2B revenue
1.1
(Unit: KRW tn)
1.5(E)
3.0(E)
2011 2012 2015
Percentage of Solution revenue
Total B2B
15%20%
Over
50%
Expect annual B2B revenues to reach 1.5 tn KRW, up 33% YoY, led by strong
growth of solution sales
Targeting 3 tn KRW revenues by 2015, led by rapid growth of solution services
Smart Store
- Solutions for small enterprises, including management
of clients, inventory, expansion and other related
services
Smart Work
- Mid- to large- enterprises industry-specific solutions to
enhance security and management efficiency
Smart Cloud
- Cloud solution to optimize mobile usage and big data
Green & Safety
- Solutions to increase energy efficiency and safety of
factories and multi-story buildings
m Ad & Payment
- Mobile advertisement and payment solutions including
value-added services such as coupons

Financial results4. SK Planet
11
SK Planet’s financial results
(Unit: KRW Bn)
11st revenue
261
174
(Unit: KRW Bn) 330(E)
7561
2010 2011 2012
SK Planet continues to show strong growth led by 11st, T store and T map
7661
243
1Q12
6
250
3Q12
18
Revenue
Operating income
Annual
2Q12
267
30
7975
3Q
(Unit: Mn)
2011 2Q12 2012
T map active users
T store active users
1Q12
(Unit: Mn)
3Q12
2111 2Q12 20121Q12 3Q12
6.6
8.5(E)
5.86.3
7.6
4.8
4.0
6.2(E)
4.3
5.8
1Q
2Q

12
5. SK Hynix Impact on SKT’s results
Recent results
SKT recorded KRW 8.4bn in SK Hynix-related
equity accounting gain in 3Q12
Market consensus forecast
10.2
(Unit: KRW Tn)
2012
3.2
-0.2
12.0
2013
5.0
1.2
Revenue EBITDA Net income
Source: Thomson One, as of November 5, 2012
SK Hynix’s performance is expected to show gradual improvement as firmer DRAM and NAND demand through the release of Windows 8 and new products of smartphone and tablet PC
13.3
2014
5.7
1.7
Unit: KRW Bn 2010 2011 3Q12 YoY QoQ
Revenue 12,106 10,396 2,423 6% -8%
EBITDA 6,069 3,746 776 +26% -2%
Oper. profits 2,975 325 -15 N/A N/A
Net income 2,598 -56 2 N/A N/A
Debt 6,041 6,776 6,720 -343 Bn 92 Bn
Net debt 3,839 4,900 4,930 -138 Bn 1,292 Bn
Debt/Equity 76% 85% 69% -16%p +2%p
Net debt/Equity 48% 61% 50% -11%p +13%p

6. Financial Results (K-IFRS)
13
Operating Income
EBITDA
Net Income
3Q12
4,126
301
960
176
3Q11(Unit: KRW Bn)
YoY
-46.4%
-21.1%
-54.2%
2.0%4,045
561
1,216
384
2Q12 QoQ
-27.6%
-7.7%
45.7%
2.9%Revenues
Consolidated
Net Debt/Equity 47.3% 22.5%pt24.8% -0.6%pt
SKT CapEx
(Non-consolidated) 788 42.7%552 28.0%
4,008
416
1,040
121
47.9%
616

7. Shareholder Return
Total shareholder returns
(Units: KRW Bn)
Cash dividend Share buyback*
Maintain strong shareholder return policy
Paid annual cash dividend of KRW
9,400/share since 2007
- Includes interim dividend of KRW 1,000/share
Commenced share buybacks in 4 out of
past 5 years
- KRW 208bn in 2011
Strong shareholder return policy
14
* The total number of treasury stocks stood at 11,050,712 shares(13.69% of total stock issued) as of 3Q12
680
2009 2010
880 864
2011
210 208
774
2008
92
801
2007
119
15
Website: http://www.sktelecom.com → Investor relations